Abstract
Investigating the structure of the older adult brain at high spatial resolution is of high significance, and a dedicated older adult structural brain template with sub-millimeter resolution is currently lacking. Therefore, the purpose of this work was twofold: (A) to develop a 0.5mm isotropic resolution standardized T1-weighted template of the older adult brain by applying principles of super resolution to high quality MRI data from 222 older adults (65–95 years of age), and (B) to systematically compare the new template to other standardized and study-specific templates in terms of image quality and performance when used as a reference for alignment of older adult data. The new template exhibited higher spatial resolution and improved visualization of fine structural details of the older adult brain compared to a template constructed using a conventional template building approach and the same data. In addition, the new template exhibited higher image sharpness and did not contain image artifacts observed in some of the other templates considered in this work. Due to the above enhancements, the new template provided higher inter-subject spatial normalization precision for older adult data compared to the other templates, and consequently enabled detection of smaller inter-group morphometric differences in older adult data. Finally, the new template was among those that were most representative of older adult brain data. Overall, the new template constructed here is an important resource for studies of aging, and the findings of the present work have important implications in template selection for investigations on older adults.
Keywords: High resolution, T1-weighted, Template, Atlas, Brain, Aging
1. Introduction
Human brain T1-weighted (T1w) templates provide a standard reference for brain MRI investigations. Template-based studies in older adults require templates that are representative of the features of the aging brain (Dickie et al., 2016a, 2016b; Lemaître et al., 2005; Matsumae et al., 1996; Sullivan et al., 1995; Ridwan et al., 2021) and use of templates constructed from younger or middle-aged adult data can negatively impact the accuracy of investigations in older adults (Ridwan et al., 2021; Van Hecke et al., 2011; Zhang and Arfanakis, 2018). To date, the publicly available library of standardized T1w brain templates includes only few that were constructed exclusively from older adult data, and several that combined data from young adults, middle-aged individuals and older adults (Ridwan et al., 2021). The dedicated older adult templates as well as most other templates have a voxel size of 1×1×1mm3 or larger. The introduction of advanced image reconstruction techniques (Jia et al., 2016; Jafari-Khouzani, 2014; Manjón et al., 2010a, 2010b; Zhang et al., 2009), AI-based resolution enhancements (Chen et al., 2018; Pham et al., 2019; Sánchez and Vilaplana, 2018; Zeng et al., 2018), and advances in neuroimaging software (Manjón et al., 2020; Park et al., 2014; Sone et al., 2016) and MRI hardware have sparked an interest in studying the older adult brain at submillimeter resolution (Bookheimer et al., 2019; de Flores et al., 2015; Yushkevich et al., 2015; ADNI3 http://adni.loni.usc.edu). Use of the currently available lower resolution dedicated older adult T1w brain templates limits the accuracy of template-based processing steps (Zhao et al., 2016), reducing the sensitivity to small effects and losing important information in small structures. There is therefore a clear need for a high resolution T1w template of the older adult brain. However, collecting high resolution T1w data from a large number of older adults in order to construct such a template is still complicated due to long scan times, motion artifacts, and/or low signal to noise ratio.
Super resolution algorithms are a set of methods used to enhance the spatial resolution of an image, either from multiple low resolution images of the same object with slightly different perspectives (Farsiu et al., 2004; Kim et al., 2015; Yuan et al., 2010), or from a single low resolution image (Bevilacqua et al., 2012; Glasner et al., 2009; Ledig et al., 2016; Lim et al., 2017; Rueda et al., 2013). In neuroimaging, multiple image super resolution overcomes some of the aforementioned limitations associated with acquiring MRI data in older adults at high spatial resolution (Plenge et al., 2012; Scherrer et al.,2012; Gholipour et al., 2010; Greenspan et al., 2002; He et al., 2007; Li et al., 2019; Rousseau et al., 2006; Shilling et al., 2009; Sui et al., 2019). The concept of multiple image super resolution can also be adapted for the construction of a high resolution population-based brain MRI template from low resolution images on individual subjects, assuming careful alignment of individuals to a common space and considering every co-registered image as a different realization of the template brain. A similar approach was successfully used in the development of a high angular (not spatial) resolution diffusion imaging (HARDI) brain template from low angular resolution diffusion data on individual subjects (i.e. super resolution in angular sampling) (Varentsova et al., 2014). This approach therefore holds promise for the development of a high spatial resolution T1w template of the older adult brain from lower spatial resolution data on individual subjects, and avoids the limitations associated with collecting high resolution data on a large number of older adults.
The purpose of this work was twofold: (A) to develop a high resolution standardized T1w template of the older adult brain using principles of super resolution as part of an ongoing project to develop a comprehensive older adult brain atlas named Multichannel Illinois Institute of Technology & Rush university Aging (MIITRA) atlas, and (B) to systematically compare the new template to other standardized and study-specific templates in terms of image quality and performance when used as a reference for alignment of older adult data. First, T1w data with isotropic 1mm voxels were collected on a large number of well-characterized non-demented older adults (65–95 years of age). Next, the 0.5mm resolution MIITRA T1w template was generated by applying principles of super resolution to the available data. The image quality of the new template was compared to that of other standardized and study-specific templates in terms of the ability to resolve small brain structures, image sharpness, and presence of artifacts. The performance of the new template when used as a reference for alignment of older adult data was evaluated in terms of the inter-subject spatial normalization precision, ability to detect small inter-group morphometric differences, and representativeness of the older adult brain.
2. Materials and methods
2.1. Data
Two older adult brain MRI datasets were used in this work. Dataset 1 was used for constructing the new high resolution T1w template. Dataset 1 consisted of T1w brain MRI data collected on 222 community-based non-demented older adults (65–95 age-range, mean ± sd age=80.1±8.3 years, 50% female) participating in the Rush Memory and Aging Project (Bennett et al., 2018). All participants signed an informed consent according to procedures approved by the institutional review board of Rush University Medical Center. T1w data were collected on a 3 Tesla (T) Siemens scanner for 171 participants and on a 3 T Philips scanner for 51 participants using a 3D magnetization prepared rapid acquisition gradient echo (MPRAGE) sequence with the following parameters: 3 T Siemens scanner: TR=2300 ms, TE=2.98 ms, TI=900 ms, flip-angle=9°, field of view=256 mm x 256 mm, 176 slices, acquired voxel size=1×1×1 mm3, and an acceleration factor of 2; 3 T Philips scanner: TR=8 ms, TE=3.7 ms, TI=955 ms, flip-angle=8°, field of view=240 mm x 228 mm, 181 slices, acquired voxel size=1×1×1 mm3, and an acceleration factor of 2.
Dataset 2 was used first to construct a study-specific template and then to evaluate the performance of the different templates considered in this work. Dataset 2 consisted of T1w brain MRI data collected on 222 non-demented older adults (65-95 age-range, mean ± sd age=80.1±5.7 years, 50% female) participating in the Alzheimer’s Disease Neuroimaging Initiative 3 (ADNI3) (http://adni.loni.usc.edu). ADNI was launched in 2003 as a public-private partnership, led by Dr. Michael W. Weiner to investigate whether serial MRI, positron emission tomography (PET), other biological markers, and clinical and neuropsychological assessment can be combined to measure the progression of mild cognitive impairment and early Alzheimer’s disease. T1w data were collected on a 3 T Siemens scanner for 163 individuals and on a 3 T Philips scanner for 59 individuals using 3D MPRAGE sequences with the following parameters: 3 T Siemens scanner: TR = 2,300 ms, TE = 2.98 ms, TI = 900 ms, flip-angle = 9°, field of view = 256 mm × 240 mm, 208 slices, acquired voxel size=1×1×1 mm3, and an acceleration factor of 2; 3 T Philips scanner: TR = 6.5 ms, TE = 2.9 ms, TI = 900 ms, flip-angle = 9°, field of view = 256 mm x 256 mm, 211 slices, acquired voxel size = 1 × 1 × 1 mm3, and an acceleration factor of 2.
2.2. Preprocessing
All raw T1w images were skull-stripped (MASS) (Doshi et al., 2013; Heckemann et al., 2015), segmented into gray matter (GM), white matter (WM), and cerebrospinal fluid (CSF) (CAT) (Farokhian et al., 2017), and corrected for bias field inhomogeneity using the tissue probability maps generated by CAT as priors (N4) (Tustison et al., 2010). The resulting images were visually inspected. Image intensities were converted to z-scores using the mean and standard deviation of intensities in the combined GM and WM masks. For Dataset 2, the gray matter was also segmented into Desikan-Killiany regions using FreeSurfer (Fischl, 2012; McCarthy et al., 2015) without manual corrections.
2.3. Template construction
The approach used in this work for high resolution template construction combined a widely used iterative image registration process (Fonov et al., 2011; Guimond et al., 2000; Joshi et al., 2004; Ridwan et al., 2021) and concepts of multiple image super resolution. The entire process can be divided into 6 steps. Steps 1-3 generally followed the method described in Ridwan et al. with modifications (Ridwan et al., 2021), and steps 4-6 included the super resolution portion of template construction.
2.3.1. Step 1: Rigid registration and construction of an initial template
The preprocessed images from Dataset 1 were rigidly registered to the previously constructed T1w template of the MIITRA atlas (Ridwan et al., 2021) referred to as MIITRA_1mm in this work (Fig. 1) (the MIITRA_1mm template space was up-sampled to 0.5×0.5×0.5mm3 voxels using linear interpolation prior to performing the rigid registrations). Rigid registration used mutual information as the cost function and linear resampling (Appendix 1). An initial template with 0.5×0.5×0.5mm3 voxel-size was generated by using weighted averaging on the rigidly registered images:
where Zk was the average signal in voxel k of the initial template, Xki was the ith signal in voxel k, ωki was the weight applied to Xki, and N was the total number of signals in voxel k. The weight ωki was determined using a Gaussian kernel centered at the median signal in voxel k:
where was the median signal in voxel k, and ωk was given by:
Fig. 1.
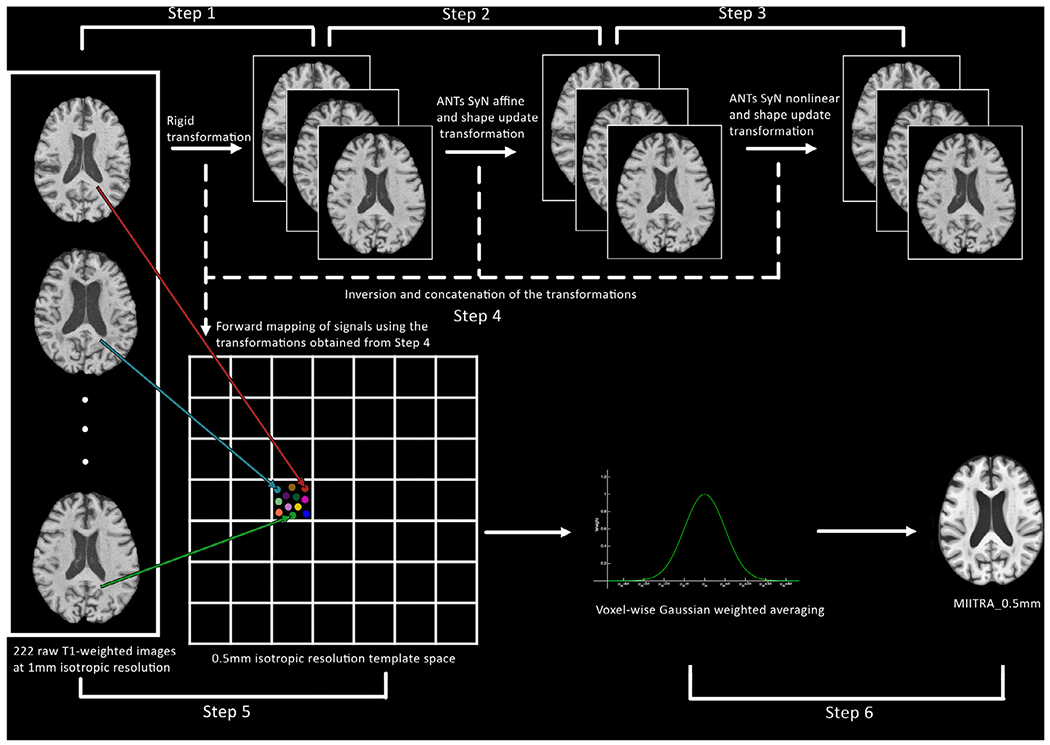
Schematic representation of the approach used to construct the MIITRA_0.5mm T1-weighted brain template.
The above weighted averaging technique is based on the widely used kappa-sigma clipping average method (Jörsäter, 2008; Lalys et al., 2010) and is less sensitive to the effects of outliers due to residual misregistration.
2.3.2. Step 2: Iterative affine registration and construction of a new initial template
The rigidly co-registered and linearly resampled images were affinely registered to the initial template using ANTs (Avants et al., 2008, 2009, 2010, 2011) SyN affine registration (Fig. 1). Both cross-correlation and mutual information were separately used as cost functions (Appendix 1). A shape update transformation (Avants, and Gee, 2004) was also generated from all resulting affine transformations (shape update was conducted using the built-in algorithm of the ANTs tool buildtemplateparallel.sh). The rigid, affine and shape update transformations were concatenated for each participant and were used to transform the raw T1w images of Dataset 1 (after the basic pre-processing of Section 2.2) to a common minimum deformation space with 0.5×0.5×0.5mm3 voxel-size (using linear resampling). The Gaussian weighted averaging approach of Step 1 was applied to the warped images to generate a new initial template. Using this new initial template as reference, Step 2 was repeated iteratively until the Pearson cross correlation (PCC) between two templates of consecutive iterations was greater than 0.9995 (Ridwan et al., 2021). Convergence was reached after 9 iterations.
2.3.3. Step 3: Iterative nonlinear registration
The affinely co-registered images (obtained by applying the combination of the rigid transformation from Step 1 and the affine and shape update transformation from the final iteration of Step 2 on the preprocessed images of Section 2.2 with linear resampling) were nonlinearly registered using ANTs SyN to the template generated in the final iteration of Step 2, and weighted averaging was used (as in Steps 1 and 2) to generate a new initial template (Fig. 1). Both cross-correlation and mutual information were separately used as cost functions in this step (Appendix 1). This initial template was then used as reference and Step 3 was repeated iteratively until PCC>0.9995 between templates of consecutive iterations. Convergence was reached after 7 iterations.
2.3.4. Step 4: Inversion and concatenation of the transformations
The rigid transformation from Step 1, the affine and shape update transformations from the final iteration of Step 2, and the affine, nonlinear and shape update transformations from the final iteration of Step 3 were inverted and concatenated into a single transformation for each participant (Fig. 1). The shape update transformations do not have an analytic inverse, but approximate inverted transformations were generated using the command InvertTransformation included in DRTAMAS (Irfanoglu et al., 2016) and were empirically found to be suitable.
2.3.5. Step 5: Mapping signals from raw image space to template space
The transformations obtained in Step 4 were used to map the signals from the raw images (after the basic preprocessing of Section 2.2) to exact physical locations in template space with sub-voxel accuracy (Fig. 1). This process generated a point cloud of signals inside each voxel in template space. No interpolation was used. This approach is in essence the application of the concept of multiple image super resolution on the participants of Dataset 1 as if they were multiple realizations of the same brain.
2.3.6. Step 6: Voxel-wise weighted averaging
The final signal in each 0.5×0.5×0.5mm3 voxel in template space was calculated by applying Gaussian weighted averaging (as in Step 1) on the signals mapped to that voxel. The resulting template is referred to as MIITRA_0.5mm in the rest of this work (Fig. 2) and is available for download at www.nitrc.org/projects/miitra. To add skull and other head structures to this brain-only template, the strategy by Rohlfing et al was employed (Ridwan et al., 2021; Rohlfing et al., 2012). The brain-only template was considered in the rest of this work.
Fig. 2.
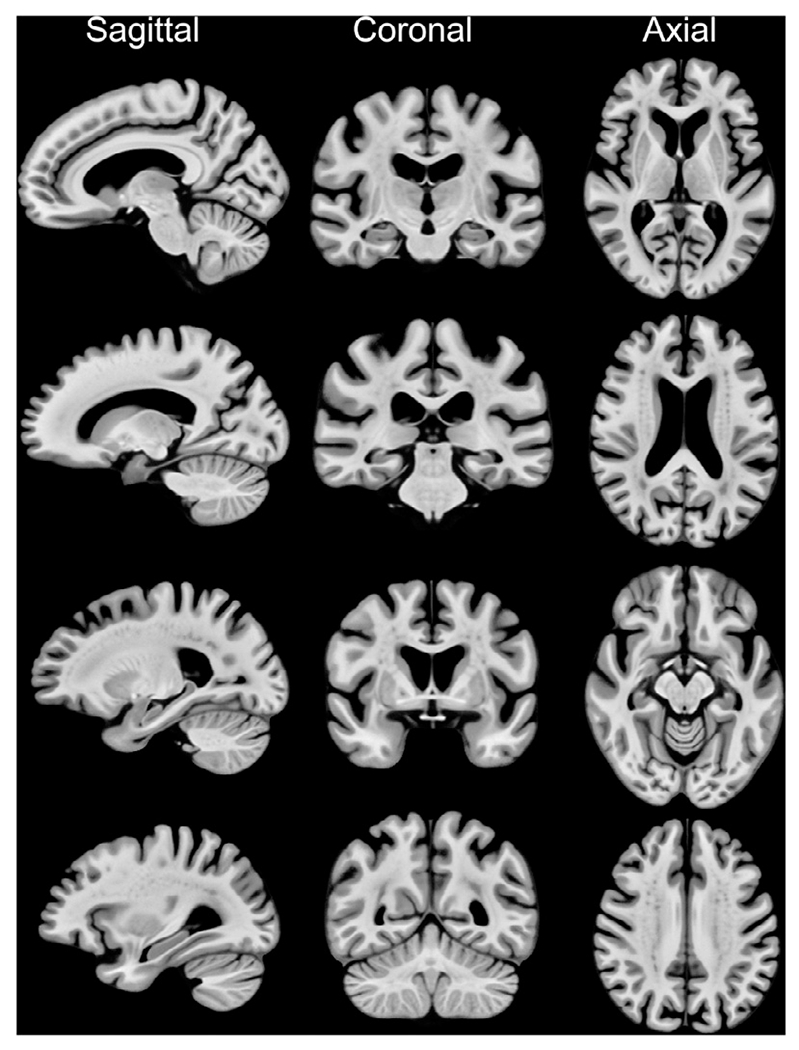
Examples of sagittal, coronal and axial slices of the MIITRA_0.5mm. The sagittal slices are from the right hemisphere.
2.4. Comparison of MIITRA_0.5mm to other standardized and study-specific templates
The MIITRA_0.5mm template was compared to other standardized and study-specific templates with different voxel-sizes: three standardized templates with 0.5mm isotropic voxels, namely (a) MCALT (Schwarz et al., 2017), (b) ICBM2009b (Fonov et al., 2009, 2011), and (c) Colin27 (Aubert-Broche et al., 2006; Holmes et al., 1998), (d) a study specific (SS) template with 0.5×0.5×0.5mm3 voxel-size constructed by applying Steps 1 through 3 (Sections 2.3.1–2.3.3) to Dataset 2, (e) HCP-1200 with 0.7mm isotropic voxels (Glasser et al., 2013), five templates with 1mm isotropic voxels, namely (f) MIITRA_1mm (Ridwan et al., 2021), (g) ICBM2009c (Fonov et al., 2009, 2011), (h) OASIS (Avants and Tustison, 2018), (i) SRI24 (Rohlfing et al., 2010), (j) UNC-Adult (https://www.nitrc.org/projects/unc_brain_atlas/), and (k) IXI-ANTs with 1.2×0.9375×0.9375mm3 voxel-size (Avants and Tustison, 2018). A summary of the characteristics of all templates, including the age-range of the individuals participating in each one, is provided in Table 1 and image examples are shown in Fig. 3. Comparison of MIITRA_0.5mm to the above templates aimed at assessing if super resolution was achieved and at evaluating the new template in terms of image sharpness, presence of artifacts, inter-subject spatial normalization precision for older adult data, ability to detect small inter-group morphometric differences, and representativeness of the older adult brain. More details on the evaluation of MIITRA_0.5mm are provided in the following sub-sections.
Table 1.
T1-weighted templates evaluated in this work.
| Name | Number of persons considered in template construction | Age range (years) | Voxel-size |
|---|---|---|---|
| MIITRA_0.5mm | 222 | 65–95 | 0.5×0.5×0.5mm3 |
| MIITRA_1mm (Ridwan et al., 2021) | 222 | 65–95 | 1×1×1mm3 |
| SS | 222 | 65–95 | 0.5×0.5×0.5mm3 |
| MCALT (version 1.4) (Schwarz et al., 2017) | 202 | 30–92 | 0.5×0.5×0.5mm3 |
| ICBM2009b (nonlinear asymmetric) (Fonov et al., 2009, 2011) | 152 | 18–44 | 0.5×0.5×0.5mm3 |
| Colin27 (version 2008) (Aubert-Broche et al., 2006, Holmes et al., 1998) | 1(27 scans) | 33 | 0.5×0.5×0.5mm3 |
| HCP-1200 (S1200 group average) (Glasser et al., 2013) | 1113 | 22–35 | 0.7×0.7×0.7mm3 |
| ICBM2009c (nonlinear asymmetric) (Fonov et al., 2009, 2011) | 152 | 18–44 | 1×1×1mm3 |
| OASIS (version 2) (Avants and Tustison, 2018) | 30 | 18–90 | 1×1×1mm3 |
| SRI24 (version 2.0) (Rohlfing et al., 2010) | 24 | 19–84 | 1×1×1mm3 |
| UNC-Adult (version 2) https://www.nitrc.org/projects/unc_brain_atlas/ | 50 | 20–50 | 1×1×1mm3 |
| IXI-ANTs (version 2) (Avants and Tustison, 2018) | 560 | 20–90 | 1.2×0.94×0.94mm3 |
Fig. 3.
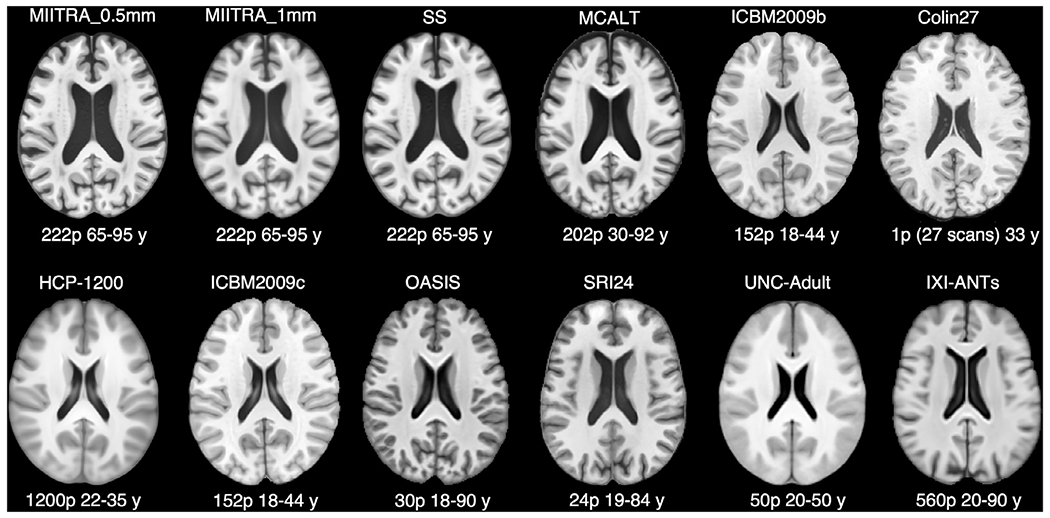
Examples of axial slices from the T1-weighted templates evaluated in this work. Templates for which a brain mask was not available were skull stripped using HD-BET (Isensee et al., 2019). The dynamic range was set for each template as follows: 0.5–7.5 for MIITRA_0.5mm, 0.5–7.5 for MIITRA_1mm, 2.5–9.75 for SS, 1000-21930 for MCALT, 15–91.5 for ICBM2009b, 3000000–47166900 for Colin27, 200-990 for HCP-1200, 15–91.5 for ICBM2009c, 0-9 for OASIS, 50–850 for SRI24, 350–900 for UNC-Adult, and 0.8–4.0 for IXI-ANTs.
2.4.1. Evaluation of super resolution, image sharpness and artifacts
To evaluate the outcome of the application of super resolution principles in template construction, the ability to resolve small brain structures in MIITRA_0.5mm template was compared to that in MIITRA_1mm which was previously constructed using conventional template construction techniques and the exact same data (Ridwan et al., 2021). This comparison was conducted by visual inspection. Image sharpness was assessed for MIITRA_0.5mm and all other templates by means of the normalized power spectra along the left-right (LR), anterior-posterior (AP) and superior-inferior (SI) axes (Ridwan et al., 2021, Zhang and Arfanakis, 2018; Zhang et al., 2011). The power spectral density for the LR axis was first calculated in each coronal slice as follows:
where F(kSI, kLR) is the 2D FFT of a coronal slice, and the results were averaged over all coronal slices. Similarly, the power spectral density for the AP axis was first calculated in each axial slice as follows:
where F(kLR, kAP) is the 2D FFT of an axial slice, and the results were averaged over all axial slices. Finally, the power spectral density for the SI axis was first calculated in each sagittal slice as follows:
where F(kAP, kSI) is the 2D FFT of a sagittal slice, and the results were averaged over all sagittal slices. The average power spectral density for each axis was normalized by the corresponding maximum value. The presence of image artifacts and atypical structures was evaluated in each template by visual inspection.
2.4.2. Evaluation of inter-subject spatial normalization precision
The precision of inter-subject spatial normalization of older adult data achieved when MIITRA_0.5mm is used as reference was compared to that of all other templates, using four different approaches. For this evaluation, older adult data from Dataset 2 were registered to each of the templates using ANTs registration (Avants et al., 2011; Klein, 2016). The precision of inter-subject spatial normalization was first assessed by means of the pairwise normalized cross-correlation (PNCC) (Ferreira et al., 2014; Wang et al., 2004) of spatially normalized images:
where X mi and X mj are the non-zero brain signals in voxel m of participants i and j, μi, σi and μj, σj are the mean and standard deviation of the intensities of all the voxels of participants i and j, and N is the total number of voxels. The average and standard deviation of PNCC over all pairs of spatially normalized data (222×221/2 = 24,531 pairs) were computed for normalization to each template. One-way ANOVA and Tukey-Kramer post-hoc tests were performed to ascertain statistically significant differences in PNCC across templates. Differences with p<0.05 were considered significant.
Second, the transformations of Dataset 2 data to each template were applied to the corresponding gray matter labels of participants in Dataset 2 and the pairwise overlap of regional gray matter labels (PORGM) (Crum et al., 2006) was calculated for each template:
where Li ∩ Lj and Li ∪ Lj are the intersection and union of label L for participants i and j. In addition, the pairwise Jaccard index (PJI) was calculated for each gray matter label (homologous labels in contralateral hemispheres were combined) and for spatial normalization to each template (Rohlfing et al., 2012):
The average and standard deviation of PORGM and PJI over all pairs of spatially normalized data (222×221/2 = 24,531 pairs) were computed for normalization to each template. One-way ANOVA and Tukey-Kramer post-hoc tests were performed to ascertain statistically significant differences in PORGM and PJI across templates. Differences with p<0.05 were considered significant. It should be noted that gray matter parcellation using a single template was used here merely to evaluate precision of inter-subject spatial normalization when different templates are used as references, and it does not suggest that using a single template for gray matter parcellation is ideal.
Third, maps of the standard deviation of signals across spatially normalized data from Dataset 2 were generated for normalization to each template. Whole brain cumulative distributions of the standard deviation were compared across templates using the one-sided two-sample Kolmogorov-Smirnov (KS) test and differences were considered significant at p<0.05.
Finally, a fourth approach for evaluating the spatial normalization precision achieved when using different templates as reference was based on the standard deviation of cortical thickness of spatially normalized older adult data. The main idea here is that, if spatial normalization was perfect, the cortex would be perfectly matched across participants in template space and, therefore, all spatially normalized data would have the exact same cortical thickness in template space (i.e. zero standard deviation of cortical thickness). Imperfectly normalized data may have different cortical thickness in template space (i.e. higher standard deviation of cortical thickness). Thus, the standard deviation of cortical thickness of spatially normalized data can be used to evaluate spatial normalization precision. The ANTs implementation (Tustison et al., 2014) of the diffeomorphic registration-based cortical thickness (DiReCT) (Das et al., 2009) was used to compute continuous estimates of cortical thickness in template space. DiReCT encodes thickness measures within the volumetric domain in the form of maps, which allows for voxel-wise analysis. Maps of the standard deviation of cortical thickness across spatially normalized data from Dataset 2 were generated for normalization to each template. Cumulative distributions of the standard deviation of cortical thickness were compared across templates using the one-sided two-sample Kolmogorov-Smirnov (KS) test and differences were considered significant at p<0.05.
2.4.3. Evaluation of the ability to detect small inter-group differences in voxel-based morphometry studies
The impact of spatial normalization precision achieved with MIITRA_0.5mm on the ability to detect small inter-group morphometric differences (Good et al., 2002; Karas et al., 2003; Radua et al., 2014; Salmond et al., 2002) was assessed using power analysis (Wicks et al., 2011; Zhang, and Arfanakis, 2018) and compared to that of other templates. The transformations from registration of Dataset 2 to the different templates were applied to the corresponding gray matter tissue probability maps and the resulting maps were smoothed using a Gaussian filter with sigma of 3.4mm, in accordance with unmodulated voxel-based morphometry procedures (Good et al., 2002; Radua et al., 2014). Maps of the standard deviation of the smoothed maps were then used in power analyses to assess the minimum morphometric differences that can be detected across two groups, assuming 100 participants per group, significance at p<0.05, and power>0.95. Maps of the minimum detectable inter-group morphometric differences were generated for MIITRA_0.5mm and all other templates, and cumulative distributions were compared across templates using the one-sided two-sample Kolmogorov-Smirnov (KS) test. Differences were considered significant at p<0.05.
2.4.4. Evaluation of the representativeness of the older adult brain
The degree to which MIITRA_0.5mm is representative of the older adult brain was assessed via maps of the average log-Jacobian determinant of the deformations obtained for spatial normalization of Dataset 2 and was compared to that of all other templates. The value in each voxel of these maps represented how data were deformed on average during spatial normalization (Leow et al., 2007; Yanovsky et al., 2009). Zero values represented no change in volume, values greater than zero indicated volume expansion, and values lower than zero indicated volume contraction. One-sided two-sample Kolmogorov-Smirnov (KS) test was used to compare histograms of the average log-Jacobian determinant across templates, separately for expansion and contraction. Differences were considered significant at p<0.05.
2.5. Data and template availability
The data used in this work can be assessed by submitting a request to www.radc.rush.edu. MIITRA_0.5mm is available for download at www.nitrc.org/projects/miitra.
3. Results
3.1. Super resolution, image sharpness and artifacts
Fine structures that were not visible in MIITRA_1mm were resolved in MIITRA_0.5mm (Fig. 4) demonstrating that the application of multiple image super resolution in template construction successfully generated a population-based brain MRI template with higher spatial resolution. The fine structures resolved in MIITRA_0.5mm include features in the cerebellum, the anterior commissure, inter-thalamic adhesion and others (Fig. 4). Furthermore, visual inspection showed that MIITRA_0.5mm was among the templates with the highest image sharpness (Fig. 3). This was supported by comparing the normalized power spectra across templates, which showed a higher energy at high spatial frequencies over all axes for MIITRA_0.5mm compared to all other templates (Fig. 5) (MIITRA_0.5mm was also superior to a 0.5mm template generated by resampling the MIITRA_1mm template using linear interpolation; see Appendix 2). MIITRA_0.5mm was also relatively free of image artifacts in contrast to the hyperintense structures seen in Colin27, ICBM2009b, ICBM2009c and OASIS, and the atypical structures seen in MCALT (Fig. 6).
Fig. 4.
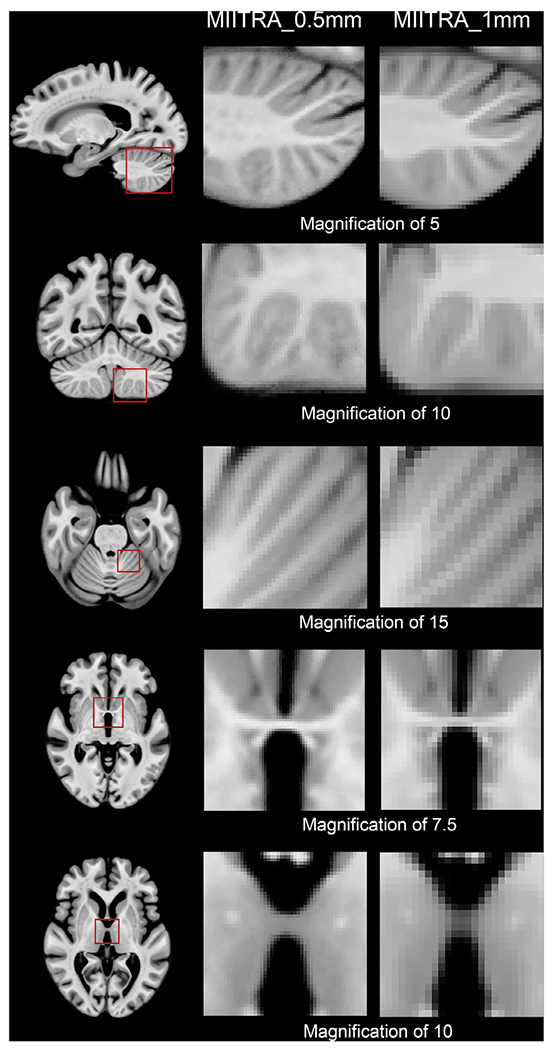
Examples of fine structures that are better resolved in MIITRA_0.5mm compared to MIITRA_1mm, demonstrating that the application of multiple image super resolution in template construction successfully generated a population-based brain MRI template with higher spatial resolution.
Fig. 5.
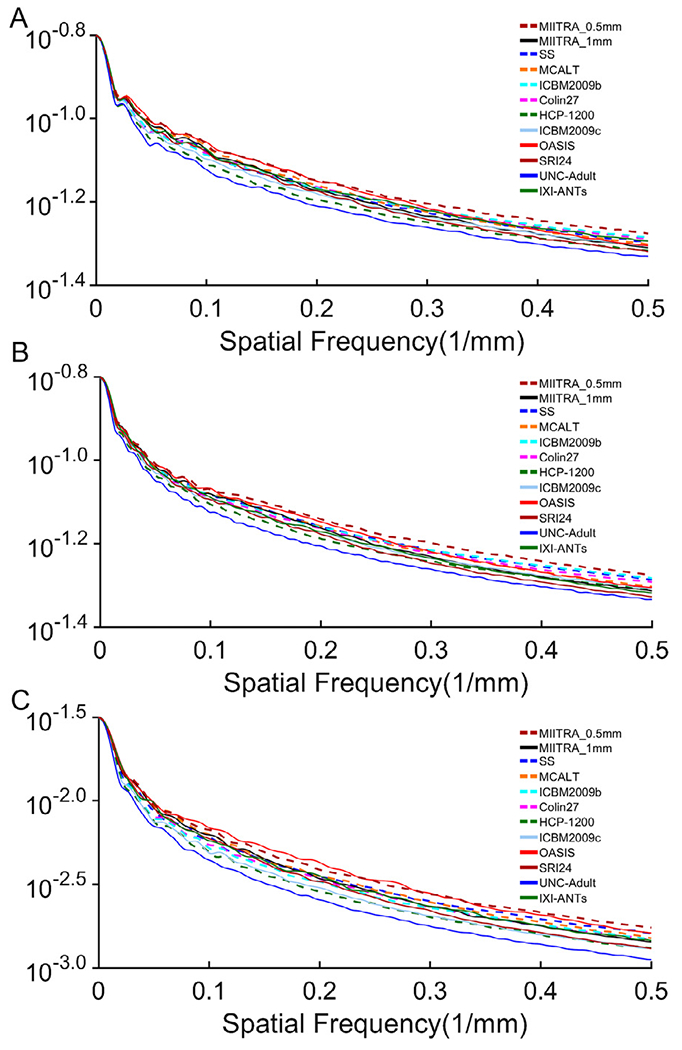
Normalized power spectra for the (A) left-right, (B) anterior-posterior, (C) superior-inferior axes, separately, for the MIITRA_0.5mm and other standardized and study-specific templates.
Fig. 6.
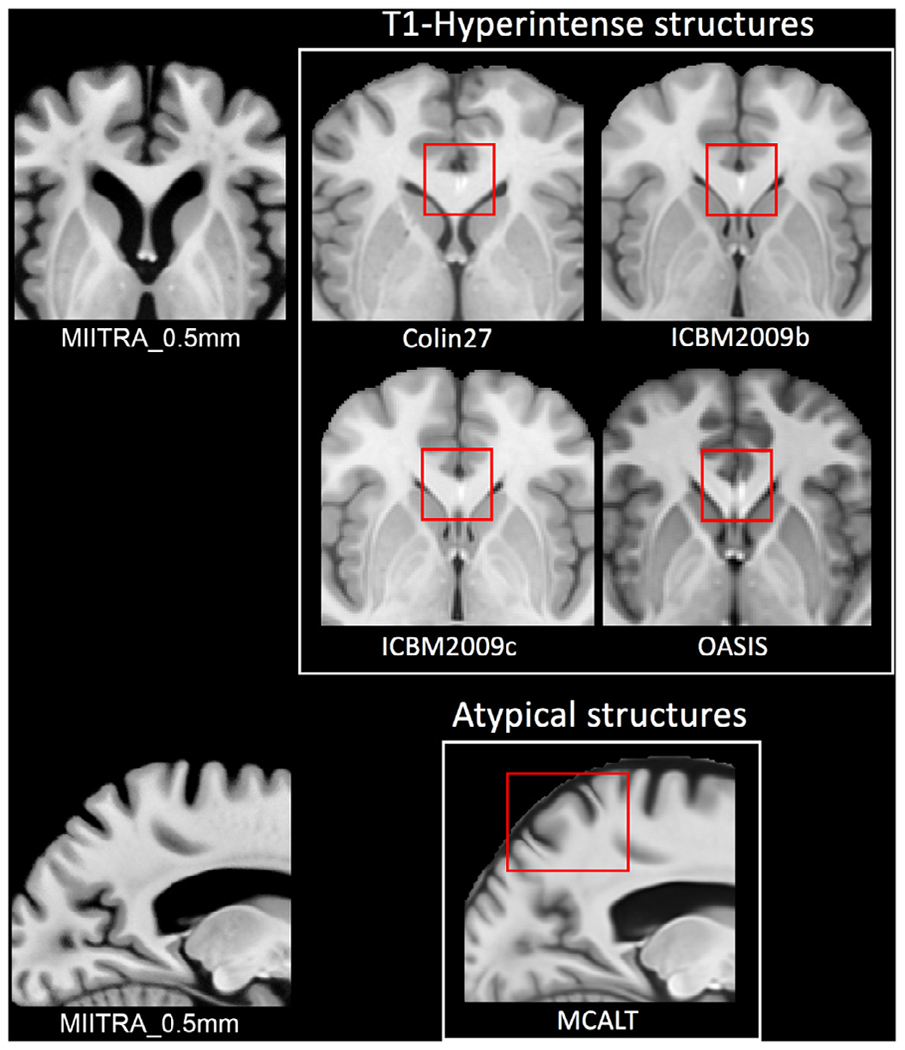
Examples of artifacts seen in some of the standardized templates included in this work that are not present in the MIITRA_0.5mm template.
3.2. Inter-subject spatial normalization precision
The precision of inter-subject spatial normalization of older adult data from Dataset 2 achieved when using the MIITRA_0.5mm template as reference was higher than that achieved with other templates as demonstrated by means of the average PNCC and PORGM (p<10−6 in all cases; see Appendix 3) (Fig. 7A, B) (also see Appendix 2), as well as by the average PJI (in the majority of brain regions) (see Appendix 3) (Fig. 7C). Similar results were obtained for spatial normalization of older adult data collected on an MRI scanner from a different vendor than those used in Dataset 2 (see Appendix 4). In addition, the standard deviation of signals from normalized data of Dataset 2 was lower in more voxels when using MIITRA_0.5mm as reference compared to other templates (p<10−10 in all cases) (Fig. 8). Furthermore, the standard deviation of cortical thickness of spatially normalized data from Dataset 2 was lower when MIITRA_0.5mm was used as a reference compared to other templates (p<10−10 in all cases) (Fig. 9), suggesting better matching of the cortex across older adults when using MIITRA_0.5mm.
Fig. 7.
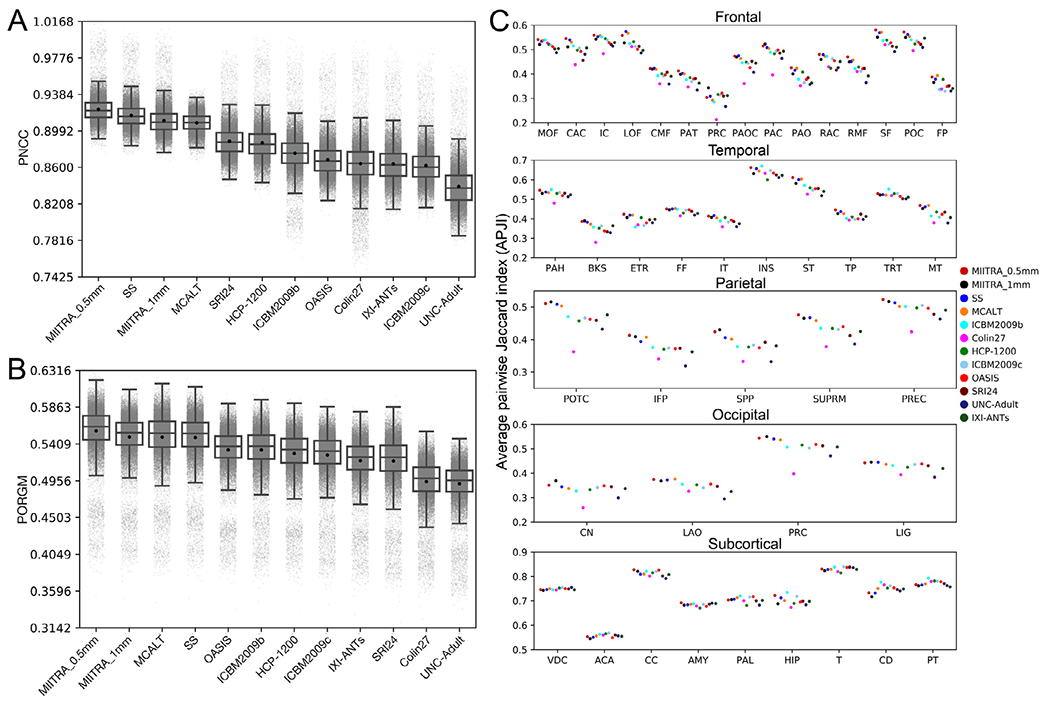
Boxplots of the (A) pairwise normalized cross-correlation (PNCC) and (B) pairwise overlap of regional gray matter labels (PORGM), and (C) average pairwise Jaccard index (PJI) for individual gray matter labels over all spatially normalized data of Dataset 2 when using different templates as reference. Caudal anterior cingulate (CAC), caudal middle frontal (CMF), isthmus cingulate (IC), lateral orbitofrontal (LOF), medial orbitofrontal (MOF), paracentral (PAC), pars opercularis (PAOC), pars orbitalis (PAO), pars triangularis (PAT), posterior cingulate (POC), precentral (PRC), rostral anterior cingulate (RAC), rostral middle frontal (RMF), superior frontal (SF), frontal pole (FP), banks of the superior temporal sulcus (BKS), entorhinal (ETR), fusiform (FF), inferior temporal (IT), middle temporal (MT), parahippocampal (PAH), superior temporal (ST), temporal pole (TP), transverse temporal (TRT), insula (INS), inferior parietal (IFP), postcentral (POTC), precuneus (PREC), superior parietal (SPP), supramarginal (SUPRM), cuneus (CN), lateral occipital (LAO), lingual (LIG), pericalcarine (PRC), cerebellum cortex (CC), thalamus (T), caudate (CD), putamen (PT), pallidum (PAL), hippocampus (HIP), amygdala (AMY), accumbens area (ACA), ventral diencephalon (VDC).
Fig. 8.
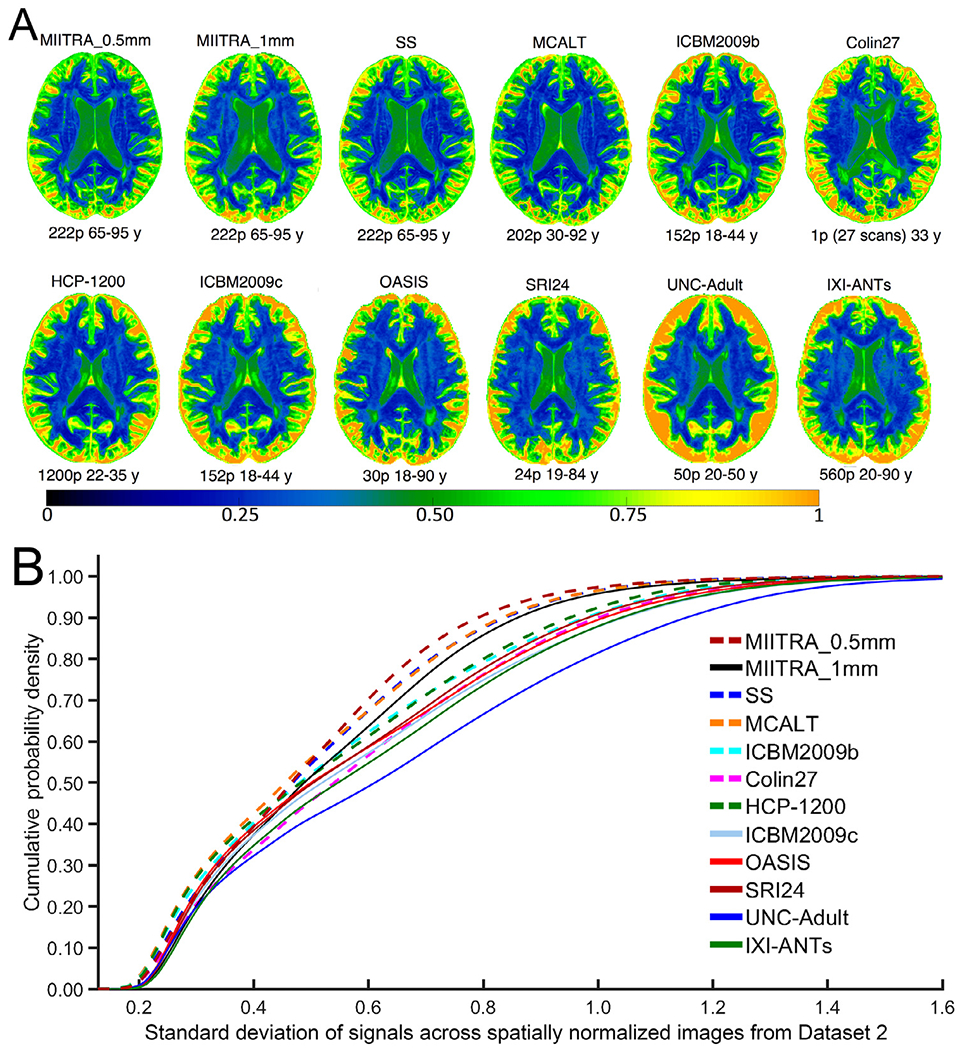
(A) Maps and (B) cumulative distributions of the standard deviation of signals across spatially normalized data of Dataset 2 when using different templates as reference.
Fig. 9.
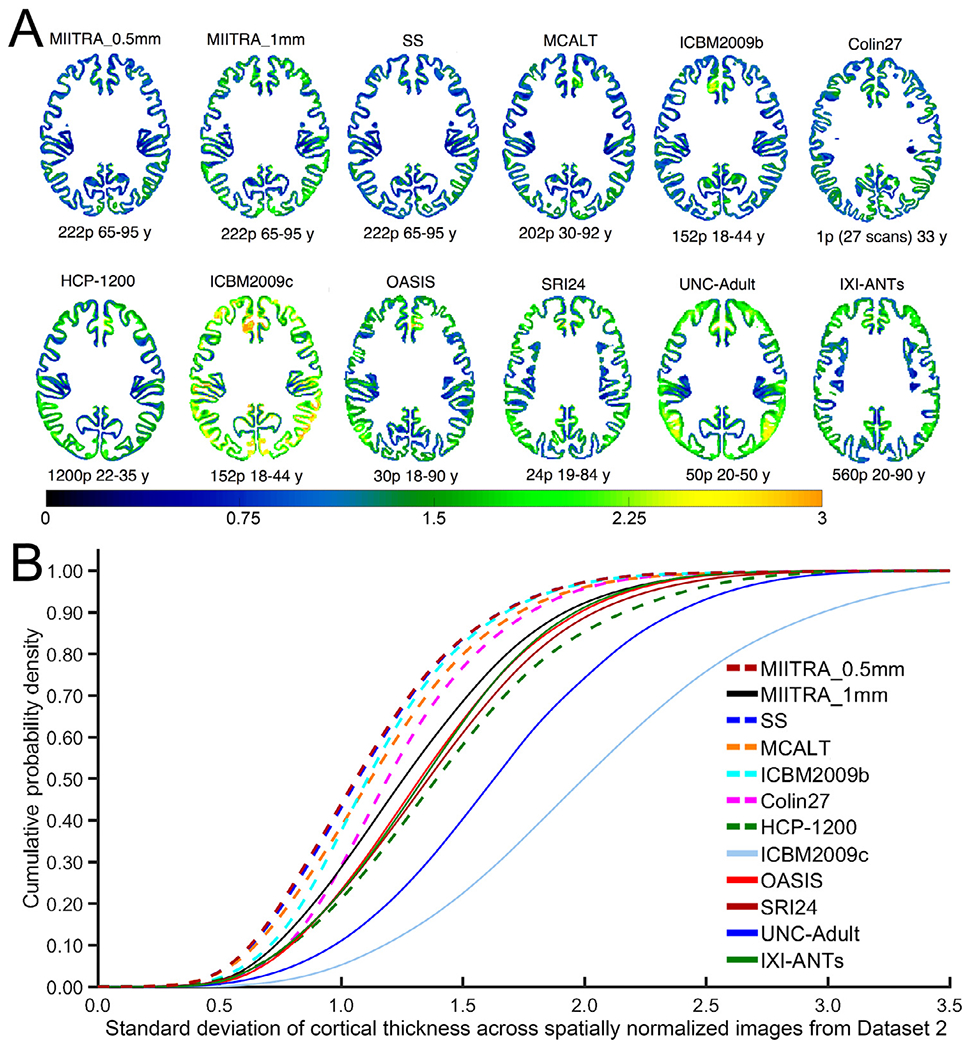
(A) Maps and (B) cumulative distributions of the standard deviation of cortical thickness of spatially normalized data of Dataset 2 when using different templates as reference.
3.3. Ability to detect small inter-group differences in voxel-based morphometry studies
Power analysis showed that use of the MIITRA_0.5mm template allowed detection of smaller inter-group morphometric differences in gray matter compared to other templates. This was demonstrated as a higher number of gray matter voxels with cooler colors and a lower number of voxels with warmer colors when using MIITRA_0.5mm (Fig. 10A). Also, the cumulative distribution of the minimum detectable inter-group morphometric differences was significantly higher for MIITRA_0.5mm compared to other templates (p<10−10 in all cases) (Fig. 10B).
Fig. 10.
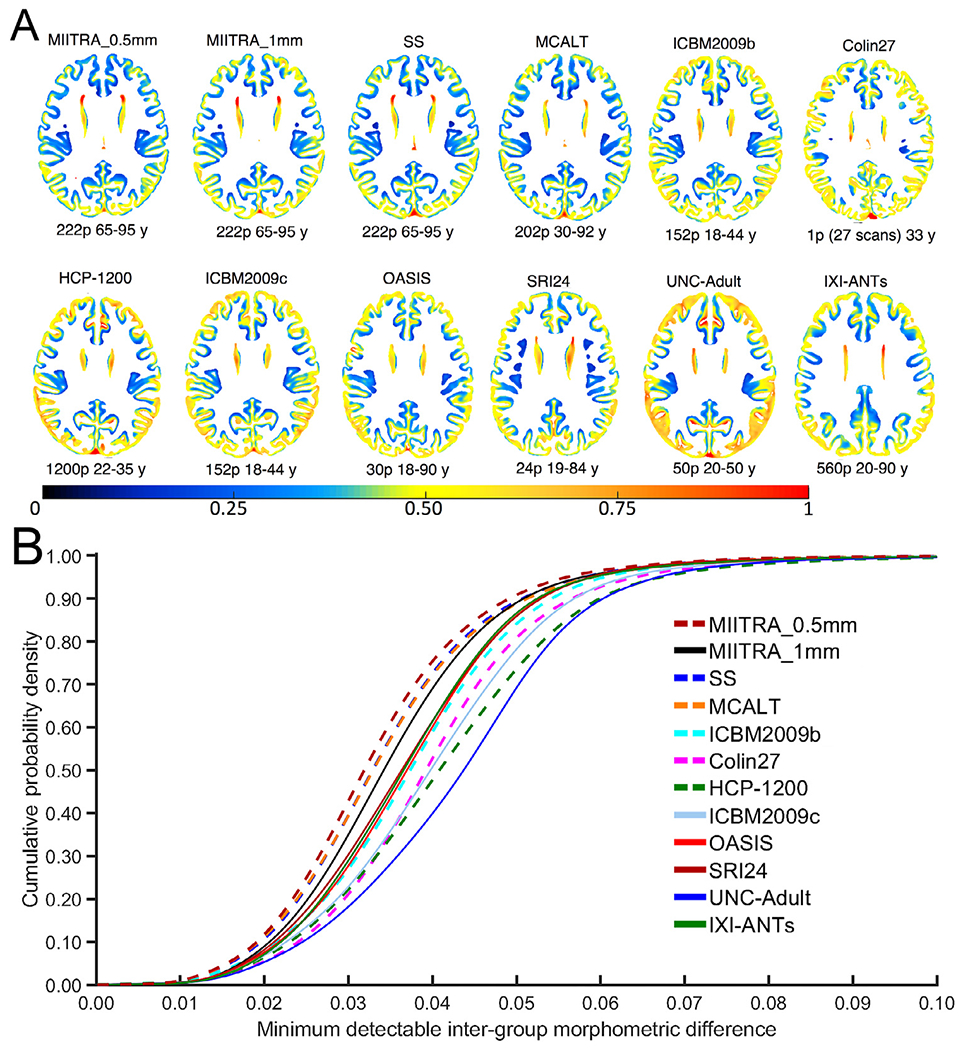
(A) Maps and (B) cumulative distributions of the minimum detectable inter-group morphometric differences in gray matter when using different templates as reference, according to power analysis in non-demented older adults of Dataset 2.
3.4. Representativeness of the older adult brain
Registration of older adult data from Dataset 2 to MIITRA_0.5mm resulted in a higher number of voxels with an average deformation near zero compared to registration to MCALT, ICBM2009b, Colin27, HCP-1200, ICBM2009c, OASIS, SRI24, UNC-Adult and IXI-ANTs (p<10−10 in terms of both expansion and contraction), as demonstrated by means of the average log-Jacobian determinant (Fig. 11). This suggests that MIITRA_0.5mm is more representative of the older adult data of Dataset 2 than the templates mentioned above. Only MIITRA_1mm and SS templates resulted in even less deformation (p<10−10 in terms of both expansion and contraction).
Fig. 11.
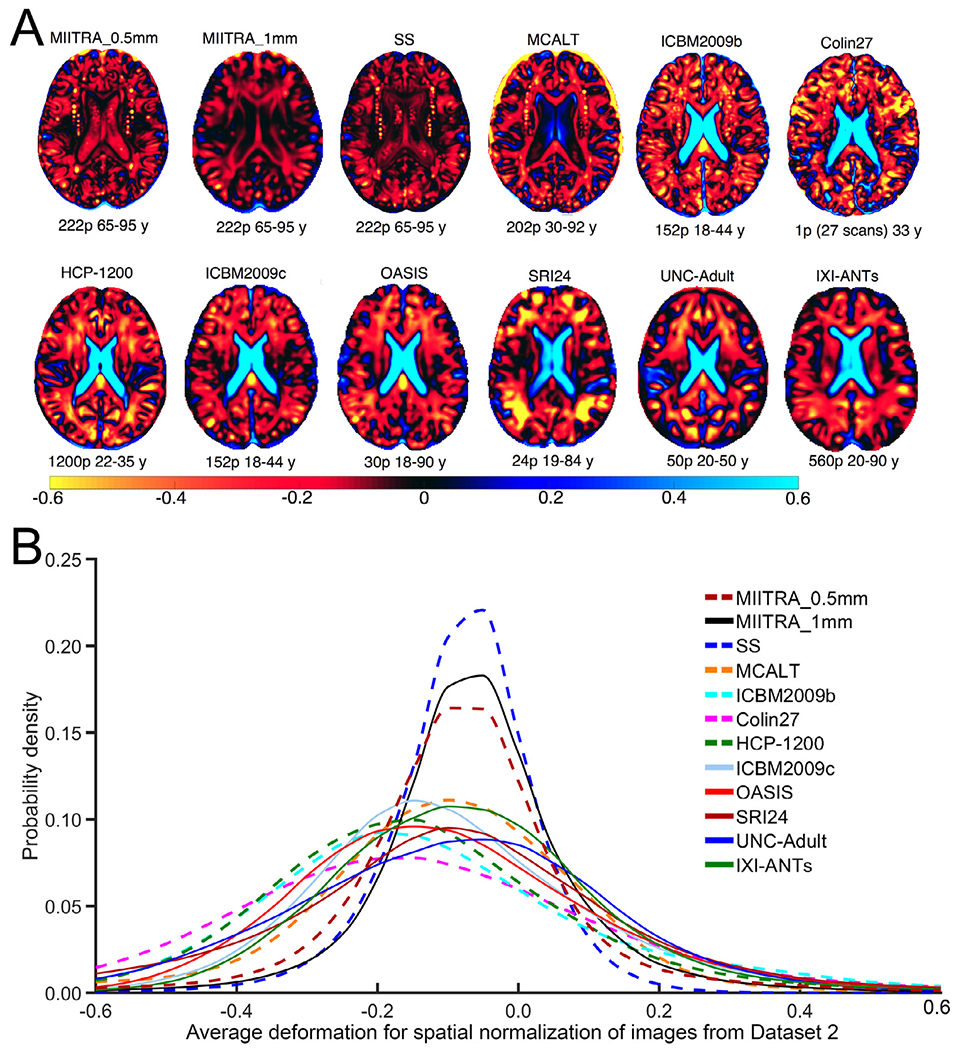
(A) Maps and (B) histograms of the average log-Jacobian determinant of the deformation of older adult data of Dataset 2 for registration to different templates.
4. Discussion
The present work constructed a 0.5mm isotropic resolution standardized T1w template of the older adult brain, termed MIITRA_0.5mm, using principles of super resolution (available for download at www.nitrc.org/projects/miitra). The newly constructed template was systematically compared to several other standardized and study-specific templates in terms of image quality and performance when used as a reference for spatial normalization of older adult data. It was demonstrated that the application of multiple image super resolution principles in template construction successfully enhanced the spatial resolution of the new population-based brain MRI template compared to that of a template constructed using a conventional template building approach and the same data. The enhanced resolution of MIITRA_0.5mm improved visualization of fine structural details of the older adult brain, an important prerequisite for providing high spatial matching of such structures across individuals and for detecting small morphometric differences. In addition, MIITRA_0.5mm exhibited the highest image sharpness and did not contain image artifacts observed in some of the other templates considered here, both characteristics also contributing to high spatial matching. As anticipated, MIITRA_0.5mm provided higher intersubject spatial normalization precision for older adult data compared to all other templates. Consequently, MIITRA_0.5mm also enabled detection of smaller inter-group morphometric differences in older adult brain data compared to all other templates. Finally, MIITRA_0.5mm was among the templates that were most representative of older adult brain data. Overall, the present work generated an important new resource for studies of aging.
4.1. Super resolution, image sharpness and artifacts
Application of multiple image super resolution principles in template construction successfully enhanced the spatial resolution of MIITRA_0.5mm compared to a template developed using a conventional template building approach and the same raw data (i.e. MIITRA_1mm). The enhanced resolution of the new template improved visualization of fine brain structures. These findings are in agreement with previous work that applied super resolution principles in the development of a high angular resolution diffusion imaging (HARDI) brain template from low angular resolution diffusion data (i.e. super resolution in angular sampling) and demonstrated that two-way and three-way fiber crossings were resolved in the HARDI template even though such crossings were not visible in the raw data (Varentsova et al., 2014). As careful alignment across individuals in space is essential for successful application of multiple image super resolution principles in template construction, precise non-linear image registration has played a catalytic role in the present work. Nevertheless, even the top-performing image registration algorithm used here has typically lower precision in those cortical details that are drastically different across individuals. This means that resolution enhancement in those parts of the brain depends on the number of persons precisely aligned, while those imprecisely aligned contribute to noise. The latter appears to not be of concern in MIITRA_0.5mm probably due to the high number of participants considered in its construction and the template building approach employed. The same factors also contributed to the high sharpness and lack of visible artifacts in MIITRA_0.5mm. Overall, MIITRA_0.5mm exhibits enhanced detail and image quality, both of which are important prerequisites for providing high spatial normalization precision of older adult data.
4.2. Inter-subject spatial normalization precision and its impact on the ability to detect small inter-group differences in voxel-based morphometry studies
MIITRA_0.5mm allowed higher inter-subject spatial normalization precision when used as a reference for normalization of older adult data compared to other templates considered in this work. This was manifested by means of three whole brain and one cortex-specific metrics. The factors that led to this improvement in normalization precision are explained in the previous section. In turn, precise alignment of tissues across individuals directly impacts the sensitivity and specificity of voxel-wise analyses (Zhang and Arfanakis, 2018). The present work demonstrated that MIITRA_0.5mm allowed detection of smaller inter-group differences in voxel-based morphometry studies compared to other templates. In studies of the older adult brain, being able to detect smaller changes is important as it directly translates into being able to detect changes earlier.
4.3. Representativeness of the older adult brain
MIITRA_0.5mm, MIITRA_1mm and SS were most representative of older adult brain data compared to other templates. This was anticipated because these were the only three templates constructed with data exclusively from older adults (i.e. 65 years of age and older). In contrast, registration of older adult data to young adult templates such as ICBM2009b, ICBM2009c, HCP-1200, Colin27, UNC-Adult, or to templates combining data across a wide age-range such as MCALT, OASIS, SRI24, IXI-ANTS, required larger amounts of deformation on average (i.e. extensive contraction of the ventricles and sulci, and expansion of gray and white matter tissue) which is undesirable in template-based studies (Dickie et al., 2016a, 2016b; Lemaitre et al., 2005; Matsumae et al., 1996; Sullivan et al., 1995; Ridwan et al., 2021). These findings have important implications in template selection for studies on older adults which traditionally have used the young adult or wide age-range templates mentioned above due to the lack of a dedicated older adult template. The primary reason why MIITRA_1mm required on average smaller amounts of deformation of older adult data than MIITRA_0.5mm, an observation that was also made when comparing ICBM2009c (1mm voxel size) to ICBM2009b (0.5mm voxel size), was probably the fact that the larger voxels in MIITRA_1mm limited local deformations. SS was shown to be the most representative of the older adult brain, which is expected since it was built from the same data used in this evaluation (Dataset 2). Nevertheless, MIITRA_0.5mm has several important advantages over SS as it exhibited higher spatial resolution, higher sharpness, and allowed higher spatial normalization precision and detection of smaller intergroup differences than the SS template. And since MIITRA_0.5mm is standardized, it requires no time for development, it provides consistently high performance, and may facilitate integration and comparison of results across studies.
4.4. Limitations
In addition to its multiple strengths presented above, the present work also has a few limitations. First, the performance of the new template was compared to only 11 other commonly used templates, and not to all available T1w templates. However, an exhaustive comparison was conducted for MIITRA_1mm by Ridwan et al. (2021), using the exact same data of Dataset 2 and identical metrics as those used in the present work. Since MIITRA_0.5mm was compared to MIITRA_1mm in the present work, and the latter outperformed a large number of templates considered in Ridwan et al. (2021), one can safely conclude that MIITRA_0.5mm also outperforms those templates. In addition, the present work evaluated the performance of MIITRA_0.5mm as a reference for alignment of data from older adults in the 65–95 years age-range using a state of the art registration algorithm and ADNI T1w data of typical image quality, however, future work should also consider other registration algorithms as well as data with different image quality and from different age-ranges. This is especially true for data with submillimeter spatial resolution, which are not yet publicly available for a sufficiently large number of older adults to facilitate the statistical analyses conducted here. Nevertheless, we anticipate that the main conclusions of the present work would remain unchanged if submillimeter resolution data were used in template evaluation instead of Dataset 2, especially considering that spatial normalization of submillimeter resolution data to any 1mm isotropic template would lead to loss of spatial details.
5. Conclusion
The present work constructed a 0.5mm isotropic resolution standardized T1w template of the older adult brain, named MIITRA_0.5mm, using principles of super resolution. The new template exhibited higher spatial resolution and improved visualization of fine structural details of the older adult brain compared to a template constructed using a conventional template building approach and the same data. In addition, MIITRA_0.5mm exhibited the highest image sharpness and did not contain image artifacts observed in some of the other templates considered here for comparison. Due to the above enhancements, MIITRA_0.5mm provided higher inter-subject spatial normalization precision for older adult data compared to all other templates. Consequently, MIITRA_0.5mm also enabled detection of smaller inter-group morphometric differences in older adult brain data compared to the other templates. Finally, MIITRA_0.5mm was among the templates that were most representative of older adult brain data. Overall, the new template constructed here is an important new resource for studies of aging, and the findings of the present work have important implications in template selection for studies on older adults. The MIITRA_0.5mm template is available for download at www.nitrc.org/projects/miitra.
Supplementary Material
Acknowledgements
The authors would like to thank the participants and staff of the Rush University Memory and Aging Project and Alzheimer’s Disease Neuroimaging Initiative.
Funding
This study was supported by National Institutes of Health grants R01AG052200, P30AG010161, R01AG17917.
In addition, part of the data collection and sharing for this project was funded by the Alzheimer’s Disease Neuroimaging Initiative (ADNI) (National Institutes of Health Grant U01 AG024904) and DOD ADNI (Department of Defense award number W81XWH-12-2-0012). ADNI is funded by the National Institute on Aging, the National Institute of Biomedical Imaging and Bioengineering, and generous contributions from the following: AbbVie; Alzheimer’s Association; Alzheimer’s Drug Discovery Foundation; Araclon Biotech; BioClinica, Inc.; Biogen; Bristol-Myers Squibb Company; CereSpir, Inc.; Cogstate; Eisai; Elan Pharmaceuticals, Inc.; Eli Lilly and Company; EuroImmun; F. Hoffmann-La Roche and its affiliated company Genentech, Inc.; Fujirebio; GE Healthcare; IX-ICO Ltd.; Janssen Alzheimer Immunotherapy Research & Development, LLC.; Johnson & Johnson Pharmaceutical Research & Development LLC.; Lumosity; Lundbeck; Merck & Co., Inc.; Meso Scale Diagnostics, LLC.; NeuroRx Research; Neurotrack Technologies; Novartis Pharmaceuticals Corporation; Pfizer Inc.; Piramal Imaging; Servier; Takeda Pharmaceutical Company; and Transition Therapeutics. The Canadian Institutes of Health Research is providing funds to support ADNI clinical sites in Canada. Private sector contributions are facilitated by the Foundation for the National Institutes of Health (www.fnih.org/). The grantee organization is the Northern California Institute for Research and Education, and the study is coordinated by the Alzheimer’s Therapeutic Research Institute at the University of Southern California. ADNI data are disseminated by the Laboratory for Neuro Imaging at the University of Southern California.
Footnotes
A portion of the data used in preparation of this article were obtained from the Alzheimer’s Disease Neuroimaging Initiative (ADNI) database (adni.loni.usc.edu). As such, the investigators within the ADNI contributed to the design and implementation of ADNI and/or provided data but did not participate in analysis or writing of this report. A complete listing of ADNI investigators can be found at: http://adni.loni.usc.edu/wp-content/uploads/how_to_apply/ADNI_Acknowledgement_List.pdf
Data and template availability statement
The data used in this work can be assessed by submitting a request to www.radc.rush.edu. MIITRA_0.5mm is available for download at www.nitrc.org/projects/miitra.
Declaration of Competing Interest
The authors have no conflict of interest to report.
Credit authorship contribution statement
Mohammad Rakeen Niaz: Conceptualization, Formal analysis, Investigation, Methodology, Validation, Visualization, Writing – original draft, Writing – review & editing, Software. Abdur Raquib Ridwan: Methodology, Validation, Writing – review & editing, Software. Yingjuan Wu: Methodology, Validation, Software. David A. Bennett: Data curation, Funding acquisition, Resources. Konstantinos Arfanakis: Conceptualization, Data curation, Formal analysis, Funding acquisition, Investigation, Methodology, Project administration, Resources, Validation, Visualization, Writing – original draft, Writing – review & editing, Supervision.
Supplementary materials
Supplementary material associated with this article can be found, in the online version, at doi:10.1016/j.neuroimage.2021.118869.
References
- Aubert-Broche B, Evans AC, Collins L, 2006. A new improved version of the realistic digital brain phantom. Neuroimage doi: 10.1016/j.neuroimage.2006.03.052. [DOI] [PubMed] [Google Scholar]
- Avants BB, Epstein CL, Grossman M, Gee JC, 2008. Symmetric diffeo-morphic image registration with cross-correlation: Evaluating automated labeling of elderly and neurodegenerative brain. Med. Image Anal 12, 26–41. doi: 10.1016/j.media.2007.06.004. [DOI] [PMC free article] [PubMed] [Google Scholar]
- Avants B, Gee JC, 2004. Geodesic estimation for large deformation anatomical shape averaging and interpolation. NeuroImage doi: 10.1016/j.neuroimage.2004.07.010, Neuroimage. [DOI] [PubMed] [Google Scholar]
- Avants BB, Tustison NJ, Song G, 2009. Advanced normalization tools (ANTS). Insight J 2, 1–35 https://www.insight-journal.org/browse/publication/681. [Google Scholar]
- Avants BB, Tustison NJ, Song G, Cook PA, Klein A, Gee JC, 2011. A reproducible evaluation of ANTs similarity metric performance in brain image registration. Neuroimage 54, 2033–2044. doi: 10.1016/j.neuroimage.2010.09.025. [DOI] [PMC free article] [PubMed] [Google Scholar]
- Avants BB, Yushkevich P, Pluta J, Minkoff D, Korczykowski M, Detre J, Gee JC, 2010. The optimal template effect in hippocampus studies of diseased populations. Neuroimage 49, 2457–2466. doi: 10.1016/j.neuroimage.2009.09.062. [DOI] [PMC free article] [PubMed] [Google Scholar]
- Avants B, Tustison N. doi: 10.6084/m9.Q8figshare.915436.v2. [DOI] [Google Scholar]
- Bennett DA, Buchman AS, Boyle PA, Barnes LL, Wilson RS, Schneider JA, 2018. Religious orders study and rush memory and aging project. J. Alzheimer’s Dis doi: 10.3233/JAD-179939. [DOI] [PMC free article] [PubMed] [Google Scholar]
- Bevilacqua M, Roumy A, Guillemot C, Morel MLA, 2012. Low-complexity single-image super-resolution based on nonnegative neighbor embedding In: Proceedings of the Electronic British Machine Vision Conference BMVC. British Machine Vision Association, BMVA; doi: 10.5244/C.26.135. [DOI] [Google Scholar]
- Bookheimer SY, Salat DH, Terpstra M, Ances BM, Barch DM, Buckner RL, Burgess GC, Curtiss SW, Diaz-Santos M, Elam JS, Fischl B, Greve DN, Hagy HA, Harms MP, Hatch OM, Hedden T, Hodge C, Japardi KC, Kuhn TP, Ly TK, Smith SM, Somerville LH, Uğurbil K, van der Kouwe A, Van Essen D, Woods RP, Yacoub E, 2019. The lifespan human connectome project in aging: an overview. Neuroimage 185, 335–348. doi: 10.1016/j.neuroimage.2018.10.009, 140++. [DOI] [PMC free article] [PubMed] [Google Scholar]
- Chen Y, Xie Y, Zhou Z, Shi F, Christodoulou AG, Li D, 2018. Brain MRI super resolution using 3D deep densely connected neural networks In: Proceedings of the International Symposium on Biomedical Imaging. IEEE Computer Society, pp. 739–742. doi: 10.1109/ISBI.2018.8363679. [DOI] [Google Scholar]
- Crum WR, Camara O, Hill DLG, 2006. Generalized overlap measures for evaluation and validation in medical image analysis. IEEE Trans. Med. Imaging 25, 1451–1461. doi: 10.1109/TMI.2006.880587. [DOI] [PubMed] [Google Scholar]
- Das SR, Avants BB, Grossman M, Gee JC, 2009. Registration based cortical thickness measurement. Neuroimage 45, 867–879. doi: 10.1016/j.neuroimage.2008.12.016. [DOI] [PMC free article] [PubMed] [Google Scholar]
- de Flores R, La Joie R, Landeau B, Perrotin A, Mézenge F, de La Sayette V, Eustache F, Desgranges B, Chételat G, 2015. Effects of age and Alzheimer’s disease on hippocampal subfields: comparison between manual and freesurfer volumetry. Hum. Brain Mapp 36, 463–474. doi: 10.1002/hbm.22640. [DOI] [PMC free article] [PubMed] [Google Scholar]
- Dickie DA, Karama S, Ritchie SJ, Cox SR, Sakka E, Royle NA, Aribisala BS, Hernández MV, Maniega SM, Pattie A, Corley J, Starr JM, Bastin ME, Evans AC, Deary IJ, Wardlaw JM, 2016. Progression of white matter disease and cortical thinning are not related in older community-dwelling subjects. Stroke 47, 410–416. doi: 10.1161/STROKEAHA.115.011229. [DOI] [PMC free article] [PubMed] [Google Scholar]
- Dickie DA, Ritchie SJ, Cox SR, Sakka E, Royle NA, Aribisala BS, Valdés Hernández M, del C, Maniega SM, Pattie A, Corley J, Starr JM, Bastin ME, Deary IJ, Wardlaw JM, 2016. Vascular risk factors and progression of white matter hyperintensities in the lothian birth cohort 1936. Neurobiol. Aging 42, 116–123. doi: 10.1016/j.neurobiolaging.2016.03.011. [DOI] [PMC free article] [PubMed] [Google Scholar]
- Doshi J, Erus G, Ou Y, Gaonkar B, Davatzikos C, 2013. Multi-atlas skull-stripping. Acad. Radiol 20, 1566–1576. doi: 10.1016/j.acra.2013.09.010. [DOI] [PMC free article] [PubMed] [Google Scholar]
- Farokhian F, Beheshti I, Sone D, Matsuda H, 2017. Comparing CAT12 and VBM8 for detecting brain morphological abnormalities in temporal lobe epilepsy. Front. Neurol 8. doi: 10.3389/fneur.2017.00428. [DOI] [PMC free article] [PubMed] [Google Scholar]
- Farsiu S, Robinson MD, Elad M, Milanfar P, 2004. Fast and robust multiframe super resolution. IEEE Trans. Image Process 13, 1327–1344. doi: 10.1109/TIP.2004.834669. [DOI] [PubMed] [Google Scholar]
- Ferreira JR, Oliveira MC, Freitas AL, 2014. Performance evaluation of medical image similarity analysis in a heterogeneous architecture. In: Proceedings of the IEEE Symposium on Computer-Based Medical Systems. Institute of Electrical and Electronics Engineers Inc., pp. 159–164. doi: 10.1109/CBMS.2014.65. [DOI] [Google Scholar]
- Fischl B, 2012. FreeSurfer. Neuroimage 62 (2), 774–781. doi: 10.1016/j.neuroimage.2012.01.021. [DOI] [PMC free article] [PubMed] [Google Scholar]
- Fonov V, Evans AC, Botteron K, Almli CR, McKinstry RC, Collins DL, 2011. Unbiased average age-appropriate atlases for pediatric studies. Neuroimage 54, 313–327. doi: 10.1016/j.neuroimage.2010.07.033. [DOI] [PMC free article] [PubMed] [Google Scholar]
- Fonov V, Evans A, McKinstry R, Almli C, Collins D, 2009. Unbiased nonlinear average age-appropriate brain templates from birth to adulthood. Neuroimage 47, S102. doi: 10.1016/s1053-8119(09)70884-5. [DOI] [Google Scholar]
- Gholipour A, Estroff JA, Warfield SK, 2010. Robust super-resolution volume reconstruction from slice acquisitions: application to fetal brain MRI. IEEE Trans. Med. Imaging 29, 1739–1758. doi: 10.1109/TMI.2010.2051680. [DOI] [PMC free article] [PubMed] [Google Scholar]
- Glasner D, Bagon S, Irani M, 2009. Super-resolution from a single image In: Proceedings of the IEEE International Conference on Computer Vision, pp. 349–356. doi: 10.1109/ICCV.2009.5459271. [DOI] [Google Scholar]
- Glasser MF, Sotiropoulos SN, Wilson JA, Coalson TS, Fischl B, Andersson JL, Xu J, Jbabdi S, Webster M, Polimeni JR, Van Essen DC, Jenkinson M, 2013. The minimal preprocessing pipelines for the human connectome project. Neuroimage 80, 105–124. doi: 10.1016/j.neuroimage.2013.04.127. [DOI] [PMC free article] [PubMed] [Google Scholar]
- Good CD, Scahill RI, Fox NC, Ashburner J, Friston KJ, Chan D, Crum WR, Rossor MN, Frackowiak RSJ, 2002. Automatic differentiation of anatomical patterns in the human brain: validation with studies of degenerative dementias. Neuroimage 17, 29–46. doi: 10.1006/nimg.2002.1202. [DOI] [PubMed] [Google Scholar]
- Greenspan H, Oz G, Kiryati N, Peled S, 2002. MRI inter-slice reconstruction using super-resolution. Magn. Reson. Imaging 20, 437–446. doi: 10.1016/S0730-725X(02)00511-8. [DOI] [PubMed] [Google Scholar]
- Guimond A, Meunier J, Thirion JP, 2000. Average brain models: a convergence study. Comput. Vis. Image Underst 77, 192–210. doi: 10.1006/cviu.1999.0815. [DOI] [Google Scholar]
- He Y, Yap KH, Chen L, Chau LP, 2007. A nonlinear least square technique for simultaneous image registration and super-resolution. IEEE Trans. Image Process 16, 2830–2841. doi: 10.1109/TIP.2007.908074. [DOI] [PubMed] [Google Scholar]
- Heckemann RA, Ledig C, Gray KR, Aljabar P, Rueckert D, Hajnal JV, Hammers A, 2015. Brain extraction using label propagation and group agreement: Pincram. PLoS One 10. doi: 10.1371/journal.pone.0129211. [DOI] [PMC free article] [PubMed] [Google Scholar]
- Holmes CJ, Hoge R, Collins L, Woods R, Toga AW, Evans AC, 1998. Enhancement of MR images using registration for signal averaging. J. Comput. Assist. Tomogr 22, 324–333. doi: 10.1097/00004728-199803000-00032. [DOI] [PubMed] [Google Scholar]
- Irfanoglu MO, Nayak A, Jenkins J, Hutchinson EB, Sadeghi N, Thomas CP, Pierpaoli C, 2016. DR-TAMAS: diffeomorphic registration for tensor accurate alignment of anatomical structures. Neuroimage 132, 439–454. doi: 10.1016/j.neuroimage.2016.02.066. [DOI] [PMC free article] [PubMed] [Google Scholar]
- Isensee F, Schell M, Pflueger I, Brugnara G, Bonekamp D, Neuberger U, Wick A, Schlemmer H, Heiland S, Wick W, Bendszus M, Maier-Hein KH, Kickingereder P, 2019. Automated brain extraction of multisequence MRI using artificial neural networks. Hum. Brain Mapp 40, 4952–4964. doi: 10.1002/hbm.24750. [DOI] [PMC free article] [PubMed] [Google Scholar]
- Jafari-Khouzani K, 2014. MRI upsampling using feature-based nonlocal means approach. IEEE Trans. Med. Imaging 33, 1969–1985. doi: 10.1109/TMI.2014.2329271. [DOI] [PMC free article] [PubMed] [Google Scholar]
- Jia Y, He Z, Gholipour A, Warfield SK, 2016. Single anisotropic 3-D MR image upsampling via overcomplete dictionary trained from in-plane high resolution slices. IEEE J. Biomed. Health Inform 20, 1552–1561. doi: 10.1109/JBHI.2015.2470682. [DOI] [PMC free article] [PubMed] [Google Scholar]
- Jörsäter S, 2008. Methods in astronomical image processing with special applications to the reduction of CCD data. In: Central Activity in Galaxies. Springer, Berlin Heidelberg, pp. 193–207. doi: 10.1007/3-540-56371-7_24. [DOI] [Google Scholar]
- Joshi S, Davis B, Jomier M, Gerig G, 2004. Unbiased diffeomorphic atlas construction for computational anatomy. NeuroImage doi: 10.1016/j.neuroimage.2004.07.068, Neuroimage. [DOI] [PubMed] [Google Scholar]
- Karas GB, Burton EJ, Rombouts SARB, Van Schijndel RA, O’Brien JT, Scheltens P, McKeith IG, Williams D, Ballard C, Barkhof F, 2003. A comprehensive study of gray matter loss in patients with Alzheimer’s disease using optimized voxel-based morphometry. Neuroimage 18, 895–907. doi: 10.1016/S1053-8119(03)00041-7. [DOI] [PubMed] [Google Scholar]
- Klein A, 2016. Mindboggle-101 templates (unlabeled images from a population of brains). Harvard Dataverse doi: 10.7910/DVN/WDIYB5. [DOI] [Google Scholar]
- Lalys F, Haegelen C, Ferre JC, El-Ganaoui O, Jannin P, 2010. Construction and assessment of a 3-T MRI brain template. Neuroimage 49, 345–354. doi: 10.1016/j.neuroimage.2009.08.007. [DOI] [PubMed] [Google Scholar]
- Kim J, Lee JK, Lee KM, 2015. Accurate Image Super-Resolution Using Very Deep Convolutional Networks. Proc. IEEE Comput. Soc. Conf. Comput. Vis. Pattern Recognit. 2016-December, 1646–1654. [Google Scholar]
- Ledig C, Theis L, Huszar F, Caballero J, Cunningham A, Acosta A, Aitken A, Tejani A, Totz J, Wang Z, Shi W, 2016. Photo-Realistic Single Image Super-Resolution Using a Generative Adversarial Network. Proc. - 30th IEEE Conf. Comput. Vis. Pattern Recognition, CVPR 2017 2017-January, 105–114. [Google Scholar]
- Lemaître H, Crivello F, Grassiot B, Alpérovitch A, Tzourio C, Mazoyer B, 2005. Age- and sex-related effects on the neuroanatomy of healthy elderly. Neuroimage 26, 900–911. doi: 10.1016/j.neuroimage.2005.02.042. [DOI] [PubMed] [Google Scholar]
- Leow AD, Yanovsky I, Chiang MC, Lee AD, Klunder AD, Lu A, Becker JT, Davis SW, Toga AW, Thompson PM, 2007. Statistical properties of Jacobian maps and the realization of unbiased large-deformation nonlinear image regist. IEEE Trans. Med. Imaging 26, 822–832. doi: 10.1109/TMI.2007.892646. [DOI] [PubMed] [Google Scholar]
- Li Y, Song B, Guo J, Du X, Guizani M, 2019. Super-Resolution of brain MRI images using overcomplete dictionaries and nonlocal similarity. IEEE Access 7, 25897–25907. [Google Scholar]
- Lim B, Son S, Kim H, Nah S, Lee KM, 2017. Enhanced Deep Residual Networks for Single Image Super-Resolution. IEEE Comput. Soc. Conf. Comput. Vis. Pattern Recognit. Work. 2017-July, 1132–1140. [Google Scholar]
- Manjón JV, Coup P, Buades A, Fonov V, Louis Collins D, Robles M, 2010. Non-local MRI upsampling. Med. Image Anal 14, 784–792. doi: 10.1016/j.media.2010.05.010. [DOI] [PubMed] [Google Scholar]
- Manjón JV, Bertó A, Romero JE, Lanuza E, Vivo-hernando R, Aparici-robles F, Coupe P, 2020. pBrain : a novel pipeline for Parkinson related brain structure segmentation. NeuroImage Clin 25, 102184. doi: 10.1016/j.nicl.2020.102184. [DOI] [PMC free article] [PubMed] [Google Scholar]
- Manjón JV, Manjón M, Coupé P, Buades A, Louis Collins D, Robles M, 2010. MRI superresolution using self-similarity and image priors. Int. J. Biomed. Imaging 11. doi: 10.1155/2010/425891, 2010. [DOI] [PMC free article] [PubMed] [Google Scholar]
- Matsumae M, Kikinis R, Mórocz IA, Lorenzo AV, Sándor T, Albert MS, Black PML, Jolesz FA, 1996. Age-related changes in intracranial compartment volumes in normal adults assessed by magnetic resonance imaging. J. Neurosurg 84, 982–991. doi: 10.3171/jns.1996.84.6.0982. [DOI] [PubMed] [Google Scholar]
- McCarthy CS, Ramprashad A, Thompson C, Botti JA, Coman IL, Kates WR, 2015. A comparison of FreeSurfer-generated data with and without manual intervention. Front. Neurosci 9. doi: 10.3389/fnins.2015.00379. [DOI] [PMC free article] [PubMed] [Google Scholar]
- Park MTM, Pipitone J, Baer LH, Winterburn JL, Shah Y, Chavez S, Schira MM, Lobaugh NJ, Lerch JP, Voineskos AN, Chakravarty MM, 2014. Derivation of high-resolution MRI atlases of the human cerebellum at 3T and segmentation using multiple automatically generated templates. Neuroimage 95, 217–231. doi: 10.1016/j.neuroimage.2014.03.037. [DOI] [PubMed] [Google Scholar]
- Pham CH, Tor-Díez C, Meunier H, Bednarek N, Fablet R, Passat N, Rousseau F, 2019. Multiscale brain MRI super-resolution using deep 3D convolutional networks. Comput. Med. Imaging Graph 77, 101647. doi: 10.1016/j.compmedimag.2019.101647. [DOI] [PubMed] [Google Scholar]
- Plenge E, Poot DHJ, Bernsen M, Kotek G, Houston G, Wielopolski P, Van Der Weerd L, Niessen WJ, Meijering E, 2012. Super-resolution methods in MRI: Can they improve the trade-off between resolution, signal-to-noise ratio, and acquisition time? Magn. Reson. Med 68, 1983–1993. doi: 10.1002/mrm.24187. [DOI] [PubMed] [Google Scholar]
- Radua J, Canales-Rodríguez EJ, Pomarol-Clotet E, Salvador R, 2014. Validity of modulation and optimal settings for advanced voxel-based morphometry. Neuroimage 86, 81–90. doi: 10.1016/j.neuroimage.2013.07.084. [DOI] [PubMed] [Google Scholar]
- Ridwan AR, Niaz MR, Wu Y, Qi X, Zhang S, Kontzialis M, Javierre-Petit C, Tazwar M, Bennett DA, Yang Y, Arfanakis K, 2021. Development and evaluation of a high performance <scp>T1</scp>-weighted brain template for use in studies on older adults. Hum. Brain Mapp 25327. doi: 10.1002/hbm.25327, hbm. [DOI] [PMC free article] [PubMed] [Google Scholar]
- Rohlfing T, Kroenke CD, Sullivan EV, Dubach MF, Bowden DM, Grant KA, Pfefferbaum A, 2012. The INIA19 template and NeuroMaps atlas for primate brain image parcellation and spatial normalization. Front. Neuroinform 6. doi: 10.3389/fn-inf.2012.00027. [DOI] [PMC free article] [PubMed] [Google Scholar]
- Rohlfing T, Zahr NM, Sullivan EV, Pfefferbaum A, 2010. The SRI24 multichannel atlas of normal adult human brain structure. Hum. Brain Mapp 31, 798–819. doi: 10.1002/hbm.20906. [DOI] [PMC free article] [PubMed] [Google Scholar]
- Rousseau F, Glenn OA, Iordanova B, Rodriguez-Carranza C, Vigneron DB, Barkovich JA, Studholme C, 2006. Registration-based approach for reconstruction of high-resolution in utero fetal mr brain images. Acad. Radiol 13, 1072–1081. doi: 10.1016/j.acra.2006.05.003. [DOI] [PubMed] [Google Scholar]
- Rueda A, Malpica N, Romero E, 2013. Single-image super-resolution of brain MR images using overcomplete dictionaries. Med. Image Anal 17, 113–132. doi: 10.1016/j.media.2012.09.003. [DOI] [PubMed] [Google Scholar]
- Salmond CH, Ashburner J, Vargha-Khadem F, Connelly A, Gadian DG, Friston KJ, 2002. The precision of anatomical normalization in the medial temporal lobe using spatial basis functions. Neuroimage 17, 507–512. doi: 10.1006/nimg.2002.1191. [DOI] [PubMed] [Google Scholar]
- Scherrer B, Gholipour A, Warfield SK, 2012. Super-resolution reconstruction to increase the spatial resolution of diffusion weighted images from orthogonal anisotropic acquisitions. Med. Image Anal 16, 1465–1476. doi: 10.1016/j.media.2012.05.003. [DOI] [PMC free article] [PubMed] [Google Scholar]
- Schwarz CG, Gunter JL, Ward CP, Vemuri P, Senjem ML, Wiste HJ, Petersen RC, Knopman DS, Jack CR, 2017. [P2-415]: The Mayo Clinic adult lifespan template: better quantification across the lifespan. Alzheimer’s Dement. 13, P792. doi: 10.1016/j.jalz.2017.06.1071, –P792. [DOI] [Google Scholar]
- Shilling RZ, Robbie TQ, Bailloeul T, Mewes K, Mersereau RM, Brummer ME, 2009. A super-resolution framework for 3-D high-resolution and high-contrast imaging using 2-D multislice MRI. IEEE Trans. Med. Imaging 28, 633–644. doi: 10.1109/TMI.2008.2007348. [DOI] [PubMed] [Google Scholar]
- Sone D, Sato N, Maikusa N, Ota M, Sumida K, Yokoyama K, Kimura Y, Imabayashi E, Watanabe Y, Watanabe M, Okazaki M, Onuma T, Matsuda H, 2016. Automated subfield volumetric analysis of hippocampus in temporal lobe epilepsy using high-resolution T2-weighed MR imaging. NeuroImage Clin. 12, 57–64. doi: 10.1016/j.nicl.2016.06.008. [DOI] [PMC free article] [PubMed] [Google Scholar]
- Sánchez I, Vilaplana V, 2018. Brain MRI super-resolution using 3D generative adversarial networks. arXiv preprint arXiv:1812.11440. [Google Scholar]
- Sui Y, Afacan O, Gholipour A, Warfield SK, 2019. Isotropic MRI Super-Resolution Reconstruction with Multi-scale Gradient Field Prior. In: Lecture Notes in Computer Science (Including Subseries Lecture Notes in Artificial Intelligence and Lecture Notes in Bioinformatics). Springer Science and Business Media Deutschland GmbH, pp. 3–11. doi: 10.1007/978-3-030-32248-9_1. [DOI] [Google Scholar]
- Sullivan EV, Marsh L, Mathalon DH, Lim KO, Pfefferbaum A, 1995. Age-related decline in MRI volumes of temporal lobe gray matter but not hippocampus. Neurobiol. Aging 16, 591–606. doi: 10.1016/0197-4580(95)00074-O. [DOI] [PubMed] [Google Scholar]
- Tustison NJ, Avants BB, Cook PA, Zheng Y, Egan A, Yushkevich PA, Gee JC, 2010. N4ITK: improved N3 bias correction. IEEE Trans. Med. Imaging 29, 1310–1320. doi: 10.1109/TMI.2010.2046908. [DOI] [PMC free article] [PubMed] [Google Scholar]
- Tustison NJ, Cook PA, Klein A, Song G, Das SR, Duda JT, Kandel BM, van Strien N, Stone JR, Gee JC, Avants BB, 2014. Large-scale evaluation of ANTs and FreeSurfer cortical thickness measurements. Neuroimage 99, 166–179. doi: 10.1016/j.neuroimage.2014.05.044. [DOI] [PubMed] [Google Scholar]
- Van Hecke W, Leemans A, Sage CA, Emsell L, Veraart J, Sijbers J, Sunaert S, Parizel PM, 2011. The effect of template selection on diffusion tensor voxel-based analysis results. Neuroimage 55, 566–573. doi: 10.1016/j.neuroimage.2010.12.005. [DOI] [PubMed] [Google Scholar]
- Varentsova A, Zhang S, Arfanakis K, 2014. Development of a high angular resolution diffusion imaging human brain template. Neuroimage 91, 177–186. doi: 10.1016/j.neuroimage.2014.01.009. [DOI] [PMC free article] [PubMed] [Google Scholar]
- Wang Z, Bovik AC, Sheikh HR, Simoncelli EP, 2004. Image quality assessment: from error visibility to structural similarity. IEEE Trans. Image Process 13, 600–612. doi: 10.1109/TIP.2003.819861. [DOI] [PubMed] [Google Scholar]
- Wicks P, Vaughan TE, Massagli MP, Heywood J, 2011. Accelerated clinical discovery using self-reported patient data collected online and a patient-matching algorithm. Nat. Biotechnol 29, 411–414. doi: 10.1038/nbt.1837. [DOI] [PubMed] [Google Scholar]
- Yanovsky I, Leow AD, Lee S, Osher SJ, Thompson PM, 2009. Comparing registration methods for mapping brain change using tensor-based morphometry. Med. Image Anal 13, 679–700. doi: 10.1016/j.media.2009.06.002. [DOI] [PMC free article] [PubMed] [Google Scholar]
- Yuan Q, Zhang L, Shen H, Li P, 2010. Adaptive multiple-frame image super-resolution based on U-curve. IEEE Trans. Image Process 19, 3157–3170. doi: 10.1109/TIP.2010.2055571. [DOI] [PubMed] [Google Scholar]
- Yushkevich PA, Pluta JB, Wang H, Xie L, Ding SL, Gertje EC, Mancuso L, Kliot D, Das SR, Wolk DA, 2015. Automated volumetry and regional thickness analysis of hippocampal subfields and medial temporal cortical structures in mild cognitive impairment. Hum. Brain Mapp 36, 258–287. doi: 10.1002/hbm.22627. [DOI] [PMC free article] [PubMed] [Google Scholar]
- Zeng K, Zheng H, Cai C, Yang Y, Zhang K, Chen Z, 2018. Simultaneous single- and multi-contrast super-resolution for brain MRI images based on a convolutional neural network. Comput. Biol. Med 99, 133–141. doi: 10.1016/j.compbiomed.2018.06.010. [DOI] [PubMed] [Google Scholar]
- Zhang S, Arfanakis K, 2018. Evaluation of standardized and study-specific diffusion tensor imaging templates of the adult human brain: template characteristics, spatial normalization accuracy, and detection of small inter-group FA differences. Neuroimage 172, 40–50. doi: 10.1016/j.neuroimage.2018.01.046. [DOI] [PMC free article] [PubMed] [Google Scholar]
- Zhang S, Peng H, Dawe RJ, Arfanakis K, 2011. Enhanced ICBM diffusion tensor template of the human brain. Neuroimage 54, 974–984. doi: 10.1016/j.neuroimage.2010.09.008. [DOI] [PMC free article] [PubMed] [Google Scholar]
- Zhang ZG, Chan SC, Zhang X, Lam EY, Wu EX, Hu Y, 2009. High-resolution reconstruction of human brain MRI image based on local polynomial regression. In: Proceedings of the 4th International IEEE/EMBS Conference on Neural Engineering. NER ’09, pp. 245–248. doi: 10.1109/NER.2009.5109279. [DOI] [Google Scholar]
- Zhao C, Carass A, Jog A, Prince JL, 2016. Effects of spatial resolution on image registration. In: Proceedings of the Medical Imaging: Image Processing. SPIE, p. 97840Y. doi: 10.1117/12.2217322. [DOI] [PMC free article] [PubMed] [Google Scholar]
Associated Data
This section collects any data citations, data availability statements, or supplementary materials included in this article.


