Abstract
Electron transfer dissociation (ETD) is an analytically useful tool for primary structure interrogation of intact proteins, but its utility is limited by higher-order reactions with the products. To inhibit these higher-order reactions, first-generation fragment ions are kinetically excited by applying an experimentally tailored parallel ion parking waveform during ETD (ETD-PIP). In combination with subsequent ion/ion proton transfer reactions, precursor-to-product conversion was maximized as evidenced by the consumption of more than 90% of the 21 kDa Protein G precursor to form ETD product ions. The employment of ETD-PIP increased sequence coverage to 90% from 80% with standard ETD. Additionally, the inhibition of sequential electron transfers was reflected in the high number of complementary ion pairs from ETD-PIP (90%) compared to standard ETD (39%).
Graphical Abstract
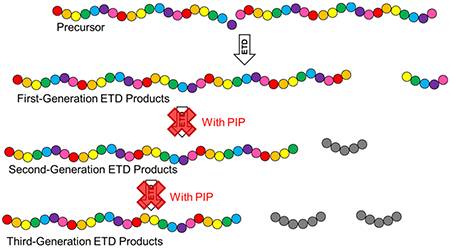
Since the advent of electrospray ionization (ESI),1 interest in technologies and methods for improved tandem mass spectrometry (MS/MS) analysis of intact proteins has endured for its potential to completely elucidate the true translated sequence of a protein, along with the identity and site of all post-translational modifications (PTMs) present.2 This information is useful for the development of protein-based therapeutics and for fundamental studies investigating structure–function relationships and their downstream impacts on the biological phenotype.
In an ideal intact protein MS/MS experiment, all isolated precursor ions would derive from a single proteoform and dissociation would be limited to a single type of backbone bond (e.g., C–N, N–Cα, or Cα–C). All precursor ions would be exclusively converted into complementary N- and C-terminal-containing pairs of fragment ions resulting from a single bond cleavage event (i.e., no internal fragments). Experimental observation of complementary pairs of fragments provides a higher level of confidence in the assigned sequence, and production of only “first-generation” fragments results in product ion spectra with the highest possible signal-to-noise (S/N) ratios. Furthermore, sequence-informative fragment ions would be generated without any bias due to precursor charge state, gas-phase conformation, adjacent residues, or location along the protein backbone. At present, all dissociation methods currently in use for intact protein sequencing fall short of these ideal behaviors. These dissociation techniques yield product ions that result from more than one bond cleavage event, such that a large fraction of detected fragment signals are not explained or attributed to the protein sequence.3–6 In addition, detection and accurate assignment of complementary fragment ion pairs is often sporadic because it is limited by the resolving power, sensitivity, or m/z range of the mass analyzer.7
Electron transfer dissociation (ETD) is widely employed for interrogation of the primary structures of intact proteins. ETD is an ion/ion reaction that preferentially cleaves the protein backbone with much less residue proximity bias than collision-based dissociation techniques.8,9 For any dissociation method, the number of dissociation channels, and therefore possible number fragment ion species, grows linearly with polypeptide length. Fortunately, ETD has a strong bias toward the cleavage of the N–Cα bond.1 As a result, fragment ion signal is distributed among fewer fragment ion types compared to other dissociation techniques. For example, ultraviolet photodissociation (UVPD) cleaves at all the protein backbone bonds, as well as bonds in the residue side chains.10 ETD’s preference for N–Cα bond cleavage decreases the complexity and increases the S/N of resultant product ion spectra when compared to UVPD. Since ETD involves the creation of an electron-rich radical followed by rapid dissociative rearrangement with very low amounts of vibrational energy imparted to the analyte, it produces sequence product ions that retain labile PTMs, such as phosphorylation and O-linked glycosylation. This property of ETD enables more extensive characterization of intact protein PTM profiles. However, the ability of ETD to successfully generate sequence-informative fragments is strongly dependent on the charge density of the precursor, which is not the case for some other dissociation techniques like UVPD.2
In all commercially available implementations of ETD, highly charged gas-phase protein precursor ions are immersed in a cloud of ETD reagent ions for a defined amount of time. Ion/ion reaction rates are directly related to the square of the reactants’ charges.11–13 This dependence is consistent with the formation of a stable orbiting complex as the rate-limiting step,14 where the rate constant (kc) is determined by the long-range coulombic attractive potentials between reacting ion species. For the ideal case of the reacting clouds of monovelocity ions, McLuckey and co-workers derived the following expression:
| (1) |
where z1 and z2 are the charge states of the reactants, μ is the reduced mass of the reactants, and v is the differential velocity between the reactant ions.6,15 This expression reveals a strong inverse dependence of the rate constant on the cube of differential velocity of the reactant ions.
Generally, charges are distributed relatively uniformly along the length of a protein precursor ion. When an individual protein precursor ion undergoes its first ETD reaction with a reagent anion, it will dissociate to form a pair of first-generation fragment ions. If the bond cleavage occurs near the end of the protein ion, the longer complementary fragment ion will have a charge state not much lower than that of the precursor. These long, relatively highly charged product ions are likely to undergo subsequent ETD reactions at a similar rate to the precursor. The products of such subsequent ion/ion reactions are an internal fragment ion and a second-generation N-or C-terminal-containing fragment ion (hereinafter referred to as “sequence ions)” that is simply a shorter version of the first-generation sequence ion. In summary, these highly charged first-generation fragments are converted to internal fragments at rates similar to their production from the precursor ions (eq 1). Subsequent higher-order reactions may continue to occur so long as product ions have a relatively high charge.
If the reaction period is further extended, the product ion population becomes comprised of even shorter sequence ions along with a large set of internal fragment ion species. Individually, these internal fragment ions are of low relative abundance, appearing as noise in the baseline of product ion spectra. However, as the number of possible product ions increases, internal fragments can account for a substantial fraction of the total product ion signal while providing little to no sequence information. Although reaction times required for all precursor ions to undergo ETD produce extensive higher-generation fragmentation, reaction times suited to minimal secondary fragmentation leave a significant portion of the precursor ions unreacted. A method to allow primary fragmentations but inhibit generation of secondary fragments would increase the efficiency of the conversion of precursors to informative product ions with maximal S/N.
In this work, ion/ion reactions were performed in a quadrupole linear ion trap (QLT). The QLT has hyperbolic profile rod electrodes, which, in combination with the radiofrequency (RF) potentials on adjacent rods, create a radial trapping RF quadrupole field. For a fixed intensity and frequency of the RF potentials, this imparts ions with characteristic secular frequencies of oscillation in the x and y (radial) dimensions that are entirely a function of an ion’s mass-to-charge ratio (m/z).16 An additional alternating current (AC) dipolar field of single or multiple frequencies (also known as a waveform) can be superposed upon the RF potentials on opposing quadrupole rod electrodes in the QLT. When a frequency component of the auxiliary waveform is similar to an ion’s secular frequency, the ion is resonantly kinetically excited. The excited ion adopts an increased amplitude of oscillation between rods and an increased average velocity.16,17 These methods are routinely used to m/z-selectively eject ions from the QLT (for mass analysis or ion isolation) or to effect higher-energy collisions with the bath gas for collision-induced dissociation (CID).18
The ions’ m/z-dependent characteristic secular frequencies in a quadrupole field can also be exploited during ion/ion reactions to affect the rate of reaction for selected species. This method of “ion parking” was first introduced by the McLuckey group.3,19 The supplemental AC voltage(s) applied during the ion/ion reaction for ion parking has amplitudes sufficient to increase the kinetic energy of the resonant ion(s) without causing CID or ion ejection. This in turn increases the relative velocity between the selected ion and its reaction partner, strongly decreasing its ion/ion reaction rate (eq 1). McLuckey et al. first used this technique to condense ion/ion proton transfer (IIPT; also known as proton transfer reactions, PTR; or proton transfer charge reduction, PTCR) reaction products into selected charge states.3
Parallel ion parking during ETD was first demonstrated by Chrisman et al. to increase the abundance of first-generation ETD product ions.20 They generated a broadband waveform of AC voltages that was comprised of frequencies matching the ETD product ions’ secular frequencies of axial motion. This waveform was applied differentially to the end cap electrodes of an RF 3D quadrupole ion trap analyzer during ETD reactions to superpose a multifrequency auxiliary dipole field on the trapping RF quadrupole field. Consequently, the precursor and reagent reacted at an uninhibited rate, as they were minimally kinetically excited by the auxiliary field. The dissociation of each precursor ion created two first-generation sequence ions with axial secular frequencies that made them subject to kinetic excitation by the broadband waveform potential. The fragment ions were kinetically excited by the waveform field such that their kinetics for undergoing secondary ETD reactions were effectively suppressed (eq 1). Only product ions with m/z that were close to the precursor and reagent m/z values were not excited.
We adapted this method of parallel ion parking during ETD (hereinafter referred to as ETD-PIP) to characterize the primary structure of intact proteins using a hybrid dual cell QLT-Orbitrap mass spectrometer. A tailored auxiliary AC waveform potential was experimentally optimized to perform ETD-PIP. The waveform AC voltages were applied to opposing x-rods of the high-pressure QLT to create an x-polarized multifrequency field to excite first-generation ETD fragment ions and reagent anions. Protein G (21 kDa) was used to demonstrate preservation of first-generation fragment ion abundances at extended reaction times relative to standard ETD reaction times. Sequence coverages from individually optimized standard ETD and ETD-PIP analyses were compared for a selected Protein G precursor. ETD and ETD-PIP yielded 80 and 90% coverage, respectively. This increased sequence coverage is the result of the improved preservation of higher mass sequence ions. With conventional ETD, only 39% of the fragment ions identified had an observed complementary ion, while 90% of the fragments identified with ETD-PIP had a complement.
EXPERIMENTAL SECTION
Materials.
Recombinant Protein G was purchased from Fisher Scientific as a lyophilized powder (Waltham, MA). Ubiquitin from bovine erythrocytes and 2,2′-biquinoline was purchased from Millipore Sigma (Burlington, MA). Perfluor-omethyldecalin (PFMD; technical grade) was purchased from Oakwood Products, Inc. (Estill, SC).
Standard Protein Infusion.
One nanomole of lyophilized Protein G was reconstituted in 40:59:1 acetonitrile/water/acetic acid (v/v/v) to a final concentration of 1 μM. Each solution was directly infused at ~70 nL/min via a laser-pulled (Sutter P-2000, Novato, CA) fused silica capillary (360 μm O.D. × 50 μm I.D.) emitter tip (~1 μm) and ionized by nanoelectrospray ionization. The ESI source emitter was biased at 2.5 kV, the capillary inlet was heated to 275 °C, and the S-lens RF level was set to 60%.
Instrument and Software Modifications.
The Orbitrap Velos Pro (Thermo Fisher Scientific; Waltham, MA) used here was previously modified with an atmospheric pressure ionization inlet from an Orbitrap Fusion to incorporate a front-end reagent ionization source.21 This instrument was subsequently upgraded with a high-field Orbitrap mass analyzer to render it a modified Orbitrap Elite. 2,2′-Biquinoline was heated to 80 °C in the reagent inlet’s oven, and its radical anion was used as the ETD reagent.12 As previously described,22 a room-temperature secondary reagent inlet (reagent receptacle and capillary restrictor) was fed into the reagent flow path to deliver PFMD to the reagent ion source. PFMD radical anions were used as IIPT ions.22 The introduction of reagent ions from the front end enables the accumulation of the products of multiple of ion/ion reactions prior to high resolution detection in the Orbitrap. This “multiple fills” method has been demonstrated to rapidly improve spectral S/N in proportion to the number of C-trap fills.7,21
Waveform Application and Design.
The embedded instrument control computer software language has built-in functions for constructing the multifrequency AC voltage waveforms applied to the QLT electrodes in order to effect m/z isolation and CID.23 Such waveform voltages are applied differentially between the rod electrodes oriented on the x axis of all three segments of the QLT structure to establish a multifrequency dipole potential that kinetically excites ions of selected m/z values. Using these functions, the software was modified to define, generate, and apply suitable AC voltage waveforms for ETD-PIP. This waveform was continuously applied prior to the initiation of ETD reactions through the user-defined reaction duration. In the frequency domain, these PIP waveforms can be visualized as frequency combs with each frequency component represented as a tine. The tines are spaced every 500 Hz as the ETD-PIP waveforms had a period of 2 ms. Tine lengths correspond to the amplitudes of the individual frequency components. The instrument default waveform frequency dependence (quadratic scaling factor) of the initial phase of the waveform frequency components was used. This quadratic dependence was chosen to avoid large variations in the amplitude of the applied waveform and to deliver waveform power at all desired frequencies with a high degree of temporal uniformity. A detailed discussion of the considerations involved in the phase composition of such waveforms is described by Louris and Taylor.23 The frequency composition of the applied ETD-PIP waveform was confirmed using a Tektronix MDO3014 (Tektronix Co. Beaverton, OR) oscilloscope that digitized and Fourier-transformed the analog waveform signal directly from the waveform synthesizer in the instrument electronics.
Several adjustments to the McLuckey group’s original method20 were adopted to extend ETD-PIP to QLT hardware and maximize intact protein sequence information. The original ETD-PIP waveform proposed exclusion of frequencies corresponding to precursor and reagent ion secular frequencies. These exclusions created two “notches” in the waveform so that the two species would react undeterred. The waveform components associated with kinetic excitation of the product ions were of uniform amplitude. This work adjusts the original waveform by including frequency components for kinetic excitation of the reagent, tailoring the amplitudes of each frequency component, and tuning the cation notch width. These optimizations were completed using 3e5 reagent AGC and 1e5 MSn AGC with an Orbitrap mass resolution of 60 k at 400 m/z. Despite being optimized with ubiquitin, this waveform was used to analyze other proteins without further adjustment, i.e., Protein G in this work.
Previously, Ugrin et al. demonstrated that kinetic excitation of the reagent anions maximizes the efficiency of parallel ion parking despite a concomitant reduction in the ion/ion reaction rate.22 This adjustment was adopted as illustrated in Figure 1, which shows an example of the ETD-PIP waveform magnitudes and frequency composition employed in this study for Protein G [M + 28]+28. A swath of low amplitude frequency components centered around the reagent’s secular frequency creates resonant excitation of the reagent.
Figure 1.
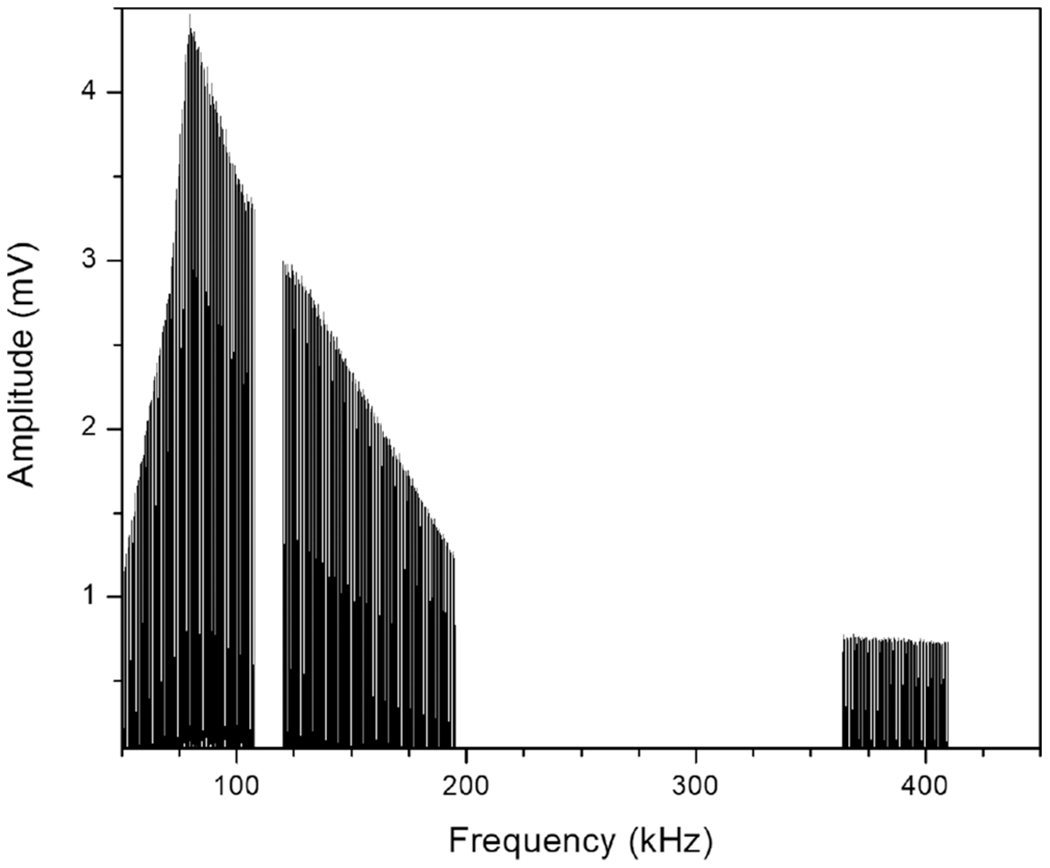
Example of the ETD-PIP waveform in the frequency domain for the Protein G [M + 28H]+28 precursor at 767 m/z. The secular frequencies of the precursor and reagent ions are 109.5 and 394.5 kHz in the QLT, respectively.
Next, the amplitude of the frequency components in the ETD-PIP waveform determines the intensity with which the resonant ion is driven. The increase in average ion kinetic energy should be sufficient to slow the ion/ion reaction rate without resulting in ion dissociation from higher-energy collisions with the bath gas or ejection from the QLT due to an excessively large trajectory in the quadrupole field. The amplitudes for the ETD-PIP waveform were determined by applying a flat-amplitude waveform over a ubiquitin [M + 13H]+13 precursor during a 40 ms ETD reaction. As the amplitude of the waveform was incrementally increased, the abundance of a prominent CID product and the total ion current before and after the reaction (to determine if ions were ejected from the QLT) were monitored. The waveform amplitudes at which ion dissociation or ion ejection occurred were compared; the lower of the two was reduced slightly and assigned to the PIP-ETD waveform frequency component corresponding to the precursor’s secular frequency. This process was repeated, changing the ion/ion Mathieu q with each iteration to place the ubiquitin [M + 13H]+13 precursor at a new secular frequency. All waveform amplitudes for frequencies not explicitly determined were calculated by interpolating between experimental data points. The final amplitudes per frequency component are represented in Figure 1.
Finally, the precursor reaction rate was maximized by widening the cation notch width in the waveform. Waveform frequency components similar to the precursor’s secular frequency can still resonantly excite the precursor, slowing the precursor’s reaction rate.
The cation notch width was determined empirically for a variety of precursors at different secular frequencies. First, the ion/ion Mathieu q was fixed at 0.80. The ubiquitin [M + 13H]+13 precursor’s ETD reaction rate was monitored, as the frequency composition of the applied waveform was altered to include components increasingly similar to the precursor’s secular frequency. A decreased ETD reaction rate indicated when the added frequency component of the waveform caused resonant excitation of the precursor. Such frequency components were removed from the ETD-PIP waveform. This experiment was repeated to determine the precursor notch widths for ubiquitin [M + 12H]+12, [M + 11H]+11, [M + 10H]+10, [M + 9H]+9, and [M + 8H]+8. Notch widths were recorded in two categories: by how many frequency components lower than the precursor’s secular frequency need to be excluded and how many frequency components higher than the precursor’s secular frequency need to be excluded. Once the notch widths were determined for this variety of precursors at various secular frequencies, notch widths for all possible precursor m/z were determined by interpolating between data points (SI Figure 1).
Performance Evaluations of ETD and ETD-PIP.
To evaluate the performance of ETD-PIP compared to standard ETD, precursor and fragment ion abundances were monitored as a function of ETD reaction time. Precursor ion abundance was defined as the area under all peaks +/− 2 m/z of the precursor’s average m/z. Product ion abundance was defined as the area under all peaks +/− 300 m/z of the precursor’s average m/z value, excluding the already measured precursor ion abundance; this m/z range encompasses the majority of product ion signal. It is likely that the reported precursor ion abundance also includes fragment ion signal from fragment ions that fell within +/− 2 m/z of the precursor m/z. The [M + 28H]+28 Protein G (767 m/z) precursor was allowed to react with and without PIP for reaction times up to 200 ms. Precursor and product ion abundances were recorded every 0.5 ms from the start of the ETD reaction until 10.1 ms reaction time and then every two ms thereafter. This experiment was repeated for the [M + 26H]+26, [M + 24H]+24, [M + 22H]+22, and [M + 20H]+20 precursors of Protein G with PIP only. These experiments were conducted in the QLT with a reagent automatic gain control (AGC) setting of 5e5 charges, precursor AGC target of 1e5 charges, and precursor ion isolation window of 5 m/z. The Mathieu q of the reagent (~256 m/z) was set to 0.8.
Sequence coverage of the [M + 28]+28 precursor of Protein G was evaluated for both 4 ms of standard ETD and 20 ms ETD-PIP with the optimized PIP waveform (Figure 1) and utilized the same AGC, isolation window, and reagent Mathieu q settings described above. Following ETD, product ions were subjected to 30 ms of IIPT reactions with the Mathieu q of the reagent (~512 m/z) set to 0.55 and a reagent AGC setting of 5e5 charges. Spectra were acquired in the Orbitrap at a resolution of 240 k at 400 m/z in reduced profile mode. Prior to each detection event (microscan), 10 product ion fills into the C-trap were performed (cumulative precursor AGC target of 1E6 charges) and each spectrum was taken as the sum of 16 microscans. Fifteen spectra were averaged post-FT (~10 min of spectral acquisition time) before fragment assignment and sequence coverage determination. Spectra were manually interpreted using Xcalibur Qual Browser software (Thermo Fisher Scientific version 4.0). The resulting coverage map was created in ProSight Lite V1.4 from Northwestern University.24 Fragment ion m/z values were calculated using an in-house developed mass calculator; assignments were made using a 10 ppm tolerance. Sequence coverage was reported as the percentage of the total number of possible N–C± bond cleavages observed (producing c- and z•-type ions). Note that ETD does not produce observable fragment ions N-terminal to prolines,8 but the bonds corresponding to Protein G’s 14 prolines were still reported as missed N–Cα cleavages.
RESULTS AND DISCUSSION
Total ETD product ion signal will decrease as reaction times are extended if the first-generation product ions are not inhibited from undergoing subsequent ETD reactions. This phenomenon is demonstrated in Figure 2A for the [M + 28H]+28 precursor of Protein G. Initially, the product ion abundance increased as precursors undergo ETD. In this interval, highly charged product ions underwent subsequent ETD reactions and further dissociation. After the precursor was completely consumed, these product ions continued to undergo ETD reactions. This resulted in a decrease in ion signal as products generated from higher-order reactions were further charge-reduced or neutralized, had m/z values outside the monitored scan range, dropped below the detection capabilities or noise threshold of the instrument, or could no longer be stably trapped in the QLT (q > 0.908). There is very little signal from product ions after ~50 ms of ETD. In contrast, when ETD-PIP is employed on the same precursor, product ion signal remained near its maximum value for up to 200 ms of ETD reaction time (Figure 2B). The ability of ETD-PIP to preserve first-generation fragment ions is demonstrated for multiple precursors of Protein G with charge densities suitable for ETD (Figure 2C–F).
Figure 2.
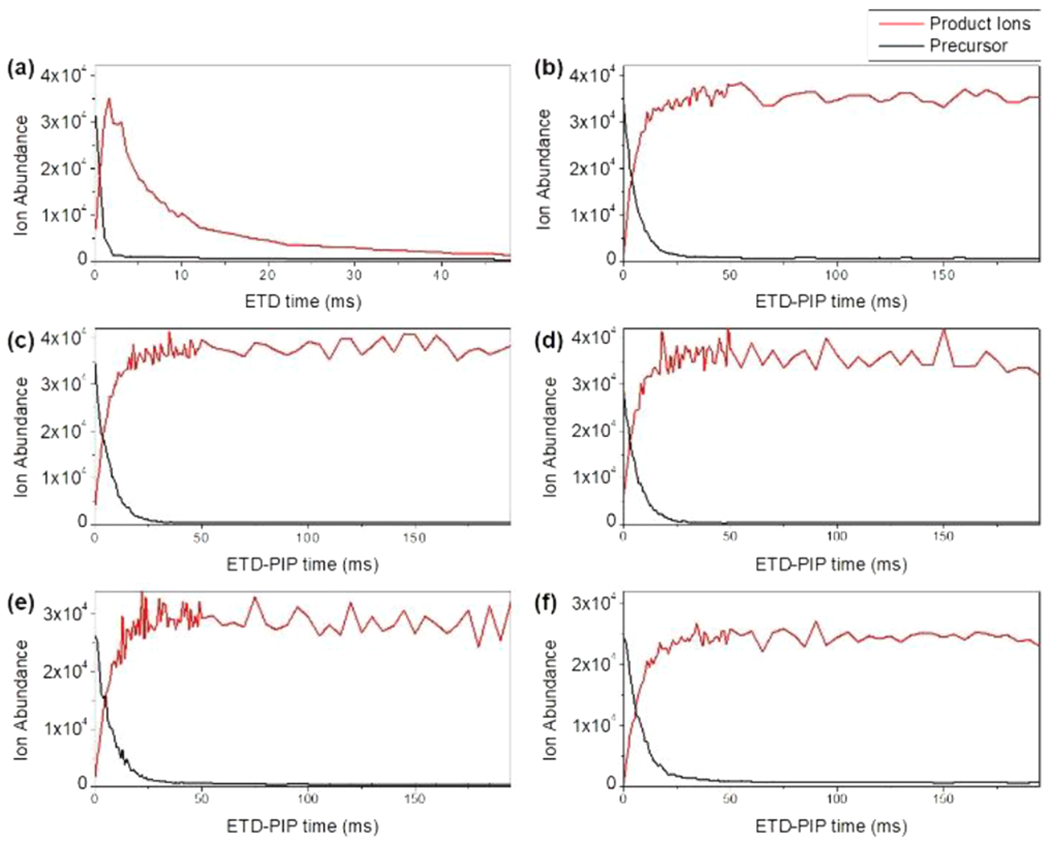
Precursors of Protein G and total ETD product ion signal are evaluated as a function of ETD reaction time. The reactions of Protein G’s [M + 28H]+28 at 767 m/z with (a) standard ETD and (b) with ETD-PIP are compared side-by-side. ETD-PIP is also demonstrated on Protein G’s (c) [M + 26H]+26 at 825 m/z, (d) [M + 24H]+24 at 894 m/z, (e) [M + 22H]+22 at 976 m/z, and (f) [M + 20H]+20 at 1073 m/z.
Ideally, all intact proteins subjected to ETD will convert to structurally informative fragment ions. However, in the absence of PIP, highly charged fragment ions will undergo secondary ETD reactions and further fragmentation. Reaction times that minimize production of higher-generation ETD fragments are short and leave a substantial amount of the precursor unreacted. ETD-PIP allows highly charged precursor ions to completely convert to product ions while preserving first-generation fragments.
Figure 3 compares spectra resulting from 4 ms of ETD (Figure 3A) and 20 ms of ETD-PIP (Figure 3B) of Protein G [M + 28H]+28. Following ETD, products were subjected to 30 ms of IIPT reactions to decrease product ion overlap and ease spectral interpretation. The ETD reaction times for both the standard ETD and ETD-PIP spectra were selected so that ~7.5% of the precursor was left unreacted to balance efficient conversion of precursor ions to product ions while avoiding unnecessary overreaction during the standard ETD reaction (SI Figure 2). Without the use of PIP, the resulting sequence coverage was 80% (inset Figure 3A). The fragment index and mass of the 110 c-type and 87 z•-type ions assigned in this analysis are presented in Figure 4A. The coverage from each ion series overlaps around the middle of the protein, providing sufficient sequence coverage from each terminus to identify most of the protein’s sequence, but the majority of fragments are less than 12 kDa. Only 39% of the assigned fragments had a complementary fragment ion assignment. The lack of higher mass fragment ions and complementary fragment ion pairs indicates overreaction, as larger ETD fragment ions were likely converted to successively smaller c/z•-type ions and internal fragments by successive ETD reactions.
Figure 3.
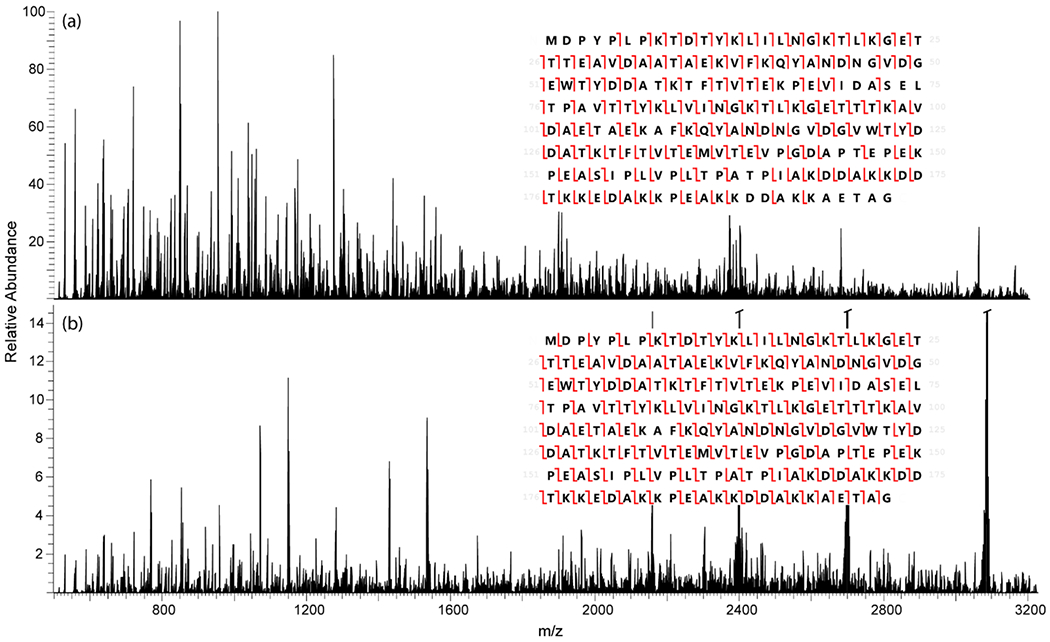
Fragment ion spectra of Protein G [M + 28H]+28 (767 m/z) after (a) 4 ms of ETD followed by 30 ms IIPT and (b) 20 ms ETD-PIP followed by 30 ms IIPT. Sequence coverage denoted in insets. Peaks that are off-scale in (b) are the charge-reduced precursor product ions.
Figure 4.
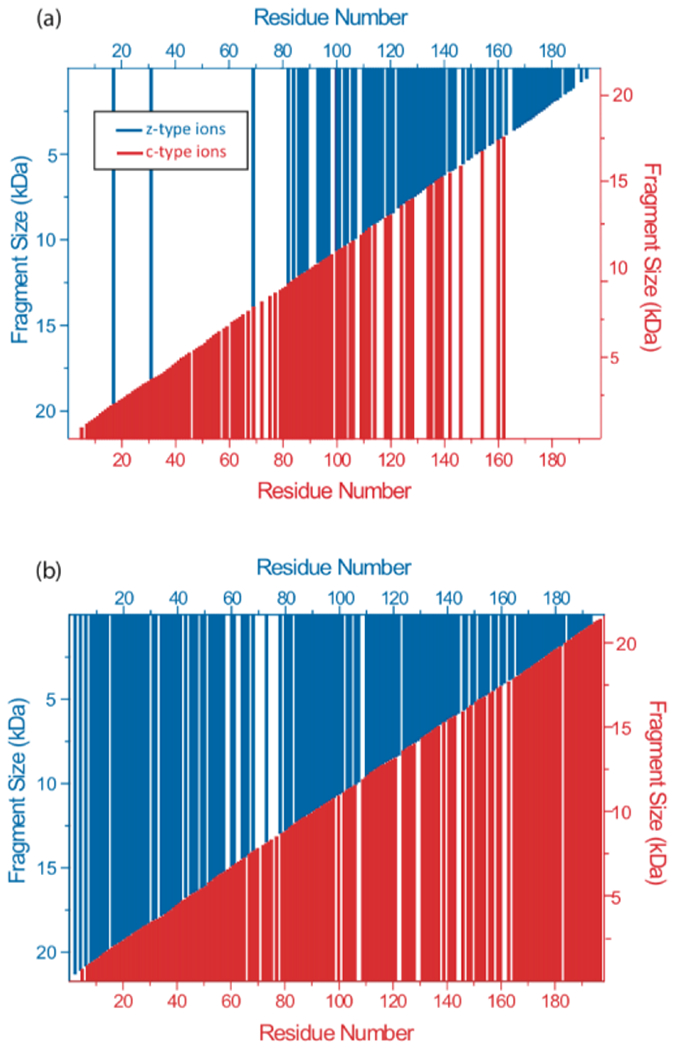
Identified c- and z•-type ions from MS/MS of Protein G [M + 28H]+28. (a) Protein G subjected to 4 ms of standard ETD followed by 30 ms IIPT (inset Figure 3A). (b) Protein G fragmented by 20 ms ETD-PIP followed by 30 ms of IIPT (inset Figure 3B).
Application of ETD-PIP for the dissociation of Protein G [M + 28H] + 28 increased the total sequence coverage to 90% from 80% for ETD without PIP. However, there was a substantial increase in the number of identified sequence fragments (Figure 3B). A total of 170 c-type and 150 z•-type fragment ions were assigned; more than double (55% more c-ions and 72% more z•-ions) the number of assignments gleaned from Figure 3A. Previously unobserved high mass fragment ions from both ion series are shown in Figure 4B. In addition, the number of complementary ion pairs increased from 39% with standard ETD to 90% with the addition of PIP, indicating a large decrease in higher-order reactions for first-generation product ions.
Consistent ETD-PIP-enabled observation of complementary fragment ion pairs should improve confidence in sequence assignments and PTM site localization. Additionally, the conservation of higher mass fragments demonstrates the promise of ETD-PIP to extend sequence coverage for high molecular weight proteins. Fragmentation spectra of intact proteins increase in complexity, as the molecular weight of the protein increases. This spectral complexity can be alleviated, but not eliminated, by use of IIPT after fragmentation.25,26 Uncontrolled excessive fragmentation (e.g., side chain fragmentation and internal fragments) further complicates spectra with fragments that are generated at the expense of sequence ion S/N and that are difficult to detect or accurately assign. A symptom of high spectral complexity and production of a large quantity of internal fragment ions is shown in red in Figure 5, termed the “picket fence” m/z peak series.27 This phenomenon is apparent in the standard ETD/IIPT spectra of Protein G (Figure 5A) but is reduced in the same m/z region in the ETD-PIP/IIPT spectra (Figure 5B). The reduction of internal fragments in ETD-PIP not only extends sequence coverage through the preservation of first-generation ETD fragments but also alleviates spectral complexity and potential “picket fence” m/z peak series.
Figure 5.
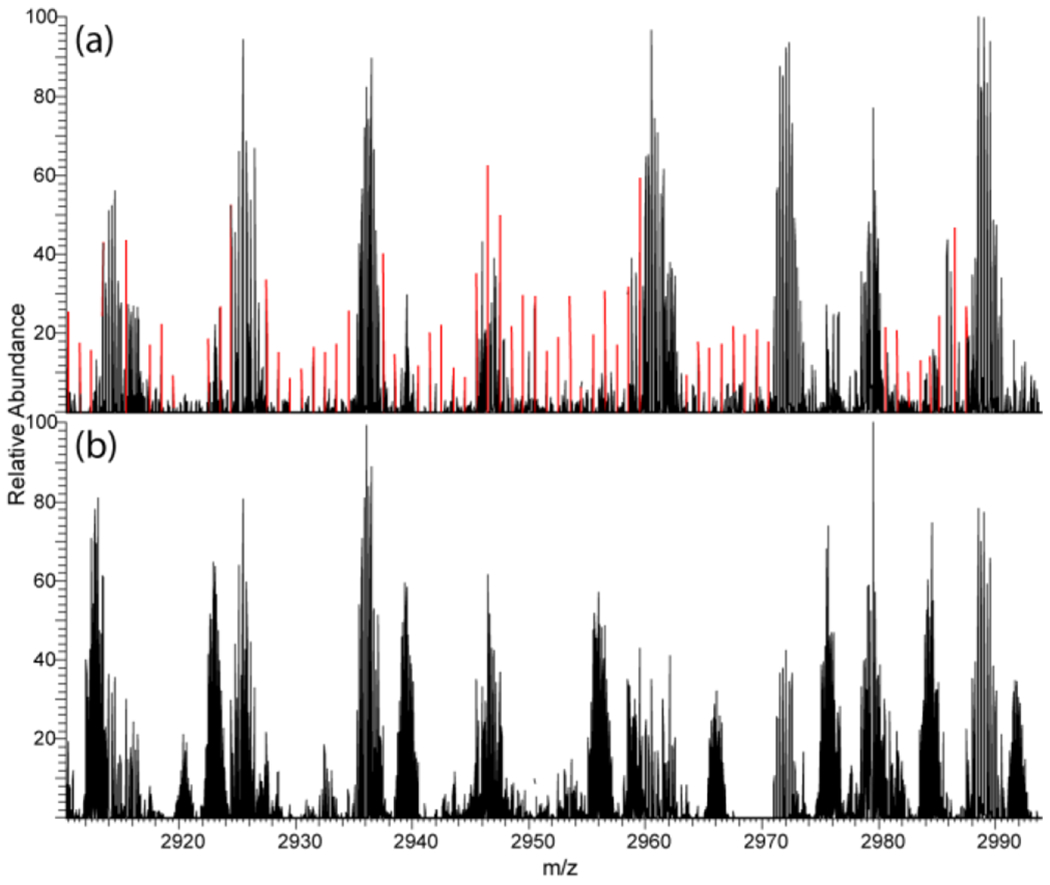
Subsection of MS/MS spectra of Protein G [M + 28H]+28 with (a) 4 ms standard ETD and (b) 20 ms ETD-PIP. The products of both ETD reactions also underwent 30 ms IIPT. “Picket fence” signals are highlighted in red.
In the comparison of ETD and ETD-PIP on Protein G [M + 28H]+28, b- and y-type ions were observed with ETD-PIP (SI Figures 3 and 4). These ions could be due to CID from excessive resonant excitation of the fragment ions during ETD-PIP. It is fortunate that the amide bonds N-terminal to prolines are particularly susceptible to CID, as this fragmentation does not produce observable c- and z•-fragments in ETD.28 The identified y-type ions provide sequence coverage for 12 of Protein G’s 14 prolines. The combination of y-, c-, and z•-type ions enhances the sequence coverage of ETD-PIP/IIPT analysis of Protein G from 90 to 96%.
CONCLUSIONS
The extension of parallel ion parking during ETD (ETD-PIP) to intact proteins efficiently converted the precursor to product ions while minimizing higher-order fragmentation. A tailored waveform was applied during ETD to excite all ETD fragment ions kinetically, thereby decreasing reaction rates of the excited ions. Protein G was used to demonstrate ETD-PIP’s ability to preserve fragment ion signal for a variety of precursor ions across ETD-suitable charge densities. Sequence coverage was compared between optimized standard ETD and ETD-PIP, yielding 80 and 90% sequence coverage, respectively. The inhibition of sequential electron transfers was reflected in the high number of complementary ion pairs from ETD-PIP (90%) compared to standard ETD (39%). In other words, complements were observed for nine out of 10 fragment ions contributing to the 90% sequence coverage obtained from ETD-PIP.
Interrogating an intact protein’s primary structure through tandem mass spectrometry is attracting increasing interest in the mass spectrometry community. Developments in methods and instrumentation have now made sequence interrogation of smaller proteins (<30 kDa) routinely accessible.29–32 ETD-PIP is an emerging method that increases the effectiveness of ETD on intact proteins and could extend the upper molecular weight range of such analyses by preserving the conversion of highly charged protein precursor ions to structurally informative sequence fragment ions. This methodology could be applied to complex proteoforms or larger proteins, in conjunction with advances in instrumentation, to study biological phenomena.
Supplementary Material
ACKNOWLEDGMENTS
Support for this work was provided by NIH grant GM037537 to D.F.H. The authors particularly thank Dina Bai and Lissa Anderson for aid in manuscript review.
Footnotes
Supporting Information
The Supporting Information is available free of charge at https://pubs.acs.org/doi/10.1021/acs.analchem.1c03652.
Necessary precursor notch width; Protein G [M+28H]+28 Orbitrap ion signal evaluated as a function of ETD or ETD-PIP reaction time; and MS/MS analysis results (PDF)
Complete contact information is available at: https://pubs.acs.org/10.1021/acs.analchem.1c03652
The authors declare no competing financial interest.
Contributor Information
Elizabeth M. Duselis, Department of Chemistry, University of Virginia, Charlottesville, Virginia 22904, United States
Maria C. Panepinto, Department of Chemistry, University of Virginia, Charlottesville, Virginia 22904, United States.
John E.P. Syka, Thermo Fisher Scientific, San Jose, California 95134, United States
Christopher Mullen, Thermo Fisher Scientific, San Jose, California 95134, United States.
Robert A. D’Ippolito, Department of Chemistry, University of Virginia, Charlottesville, Virginia 22904, United States
A. Michelle English, Department of Chemistry, University of Virginia, Charlottesville, Virginia 22904, United States.
Scott A. Ugrin, Department of Chemistry, University of Virginia, Charlottesville, Virginia 22904, United States
Jeffrey Shabanowitz, Department of Chemistry, University of Virginia, Charlottesville, Virginia 22904, United States.
Donald F. Hunt, Department of Chemistry, University of Virginia, Charlottesville, Virginia 22904, United States; Department of Pathology, University of Virginia, Charlottesville, Virginia 22903, United States
REFERENCES
- (1).Whitehouse CM; Dreyer RN; Yamashita M; Fenn JB Anal. Chem 1985, 57, 675–679. [DOI] [PubMed] [Google Scholar]
- (2).Macias LA; Santos IC; Brodbelt JS Anal. Chem 2020, 92, 227–251. [DOI] [PMC free article] [PubMed] [Google Scholar]
- (3).McLuckey SA; Reid GE; Wells JM Anal. Chem 2002, 74, 336–346. [DOI] [PubMed] [Google Scholar]
- (4).Riley NM; Westphall MS; Hebert AS; Coon JJ Anal. Chem 2017, 89, 6358–6366. [DOI] [PMC free article] [PubMed] [Google Scholar]
- (5).Holden DD; Sanders JD; Weisbrod CR; Mullen C; Schwartz JC; Brodbelt JS Anal. Chem 2018, 90, 8583–8591. [DOI] [PubMed] [Google Scholar]
- (6).Lyon YA; Riggs D; Fornelli L; Compton PD; Julian RR J. Am. Soc. Mass Spectrom 2018, 29, 150–157. [DOI] [PMC free article] [PubMed] [Google Scholar]
- (7).Weisbrod CR; Kaiser NK; Syka JEP; Early L; Mullen C, Dunyach J-J; English AM; Anderson LC; Blakney GT; Shabanowitz J; Hendrickson CL; Marshall AG; Hunt DF J. Am. Soc. Mass Spectrom 2017, 28, 1787–1795. [DOI] [PMC free article] [PubMed] [Google Scholar]
- (8).Syka JEP; Coon JJ; Schroeder MJ; Shabanowitz J; Hunt DF Proc. Natl. Acad. Sci. U. S. A 2004, 101, 9528–9533. [DOI] [PMC free article] [PubMed] [Google Scholar]
- (9).Michalski A; Neuhauser N; Cox J; Mann M J. Proteome Res 2012, 11, 5479–5491. [DOI] [PubMed] [Google Scholar]
- (10).Brodbelt JS Chem. Soc. Rev 2014, 43, 2757–2783. [DOI] [PMC free article] [PubMed] [Google Scholar]
- (11).McLuckey SA; Stephenson JL Mass Spectrom. Rev 1998, 17, 369–407. [DOI] [PubMed] [Google Scholar]
- (12).Compton PD; Strukl JV; Bai DL; Shabanowitz J; Hunt DF Anal. Chem 2012, 84, 1781–1785. [DOI] [PMC free article] [PubMed] [Google Scholar]
- (13).Rose CM; Rush MJP; Riley NM; Merrill AE; Kwiecien NW; Holden DD; Mullen C; Westphall MS; Coon JJ J. Am. Soc. Mass Spectrom 2015, 26, 1848–1857. [DOI] [PMC free article] [PubMed] [Google Scholar]
- (14).Wells JM; Chrisman PA; McLuckey SA J. Am. Chem. Soc 2003, 125, 7238–7249. [DOI] [PubMed] [Google Scholar]
- (15).McLuckey SA; Stephenson JL; Asano KG Anal. Chem 1998, 70, 1198–1202. [DOI] [PubMed] [Google Scholar]
- (16).March RE; Todd JFJ Quadrupole Ion Trap Mass Spectrometry: Second Edition, 2nd ed.; John Wiley & Sons, Inc, 2005, 165. [Google Scholar]
- (17).Snyder DT; Peng WP; Cooks RG Chem. Phys. Lett 2017, 668, 69–89. [Google Scholar]
- (18).Schwartz JC; Senko MW; Syka JEP J. Am. Soc. Mass Spectrom 2002, 13, 659–669. [DOI] [PubMed] [Google Scholar]
- (19).Chrisman PA; Pitteri SJ; McLuckey SA Anal. Chem 2006, 78, 310–316. [DOI] [PubMed] [Google Scholar]
- (20).Chrisman PA; Pitteri SJ; McLuckey SA Anal. Chem 2005, 77, 3411–3414. [DOI] [PMC free article] [PubMed] [Google Scholar]
- (21).Earley L; Anderson LC; Bai DL; Mullen C; Syka JEP; English AM; Dunyach J-J; Stafford GCJ; Shabanowitz J; Hunt DF; Compton PD Anal. Chem 2013, 85, 8385–8390. [DOI] [PMC free article] [PubMed] [Google Scholar]
- (22).Ugrin SA; English AM; Syka JEP; Bai DL; Anderson LC; Shabanowitz J; Hunt DF J. Am. Soc. Mass Spectrom 2019, 30, 2163. [DOI] [PMC free article] [PubMed] [Google Scholar]
- (23).Louris JN; Taylor DM Method and Apparatus for Ejecting Unwanted Ions in an Ion Trap Mass Spectrometer. US5324939. 1994, 5324, 939. [Google Scholar]
- (24).Fellers RT; Greer JB; Early BP; Yu X; LeDuc RD; Kelleher NL; Thomas PM Proteomics 2015, 15, 1235–1238. [DOI] [PMC free article] [PubMed] [Google Scholar]
- (25).Coon JJ; Ueberheide B; Syka JEP; Dryhurst DD; Ausio J; Shabanowitz J; Hunt DF Proc. Natl. Acad. Sci. U. S. A 2005, 102, 9463–9468. [DOI] [PMC free article] [PubMed] [Google Scholar]
- (26).Holden DD; McGee WM; Brodbelt JS Anal. Chem 2016, 88, 1008–1016. [DOI] [PubMed] [Google Scholar]
- (27).Syka JEP; Hinkle J; Mullen C; D’Ippolito R; Huguet R; Anderson LC; Shabanowitz J; Hunt DF The Strange Case of “Picket Fence” Peaks: A Study in the Complexity of MS/MS Spectra of Protein Ions. In 67th ASMS Conference on Mass Spectrometry and Allied Topics; 2019; TP 661. [Google Scholar]
- (28).Loo JA; Edmonds CG; Smith RD Anal. Chem 1993, 65, 425–438. [DOI] [PubMed] [Google Scholar]
- (29).McLuckey SA; Huang T-Y Anal. Chem 2009, 81, 8669–8676. [DOI] [PMC free article] [PubMed] [Google Scholar]
- (30).Riley NM; Mullen C; Weisbrod CR; Sharma S; Senko MW; Zabrouskov V; Westphall MS; Syka JEP; Coon JJ J. Am. Soc. Mass Spectrom 2016, 27, 520–531. [DOI] [PMC free article] [PubMed] [Google Scholar]
- (31).Shaw JB; Li W; Holden DD; Zhang Y; Griep-Raming J; Fellers RT; Early BP; Thomas PM; Kelleher NL; Brodbelt JS J. Am. Chem. Soc 2013, 135, 12646–12651. [DOI] [PMC free article] [PubMed] [Google Scholar]
- (32).Riley NM; Westphall MS; Coon JJ J. Am. Soc. Mass Spectrom 2018, 29, 140–149. [DOI] [PMC free article] [PubMed] [Google Scholar]
Associated Data
This section collects any data citations, data availability statements, or supplementary materials included in this article.


