ABSTRACT
Esophageal squamous cell cancer (ESCC) is a prevalent malignant cancer with high incidence and fatality rate. Surging evidences have revealed that circular RNAs (circRNAs) act key role in ESCC tumorigenesis and progression. Therefore, the purpose of this study is to explore the role and regulatory mechanism of a novel circGOT1 in ESCC. In the present study, the transcriptional expression of circGOT1, miR-606 and GOT1, and the epithelial–mesenchymal transition (EMT) and apoptosis-related markers were examined by quantitative PCR. The protein levels of GOT1 and glycolysis-related proteins were detected by Western blotting. In addition, the glycolytic levels were determined via measuring glucose uptake, lactate production, and ATP levels. Then, the function experiments and rescue experiments were used to investigate the function and mechanism of circGOT1 in ESCC. In addition, RNA immunoprecipitation, pull-down, and luciferase activity reporter gene assays were used to analyze the circGOT1/miR-606/GOT1 axis. The xenograft mouse mode was used to determine the function of circGOT1 in vivo. Here, we identified that circGOT1 and GOT1 upregulate, whereas miR-606 was reduced in ESCC tissues and cell lines. High circGOT1 and GOT1 expression associated with poor survival and worse prognosis of ESCC patients, but miR-606 revealed opposite traits. Mechanically, circGOT1 sponged miR-606 to promote GOT1, which induced cell proliferation, migration, aerobic glycolysis, and cisplatin resistance. The tumor growth was reduced by circGOT1 inhibition in xenograft mouse. Our results indicate the oncogene role of circGOT1 in ESCC via an endogenous competition RNA (ceRNA) mechanism to promote GOT1 expression via sponging miR-606.
KEYWORDS: circgot1, glycolysis, cisplatin resistance, GOT1, esophageal squamous cell cancer
1. Introduction
Esophageal cancer is the seventh most common cancer and the sixth reason that leads to cancer-related death in the worldwide, it causes approximate 572,000 new cases and 509,000 deaths in 2018 [1]. Esophageal cancer also exhibits the differences in incidence and mortality rates between sexes and between region, which high incidence in men more than twice as well as women, and higher in Human Development Index (HDI) countries [1,2]. Esophageal squamous cell cancer (ESCC) is a most common histological subtype of esophageal cancer and prevalence in the East Asia, eastern and southern Africa, and southern Europe [1,3]. Smoking and excessive drinking are two primary risk factors cause ESCC [4], in addition, other risk factors include the dietary habits for red meat and hot beverages or foods, genetic factors [5–9]. Usually, ESCC is commonly diagnosed by endoscopy with biopsies. And the premalignant and early stages of ESCC are treated by endoscopic procedures, and the locally advanced stages of ESCC are therapied by neoadjuvant including chemotherapy or radiotherapy or chemoradiotherapy [10]. Cisplatin is the first-line treatment for ESCC, but the therapeutic effects have been limited by cisplatin resistance [11]. Therefore, exploring the cisplatin-resistant mechanism and restoring cisplatin efficacy are vital for improving the prognosis for ESCC patients.
Recent years, glucose metabolism from mitochondrial oxidative phosphorylation (OXPHOS) shifts to aerobic glycolysis is the hallmark of cancer cells [12]. Aerobic glycolysis as known as the Warburg effect, which is an alternative pathway to generate energy for cellular processes in cancer cells under the aerobic or hypoxic conditions [13]. Commonly, tumor initiation and development not only need energy supplying, but also hanker for biomass supporting. Aerobic glycolysis emerges the pivotal role in malignant processes by fulfilling ATP and biomass synthesis [14]. The regulation of aerobic glycolysis in cancer involves multiple biological processes and glycolytic enzyme synthesis [15]. Conversion of glucose into pyruvate is the hallmark of the glycolytic generation, pyruvate produces lactate and then lactate has been extruded to extracellular environment. After that, there are multiple-regulation mechanism of substrates and enzymes are involved in glycolysis, including glycolytic intermediates synthesis, cell membrane-dependent regulation, intracellular acid–base balance, and mitochondrial functions [16]. Increasing evidences indicate that Glucose transporters (GLUTs) and key glycolytic enzyme such as hexokinase (HK), phosphofructokinase (PFK), pyruvate kinase (PK) exert the important roles in aerobic glycolysis [14–17]. It has been found that upregulation of HK2 induces aerobic glycolysis and chemoresistance in colorectal cancer [18]. Moreover, inactivation of the NMDAR-CAMKII-ERK pathway prevents aerobic glycolysis to inhibit colorectal cancer [19]. Therefore, aerobic glycolysis contributes to tumor growth through promoting ATP production, lactate production to accelerate tumor progression, tumor acidosis, antitumor therapies, and compromise antitumor immunity [20,21], modulating glycolytic reprogramming may devote to cancer therapies.
In the past decades, increasing evidences have demonstrated that abundant number of genes participant in regulating glycolytic metabolism of cancer cells. for example, UHRF1 accelerates aerobic glycolysis and proliferation in pancreatic cancer [22]. Klotho has been found to inhibit aerobic glycolysis colorectal cancer [23]. Recent years, non-coding RNAs (ncRNAs) including microRNAs (miRNAs), long non-coding RNAs (lncRNAs) and circular RNAs (circRNAs) emerge the important roles in regulating the tumor progression [24]. circRNAs commonly generate from exons and characteristics with a covalently closed-loop structure with neither 5ʹcaps and 3ʹ tails [25]. According to the development of RNA sequencing techniques and bioinformatics, various circRNAs have been explored [26]. Usually, circRNAs exert function by sponging miRNAs, RNA-binding or protein-coding proteins, and gene transcription and expression and expression regulators in cancer [27]. For instance, circRNA_0025202 suppresses cell proliferation, colony formation, and migration, and enhances cell apoptosis and sensitivity to tamoxifen by acting a sponger for miR-182-5p [28]. circRNA-5692 represses the progression of hepatocellular carcinoma by playing a sponger miR-328-5p [29]. Additionally, circRNAs also show the significant roles in modulation of glycolytic metabolism in cancer. Such as, circ-CUX1 contributes to glycolytic metabolism and neuroblastoma progression by sponging EWSR1 [30]. And hsa_circRNA_100290 accelerates cell growth by enhancing glycolysis progression and GLUT1 expression [31]. Besides, circRNF20 induces breast cancer development and glycolytic metabolism by sponging miR-487a [32].
Hence, the purpose of this study was to explore the novel circGOT1 and GOT1 roles and mechanism in ESCC. We found that circGOT1 and GOT1 expression was increased in ESCC tissues and cell lines, and they acted as oncogenes by sponging miR-606 to promote tumor growth, migration, and glycolytic metabolism.
2. Material and methods
2.1. Clinical samples
Total 68 ESCC specimens and matched normal tissues were obtained from Handan Central Hospital between July 2010 and August 2015. Our researches were approved by Ethics Committee of Handan Central Hospital, and known and singed the informed consent by patients. All participants were diagnosed as ESCC, and the clinical characteristics were recorded and analyzed. All samples were removed before locally and systematacially treated. Then, samples were snapped in liquid nitrogen and stored at −80°C for subsequent analyses.
2.2. Cell culture and transfection
ESCC cell lines KYSE150, KYSE510, TE1, TE5, and TE13, and human normal esophageal epithelial cells HEEC were obtained from Shanghai Institute of Cell Research, Chinese Academy of Sciences (Shanghai, China). All cells were cultured in a complete medium consisting of DMEM medium (Invitrogen, Carlsbad, CA, USA), 10% fetal bovine serum (FBS, Hyclone, South Logan, UT, USA), 1% penicillin–streptomycin solution (Sigma-Aldrich, St. Louis, MO, USA). The cisplatin-resistance KYSE150 (KYSE150/DDP) and KYSE510 (KYSE510/DDP) cells were established according to previous description [33]. Briefly, KYSE150 and KYSE510 cells were continuously stimulated with gradual increasing concentrations of cisplatin. Finally, the cisplatin resistance cells were incubated in a complete medium supplementary 1 µM cisplatin without antibiotics.
Silence of circGOT1 was performed by small interfering RNA, miRNA mimics and miRNA inhibitors, which designed and synthesized from GenePharma (Shanghai, China). The sequences of GOT1 were amplified and cloned into pcDNA3.1 vector to overexpress GOT1, the vectors were obtained from GenePharma (Shanghai, China). All vectors and oligoes were transfected into cells using Lipofectamine 2000 (Thermo Fisher Scientific, Waltham, MA, USA) according to the manufacturer’s suggestion.
2.3. RNA extraction and quantitative PCR
Total RNA was extracted from tissues and cells with TRIzol reagent (Life Technologies Corporation, Gaithersburg, MD, USA) following the description of the manufacturer. Additionally, the nuclear and cytosolic RNAs were separated with PARIS kit (Life Technologies, Austin, Texas, USA) following the manufacturer’s suggestion. RNA was reversed into cDNA using PrimeScript™ 1st Strand cDNA Synthesis Kit (Takara, Dalian, China), and the qPCR was performed with TB Green® Fast qPCR Mix (Takara, Dalian, China) following the manufacturer’s suggestion. Relative expression of genes was measured using the 2−∆∆Ct methods. GAPDH and U6 were used to normalize gene and miRNA expression, respectively. The primers were as following: CircGOT1, F, 5ʹ- TACTCGTGATGTGCGTAGTGC-3ʹ and R, 5ʹ-CCAGATGCGAAGCCCTGATA-3ʹ. GOT1 F, 5ʹ-GGAGCATATCGCACGGATGA-3ʹ and R, 5ʹ-AAGACGAGAAGCACAGCTCC-3ʹ. MiR-606, F, 5ʹ-CTATGATGAGGTGTGCCATCCA-3ʹ and R, 5ʹ-TGGTCAGGCACTTGTATCTTTGA-3ʹ. E-cadherin, F, 5ʹ-CACCCCCTGTTGGTGTCTTT-3ʹ and R, 5ʹ-CTGCATCTTGCCAGGTCCTT-3ʹ. N-cadherin, F, 5ʹ-CATCCAGACCGACCCAAACA-3ʹ and R, 5ʹ-CACACTGGCAAACCTTCACG-3ʹ. Vimentin, F, 5ʹ-GGACCAGCTAACCAACGACA-3ʹ and R, 5ʹ-AAGGTCAAGACGTGCCAGAG-3ʹ. Bcl-2, F, 5ʹ-CCCTTTTGCTTCAGGGGATGAT-3ʹ and R, 5ʹ-GGCGTCCCAAAGTAGGAGAG-3ʹ. Bax, F, 5ʹ-GACATTGGACTTCCTCCGGG-3ʹ and R, 5ʹ-AAGATGGTCACGGTCCAACC-3ʹ. Caspase 3, F, 5ʹ-TAGATGCTCACCCACCGTCC-3ʹ and R, 5ʹ-CCGATGGAGGAACGTCGTAG-3ʹ. GAPDH, F, 5ʹ-GGAGTCAACGGATTTGGTCG-3ʹ and R, 5ʹ-TTCCCGTTCTCAGCCATGTAG-3ʹ. U6, F, 5ʹ-GAACTGCTTCATTCGGGGCT-3ʹ and R, 5ʹ-TGGGACTTGGGGTTATGGGT-3ʹ.
2.4. RNA digestion assay
The stability and circular structure of circGOT1 were determined by RNA digestion assay with actinomycin D and RNase R. Briefly, 5 µg total RNA was incubated with 2 mg/mL actinomycin D (Sigma-Aldrich, St. Louis, MO, USA) for 4 h, 8 h and 12 h, or incubated with 3 U/µg RNase R (Sigma-Aldrich, St. Louis, MO, USA) at 37°C for 30 min, respectively. The expression levels of circGOT1 and GOT1 were detected using qPCR and normalized with GAPDH.
2.5. CCK-8 assay
Cell viability was measured with CCK-8 assay in our study. The cells were plated onto the 96-well plates at density of 1000 cells/well and incubated with vectors or oligoes or cisplatin (0, 2.5, 5, 10 µM) for 24 h and 48 h, then 10 µL CCK-8 solution (Beyotime, Shanghai, China) was added into each well and incubated for another 2 h. Finally, the absorbance at 450 nm was measured using a microplate reader (Invitrogen, Carlsbad, CA, USA).
2.6. Migration assay
Cell migration was estimated using migration assay with a transwell inserts (8 µm pore size; Corning, NY, USA). The transfected cells were preincubated in serum-free medium for 24 h, then 1 × 10⁶ cells/200 µL were transferred onto the upper chambers of the chamber, and 800 µL complete medium containing 20% FBS was added into lower chamber. The cells were incubated at 37°C for 24 h. After that, the cells on the bottom of chamber were fixed with 4% paraformaldehyde (PFA) for 15 min and stained with 0.1% crystal violet for 30 min. The migrated cells were observed and photographed under a microscope (Leica, Wetzlar, Germany).
2.7. RNA immunoprecipitation (RIP) and RNA pull-down assays
The relationship between circGOT1 and miR-606 or between GOT1 and miR-606 was determined by RIP and RNA pull-down assays. the Magna RIP TM RNA Binding Protein Immunoprecipitation Kit (Millipore, Bedford, MA, USA) was used to perform the RIP assay following the manufacturer’s instruction. In brief, ESCC cells were lysed in RIP buffer and incubated with the antibody against Argonaute 2 (Anti-Ago2; Abcam, Cambridge, MA, USA) or immunoglobulin G (anti-IgG; Abcam, Cambridge, MA, USA)-probed magnetic beads. The expression of circGTO1 and GOT1 was measured by qPCR.
In addition, RNA pull-down was performed with the Pierce Magnetic RNA-Protein Pull-Down Kit (Thermo Fisher Scientific, Waltham, MA, USA) according to the manual of the manufacturer. Briefly, the miR-606 biotinylated probe (bio-miR-606) and its negative control (bio-NC) were designed and synthesized. The cell lysates were incubated with probe-coated beads for 2 h at 4°C. The beads then were washed and enriched complex was calculated by qPCR.
2.8. Dual-luciferase reporter gene assay
Dual-luciferase reporter gene assay was used to analyze the relationship between miR-606 and GOT1. According to the previous description [34], the wild type or mutant of GOT1 (GOT1-WT or GOT1-MUT) was amplified and inserted into a pmir-GLO dual-luciferase vector. Then, ESCC cells were co-transfected with above reporter vectors and miR-606 mimic or NC mimic using Lipofectamine 2000 (Thermo Fisher Scientific, Waltham, MA, USA) for 48 h according to the manufacturer’s manual. After that, the luciferase activity was measured with dual-luciferase reporter assay system (Promega, Madison, WI, USA) obeying to the suggestion of the manufacturer.
2.9. Glycolytic level analysis
Glycolytic levels were determined by Glucose Uptake Assay (Abcam, Cambridge, MA, USA), Lactate-Glo™ Assay (Promega, Madison, WI, USA) and ATP Assay Kit (Beyotime, Shanghai, China) according the manual of manufacturer.
2.10. Western blot assay
Cells and tissue homogenate were lysed using RIPA lysis buffer (Beyotime, Shanghai, China) according to the manufacturer’s protocol. The concentration of protein was estimated using Enhance BCA protein assay kit (Beyotime, Shanghai, China) according to the manufacturer’s protocol. Then proteins were separated by 10% SDS-PAGE and then transfected to PVDF membranes (Millipore, Bedford, MA, USA). After the membranes were blocked with 10% nonfat milk at room temperature for 2 h, the special primary antibodies were incubated with the membranes overnight at 4°C. Following the membranes were incubated with (HRP-labeled Goat Anti-Rabbit IgG(H + L) secondary antibody (Beyotime, Shanghai, China) at room temperature for 1 h. The signal of bands was visualized using ECL chemiluminescence detection kit (Thermo Fisher Scientific, Waltham, MA, USA). The protein levels were normalized by GAPDH. The primary antibodies in this study as following, PKM (ab150377, 1:2000; Abcam, Cambridge, MA, USA), HK2 (ab209847, 1:1000; Abcam, Cambridge, MA, USA), LDHA (ab52488, 1:5000; Abcam, Cambridge, MA, USA), GOT1 (ab239487, 1:2000; Abcam, Cambridge, MA, USA), GAPDH (ab181602, 1:10,000; Abcam, Cambridge, MA, USA).
2.11. Xenograft nude mouse model
Four to six-week-old male C57BL/6 nude mice were randomly divided into two group, the mice were accepted subcutaneous injection with the KYSE150 cells silence of circGOT1 as the si-circGOT1 group, and the control group mice were injected the KYSE150 cells transfected with si-NC. The size of tumor was measured every 7 days for 28 day. After 28 day, mice were sacrificed, and the tumors were separated for forthcoming experiment. All animal experiments of this study were proved by the Animal Care Ethics Committee of Hebei Medical University.
2.12. Statistical analysis
In present study, statistical analysis was performed using GraphPad Prism 8.0. The data were showed as mean ± SD. The Student’s t-test was used to comparison differences of two group, as well as one-way analysis of variance (ANOVA) was used to comparison differences more than two group. P < 0.05 was considered statistical significance.
3. Results
3.1. CircGOT1 and its host gene GOT1 upregulated and associated with poor prognosis of ESCC
We firstly examined the expression of circGOT1 and its host gene GOT1 in ESCC tissues and cell lines. The qPCR results revealed that both circGOT1 and GOT1 upregulated in ESCC tissues compared to normal tissues (Figure 1(a-e)). In addition, both circGOT1 and GOT1 upregulation were observed in tumors with larger size (Figure 1(b-f)). As well as circGOT1 and GOT1 were abundantly enriched in poorer clinical stages (Figure 1(c,d), 1(g,h)). Moreover, high expression of circGOT1 and GOT1 associated with shorter survival time of ESCC patients (Figure 1 (i,j)). Then, the expression of circGOT1 and GOT1 in ESCC cell lines and human normal esophageal epithelial cells was detected by qPCR, and the results indicated both circGOT1 and GOT1 increased in ESCC cell lines compared to HEEC (Figure 1 (k,l)). These data suggested that circGOT1 and GOT1 upregulation associated with poor prognosis of ESCC patients.
Figure 1.
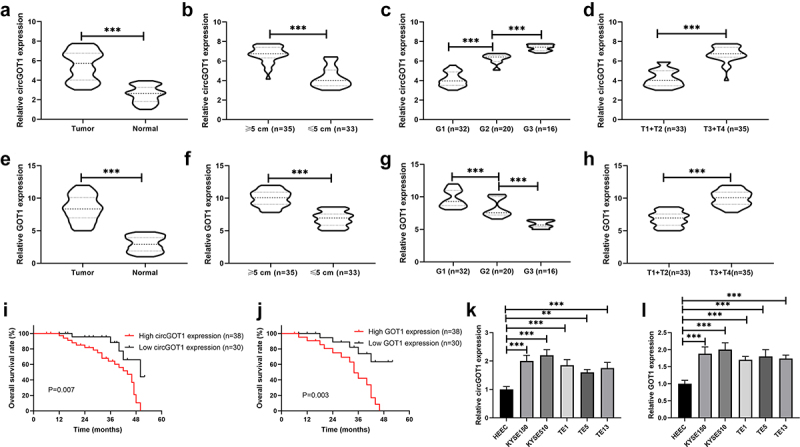
CircGOT1 and its host gene GOT1 upregulated and associated with poor prognosis of ESCC. (a-d). The qPCR analysis was used to validate the expression of circGOT1 in 68 ESCC tissues and matched normal tissues with different size (≥5 cm, n = 35; ≤5 cm, n = 33), tumor grades (G1, n = 32; G2, n = 20; G3, n = 16) and pathological stages (T1+ T2, n = 33; T3+ T4, n = 35). (e-h). The qPCR analysis was use to examine the expression of GOT1 in 68 ESCC tissues and matched normal tissues with different size (≥5 cm, n = 35; ≤5 cm, n = 33), tumor grades (G1, n = 32; G2, n = 20; G3, n = 16) and pathological stages (T1+ T2, n = 33; T3+ T4, n = 35). (i-j). The Kaplan-Meier survival curves analysis indicate the high and low expression of circGOT1 and GOT1 associated overall survival. (k-l). The qPCR analysis was used to detect the expression of circGOT1 and GOT1 in WSCC cell lines (KYSE150, KYSE510, TE1, TE5, and TE13) and human normal esophageal epithelial cells HEEC. **P < 0.01; ***P < 0.001.
3.2. CircGOT1 generated from exon 8 of GOT1 via back-splicing
We further to investigate the sources and characteristics of circGOT1. Based on the University of California Santa Cruz (UCSC) database (https://genome.mdc-berlin.de/index.html) and Circular RNA Interactome (https://circinteractome.nia.nih.gov/index.html), circGOT1 was found that located in the chromosome 10 and generated from exon 9 of GOT1 by back-splicing (1277 bp), and circGOT1 was predicated abundant in cytoplasm (Figure 2(a)). The stable ability and structure of circGOT1 were examined by actinomycin D and RNase R treatment, as shown in (Figure 2(b–e)), the GOT1 was significantly digested by actinomycin D and RNase R rather than circGOT1. In addition, the circGOT1 abundantly enriched in cytoplasm (Figure 2(f,g)). Our results indicated circGOT1 possessed stable circular structure and generated from its host gene GOT1.
Figure 2.
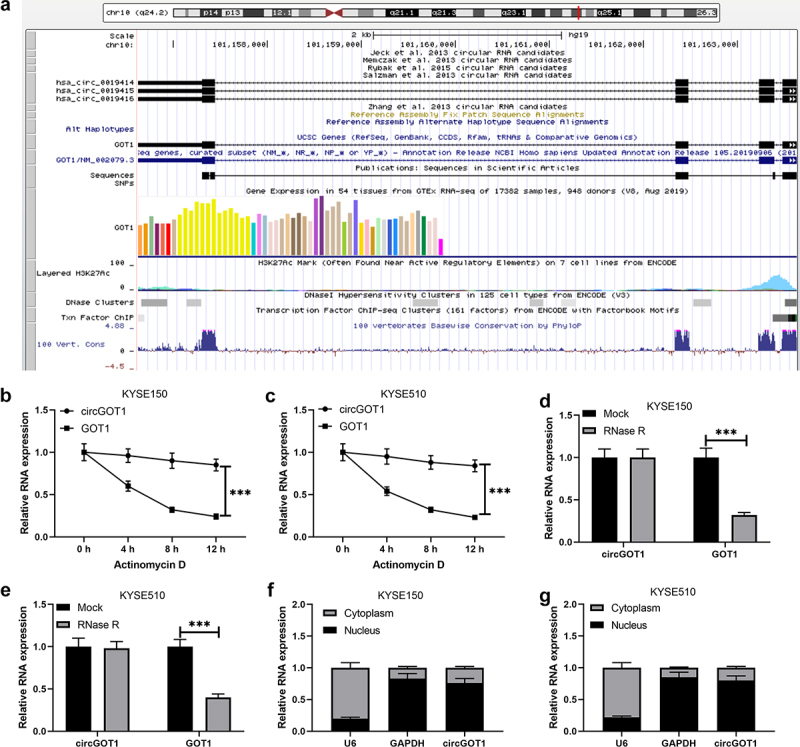
CircGOT1 generated from exon 8 of GOT1 via back-splicing. (a). Profile from the UCSC (https://genome.mdc-berlin.de/index.html) illustrated that circGOT1 generated from its host gene GOT1. (b-c). The qPCR analysis was used to determine the expression of circGOT1 and GOT1 after treatment with 2 mg/mL actinomycin D for 4 h, 8 h, 12 h. (d-e). The qPCR analysis was used to validate the expression of circGOT1 and GOT1 after treatment with 3 U/µg RNase R. (f-g). The qPCR analysis was used to validate the expression of circGOT1, U6, and GAPDH in nucleus and cytoplasm, respectively. ***P < 0.001.
3.3. Silence of circGOT1 suppressed cell proliferation and migration in ESCC
We then explored the effects of circGOT1 on the proliferation and mobility of ESCC cells. CircGOT1 was downregulated in KYSE150 and KYSE510 cells by using small interfering RNA (Figure 3(a)). The CCK-8 assay results revealed that cell proliferation was inhibited by silence of circGOT1 in a dose and time-dependent manner compared with negative control (Figure 3(b,c)). The cell migration was analyzed by transwell, the results demonstrated that cell migration was repressed by circGOT1 knockdown (Figure 3(d,e)). In addition, the EMT markers and apoptotic markers were detected by qPCR, the qPCR results detected that epithelial cell marker E-cadherin increased, and the mesenchymal cell markers N-cadherin and vimentin reduced by circGOT1 downregulation (Figure 3(f,g)). The anti-apoptotic gene Bcl-2 reduced, and the pro-apoptotic genes Bax and caspase 3 elevated by silence of circGOT1 (Figure 3(h,i)). Our finding suggested that knockdown of circGOT1 exerted the inhibitory capacity on cell proliferation and mobility of ESCC cells.
Figure 3.
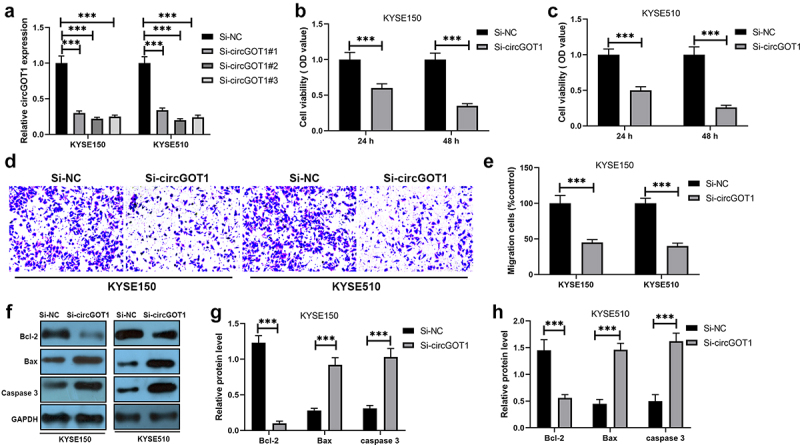
Silence of circGOT1 suppressed cell proliferation and migration in ESCC. (a). The qPCR was used to analyze the efficiency of circGOT1 inhibition. (b-c). CCK-8 assay was used to detect the cell viability after knockdown of circGOT1 for 24 h and 48 h. (d-e). Transwell was used to determine the migrated cells after knockdown of circGOT1. (f-g). The qPCR was used to detect the expression of E-cadherin, N-cadherin, and vimentin. (h-i). The qPCR was used to examine the expression of Bcl-2, Bax, and caspase 3. ***P < 0.001.
3.4. Silence of circGOT1 reversed cisplatin resistance to ESCC
We also determined the effects of circGOT1 on chemotherapeutic efficacy in ESCC. The CCK-8 assay results showed that the antitumor effects of DDP on the DDP-resistant ESCC cells were enhanced by knockdown of circGOT1 (Figure 4(a,b)). Additionally, the IC50 values of DDP in DDP-resistant ESCC were reduced by silence of circGOT1 (Figure 4(c)). The results revealed that circGOT1 knockdown restored the chemosensitivity of DDP-resistant ESCC cells to cisplatin.
Figure 4.

Silence of circGOT1 reversed cisplatin resistance to ESCC. (a-b). CCK-8 assay was used to measure the cell viability after knockdown of circGOT1 and treatment with increasing concentration of cisplatin (0, 2.5, 5, 10 µM). ©. The IC50 value of cisplatin was calculated after knockdown of circGOT1. ***P < 0.001.
Silence of circGOT1 inhibited glycolytic metabolism in ESCC
We further investigated the molecular mechanism of circGOT1 knockdown inhibits cell proliferation, mobility, and reverses chemoresistance of ESCC cells to cisplatin. Therefore, the glycolysis level was detected in this study. The glucose consumption, lactate production, and ATP levels were reduced by circGOT1 inhibition (Figure 5(a–c)). In addition, the protein levels of PKM, HK2 and LDHA were detected by silence of circGOT1 (Figure 5(d–f)). These results exhibited that the circGOT1 knockdown repressed glycolysis in ESCC cells.
Figure 5.
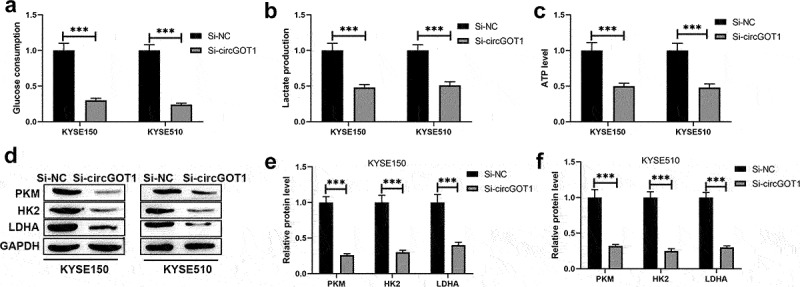
Silence of circGOT1 inhibited glycolytic metabolism in ESCC. (a-c). The glycolytic levels were determined by glucose uptake, lactate production, and ATP levels after knockdown of circGOT1. (d-f). The protein levels of PKM, HK2, and DHA were detected by Western blotting after knockdown of circGOT1. ***P < 0.001.
3.5. CircGOT1 promoted GOT1 expression via sponging miR-606
To investigate the regulatory relationship between circGOT1 and GOT1, and to examine the regulatory mechanism of circGOT1 in ESCC. According to the bioinformatic investigation on Circular RNA Interactome (https://circinteractome.nia.nih.gov/index.html) and Targetscan (http://www.targetscan.org/vert_72/) online software, miR-606 was predicated binding with circGOT1 and GOT1 (Figure 6(a)). The qPCR results revealed that miR-606 decreased in tumor tissues compared to normal tissues (Figure 6(b)). miR-606 lower expressed in larger tumors and poorer clinical stages (Figure 6(c–e)). High miR-606 expression associated with longer survival time of ESCC patients (Figure 6(f)). In addition, the correlation analysis showed that circGOT1 positively correlated with GOT1, circGOT1 negatively correlated with miR-606, and miR-606 negatively correlated with GOT1 (Figure 6(g–i)). The expression of miR-606 also reduced in ESCC cell lines compared with HEEC (Figure 6(j)). After that, the relationship between circGOT1 and miR-606, and the relationship between miR-606 and GOT1 were detected by RIP, RNA pull-down, and luciferase reporter gene assay. We found that circGOT1 and GOT1 were enriched by against Ago2 compared with IgG antibody (Figure 6(k,l)). Moreover, the beads probed with miR-606 could pull down cricGOT1 and GOT1 in contrast with control (Figure 6(m,n)). Furthermore, the luciferase activity of GOT1-wt was reduced by overexpression miR-606, whereas there was no obvious change in GOT1-mut (Figure 6(o,p)). Consistently, the expression of GOT1 was reduced by miR-606 overexpression at transcriptional and posttranscriptional levels (Figure 6(q,s)). Above results showed the circGOT1 promoted GOT1 expression by sponging miR-606 in ESCC.
Figure 6.
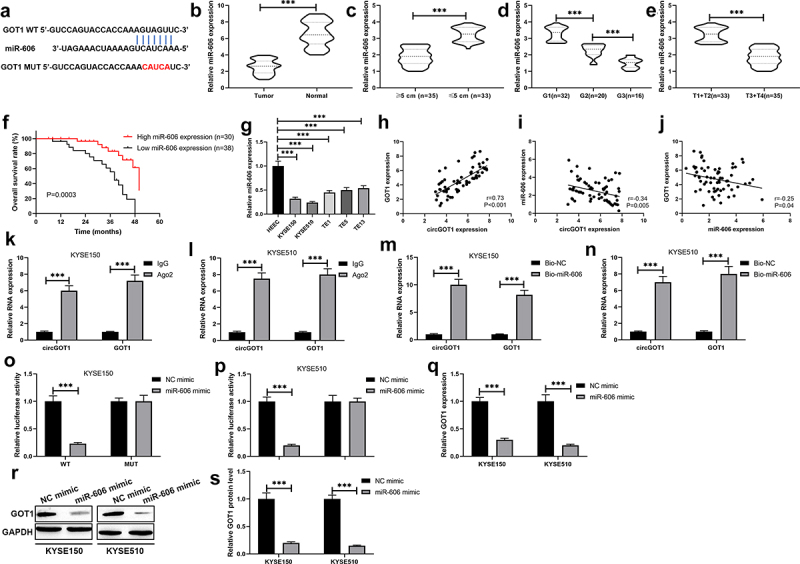
CircGOT1 promoted GOT1 expression via sponging miR-606. (a). The binding sites of miR-606 at 3ʹUTR of GOT1 were precited using Targetscan (http://www.targetscan.org/vert_72/) online software. (b-e). The qPCR analysis was used to determine the expression of miR-606 in 68 ESCC tissues and matched normal tissues with different size (≥5 cm, n = 35; ≤5 cm, n = 33), tumor grades (G1, n = 32; G2, n = 20; G3, n = 16) and pathological stages (T1+ T2, n = 33; T3+ T4, n = 35). (f). The Kaplan-Meier survival curve analysis reveals the high and low expression of miR-606 associated overall survival. (g-i). Association between the expression of circGOT1 and GOT1, circGOT1 and miR-606, miR-606 and GOT1 was determined by Pearson’s correlation analysis. (j). The qPCR analysis was used to analyze the expression of miR-606 in WSCC cell lines (KYSE150, KYSE510, TE1, TE5, and TE13) and HEEC. K-L. RIP assay was used to demonstrate the enrichment by circGOT1 and GOT1 in anti-Ago2 antibody instead of anti-IgG antibody. M-N. RNA-pulldown assay was used to immune-precipitate circGOT1 and GOT1. (o-p). Dual-luciferase activity assay was used to demonstrate miR-606 directly binds with GOT1. (q). The qPCR analysis was used to detect the expression of GOT1 after miR-606 upregulation. (r-s). The Western blotting was used to examine the protein levels of GOT1 after miR-606 upregulation. ***P < 0.001.
3.6. CircGOT1 exerted carcinogenesis in ESCC by regulating miR-606/GOT1 axis
We further investigated the regulatory mechanism of circGOT1 upregulates GOT1 via sponging miR-606 using rescue experiments. The CCK-8 assay results indicated that cell viability of DDP-resistance ESCC cells and their parental cells were repressed by knockdown of circGOT1, but the inhibition effects of circGOT1 were revered by miR-606 silencing and GOT1 upregulation (Figure 7(a,b)). Silence of miR-606 and overexpression of GOT1 reversed the effects of circGOT1 knockdown on cell migration, EMT marker expression, and apoptosis-related genes (Figure 7(c–h)). Consistently, the glycolytic levels were repressed by circGOT1 knockdown, whereas the function of circGOT1 knockdown was restrained by miR-606 reducing and GOT1 overexpression (Figure 7(i–n)). Taken together, circGOT1 function as an oncogene by regulating miR-606/GOT1 axis in ESCC.
Figure 7.
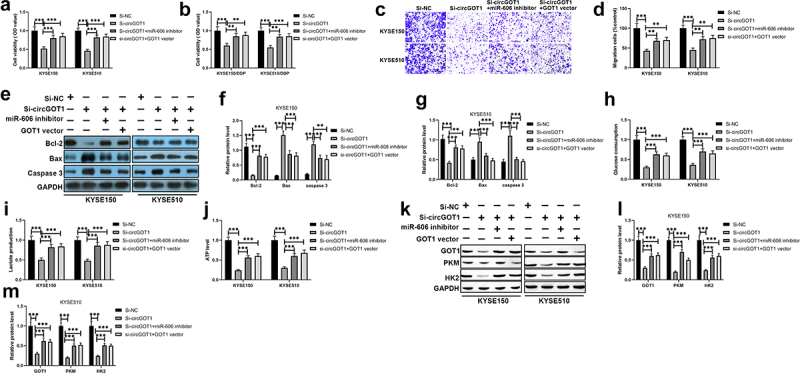
CircGOT1 exerted carcinogenesis in ESCC by regulating miR-606/GOT1 axis. (a-b). CCK-8 assay was used to detect the cell viability after circGOT1 knockdown and then restored by miR-606 inhibition or GOT1 upregulation. (c-d) Transwell was used to determine the migrated cells after circGOT1 knockdown and then restored by miR-606 inhibition or GOT1 upregulation. (e-f). The qPCR was used to detect the expression of E-cadherin, N-cadherin, and vimentin after circGOT1 knockdown and then restored by miR-606 inhibition or GOT1 upregulation. (g-h). The qPCR was used to examine the expression of Bcl-2, Bax, and caspase 3 after circGOT1 knockdown and then restored by miR-606 inhibition or GOT1 upregulation. (i-k). The glycolytic levels were determined by glucose uptake, lactate production, and ATP levels after circGOT1 knockdown and then restored by miR-606 inhibition or GOT1 upregulation. (l-n). The protein levels of PKM, HK2, and DHA were detected by Western blotting after circGOT1 knockdown and then restored by miR-606 inhibition or GOT1 upregulation. **P < 0.01; ***P < 0.001.
3.7. Silence of circGOT1 repressed tumor growth in vivo
We also detected the function of circGOT1 in vivo using a xenograft mouse model. CircGOT1 was stably recued in KYSE150 cells and subcutaneously transplanted into nude mice. The tumor size and weight were reduced by knockdown of circcGOT1 compared to control group (Figure 8(a-c)). In addition, the qPCR results showed that expression of miR-606, EMT markers and apoptosis-related genes were reduced by circGOT1 silencing (Figure 8(d–f)). The Western blotting results also exhibited the protein levels of GOT1, PKM, HK2 and LDHA were suppressed by knockdown of circGOT1. Our results indicated circGOT1 exerted an oncogene role in ESCC.
Figure 8.
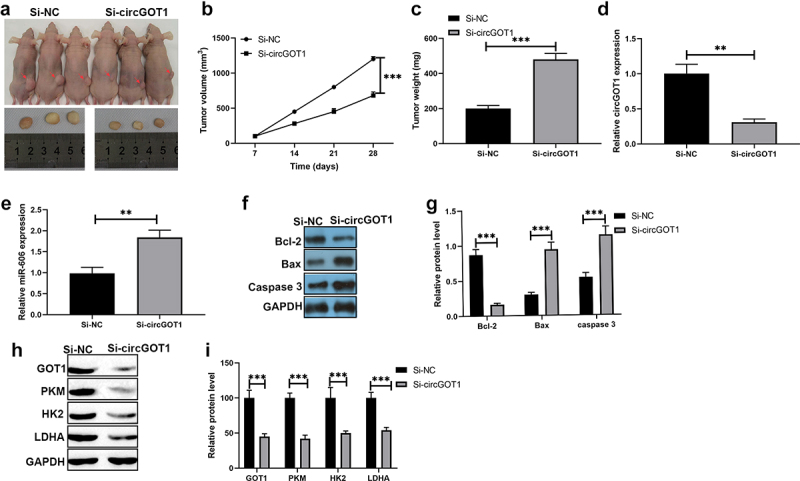
Silence of circGOT1 repressed tumor growth in vivo. (a-c). Tumor separated from mice and the size was measured by tumor weight and tumor volume. (d). The qPCR was used to determine the expression of E-cadherin, N-cadherin, and Vimentin after circGOT1 knockdown. (e). The qPCR was used to detect the expression of Bcl-2, Bax, caspase 3 after circGOT1 inhibition. (f-g). The Western blotting was used to examine the protein levels of GOT1, PKM, HK2, and LDHA after circGOT1 inhibition. ***P < 0.001.
4. Discussion
Accumulating evidences have illustrated that glycolytic metabolism is an vital hallmark of malignant tumors, which promotes biosynthesis, generates less ATP, inhibits apoptosis and produces lactate to enhance cancer cell survival, growth and mobility [35]. Mounting researches have been indicated that glycolysis involves in chemoresistance in various tumors [36]. For instance, MICU1 accelerates glycolysis and chemoresistance in ovarian cancer, which can be used as the therapeutic target [37]. In addition, CIK1 has been reported to contribute to chemoresistance in glioma cells through glycolytic metabolism [38]. Glycolysis is essential for chemoresistance in colorectal cancer by overexpression of TRPCC5 [39]. It also has been found that increasing lactate production contributes to chemoresistance in non-small cell lung cancer [40]. Inhibition of glycolysis by Rh4 in ESCC exerts the antitumor effects [41]. MAFG-AS1 promotes ESCC cell proliferation, migration, invasion and glycolysis to enhance malignant progression [42]. Despite there are lots of reports have demonstrated glycolysis links to tumorous growth and development, there is rare evidences about the regulatory role and mechanism of glycolysis for chemoresistance in ESCC. In the present study, we found circGOT1 and its host gene GOT1 both upregulated, but miR-606 decreased in ESCC tissues and cells. Gain- and loss-of-function experiments indicated that circGOT1 and GOT1 both accelerated tumor cell proliferation, metastasis, and glycolysis in vitro and in vivo. Mechanistically, circGOT1 exerted oncogene role in ESCC by sponging miR-606 to overexpress GOT1 in ESCC.
CircRNAs have been known that are generated from back splicing or exon skipping of the precursor mRNA of their host genes [43]. circRNAs also have been validated to act the important roles in tumor progression through modulating cell processes including proliferation, migration, invasion, and apoptosis, and regulating metabolic pathways including glycolytic metabolism, fatty acid metabolism, lipid metabolism [44–46]. Such as, circRNA-002178 suppresses cell proliferation, migration, and invasion in bladder cancer via sponging miR-494 to promote PTEN expression [47]. CircHIPK3 contributes to cell growth and metastasis, and represses apoptosis in colorectal cancer by targeting miR-7 [48]. CircACAP2 accelerates breast cancer proliferation and motility by acting as a sponger for miR-29a/b-3p to overexpress COL5A1 [49]. Circ-MAT2B enhances cell viability, colony formation, DNA synthesis, glycolytic metabolism in gastric cancer through sponging miR-515-5p to increase HIF-1α expression [50]. CircACC1 also has been demonstrated to promote acid β-oxidation, glycolysis, and cellular lipid accumulation in colorectal cancer [51]. In the present study, we revealed a novel circRNA, circGOT1 played as an oncogene in ESCC promoted cell proliferation, migration, glycolytic metabolism, and repressed apoptosis via sponging miR-606 to increase GOT1 expression.
GOT1 belongs to the aspartate aminotransferase, which catalyzes the reversible reaction of L-aspartate and α-ketoglutarate (KG) into oxaloacetate and L-glutamate to regulate both anabolic and catabolic pathways [52,53]. GOT1 is a resident in cytoplasm and links malignant process in multiple tumors, and increasing evidences have demonstrated that GOT1 accelerates tumor progression not only modulating amino acid metabolism, but also regulating glycolysis metabolism in tumors [54,55]. For example, GOT1 maintains redox homeostasis and cell proliferation to facilitate pancreatic cancer growth [56]. High expression of GOT1 induces chronic acidosis in pancreatic ductal adenocarcinoma by promoting glycolysis and inhibiting oxidative metabolism [53]. Additionally, GOT1 exerts oncogene in lung adenocarcinoma through supplying to carbohydrates and amino acids to nutrient support [55]. Above studies indicate that GOT1 acts as an important oncogene role in various tumors by regulating cellular metabolism. However, there barely reports about the function of GOT1 and regulatory mechanism of GOT1 in ESCC. In the present study, we are firstly found GOT1 overexpressed in ESCC tissues and cells lines by function as ceRNA. Based on bioinformatic searching on the UCSC database, we verified the host gene GOT1 of circGOT1, which implied the interaction between circGOT1 and GOT1. And the relationship between circGTO1 and GOT1 were confirmed by RIP and RNA pull-down assays and rescue experiments in this study. Moreover, our results consistent with previous study that cirGOT1 and GOT1 exerted oncogene role in ESCC by promoting cell proliferation, migration, and glycolytic metabolism.
5. Conclusion
Summary, we demonstrated that cirGOT1 acted as an oncogene in ESCC by sponging miR-606 to upregulate GOT1 via inducing aerobic glycolysis. Our finding provided the new insight into ESCC malignance and supplied novel therapeutic targets for ESCC treatment.
Funding Statement
The author(s) reported there is no funding associated with the work featured in this article.
Disclosure statement
No potential conflict of interest was reported by the author(s).
Ethical approval
Our study has been approved by the Animal Care Ethics Committee of Handan Central Hospital. All animal experiments of this study were proved by the Animal Care Ethics Committee of Hebei Medical University.
References
- [1].Bray F, Ferlay J, Soerjomataram I, et al. Global cancer statistics 2018: GLOBOCAN estimates of incidence and mortality worldwide for 36 cancers in 185 countries. CA Cancer J Clin. 2018;68:394–424. [DOI] [PubMed] [Google Scholar]
- [2].Lagergren J, Smyth E, Cunningham D, et al. Oesophageal cancer. Lancet. 2017;390:2383–2396. [DOI] [PubMed] [Google Scholar]
- [3].Malhotra GK, Yanala U, Ravipati A, et al. Global trends in esophageal cancer. J Surg Oncol. 2017;115:564–579. [DOI] [PubMed] [Google Scholar]
- [4].Batra R, Malhotra GK, Singh S, et al. Managing squamous cell esophageal cancer. Surg Clin North Am. 2019;99(3):937–941. [DOI] [PubMed] [Google Scholar]
- [5].Prabhu A, Obi KO, Rubenstein JH.. The synergistic effects of alcohol and tobacco consumption on the risk of esophageal squamous cell carcinoma: a meta-analysis. Am J Gastroenterol. 2014;109(6):822–827. [DOI] [PubMed] [Google Scholar]
- [6].Zhu HC, Yang X, Xu LP, et al. Meat consumption is associated with esophageal cancer risk in a meat- and cancer-histological-type dependent manner. Dig Dis Sci. 2014;59:664–673. [DOI] [PubMed] [Google Scholar]
- [7].Andrici J, Eslick GD.. Hot food and beverage consumption and the risk of esophageal cancer: a meta-analysis. Am J Prev Med. 2015;49(6):952–960. [DOI] [PubMed] [Google Scholar]
- [8].Akbari MR, Malekzadeh R, Shakeri R, et al. Candidate gene association study of esophageal squamous cell carcinoma in a high-risk region in Iran. Cancer Res. 2009;69:7994–8000. [DOI] [PMC free article] [PubMed] [Google Scholar]
- [9].Huang F-L, Yu S-J. Esophageal cancer: risk factors, genetic association, and treatment. Asian J Surg. 2018;41(3):210–215. [DOI] [PubMed] [Google Scholar]
- [10].Lordick F, Mariette C, Haustermans K, et al. Oesophageal cancer: ESMO clinical practice guidelines for diagnosis, treatment and follow-up. Ann Oncol. 2016;27:v50–v7. [DOI] [PubMed] [Google Scholar]
- [11].Giacomini I, Ragazzi E, Pasut G, et al. The Pentose phosphate pathway and its involvement in cisplatin resistance. Int J Mol Sci. 2020;21(3):937. [DOI] [PMC free article] [PubMed] [Google Scholar]
- [12].Enzo E, Santinon G, Pocaterra A, et al. Aerobic glycolysis tunes YAP/TAZ transcriptional activity. EMBO J. 2015;34:1349–1370. [DOI] [PMC free article] [PubMed] [Google Scholar]
- [13].Vander Heiden MG, Cantley LC, Thompson CB. Understanding the Warburg effect: the metabolic requirements of cell proliferation. Science (New York, NY). 2009;324(5930):1029–1033. [DOI] [PMC free article] [PubMed] [Google Scholar]
- [14].Wu Z, Wu J, Zhao Q, et al. Emerging roles of aerobic glycolysis in breast cancer. Clin Transl Oncol. 2020;22:631–646. [DOI] [PubMed] [Google Scholar]
- [15].Vaupel P, Schmidberger H, Mayer A. The Warburg effect: essential part of metabolic reprogramming and central contributor to cancer progression. Int J Radiat Biol. 2019;95(7):912–919. [DOI] [PubMed] [Google Scholar]
- [16].Ganapathy-Kanniappan S. Molecular intricacies of aerobic glycolysis in cancer: current insights into the classic metabolic phenotype. Crit Rev Biochem Mol Biol. 2018;53:667–682. [DOI] [PubMed] [Google Scholar]
- [17].Lunt SY, Vander Heiden MG. Aerobic glycolysis: meeting the metabolic requirements of cell proliferation. Annu Rev Cell Dev Biol. 2011;27(1):441–464. [DOI] [PubMed] [Google Scholar]
- [18].Shi T, Ma Y, Cao L, et al. B7-H3 promotes aerobic glycolysis and chemoresistance in colorectal cancer cells by regulating HK2. Cell Death Dis. 2019;10:308. [DOI] [PMC free article] [PubMed] [Google Scholar]
- [19].Chen X, Wu Q, Sun P, et al. Propofol disrupts aerobic glycolysis in colorectal cancer cells via inactivation of the NMDAR-CAMKII-ERK pathway. Cell Physiol Biochem. 2018;46(2):492–504. [DOI] [PubMed] [Google Scholar]
- [20].Pelicano H, Martin DS, Xu R-H, et al. Glycolysis inhibition for anticancer treatment. Oncogene. 2006;25(34):4633–4646. [DOI] [PubMed] [Google Scholar]
- [21].Feng J, Li J, Wu L, et al. Emerging roles and the regulation of aerobic glycolysis in hepatocellular carcinoma. J Exp Clin Cancer Res. 2020;39:126. [DOI] [PMC free article] [PubMed] [Google Scholar]
- [22].Hu Q, Qin Y, Ji S, et al. UHRF1 promotes aerobic glycolysis and proliferation via suppression of SIRT4 in pancreatic cancer. Cancer Lett. 2019;452:226–236. [DOI] [PubMed] [Google Scholar]
- [23].Li Q, Li Y, Liang L, et al. Klotho negatively regulated aerobic glycolysis in colorectal cancer via ERK/HIF1α axis. Cell Commun Signal. 2018;16(1):26. [DOI] [PMC free article] [PubMed] [Google Scholar]
- [24].Xia M, Feng S, Chen Z, et al. Non-coding RNAs: key regulators of aerobic glycolysis in breast cancer. Life Sci. 2020;250:117579. [DOI] [PubMed] [Google Scholar]
- [25].Chen LL, Yang L. Regulation of circRNA biogenesis. RNA Biol. 2015;12:381–388. [DOI] [PMC free article] [PubMed] [Google Scholar]
- [26].Salzman J. Circular RNA expression: its potential regulation and function. Trends Genet. 2016;32(5):309–316. [DOI] [PMC free article] [PubMed] [Google Scholar]
- [27].Han B, Chao J, Yao H. Circular RNA and its mechanisms in disease: from the bench to the clinic. Pharmacol Ther. 2018;187:31–44. [DOI] [PubMed] [Google Scholar]
- [28].Sang Y, Chen B, Song X, et al. circRNA_0025202 regulates tamoxifen sensitivity and tumor progression via regulating the miR-182-5p/FOXO3a axis in breast cancer. Mol Ther. 2019;27:1638–1652. [DOI] [PMC free article] [PubMed] [Google Scholar]
- [29].Liu Z, Yu Y, Huang Z, et al. CircRNA-5692 inhibits the progression of hepatocellular carcinoma by sponging miR-328-5p to enhance DAB2IP expression. Cell Death Dis. 2019;10(12):900. [DOI] [PMC free article] [PubMed] [Google Scholar]
- [30].Li H, Yang F, Hu A, et al. Therapeutic targeting of circ-CUX1/EWSR1/MAZ axis inhibits glycolysis and neuroblastoma progression. EMBO Mol Med. 2019;11(12):e10835. [DOI] [PMC free article] [PubMed] [Google Scholar]
- [31].Chen X, Yu J, Tian H, et al. Circle RNA hsa_circRNA_100290 serves as a ceRNA for miR-378a to regulate oral squamous cell carcinoma cells growth via Glucose transporter-1 (GLUT1) and glycolysis. J Cell Physiol. 2019;234:19130–19140. [DOI] [PubMed] [Google Scholar]
- [32].Cao L, Wang M, Dong Y, et al. Circular RNA circRNF20 promotes breast cancer tumorigenesis and Warburg effect through miR-487a/HIF-1α/HK2. Cell Death Dis. 2020;11(2):145. [DOI] [PMC free article] [PubMed] [Google Scholar]
- [33].Hou S, Jin W, Xiao W, et al. Integrin α5 promotes migration and cisplatin resistance in esophageal squamous cell carcinoma cells. Am J Cancer Res. 2019;9:2774–2788. [PMC free article] [PubMed] [Google Scholar]
- [34].Liu R, Deng P, Zhang Y, et al. Circ_0082182 promotes oncogenesis and metastasis of colorectal cancer in vitro and in vivo by sponging miR-411 and miR-1205 to activate the Wnt/β-catenin pathway. World J Surg Oncol. 2021;19(1):51. [DOI] [PMC free article] [PubMed] [Google Scholar]
- [35].Koppenol WH, Bounds PL, Dang CV. Otto Warburg’s contributions to current concepts of cancer metabolism. Nat Rev Cancer. 2011;11:325–337. [DOI] [PubMed] [Google Scholar]
- [36].Zhao Y, Butler EB, Tan M. Targeting cellular metabolism to improve cancer therapeutics. Cell Death Dis. 2013;4(3):e532. [DOI] [PMC free article] [PubMed] [Google Scholar]
- [37].Chakraborty PK, Mustafi SB, Xiong X, et al. MICU1 drives glycolysis and chemoresistance in ovarian cancer. Nat Commun. 2017;8:14634. [DOI] [PMC free article] [PubMed] [Google Scholar]
- [38].Zhang L, Yang H, Zhang W, et al. Clk1-regulated aerobic glycolysis is involved in glioma chemoresistance. J Neurochem. 2017;142(4):574–588. [DOI] [PubMed] [Google Scholar]
- [39].Wang T, Ning K, Sun X, et al. Glycolysis is essential for chemoresistance induced by transient receptor potential channel C5 in colorectal cancer. BMC Cancer. 2018;18:207. [DOI] [PMC free article] [PubMed] [Google Scholar]
- [40].Dong Q, Zhou C, Ren H, et al. Lactate-induced MRP1 expression contributes to metabolism-based etoposide resistance in non-small cell lung cancer cells. Cell Commun Signal. 2020;18:167. [DOI] [PMC free article] [PubMed] [Google Scholar]
- [41].Deng X, Zhao J, Qu L, et al. Ginsenoside Rh4 suppresses aerobic glycolysis and the expression of PD-L1 via targeting AKT in esophageal cancer. Biochem Pharmacol. 2020;178:114038. [DOI] [PubMed] [Google Scholar]
- [42].Qian C-J, Xu Z-R, Chen L-Y, et al. LncRNA MAFG-AS1 accelerates cell migration, invasion and aerobic glycolysis of esophageal squamous cell carcinoma cells via miR-765/PDX1 axis. Cancer Manag Res. 2020;12:6895–6908. [DOI] [PMC free article] [PubMed] [Google Scholar]
- [43].Patop IL, Wüst S, Kadener S. Past, present, and future of circRNAs. EMBO J. 2019;38:e100836. [DOI] [PMC free article] [PubMed] [Google Scholar]
- [44].Li Q, Pan X, Zhu D, et al. Circular RNA MAT2B promotes glycolysis and malignancy of hepatocellular carcinoma through the miR-338-3p/PKM2 axis under hypoxic stress. Hepatology. 2019;70(4):1298–1316. [DOI] [PubMed] [Google Scholar]
- [45].Yu XH, Wang HF, Wu JB, et al. Non-coding RNAs derailed: the many influences on the fatty acid reprogramming of cancer. Life Sci. 2019;231:116509. [DOI] [PubMed] [Google Scholar]
- [46].Li J, Lu Z, Zhang Y, et al. Emerging roles of non-coding RNAs in the metabolic reprogramming of tumor-associated macrophages. Immunol Lett. 2021;232:27–34. [DOI] [PubMed] [Google Scholar]
- [47].Lu Q, Liu T, Feng H, et al. Circular RNA circSLC8A1 acts as a sponge of miR-130b/miR-494 in suppressing bladder cancer progression via regulating PTEN. Mol Cancer. 2019;18(1):111. [DOI] [PMC free article] [PubMed] [Google Scholar]
- [48].Zeng K, Chen X, Xu M, et al. CircHIPK3 promotes colorectal cancer growth and metastasis by sponging miR-7. Cell Death Dis. 2018;9:417. [DOI] [PMC free article] [PubMed] [Google Scholar] [Retracted]
- [49].Zhao B, Song X, Guan H. CircACAP2 promotes breast cancer proliferation and metastasis by targeting miR-29a/b-3p-COL5A1 axis. Life Sci. 2020;244:117179. [DOI] [PubMed] [Google Scholar]
- [50].Liu J, Liu H, Zeng Q, et al. Circular RNA circ-MAT2B facilitates glycolysis and growth of gastric cancer through regulating the miR-515-5p/HIF-1α axis. Cancer Cell Int. 2020;20:171. [DOI] [PMC free article] [PubMed] [Google Scholar]
- [51].Li Q, Wang Y, Wu S, et al. CircACC1 regulates assembly and activation of AMPK complex under metabolic stress. Cell Metab. 2019;30(1):157–73.e7. [DOI] [PubMed] [Google Scholar]
- [52].Pérez-Mato M, Ramos-Cabrer P, Sobrino T, et al. Human recombinant glutamate oxaloacetate transaminase 1 (GOT1) supplemented with oxaloacetate induces a protective effect after cerebral ischemia. Cell Death Dis. 2014;5:e992. [DOI] [PMC free article] [PubMed] [Google Scholar]
- [53].Abrego J, Gunda V, Vernucci E, et al. GOT1 -mediated anaplerotic glutamine metabolism regulates chronic acidosis stress in pancreatic cancer cells. Cancer Lett. 2017;400:37–46. [DOI] [PMC free article] [PubMed] [Google Scholar]
- [54].Jiang X, Chang H, Zhou Y. Expression, purification and preliminary crystallographic studies of human glutamate oxaloacetate transaminase 1 (GOT1). Protein Expr Purif. 2015;113:102–106. [DOI] [PubMed] [Google Scholar]
- [55].Zhou X, Curbo S, Li F, et al. Inhibition of glutamate oxaloacetate transaminase 1 in cancer cell lines results in altered metabolism with increased dependency of glucose. BMC Cancer. 2018;18:559. [DOI] [PMC free article] [PubMed] [Google Scholar]
- [56].Yoshida T, Yamasaki S, Kaneko O, et al. A covalent small molecule inhibitor of glutamate-oxaloacetate transaminase 1 impairs pancreatic cancer growth. Biochem Biophys Res Commun. 2020;522(3):633–638. [DOI] [PMC free article] [PubMed] [Google Scholar]


