Abstract
Objective:
Photo-plethysmography (PPG) sensors are often used to detect pulse transit time (PTT) for potential cuff-less blood pressure (BP) measurement. It is known that the contact pressure (CP) of the PPG sensor markedly alters the PPG waveform amplitude. The objective was to test the hypothesis that PTT detected via PPG sensors is likewise impacted by CP.
Methods:
A device was built to measure the time delay between ECG and finger PPG waveforms (i.e., pulse arrival time (PAT) – a popular surrogate of PTT) and the PPG sensor CP at different CP levels. These measurements and finger cuff BP were recorded while the CP was slowly varied in 17 healthy subjects.
Results:
Over a physiologic range of CP, the maximum deviations of PAT detected at the PPG foot and peak were 22±2 and 40±7 ms (p<0.05), which translate to ~11 and ~20 mmHg BP error based on the literature. The curve relating PAT detected at the PPG foot to CP was U-shaped with minimum near finger diastolic BP. A conceptual model accounting for finger artery viscoelasticity and nonlinearity explained this curve.
Conclusion:
Since the regulatory bias error for BP measurement is limited to 5 mmHg, PPG sensor CP should be taken into account for cuff-less BP measurement via PTT.
Significance:
This study suggests that widely pursued PPG-based BP measurement devices including those that detect PTT should maintain the CP or include a CP measurement in the calibration equation for deriving BP.
Index Terms—: Cuff-less blood pressure, mHealth, photo-plethysmography (PPG), PPG sensor contact pressure, pulse arrival time, pulse transit time (PTT), pulse wave velocity, wearable
I. Introduction
CUFF-LESS blood pressure (BP) measurement devices are being widely pursued to improve hypertension management [1]. Many of these devices employ photo-plethysmography (PPG) sensors [1]–[4].
PPG sensors measure pulsatile arterial blood volume waveforms by shining light on one side of a tissue volume and receiving the transmitted light on the opposite side or the reflected light on the same side [5]. These sensors are easy-to-use and require minimal hardware in contrast to other plethysmographs such as ultrasound [6]. Moreover, PPG sensors offer high signal-to-noise ratio unlike other transducers including ballistocardiographs and seismocardiographs [7]. Conventional PPG sensors come in the form of transmission-mode clips for the fingertip, toe, or earlobe and reflectance-mode patches for the nose, forehead, or other locations [5]. Reflectance-mode PPG sensors are also now available in smartphones and smartwatches via a dedicated transducer or the video camera [8] and may be emerging as conformable bioelectronic systems [9].
There are two approaches for cuff-less BP measurement via PPG: waveform analysis [10] and pulse transit time (PTT) [1], [11]. The PPG waveform analysis approach involves extracting features from the waveform and then employing some model such as a regression equation or neural network to map the features to BP. The PPG-PTT approach involves detecting the time delay between proximal and distal arterial waveforms via PPG and possibly another sensor and calibrating the time delay to BP. The PPG-PTT approach may be preferred, as it has a theoretical basis [1].
However, it is known that the PPG sensor contact pressure (CP) – defined as the external pressure applied by the sensor on the surface of the skin – markedly impacts the amplitude and shape of the measured waveform [12], [13] due to the nonlinear arterial blood volume-transmural pressure relationship [14]. In fact, we recently exploited this knowledge for smartphone BP measurement via the oscillometric principle [15], [16]. The user steadily increases finger CP on the phone, and the phone measures the variable-amplitude PPG oscillations and CP and then computes BP from the measurements using standard oscillometric algorithms. Hence, the PPG waveform analysis approach for cuff-less BP measurement must surely take CP into account. Our hypothesis is that the PPG-PTT approach is likewise impacted by CP. Our objective was to test this hypothesis by developing a device to measure the time delay between ECG and finger PPG waveforms (i.e., pulse arrival time (PAT), which is a popular surrogate of PTT [1]), and the CP over a wide CP range and performing controlled experiments in human subjects. We also sought to explain our findings through a physiologic model.
II. Methodology
The measurement devices, protocol for the human study, and data analysis are described below.
A. Measurement Devices
An ECG waveform, PPG waveform from the fingertip, and CP were simultaneously measured along with a volume-clamp, finger cuff BP (F-BP) waveform using the devices shown in Fig. 1. ECG and F-BP waveforms were measured using commercial devices (ECG kit, Physiolab, UK and Finometer Midi, Finapres Medical Systems, Holland), whereas the PPG waveform and CP were recorded using a custom designed sensor-unit.
Fig. 1.
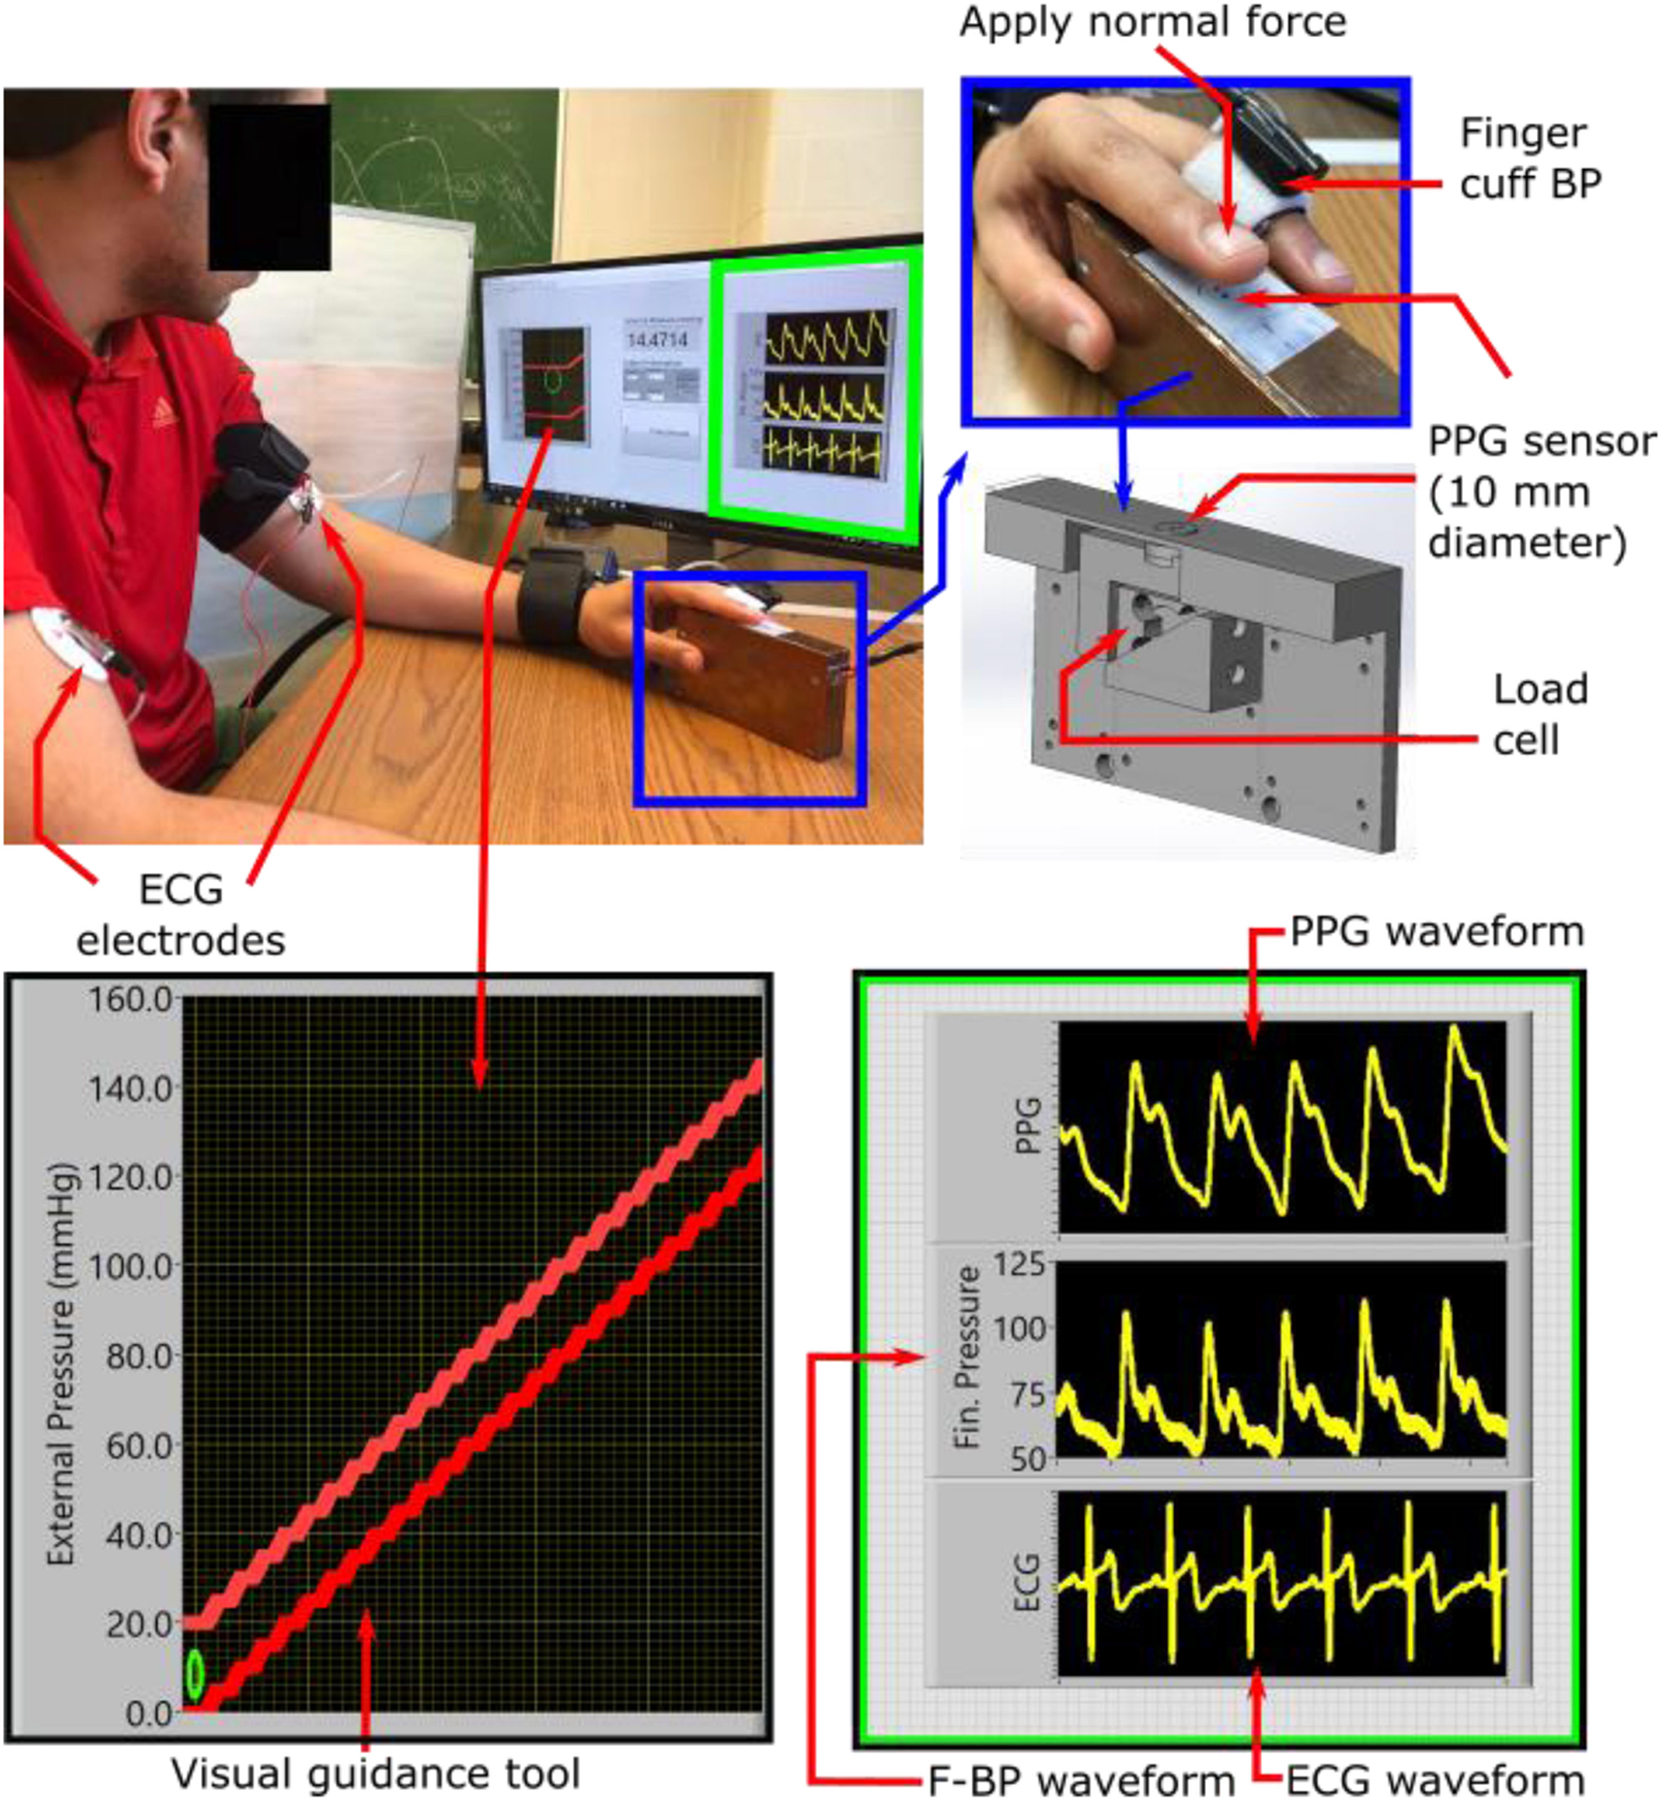
Measurement devices to investigate the impact of photo-plethysmography (PPG) sensor contact pressure (CP) on pulse arrival time (PAT). A custom device comprising a reflectance-mode PPG sensor and load cell housed within a 3D-printed structure was built to measure the finger PPG waveform and CP. This device was accompanied by a visual guidance tool for slowly increasing the CP over a wide range. Commercial devices were used to measure the ECG waveform as well as the finger BP (F-BP) waveform. PAT could then be detected as the time delay between the ECG and finger PPG waveforms at different levels of CP.
This sensor-unit was an improved version of a transducer design that we previously developed [15]. It has a light sensor and a load cell to record the PPG waveform and CP, respectively. The light sensor uses an infrared (IR) transmitter (AM2520F3C03, Kingbright, Taiwan) and receiver (AM2520P3C03, Kingbright) for reflectance-mode measurements at 940 nm. The load cell (S251, Strain Measurement Devices, USA) senses the normal force exerted by a finger on the PPG sensor. Both the sensors were neatly assembled inside a 3D-printed rigid structure, as shown in Fig. 1. This rigid structure housed the light sensor on top of the load cell and ensured that the load cell measured the contact force normal to the surface of the PPG sensor only. The load cell was calibrated using high density weights to convert the output in units of volts to force in units of Newtons. This force divided by the surface area of the PPG sensor (10 mm diameter circle) yielded the CP.
Hardware filters were employed prior to digitization to mitigate aliasing in the ECG and PPG waveforms. For the sake of simplified electronics, second-order passive bandpass filters were used with cutoff frequencies of 0.3 and 10 Hz for the PPG waveforms and 0.3 and 30 Hz for the ECG waveforms. A DAQ (USB-6003, National Instruments, USA) was used to record the four measurements at a sampling rate of 1 kHz.
B. Human Study Protocol
This study was approved by the Michigan State University Institutional Review Board, and all procedures were performed with written, informed consent from the subjects. Nineteen subjects (age = 34±9 years, height = 168±11 cm, weight = 82±23 kg, female = 47%) with no history of cardiovascular disease were recruited. During the study, each subject was seated in an armchair with feet flat and legs uncrossed. After a resting interval of two minutes, electrodes were placed on the subject to record the ECG waveform. Meanwhile, the finger cuff was wrapped over the subject’s middle finger of the left hand to measure the F-BP waveform. Then, the subject aligned the base of the fingernail on the dorsal side of the left index finger on top of the IR transmitter-receiver pair on the sensor-unit, as shown in Fig. 1, to measure the PPG waveform from the transverse palmar arch artery [17] and the CP. Once the subject was comfortable with these sensors, the study coordinator (A. C.) applied an external force on the palmar side of the subject’s left index finger to increase the CP of the PPG sensor from 30 to 150 mmHg (or to a pressure high enough to occlude the artery) at a rate of 0.3 mmHg/s. A visual guidance tool, as shown in Fig. 1, was employed to control the CP. Hence, any tenseness of the subject was not a factor here. All measurements were recorded during this finger actuation.
C. Data Analysis
The data were analyzed using MATLAB. Software filters with sharp transition bands were employed (on top of the hardware filtering) to further reduce noise. A sixth-order Butterworth bandpass filter with cutoff-frequencies of 0.5 and 10 Hz was applied to the digitized PPG waveforms; a sixth-order Butterworth lowpass filter with a corner frequency of 30 Hz was applied to the digitized ECG and F-BP waveforms, and a fifth-order polynomial was fitted to the CP measurement to remove spikes.
Standard algorithms were then used to detect waveform features. The Pan-Tompkin’s method was applied to detect the R-waves of the ECG waveforms [18]. The peaks of each beat of the PPG and F-BP waveforms were then identified as the maxima between successive R-waves. The feet or troughs of each beat of the PPG and F-BP waveforms were thereafter detected between the R-waves and peaks via the intersecting tangent method, which may be more effective than other detection methods [1]. At this point, it was noticed that data from two of the subjects exhibited many irregular beats. During such beats, PAT will change due to cardiac electrical and mechanical variations. Hence, these data may be less reliable and were excluded from the final results. Yet, it is worth mentioning that the results from the excluded data did show some similarity to the final results but appeared more variable.
As shown in Fig. 2, PAT was determined as the time delay between the ECG R-wave to the PPG foot as well to the PPG peak for each beat. As also shown, the time delay between the R-wave and F-BP foot was likewise determined. These time delays were averaged over 6-sec intervals to mitigate noise. The time delays were then investigated as a function of CP and compared via paired t-tests.
Fig. 2.
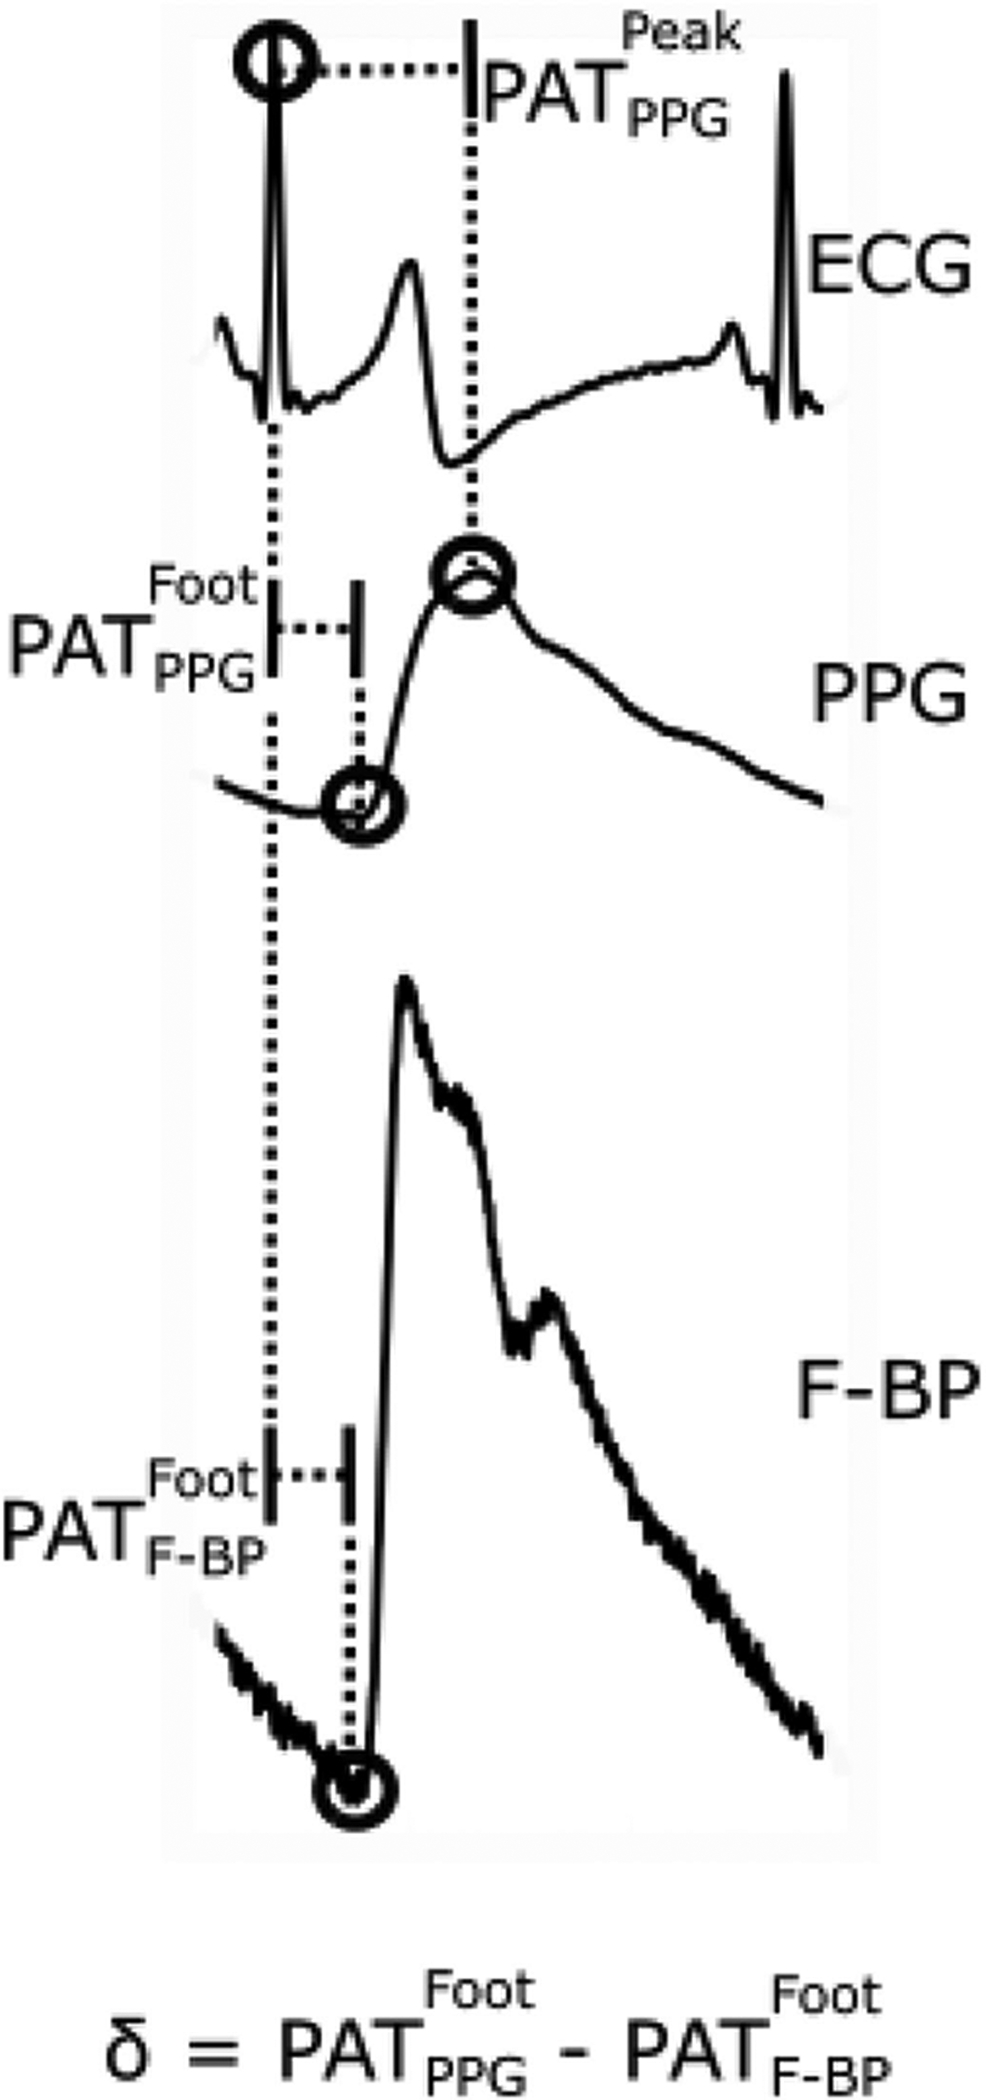
Three PATs were detected from the ECG, finger PPG, and finger cuff BP (F-BP) waveforms recorded with the measurement devices.
III. Results
Fig. 3 presents the recorded data from a single subject. As can be seen and consistent with the oscillometric BP measurement principle, the peak-to-peak amplitude of the PPG waveform increased and then decreased with increasing CP. The shape of each PPG waveform beat likewise changed with the CP. In addition, and varied with CP. Note that the F-BP waveform was auto-calibrated periodically.
Fig. 3.
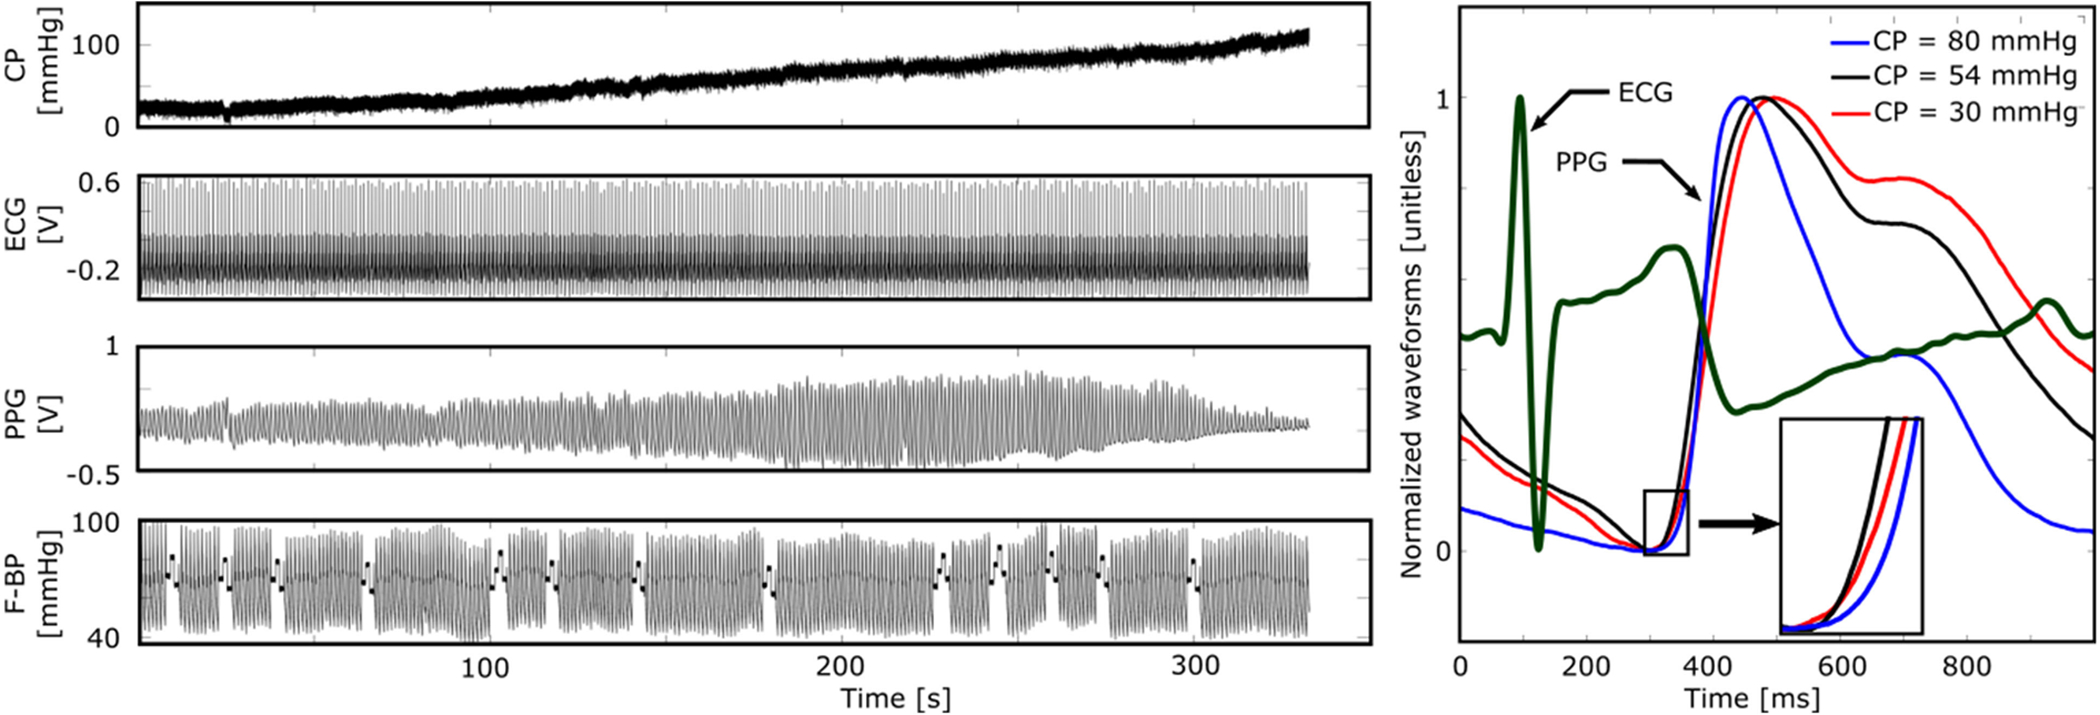
Representative example of all measurements from a subject. As expected, the PPG amplitude and shape markedly varied with the CP.
The versus CP curve showed a U-shape for all the subjects. These curves were aligned at their minima and then averaged to obtain the group average curve shown in Fig. 4A. Note that the average curve is over a CP range of 30 to 80 mmHg. This CP range was the largest range that was common to all the subjects. Further, CP outside this range may not be relevant in that a CP below 30 mmHg may yield a waveform of too small amplitude, whereas a CP above 80 mmHg may not be comfortable for long-term use. The minimum of was located at a CP of 54 mmHg, which is close to the group average (mean±SE) finger diastolic pressure (DP) of 58±6 mmHg. (Note that finger DP is about 10 mmHg lower than brachial DP [15].) That DP takes on importance makes sense, since the time delay was detected at the level of diastole. measured at a CP of 30 and 80 mmHg were both significantly different from the minimum at a CP of 54 mmHg (p < 0.05). The maximum deviation of over the range of CP (i.e., maximum PAT – minimum PAT) was 20 ms. As expected and also shown in Fig. 4A, (measured from the finger adjacent to that with the PPG sensor) was relatively constant.
Fig. 4.
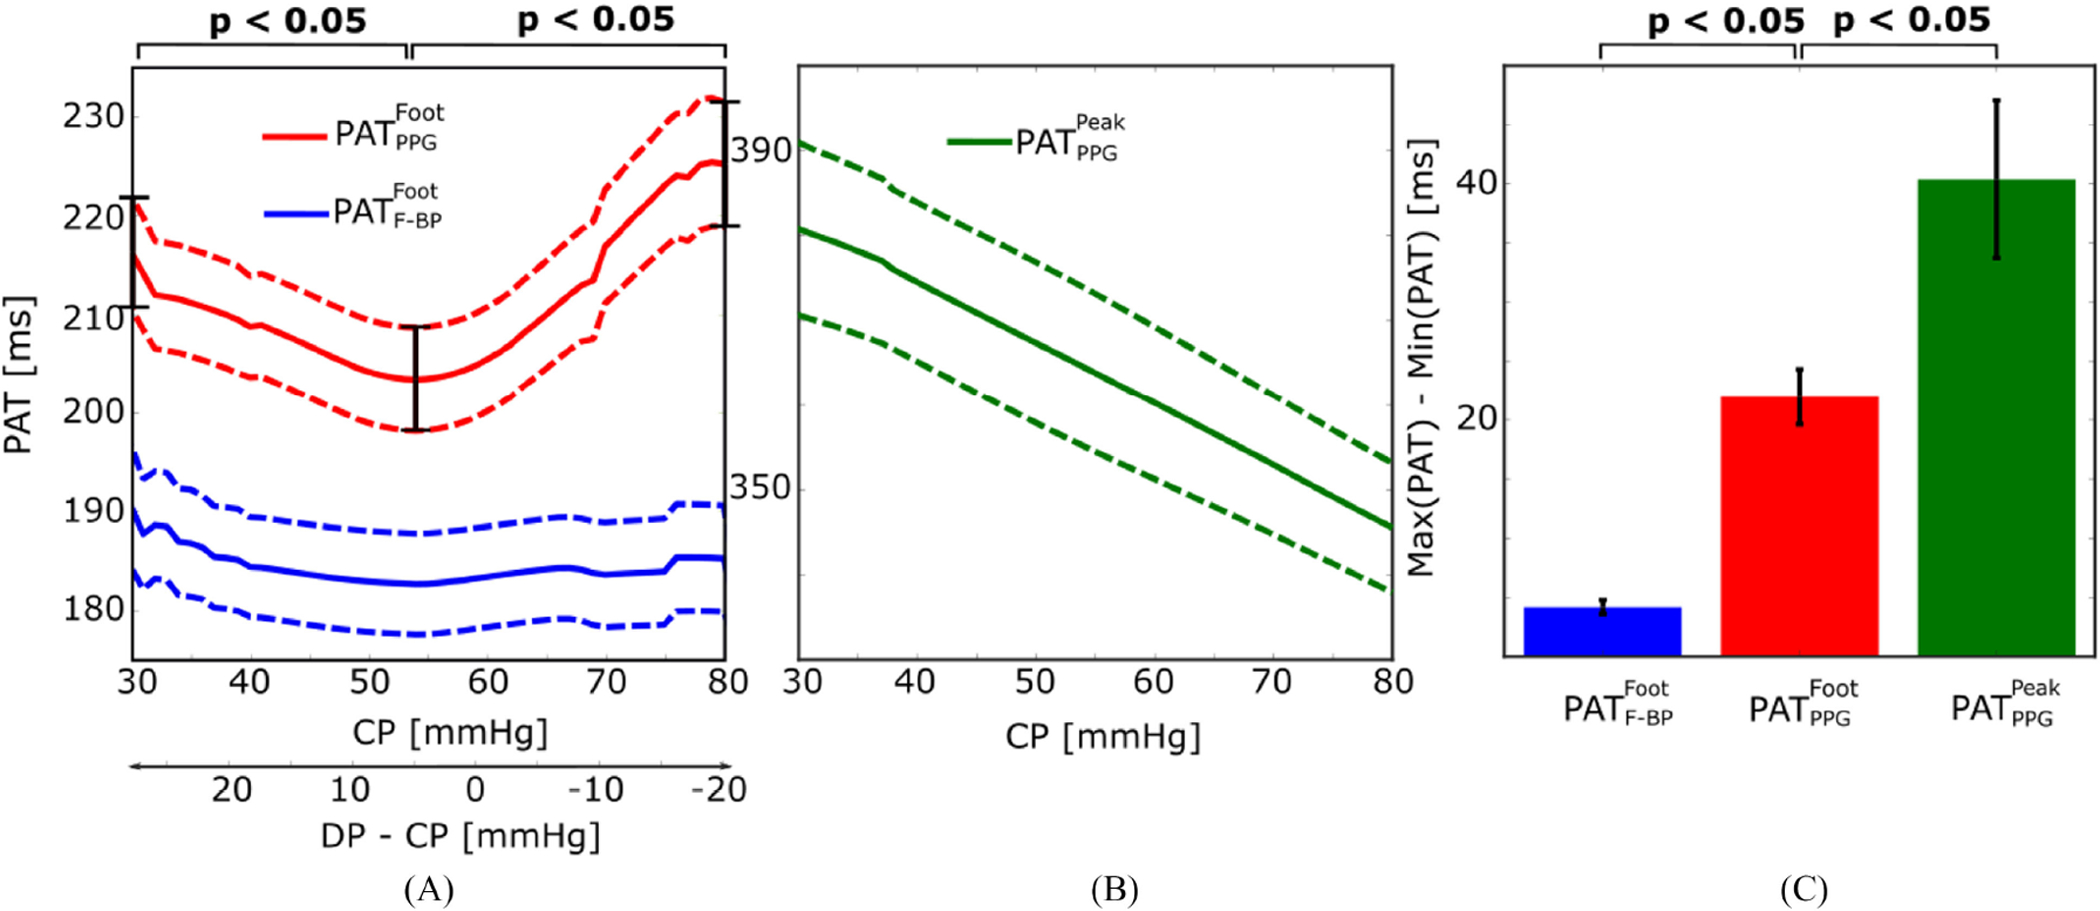
Experimental results of the impact of CP on PAT. (A) Group average (mean±SE) curves relating and to CP. The versus CP curve showed a U-shape, whereas was relatively constant, over the physiologic CP range of 30 to 80 mmHg. (B) Group average curve relating to CP. This curve was a monotonically decreasing function over the same CP range. (C) Group average maximum deviations of , , and (i.e., maximum PAT – minimum PAT) over the investigated CP range. The maximum variation in was 22±2, which was much larger than that of but only about half of that of . N = 17; see Fig. 2 for PAT definitions.
The versus CP curve did not show any typical shape over the subjects. These curves were therefore simply averaged to obtain the group average curve shown in Fig. 4B. The average curve shows that decreased monotonically by 35 ms from a CP of 30 to a CP of 80 mmHg.
Fig. 4C summarizes the results through a bar graph that compares the group average maximum deviation of all three PAT values over the investigated CP range. The maximum deviation of was 22±2 ms, whereas varied by at most 40±7 ms (p < 0.05) and changed by no more than just 4±0.6 ms (p < 0.05). Note that the maximum deviation of , as shown in Fig. 4C, matched that of the mean curve, as shown in Fig. 4A. This equivalence provides evidence that Fig. 4A is indeed a representative curve illustrating the nature of the variation in PAT due to CP in an individual subject. In other words, if the versus CP curves of the subjects were not aligned before averaging, the mean curve would have been smoothed and thus significantly underestimate the impact of CP on an individual subject.
IV. Discussion
PTT represents a physics-based approach for potentially achieving cuff-less and passive BP measurement. Many researchers are pursuing this approach, especially based on the detection of PTT via high-fidelity blood volume waveforms recorded with simple PPG sensors. It is known that the PPG sensor CP changes the shape and amplitude of the waveform, but its effect on PTT is unclear. In this study, our objective was to investigate how CP affects PTT. We employed a custom device to measure the relative timing between ECG and finger PPG waveforms (i.e., PAT) and the CP while the CP of the sensor was varied slowly and over a wide range (see Figs. 1 and 3) in 17 healthy volunteers. By measuring PAT instead of PTT, an implicit assumption here was that CP variations do not impact the pre-ejection period.
Our experimental results showed that (the time delay between the ECG R-wave and the PPG foot or trough; see Fig. 2) changed by a maximum of 22±2 ms over a physiologic CP range (see Fig. 4C). Based on a previous study of the relationship between PAT and BP in healthy human subjects undergoing pharmacological BP interventions [19], this time delay variation translates to a ~11 mmHg error in BP. The Association for the Advancement of Medical Instrumentation (AAMI) however recommends a bias error against auscultation of no more than 5 mmHg for BP monitoring devices [20]. If (the time delay between the ECG R-wave and the PPG peak; see Fig. 2) were measured, our results indicate that the BP error would double (see Fig. 4C). The likely reason is that this time delay is more dependent on the waveform shape, which also varies with CP (see right panel of Fig. 3). The waveform shape variations in fact caused to monotonically decrease with increasing CP (see Fig. 4B).
The shape of the versus CP curve resembled a U with the minimum near finger DP (see Fig. 4A). We present the conceptual model in Fig. 5 to explain this experimental finding through the viscoelasticity of the arterial wall [1], [21] and the non-linear elasticity of the finger artery [14]. This model assumes that the PPG sensor CP has no impact on the BP within the artery. Most, if not all, existing oscillometric models use the same assumption. For instance, Drzewiecki et al. invoked the assumption to develop a model to simulate oscillometric cuff pressure waveforms that mimic measurements [22], whereas Liu et al. used this assumption to design a new oscillometric BP estimation algorithm that was shown to be more accurate than existing office devices [23], [24]. According to this assumption, BP within the finger corresponding to the PPG measurement is given by the F-BP waveform that we also recorded from a different finger. Hence, can be broken down as the sum of , which is smaller, and the foot-to-foot time delay between the F-BP and PPG waveforms, referred to as δ in Fig. 2. Since is independent of CP, δ may be predominantly influencing the shape of the versus CP curve. As summarized at the bottom of Fig. 5, δ decreases with increasing CP in the positive transmural pressure regime (i.e., DP – CP > 0) due to the viscoelastic nature of specifically smooth muscle around finger arteries [1] and increases with increasing CP in the negative transmural pressure regime (i.e., DP – CP < 0) due to the non-linear elastic nature of finger arteries.
Fig. 5.
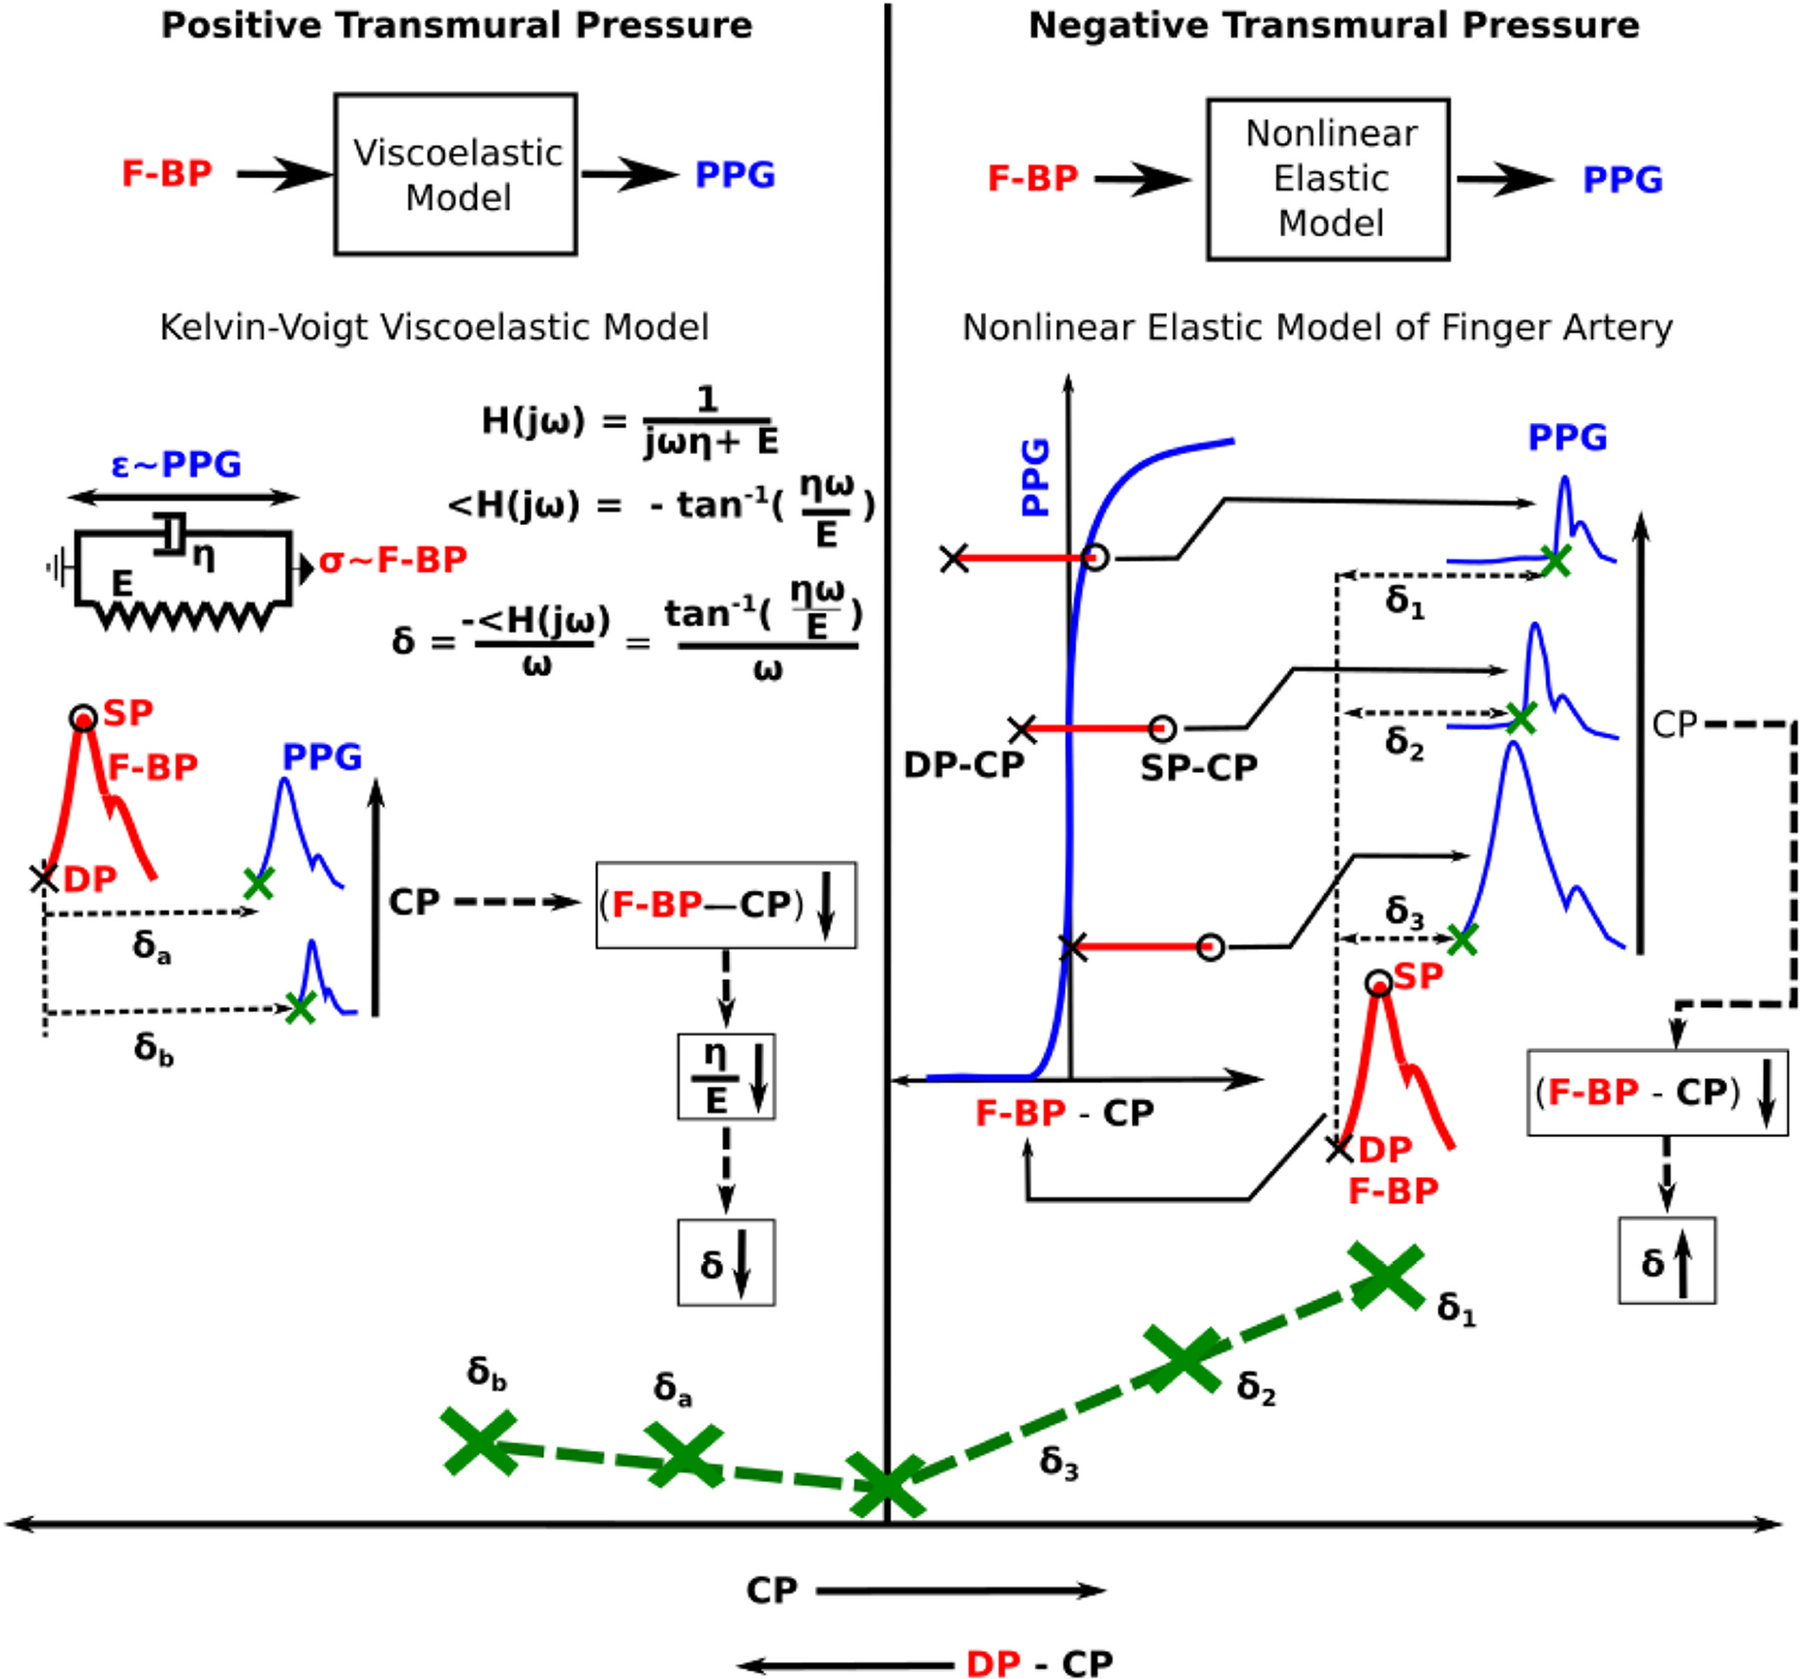
Conceptual model to explain the U-shape of the versus CP curve in Fig. 4A. The model assumes that CP does not impact the BP within the artery. Hence, δ, which is the foot-to-foot time delay between the F-BP and PPG waveforms (see Fig. 2), determines the shape of the curve. The model explains the U-shape variation in δ with CP based on the viscoelasticity of the finger artery in the positive transmural pressure regime (DP – CP > 0, where DP is diastolic BP) and the nonlinear elasticity of the finger artery in the negative transmural pressure regime (DP – CP < 0). E and η are the incremental elastic modulus and coefficient of viscosity of the arterial wall; σ and ε are wall stress and strain; ω is the angular frequency (e.g., heart rate); and H(jω) denotes transfer function. See text for further details.
Over the positive transmural pressure regime, viscoelasticity may be most important. (In fact, nonlinear elasticity alone warps the PPG waveform amplitude but does not impact δ over this pressure range.) Viscoelasticity is specifically represented with a Kelvin-Voigt model [25], as shown in Fig. 5. For this basic model, δ represents the phase delay [26] from the model input F-BP (analogous to wall stress) to the model output PPG (analogous to wall strain) and is given as tan−1(ηω/E)/ω (see brief derivation in Fig. 5). Here, E and η are the incremental elastic modulus and coefficient of viscosity of the arterial wall, respectively, while ω is the angular frequency (e.g., heart rate) of the input BP waveform and is assumed to be independent of the CP. As CP increases, the transmural pressure of the artery decreases. It is known that both E and η decrease with declining transmural pressure [21]. However, according the right panel of Fig. 3, η may decrease more than E (i.e., E/η, which is the corner frequency of H(jω), increases such that the PPG waveform becomes sharper with increasing CP). Hence, δ and thus decreases with increasing CP.
However, once CP increases above DP, δ increases. Over this negative transmural pressure regime, nonlinear elasticity may become most important, as explained in the following. The finger arterial blood volume (PPG)-transmural pressure (F-BP – CP) relation is essentially zero (i.e., vessel collapses) over negative transmural pressure and rapidly increases and then plateaus over positive transmural pressure [14]. (Note that the larger brachial artery does not collapse until the external pressure is significantly higher than the BP [22]). If the CP exceeds DP (minimum of F-BP) but is less than systolic BP (SP, maximum of F-BP), the PPG waveform is flattened (i.e., artery in collapsed state) for only the portion of F-BP that is less than CP. Once the F-BP rises above the CP, the PPG waveform shoots up (i.e., artery is open) from the flattened level. All waveform detection algorithms will identify this inflection point as the PPG foot, and δ is thus the time delay between the F-BP foot and this pseudo PPG foot. As CP increases, the pseudo PPG foot is delayed more with respect to the F-BP foot. Hence, δ and thus increases with CP.
Previously, Teng et al. likewise studied how finger PAT is impacted by CP [27]. However, there are notable differences between their study and our study in terms of both methodology and results. They did not measure finger contact area or an F-BP waveform. More significantly, the shape of the versus contact force curve reported by these investigators is different from that observed in our investigation. As per our experimental data and model, decreases with increasing CP for the positive transmural pressure regime, whereas their data showed that this time delay instead increases. Their data also showed that is constant for all CP greater than mean BP, while our data and model indicate that increases with increasing CP for the negative transmural pressure regime. We cannot explain the difference in experimental results. However, we do mention that an earlier version of our measurement device was validated against cuff BP measurements [15]. Another major difference is that Teng et al. used the Bramwell-Hill equation [1] to explain their results. However, this equation may not be applicable to the tiny arterial segment underneath the PPG sensor, as it is derived for pulse waves travelling in a long and non-viscous artery. By contrast, we used a model based on the local arterial phenomenon of viscoelasticity and nonlinear elasticity of the finger artery.
A limitation of this study is that we included only younger subjects. Future studies should examine the impact of CP on PAT in older subjects. However, it is important to note that the slope of the calibration equation relating PTT to BP may increase with aging [28]. Hence, the impact of CP variations on PTT-based BP estimates may be higher or at least similar for elderly subjects.
V. Conclusion
We have shown that PAT detected via the foot of the finger PPG waveform is significantly impacted by the CP of the PPG sensor in healthy subjects and explained this finding through a physiologic model. Based on literature data, the CP-induced variation in PAT that we observed may translate to a BP error as large as 11 mmHg. We have also shown that this error doubles for PAT detected via the peak of the finger PPG. Since the AAMI bias error limit is 5 mmHg, BP errors due to changes in CP can be significant. For example, if a PPG sensor were simply applied more tightly around a finger, PAT would indicate a substantial BP change without any actual BP variation. While PPG sensor clips may be more robust to CP variation-induced BP errors, PPG sensors in smartphones and smartwatches and in the form of wearable patches such as conformable bioelectronics systems could be susceptible to these errors. In particular, drift in the CP of a wearable PPG sensor over time or periodic removal and attachment of the sensor may introduce significant BP errors. Given the substantial amplitude and shape variations of the PPG waveform with CP changes, it is likely even more imperative for PPG waveform analysis devices for cuff-less BP measurement to take CP into consideration. Both PPG-PTT and PPG waveform analysis devices could either maintain the CP or include a CP measurement in the calibration equation for deriving BP. Calibration, other confounding factors such as the pre-ejection period, and detection of ambiguous waveform feet and other fiducial markers are challenges that must also be overcome in order to achieve PPG-based BP monitoring. To conclude, PPG sensor CP should be taken into account for cuff-less BP measurement.
Acknowledgments
This work was supported by the NIH under Grants EB018818 and HL146470.
Contributor Information
Anand Chandrasekhar, Department of Electrical and Computer Engineering, Michigan State University, East Lansing, MI 48824 USA.
Jin-Oh Hahn, Department of Mechanical Engineering, University of Maryland..
Ramakrishna Mukkamala, Department of Electrical and Computer Engineering, Michigan State University, East Lansing, MI 48824 USA.
References
- [1].Mukkamala R et al. , “Toward ubiquitous blood pressure monitoring via pulse transit time: Theory and practice,” IEEE Trans. Biomed. Eng, vol. 62, no. 8, pp. 1879–1901, Aug. 2015. [DOI] [PMC free article] [PubMed] [Google Scholar]
- [2].Seeberg TM et al. , “A novel method for continuous, noninvasive, cuff-less measurement of blood pressure: Evaluation in patients with nonalcoholic fatty liver disease,” IEEE Trans. Biomed. Eng, vol. 64, no. 7, pp. 1469–1478, Jul. 2017. [DOI] [PubMed] [Google Scholar]
- [3].Kachuee M et al. , “Cuffless blood pressure estimation algorithms for continuous health-care monitoring,” IEEE Trans. Biomed. Eng, vol. 64, no. 4, pp. 859–869, Apr. 2017. [DOI] [PubMed] [Google Scholar]
- [4].Chandrasekaran V et al. , “Cuffless differential blood pressure estimation using smart phones,” IEEE Trans. Biomed. Eng, vol. 60, no. 4, pp. 1080–1089, Apr. 2013. [DOI] [PubMed] [Google Scholar]
- [5].Allen J, “Photoplethysmography and its application in clinical physiological measurement,” Physiol. Meas, vol. 28, no. 3, pp. R1–R39, 2007. [DOI] [PubMed] [Google Scholar]
- [6].Khandanpour N et al. , “Photoplethysmography, an easy and accurate method for measuring ankle brachial pressure index: Can photoplethysmography replace doppler?,” Vasc. Endovascular Surg, vol. 43, no. 6, pp. 578–582, 2009. [DOI] [PubMed] [Google Scholar]
- [7].Inan OT et al. , “Ballistocardiography and seismocardiography: A review of recent advances,” IEEE J. Biomed. Heal. Informat, vol. 19, no. 4, pp. 1414–1427, Jul. 2015. [DOI] [PubMed] [Google Scholar]
- [8].Sun Y and Thakor N, “Photoplethysmography revisited: From contact to noncontact, from point to imaging,” IEEE Trans. Biomed. Eng, vol. 63, no. 3, pp. 463–477, Mar. 2016. [DOI] [PMC free article] [PubMed] [Google Scholar]
- [9].Chung HU et al. , “Binodal, wireless epidermal electronic systems with in-sensor analytics for neonatal intensive care,” Science, vol. 363, no. 6430, pp. 1–13, 2019. [DOI] [PMC free article] [PubMed] [Google Scholar]
- [10].Elgendi M, “On the analysis of fingertip photoplethysmogram signals,” Curr. Cardiol. Rev, vol. 8, no. 1, pp. 14–25, 2012. [DOI] [PMC free article] [PubMed] [Google Scholar]
- [11].Sola J and Delgado-Gonzalo R, Eds., The Handbook Of Cuffless Blood Pressure Monitoring. Cham: Springer, 2019. [Google Scholar]
- [12].Mascaro SA and Harry Asada H, “Photoplethysmograph fingernail sensors for measuring finger forces without haptic obstruction,” IEEE Trans. Robot. Autom, vol. 17, no. 5, pp. 698–708, Oct. 2001. [Google Scholar]
- [13].Hsiu H, Hsu CL, and Wu TL, “Effects of different contacting pressure on the transfer function between finger photoplethysmographic and radial blood pressure waveforms,” Proc. Inst. Mech. Eng. Part H J. Eng. Med, vol. 225, no. 6, pp. 575–583, 2011. [DOI] [PubMed] [Google Scholar]
- [14].Langewouters GJ et al. , “Pressure-diameter relationships of segments of human finger arteries,” Clin. Phys. Physiol. Meas, vol. 7, no. 1, pp. 43–56, 1986. [DOI] [PubMed] [Google Scholar]
- [15].Chandrasekhar A et al. , “Smartphone-based blood pressure monitoring via the oscillometric finger pressing method,” Sci. Transl. Med, vol. 10, no. 431, p. eaap8674, 2018. [DOI] [PMC free article] [PubMed] [Google Scholar]
- [16].Chandrasekhar A et al. , “An iphone application for blood pressure monitoring via the oscillometric finger pressing method,” Sci. Rep, vol. 8, no. 1, pp. 18–23, 2018. [DOI] [PMC free article] [PubMed] [Google Scholar]
- [17].Strauch B and de Moura W, “Arterial system of the fingers,” J. Hand Surg. Amer, vol. 15, no. 1, pp. 148–154, 1990. [DOI] [PubMed] [Google Scholar]
- [18].Pan J and Tompkins WJ, “A real-time QRS detection algorithm,” IEEE Trans. Biomed. Eng, vol. 32, no. 3, pp. 230–236, Mar. 1985. [DOI] [PubMed] [Google Scholar]
- [19].Payne RA et al. , “Pulse transit time measured from the ECG: An unreliable marker of beat-to-beat blood pressure,” J. Appl. Physiol, vol. 100, no. 1, pp. 136–141, 2006. [DOI] [PubMed] [Google Scholar]
- [20].Association for the Advancement of Medical Instrumentation, “Noninvasive sphygmomanometers–part 2: Clinical validation of automated measurement type,” Arlington, TX, 2009. [Google Scholar]
- [21].Wurzel M, Cowper GR, and McCooK JM, “Smooth muscle contraction and viscoelasticity of arterial wall,” Can. J. Physiol. Pharmacol, vol. 48, no. 8, pp. 510–523, 1969. [DOI] [PubMed] [Google Scholar]
- [22].Drzewiecki G, Hood R, and Apple H, “Theory of the oscillometric maximum and the systolic and diastolic detection ratios,” Ann. Biomed. Eng, vol. 22, no. 1, pp. 88–96, 1994. [DOI] [PubMed] [Google Scholar]
- [23].Liu J et al. , “Patient-specific oscillometric blood pressure measurement,” IEEE Trans. Biomed. Eng, vol. 63, no. 6, pp. 1220–1228, Jun. 2016. [DOI] [PMC free article] [PubMed] [Google Scholar]
- [24].Liu J, Hahn JO, and Mukkamala R, “Error mechanisms of the oscillometric fixed-ratio blood pressure measurement method,” Ann. Biomed. Eng, vol. 41, no. 3, pp. 587–597, 2013. [DOI] [PubMed] [Google Scholar]
- [25].Flugge W, “Viscoelastic Models,” in Viscoelasticity, Second., London: Blaisdell Publ. Comp., 1967, pp. 4–33. [Google Scholar]
- [26].Oppenheim AV, Willsky AS, and Nawab SH, “Group Delay,” in Signals and Systems, Englewood Cliffs, NJ, USA: Prentice Hall, 1997, pp. 430–436. [Google Scholar]
- [27].Teng X-F and Zhang Y-T, “Theoretical study on the effect of sensor contact force on pulse transit time,” IEEE Trans. Biomed. Eng, vol. 54, no. 8, pp. 1490–1498, Aug. 2007. [DOI] [PubMed] [Google Scholar]
- [28].Mukkamala R and Hahn JO, “Toward ubiquitous blood pressure monitoring via pulse transit time: Predictions on maximum calibration period and acceptable error limits,” IEEE Trans. Biomed. Eng, vol. 65, no. 6, pp. 1410–1420, Jun. 2018. [DOI] [PMC free article] [PubMed] [Google Scholar]


