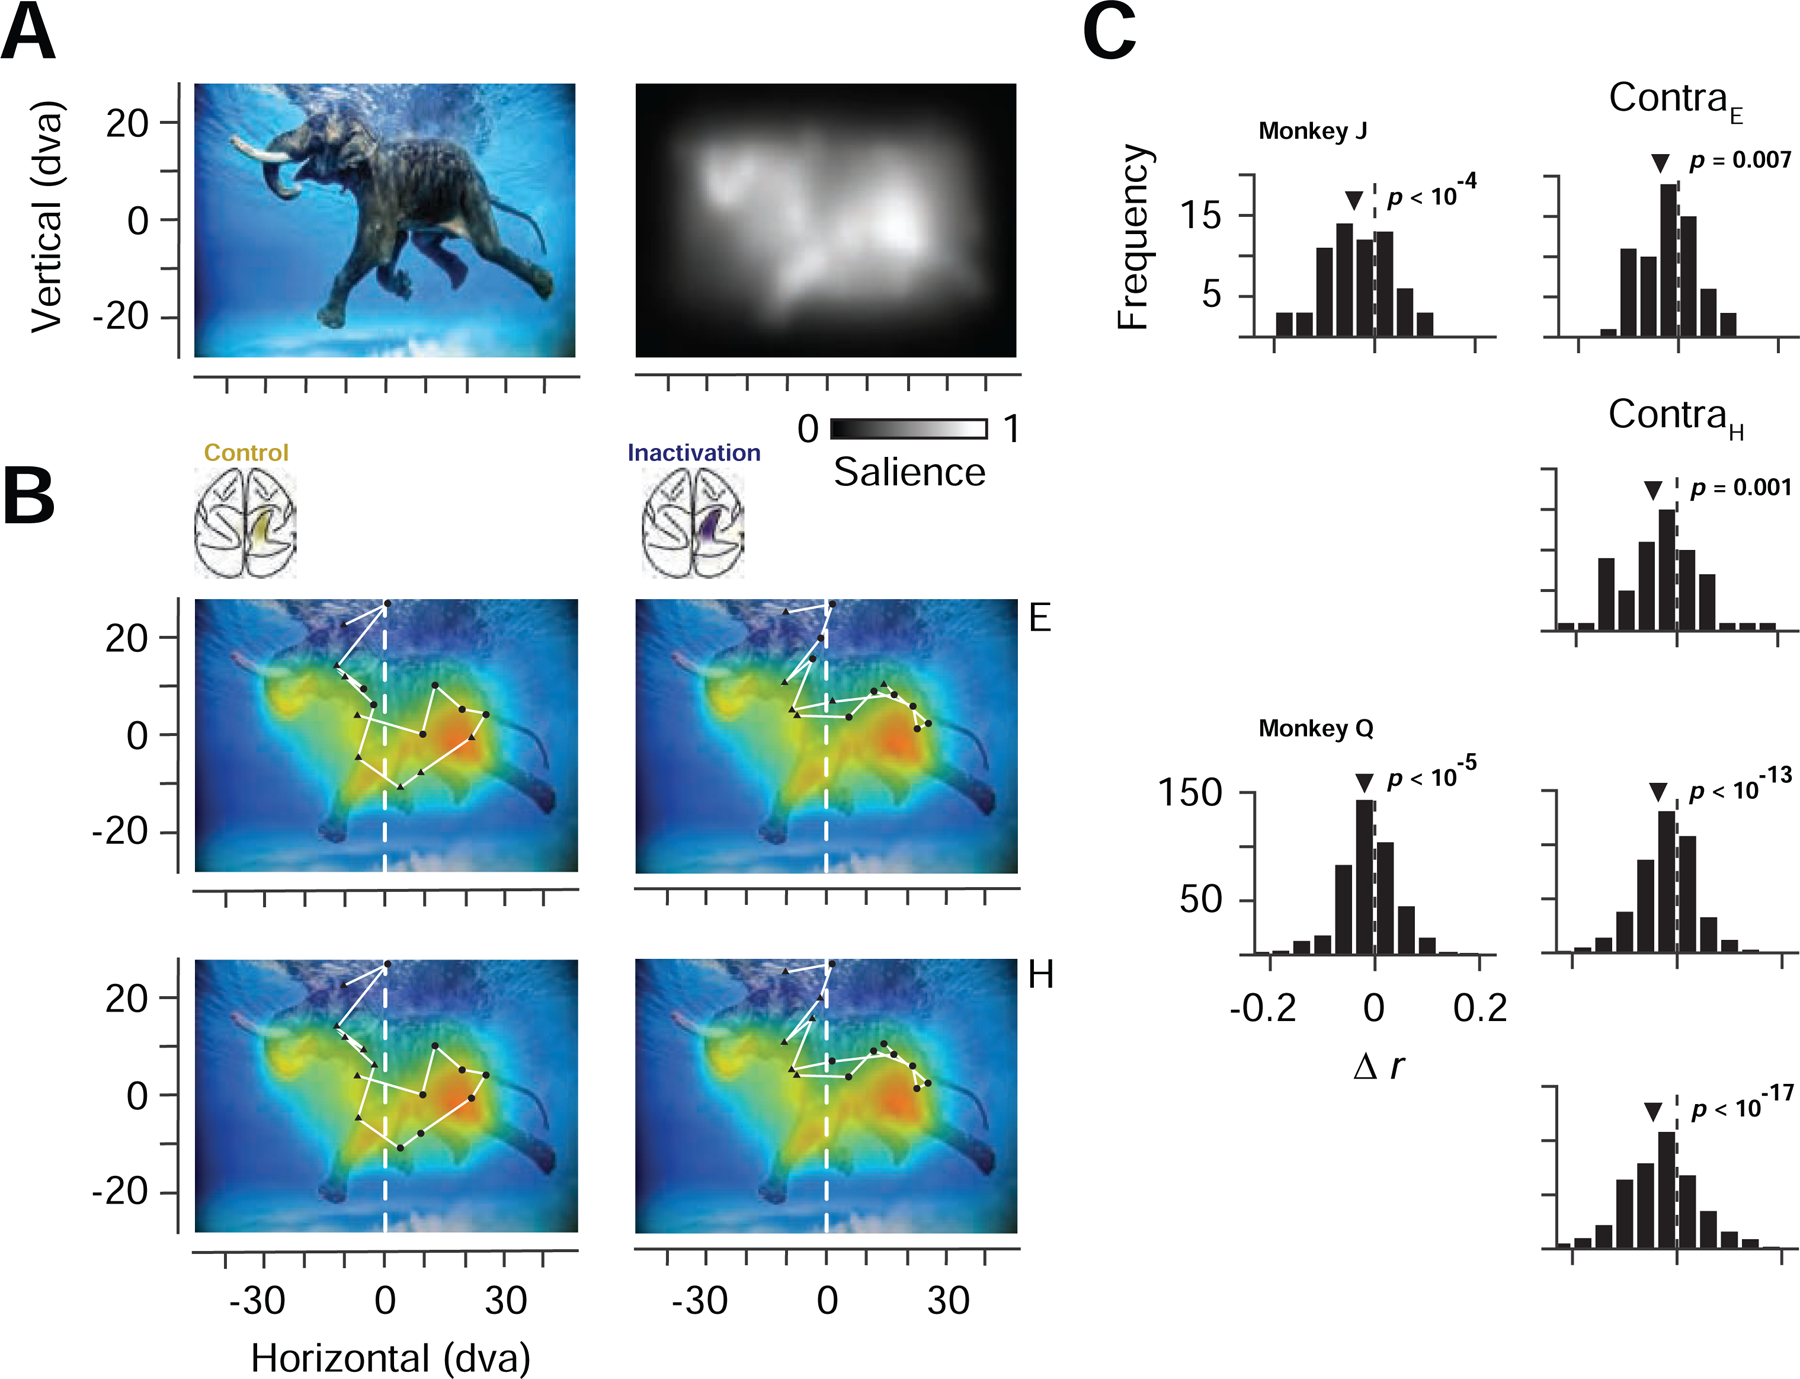
Figure 6. Eye-centered and head-centered changes in salience-driven fixations during PPC inactivation.

(A) Example image from the free viewing task (top left) and corresponding salience map (top right). (B) Correspondence between salience and fixations made in the example image before and after PPC inactivation. Top row fixations are labelled in eye-centered coordinates as contralaterally (triangles) or ipsilaterally (circles) directed movements. Bottom row shows the same fixations labelled in head-centered coordinates as landing in the contralateral or ipsilateral half of the image. (C) Distribution of changes in fixation-salience map correlation coefficients (rinactivation – rcontrol) across the population of images for the two monkeys. Left histograms show distributions based on coefficients measured from fixations across the full image. Right histograms show distributions based on contralateral fixations, defined in eye-centered (ContraE) or head-centered (ContraH) coordinates.
