

SUMMARY
The highly lethal brain cancer glioblastoma (GBM) poses a daunting challenge because the blood-brain barrier renders potentially druggable amplified or mutated oncoproteins relatively inaccessible. Here, we identify sphingomyelin phosphodiesterase 1 (SMPD1), an enzyme that regulates the conversion of sphingomyelin to ceramide, as an actionable drug target in GBM. We show that the highly brain-penetrant antidepressant fluoxetine potently inhibits SMPD1 activity, killing GBMs, through inhibition of epidermal growth factor receptor (EGFR) signaling and via activation of lysosomal stress. Combining fluoxetine with temozolomide, a standard of care for GBM, causes massive increases in GBM cell death and complete tumor regression in mice. Incorporation of real-world evidence from electronic medical records from insurance databases reveals significantly increased survival in GBM patients treated with fluoxetine, which was not seen in patients treated with other selective serotonin reuptake inhibitor (SSRI) antidepressants. These results nominate the repurposing of fluoxetine as a potentially safe and promising therapy for patients with GBM and suggest prospective randomized clinical trials.
In brief
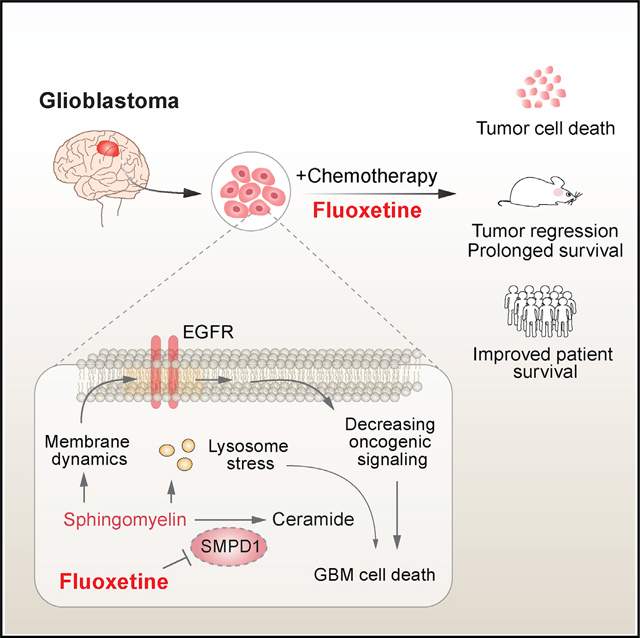
Bi et al. reveal an actionable lipid vulnerability in GBM that can be exploited with a safe, highly brain-penetrant, FDA-approved drug. They show that fluoxetine kills GBMs by blocking acid sphingomyelinase, and they demonstrate that, when added to standard of care, fluoxetine, unlike other SSRIs, significantly improves patient survival.
Graphical Abstract
INTRODUCTION
The highly lethal brain tumor glioblastoma (GBM) is one of the most difficult forms of cancer to treat. Despite a relatively advanced catalog of the mutational landscape of GBM, genomic insights have failed to translate into improved survival for the vast majority of patients, most of whom still die within 2 years, despite aggressive treatment with surgical resection, radiotherapy, and temozolomide (TMZ) (Cloughesy et al., 2014; Wen et al., 2020). Multiple challenges contribute to persistent therapeutic failure. First, many targeted cancer drugs have relatively poor brain/plasma ratios, resulting in systemic toxicities that preclude adequate target inhibition in patients. Second, the underlying biology of actionable genetic alterations in the brain appears to be profoundly influenced by the brain’s unique physiology in ways that are not well understood (Bi et al., 2020; Brennan et al., 2013; Mack et al., 2016; Nagaraja et al., 2019; Quail and Joyce, 2017). Third, GBMs commonly contain extrachromosomal DNA (ecDNA), in which growth-promoting oncogenes, including the epidermal growth factor receptor (EGFR), are amplified at very high levels (Kim et al., 2020; Morton et al., 2019; Nathanson et al., 2014; Nikolaev et al., 2014; Turner et al., 2017; Xu et al., 2019; Zhou et al., 2017). Unfortunately, reversible and rapid modulation of the level of these ecDNAs appears to play a key role in driving GBM resistance to targeted therapy (Nathanson et al., 2014), thereby motivating a search for alternative treatment strategies.
The palette of genomic alterations in GBM appears to differ in some consistent ways from that observed in other cancers that do not arise in the brain. For example, EGFR kinase domain mutations, which more commonly occur in other types of systemic cancers, are rare in GBMs (Brennan et al., 2013; Sanchez-Vega et al., 2018), in which instead EGFR amplification is a dominant oncogenic mechanism. Under normal physiological conditions, EGFR ligands promote dimerization and downstream signaling (Arkhipov et al., 2013; Lemmon et al., 2014). In GBM, the amplified EGFRs on ecDNA often contain mutations in the extracellular domain of the receptor, such as EGFRvIII, which disrupt ligand binding but nonetheless promote oncogenic signaling, raising the possibility that something unique about the brain’s microenvironment may select for EGFR amplifications. This motivated us to consider whether the altered lipid environment in the brain, and potentially in tumor cells, might generate a unique selection pressure in GBMs that may expose actionable vulnerabilities. We focused on lipids because recent work has shown that GBM cells may have profoundly altered compositions of cholesterol and phospholipids in the plasma membrane that may determine how EGFRs signal in tumor cells (Bi et al., 2019, 2020; Guo et al., 2011; Villa et al., 2016). We were particularly motivated to search for alterations in sphingolipid biosynthesis pathways, because the balance between sphingomyelin and ceramide is thought to be critical for plasma membrane organization, including the clustering of signaling molecules into discrete membrane domains called lipid rafts (Hannun and Obeid, 2018; Lingwood and Simons, 2010; Ogretmen, 2018; van Meer et al., 2008). We also searched for highly brain-penetrant drugs that selectively and effectively target key enzymatic components of the sphingolipid biosynthesis machinery.
Here, we proceed from unbiased identification and validation of acid sphingomyelinase (ASM; sphingomyelin phosphodiesterase 1 [SMPD1]) as a compelling GBM target that is required for tumor cell survival to dissection of its underlying actionable enzymatic mechanism to identification of fluoxetine as a US Food and Drug Administration (FDA)-approved, safe, and highly brain-penetrant drug that potently inhibits SMPD1 for the treatment of patients with GBM. We conduct in vivo proof-of-concept studies revealing complete tumor regression in patient-derived GBM brain tumor models in mice when fluoxetine is combined with standard of care. Fluoxetine (Prozac) has been prescribed for years (Wong et al., 2005). Therefore, we complement our experimental data with analyses from electronic medical records demonstrating that combining fluoxetine with standard of care, unlike other selective serotonin reuptake inhibitors (SSRIs) analyzed, significantly prolongs survival in patients with GBM.
RESULTS
GBMs highly depend on SMPD1 for survival
Hypothesizing that sphingolipid metabolism may play an important role in glioma pathogenesis (Bi et al., 2020; Noack et al., 2014; Ogretmen, 2018), we analyzed a large-scale RNA interference cancer dependency dataset (DepMap) (DepMap, 2020; McFarland et al., 2018) containing over 600 cancer cell lines of different histological types, including 43 glioma cell lines. We focused on 14 genes that encode the key enzymes in the sphingolipid synthesis pathway (Figures 1A and S1A) and are coordinately upregulated in GBM clinical samples (Figures S1B and S1C). We identified SMPD1, also known as ASM, as the top survival dependency among these 14 genes in glioma cell lines (Figures 1B, S1D, and S1E). Concordant with its potential role in driving tumor growth, elevated SMPD1 expression is associated with significantly shorter survival in patients with GBM from multiple public cancer patient datasets (Figures 1C and S1F–S1H).
Figure 1. GBMs depend on SMPD1 for survival, making them sensitive to fluoxetine-mediated cell death.

(A) Schematic pathway of sphingolipid metabolism in plasma membrane lipid remodeling of GBM cells.
(B) shRNA effect scores and mRNA levels of SMPD1 in glioma and other CCLE cell lines from the DepMap dataset.
(C) Kaplan-Meier analysis of overall survival of patients with high or low SMPD1 mRNA expression in the TCGA GBM (RNA sequencing [RNA-seq]) dataset.
(D) Enzymatic activity of SMPD1 in U87EGFRvIII cells with 24-h fluoxetine treatment.
(E) Percentage of Annexin V-positive U87EGFRvIII cells (n = 3).
(F) Brief information, including major genomic features, of 18 patient-derived GBM neurosphere lines.
(G) Cell viability curves of three non-cancer cell lines (NHA, RPE1, and IMR90) and 18 GBM neurosphere lines in response to fluoxetine treatment (n = 4).
(H) LysoTracker staining in indicated cell lines (n = 60).
(I) mRNA level (RNA Seq V2 RSEM) in TCGA GBM patient samples.
(J) Percentage of Annexin V-positive U87EGFRvIII cells with indicated shRNA knockdown (non-targeting [NT]).
(K–M) Representative tumor images (K), SMPD1 enzymatic activity (n = 4) (L), and tumor signal intensity (n = 7) (M) of U87EGFRvIII orthotopic xenograft models. Scale bar, 5 mm.
Data represent mean ± SD, except (I). The median value (center line) and the 25th and 75th percentiles (dashed lines) are presented in (I). Two-tailed Student’s t test (B and H). Log rank test (C). ANOVA with Tukey’s multiple comparisons test (E, I, J, L, and M). ***p < 0.001.
CN, copy number; n/a, not available; NS, not significant. See also Figures S1 and S2 and Table S1.
Pharmacological inhibition of SMPD1 by fluoxetine selectively kills GBMs
SMPD1 catalyzes the conversion of sphingomyelin to ceramide (Hannun and Obeid, 2018). Complete genetic loss of SMPD1, which occurs in children with Niemann-Pick disease (Schuchman and Desnick, 2017), results in elevated sphingomyelin levels, lysosomal stress, and cell death in some contexts (Hannun and Obeid, 2018; Schuchman and Desnick, 2017). To determine whether GBM cells, because of their enhanced dependence on SMPD1, could potentially be highly sensitive to a pharmacological inhibitor of SMPD1, we searched the literature for FDA-approved, brain-penetrant drugs that have been shown to inhibit SMPD1 enzymatic activity. The SSRI antidepressant fluoxetine was recently identified as a potential SMPD1 inhibitor (Gulbins et al., 2013; Kornhuber et al., 2008). In GBM cells, fluoxetine inhibited SMPD1 enzymatic activity (Figure 1D), resulting in dose-dependent GBM cell death (Figures 1E and S2A–S2D). SMPD1 overexpression abrogated the effect of fluoxetine on GBM cells, supporting on-target activity (Figures 1E, S2E, and S2F). To further determine the anti-GBM potential of fluoxetine, we performed a sensitivity screen in 3 non-cancer cell lines and 18 patient-derived GBM cultures of various tumor genotypes (Figure 1F; Table S1). Fluoxetine resulted in tumor-specific cell death (Figure 1G) and caused extensive lysosomal stress in the patient-derived GBM cultures (Figure 1H), as would be predicted as a marker for an SMPD1 inhibitor (Schuchman, 2010).
To determine whether the anti-tumor effect could be mediated through the serotonin reuptake system, we analyzed the serotonin transporter SLC6A4 and the serotonin receptor HTR2C. Neither gene was expressed at appreciable levels in GBM clinical samples (Figure 1I), and short hairpin RNA (shRNA) knockdown of either gene did not significantly affect GBM viability, in contrast with shRNA knockdown of SMPD1, which caused substantial GBM cell death (Figures 1J and S2G). Other serotonin receptors also failed to show appreciable transcript levels or survival association in the Cancer Genome Atlas (TCGA) GBM dataset (Figures S2H and S2I). Importantly, fluoxetine administration significantly inhibited tumor growth, in accordance with dramatic inhibition of SMPD1 enzymatic activity, in orthotopic xenografts implanted in the brain of nude mice (Figures 1K–1M), which were rescued by SMPD1 overexpression (Figures 1K–1M). These data do not exclude a potential modulatory role for serotonergic activity in the tumor microenvironment (Caudill et al., 2011; Dolma et al., 2016; Mahé et al., 2004), but they do further suggest that fluoxetine kills GBM cells through an alternative mechanism, including SMPD1 inhibition in vitro and in vivo. Together, these results suggest that GBMs depend on SMPD1 for survival and are highly sensitive to fluoxetine-mediated SMPD1 inhibition.
Fluoxetine kills GBM cells by disrupting sphingomyelin metabolism with resultant inhibition of oncogenic EGFR signaling
Many GBMs contain amplified EGFRvIII, a constitutively active form mutation of EGFR driving GBM malignant progression (Cloughesy et al., 2014). In our sensitivity screen, we found that GBMs with EGFRvIII amplification were significantly more sensitive to fluoxetine than other GBMs (Figure 2A). Further, overexpression of EGFRvIII in a GBM cell line globally increased sphingolipids levels (Figures S2J and S2K), sensitized tumor cells to an inhibitor of sphingolipid de novo synthesis (Figures S2L–S2N), as well as SMPD1 shRNA knockdown (Figures S2O–S2Q), and generated dose-dependent sensitivity to fluoxetine (Figures S2A–S2C). Patient-derived GBMs with endogenously amplified EGFRvIII were similarly highly sensitive to SMPD1 depletion or fluoxetine, both in neurosphere cultures (Figures 2B–2D and S2R) and in orthotopic xenografts implanted in the brain of nude mice (Figures 1K–1M), further suggesting a potential role of EGFRvIII or downstream oncogenic signaling in the anti-GBM effect of fluoxetine.
Figure 2. Fluoxetine’s inhibition of SMPD1 blocks oncogenic EGFR signaling in GBM cells.

(A) Fluoxetine sensitivity (area under the cell viability curve) of 3 non-cancer cell lines and 18 patient-derived GBM neurospheres, including 4 EGFRvIII-amplified lines.
(B) Relative cell viability of EGFRvIII-amplified GBM neurosphere lines with SMPD1 or non-targeting shRNAs (n = 4).
(C) SMPD1 enzymatic activity in GBM neurospheres with 24 h of fluoxetine treatment (n = 4).
(D) Percentage of Annexin V-positive cells in normal human astrocytes (NHAs) and GBM neurospheres (n = 4).
(E and F) Gene set enrichment analysis identifies differentially enriched or depleted transcripts in three GBM neurosphere cultures treated with fluoxetine versus DMSO.
(G and H) Gene set enrichment analysis of differentially expressed genes in TCGA GBM clinical samples (HUG133A) with high or low SMPD1 expression.
(I) Drug sensitivity correlation of fluoxetine, 4 EGFR inhibitors, and 4 other SSRI antidepressants in 40 glioma cell lines from the DepMap dataset.
(J) EGFR signaling in indicated GBM cells.
(K) EGFR signaling in GBM39 cells with 24-h treatments.
(L) EGFR phosphorylation in U87EGFRvIII orthotopic xenograft tumors.
(M) Viability of GBM39 cells expressed vector or a constitutively active AKT E17A-CA allele (n = 4).
(N) SMPD1 enzymatic activity in GBM39 cells treated with DMSO or 5 μM fluoxetine (n = 4).
(O) Schematic of sphingomyelin (d18:1/n16:0-d9) metabolomics assay.
(P and Q) Abundance of sphingomyelin (d18:1/n16:0-d9) (P) and ceramide (d18:1/n16:0-d9) (Q) in U87EGFRvIII cells with indicated treatment (n = 4).
(R and S) Lipidomics analysis of endogenous sphingomyelins in U87EGFRvIII cells with 24 h of treatment and with SMPD1 overexpression (n = 5). Relative abundance of representative sphingomyelins is plotted in (S).
(T) LAMP1 staining of GBM cells. Scale bar, 20 μm.
Data represent mean ± SD, except for mean ± SEM in (S). Two-tailed Pearson (I). Two-tailed Student’s t test (R). ANOVA with Tukey’s multiple comparisons test (A–D, M, N, P, Q, and S). *p < 0.05, **p < 0.01, ***p < 0.001. See also Figures S2–S4.
RNA sequencing in these three EGFRvIII-amplified, patient-derived GBM neurosphere lines treated with fluoxetine for 42 h revealed a transcriptional signature indicative of EGFR inhibition (Figures 2E, 2F, and S3A–S3D). Analysis of TCGA GBM clinical samples revealed a highly significant correlation between EGFR amplification, the transcriptional signature of EGFR signaling, EGFR expression, and SMPD1 expression (Figures 2G, 2H, S3E, and S3F), suggesting a potential molecular basis for enhanced fluoxetine sensitivity that was consistent with enhanced SMPD1 survival dependency in glioma cell lines with elevated EGFR protein levels. Interestingly, in the merged patient cohort of low-grade glioma and GBM, deep deletion of SMPD1 and EGFR amplification/mutations are mutually exclusive (p < 0.001) (Figure S3G), suggesting a synthetic lethal interaction between SMPD1 and EGFR. In TCGA clinical dataset, IDH1 wild-type GBMs with higher SMPD1 expression have a significantly shorter survival in the EGFR amplification/gain cohort and the classical-like cohort (Figures S3H and S3I). We further noted that, surprisingly, in an analysis of the drug sensitivity dataset from DepMap among all 40 glioma cell lines, fluoxetine clustered with 4 bona fide EGFR inhibitors, but not with 4 other SSRI antidepressants (Figure 2I), further indicating the anti-GBM activity of fluoxetine may be through inhibiting EGFR signaling, but not serotonin transporters.
Next, we set out to determine how fluoxetine might affect EGFR signaling. Genetic depletion of SMPD1 using two independent shRNA constructs suppressed EGFRvIII signaling (Figures 2J and S4A). Fluoxetine also potently inhibited EGFRvIII signaling, in vitro and in vivo, which was significantly reversed by overexpressing SMPD1 (Figures 2K, 2L, and S4B–S4D). Confirming that the loss of EGFRvIII signaling contributes to fluoxetine’s anti-GBM activity, we focused on AKT, which has been shown as a major signaling output that is required for EGFRvIII’s oncogenic effects (Cloughesy et al., 2014). Expression of the constitutively active AKT E17A-CA allele significantly rescued the anti-tumor effect of fluoxetine (Figures 2M, S4E, and S4F). Consistent with the significant association between the expression of SMPD1 with EGFR, but not other receptor tyrosine kinases (RTKs) genes, in GBM clinical samples, no obvious change was detected on the activity of PDGFRA, FGFR1, and MET in fluoxetine-treated GBM cells (Figures S3F, S4G, and S4H), suggesting a relative selectivity for EGFR and EGFR-driven signaling as important targets of SMPD1 inhibition in GBM.
Fluoxetine rapidly inhibited SMPD1 enzymatic activity (Figure 2N), but inhibition of EGFRvIII phosphorylation and downstream signaling became apparent only after approximately 24 h (Figures 2K and S4I), raising the possibility that altered sphingolipid levels may play a key role in suppressing EGFRvIII signaling. To test this hypothesis, we developed a quantitative mass spectrometry assay to determine the effect of fluoxetine on sphingolipid levels. GBM cells were fed with a deuterated sphingomyelin (d18:1/16:0-d9), which is an SMPD1 substrate. Fluoxetine treatment for 6 h significantly increased the sphingomyelin (d18:1/16:0-d9) level while concomitantly lowering the ceramide (d18:1/16:0-d9) level, which was rescued by SMPD1 overexpression (Figures 2O–2Q). These results indicate that fluoxetine potently inhibits SMPD1 enzymatic activity elevating sphingomyelin levels. To confirm these findings and assess the effect of fluoxetine on endogenous sphingomyelins, we performed another mass spectrometry analysis, demonstrating that fluoxetine treatment significantly increased endogenous sphingomyelin levels in GBM cells (Figures 2R, 2S, and S4J–S4L), which was rescued by overexpression of SMPD1 (Figures 2R and 2S). As anticipated with elevated sphingomyelin, we also observed a lysosomal stress response (Figures 2T, S4M, and S4N).
Disrupting sphingomyelin metabolism inhibits EGFR activity on the plasma membrane of GBM cells
SMPD1 inhibition, by altering sphingomyelin levels, could potentially affect the structural organization of the plasma membrane, including the highly ordered microdomains, referred to as lipid rafts, in which much signal transduction is thought to occur (Arkhipov et al., 2013; Bi et al., 2019; Sezgin et al., 2017). Therefore, we analyzed the effect of fluoxetine on membrane order in live GBM cells by using the lipid-phase-sensitive fluorescent probe Laurdan (Owen et al., 2011; Parasassi et al., 1997). Laurdan staining quantifies shifts in the emission spectra generated by probe binding to ordered versus disordered phases in the plasma membrane (Owen et al., 2011). Fluoxetine treatment lowered the generalized polarization (GP) values of the plasma membrane (Figures 3A and 3B). SMPD1 overexpression reversed the effect of fluoxetine on sphingomyelin profiles and membrane order (Figures 2R, 2S, 3A, and 3B), thereby demonstrating a direct effect on tumor cell plasma membrane architecture. In line with the recent finding that SMPD1 inhibition caused KRAS mislocalization from the plasma membrane (Cho et al., 2015; Schuchman, 2010), fluoxetine treatment resulted in depletion of EGFRvIII from the plasma membrane with loss of downstream EGFRvIII signaling (Figures 3C and 3D), which was rescued by SMPD1 overexpression, both in vitro and in vivo (Figures 2L and S4C). Concordant with these changes, we observed a dramatic loss of EGFRvIII from the raft marker-enriched membrane fraction (Figures 3E and 3F) in fluoxetine-treated GBM cells, as well as an enhanced EGFR internalization from the plasma membrane in fluoxetine-treated GBM cells (Figure 3G). This was followed by reduced EGFRvIII protein levels, which was partially rescued by proteasome and lysosome inhibitors (Figures S5A–S5E), potentially explaining the reduced levels of EGFRvIII protein, as well as the reduced levels of pEGFRvIII and its downstream effectors (Figures 2K and S4B).
Figure 3. By increasing sphingomyelin levels, fluoxetine causes loss of cell surface EGFR from membrane rafts with subsequent receptor internalization and degradation.

(A and B) Laurdan imaging analysis of membrane lipid order in U87EGFRvIII cells at baseline, after fluoxetine treatment, and with overexpression of an SMPD1 construct. Generalized polarization (GP) images indicate higher membrane order (red) and lower membrane order (blue). Scale bar, 20 μm.
(C and D) Imaging and flow cytometry analysis (n = 3) of cell surface EGFR in GBM cells. Scale bar, 10 μm.
(E) EGFRvIII and marker proteins in the membrane fractions of GBM39 cells. Calnexin is a marker for non-lipid rafts fractions, while Gα(q) and Flotillin-1 are markers of lipid rafts.
(F) Percentage of indicated protein levels in fraction 1, the lipid rafts fraction, which is absent with non-lipid rafts marker Calnexin and present with lipid raft markers Gα(q) and Flotillin-1. Data were normalized to total protein levels of all six fractions (n = 3).
(G) Internalized EGFR of GBM39 cells by flow cytometry (n = 4).
(H) EGFR signaling in GBM39 cells treated with sphingomyelins or vehicle.
(I) EGFR staining in GBM39 cells with SM d18:1/n16:0 treatment. Scale bar, 10 μm.
(J) Schematic model of the fluoxetine-SMPD1 axis in regulating sphingomyelin metabolism and oncogenic receptor signaling of GBM cells.
Data represent mean ± SD. Two-tailed Student’s t test (D, F, and I). ANOVA with Tukey’s multiple comparisons test (G). *p < 0.05, ***p < 0.001. See also Figure S5.
To further confirm that the effect of fluoxetine on EGFRvIII signaling was mediated by SMPD1 inhibition, we added SM d18:1/n16:0 and SM d18:1/n24:0, the two sphingomyelins that were identified to be highly enriched in GBM (Figure S4L), to GBM cells. Both sphingomyelins significantly suppressed EGFRvIII signaling and GBM cell viability, which was further enhanced by fluoxetine (Figures 3H and S5F–S5I). Ceramide was not able to rescue these effects (Figure S5F). Further, the addition of SM d18:1/n16:0 caused loss of EGFRvIII from the plasma membrane of GBM cells (Figure 3I), mimicking the effects of fluoxetine. In contrast, blocking sphingomyelin synthase, an enzyme that catalyzes sphingomyelin synthesis from ceramide (Figure S5J), may potentially decrease the sphingomyelin accumulation caused by SMPD1 inhibition. We found that knockdown of SGMS1, a key coding gene of the sphingomyelin synthase expressed in GBM and downregulated in EGFR-amplified GBMs (Figures S5K and S5L), significantly rescued the cell viability and EGFR activity of GBM cells treated with fluoxetine (Figures S5M–S5P). Taken together, these results suggest that fluoxetine causes loss of EGFR from the plasma membrane and inhibits EGFR signaling by blocking SMPD1 enzymatic activity and elevating sphingomyelin levels (Figure 3J).
Fluoxetine efficacy in patient-derived orthotopic GBM mouse models
Fluoxetine is highly brain penetrant (Bolo et al., 2000; Karson et al., 1993) and is FDA approved for a variety of neuropsychiatric disorders (Eli Lilly and Company, 2017; Wong et al., 2005). It has been demonstrated to be safe over a range of doses from 20 to 80 mg/day, with most depression patients being treated with the lower doses (Eli Lilly and Company, 2017). To better understand how fluoxetine could potentially be used as a treatment, we tested the calculated mouse equivalent oral doses of the FDA-approved dose range in patient-derived, EGFRvIII-amplified GBMs implanted into the brains of nude mice (Figures 4A and S6A). In the GBM39 model, we observed significant, dose-dependent tumor growth inhibition and markedly prolonged mouse survival at mouse dose equivalents of 50 and 80 mg/day (Figures 4B, 4C, and S6B). No toxicity was observed (Figure S6C). The low-dose fluoxetine treatment, 4.2 mg/kg, which translates to 20 mg/day in humans, did not affect tumor growth (Figures 4B and 4C). In a second independent, patient-derived, EGFRvIII-amplified GBM model implanted into the brains of nude mice, HK296 daily treatment with 10 and 15 mg/kg significantly inhibited GBM growth (Figures 4D and 4E), blocked tumor cell proliferation (Figures 4F and S6D), induced tumor cell death (Figures 4G and S6D), and markedly prolonged mouse survival (Figure 4H), concomitant with EGFR inhibition and increased lysosomal stress (Figures 4I–4K, S6E, and S6F). Importantly, fluoxetine-treated mice showed no evidence of toxicity, no weight loss, and no cell death or elevation of LAMP1 in the surrounding brain, using antibodies that detect both human and mouse protein (Figures 4G and S6C–S6F). These results demonstrate that clinically safe and achievable doses of fluoxetine that can inhibit SMPD1 activity may potentially be used to treat patients with GBM, and that there is likely to be a relatively wide therapeutic window.
Figure 4. Fluoxetine promotes tumor regression and prolongs survival of mice bearing patient-derived orthotopic GBMs.

(A) Schematic of the fluoxetine treatment protocol in patient-derived GBM orthotopic xenograft mouse models.
(B and C) Tumor signal intensity (B) and Kaplan-Meier survival analysis (C) of patient-derived GBM39 orthotopic xenograft models with vehicle or fluoxetine administration (n = 6, p.o., daily). Safety doses of fluoxetine for human non-cancer indications were converted to mouse doses based on body surface area. 4.2 and 16.4 mg/kg in mice are equal to the minimal and maximal suggested dose for human indications, respectively.
(D and E) Representative tumor images at week 15 (D) and tumor signal intensity (E) of patient-derived HK296 orthotopic xenograft models with vehicle or fluoxetine administrations (n = 8, orally [p.o.], daily). Scale bar, 5 mm. The median value (center line), the minimum (min) and maximum (max) (whiskers), and the 25th and 75th percentiles (box perimeters) are presented.
(F) Percentage of Ki67-positive cells in HK296 xenograft tumors.
(G) Percentage of TUNEL-positive cells in HK296 xenograft tumors and surrounding mouse brains.
(H) Kaplan-Meier survival analysis of mice bearing HK296 xenograft tumors (n = 8).
(I–K) Immunohistochemistry analysis of two biomarkers, phosphorylated EGFR and LAMP1, in HK296 xenograft tumors. Scale bar, 50 μm.
Data represent mean ± SD (B) or mean ± SEM (F, G, J, and K). ANOVA with Tukey’s multiple comparisons test (B, E–G, J, and K). Log rank test (C and H). *p < 0.05, **p < 0.01, ***p < 0.001, ****p < 0.0001. See also Figure S6.
Combining fluoxetine with TMZ suppresses GBM recurrence and prolongs survival
Currently, most patients with GBM, including those with EGFRvIII amplification, are treated with the alkylating chemotherapy TMZ, in addition to surgery and radiotherapy. Although the effects of fluoxetine monotherapy were clear, they were not over-whelming, and we hypothesized that fluoxetine might synergize TMZ because of the potential role for EGFR signaling in regulating DNA damage repair (Squatrito and Holland, 2011). We also found that fluoxetine treatment resulted in the downregulation of genes in DNA repair pathways in GBM cells (Figures S7A and S7B). In vitro, fluoxetine was highly synergistic with TMZ in inducing DNA damage and cell death in multiple GBM models (Figures 5A–5C and S7C–S7J). This combination effect was mediated through downstream EGFRvIII signaling because the AKT E17A-CA allele rescued the cell death (Figure 5C).
Figure 5. Combining fluoxetine with temozolomide suppresses GBM recurrence and prolongs survival.

(A) Synergistic effect of fluoxetine and temozolomide (TMZ) in U87EGFRvIII cells (n = 4).
(B) γH2AX staining in GBM neurospheres. 2.5 μM for fluoxetine, and 50 μM for TMZ. Scale bar, 10 μm.
(C) Percentage of Annexin V-positive U87EGFRvIII cells (n = 4). 2.5 μM for fluoxetine, and 50 μM for TMZ.
(D) Schematic overview of the fluoxetine-TMZ combination therapy in patient-derived GBM39 orthotopic xenograft models.
(E–G) Tumor signal intensity (E), representative tumor images at week 5 (F), and Kaplan-Meier survival analysis (G) of patient-derived GBM39 orthotopic xenograft models with indicated administrations (n = 6 or 8 mice per group). Scale bar, 5 mm.
Data represent mean ± SD. ANOVA with Tukey’s multiple comparisons test (C and E). Log rank test for survival and Fisher’s exact test for tumor recurrence (G). ***p < 0.001. See also Figure S7.
Therefore, we compared daily oral fluoxetine treatment alone or in combination with TMZ treatment for 5 days, followed by maintenance on just fluoxetine (Figure 5D). In the GBM39 orthotopic model, daily fluoxetine was as effective as a 5-day course of daily TMZ at inhibiting tumor growth and prolonging mouse survival (Figures 5E–5G), and the impact of combination therapy was marked. Continuous daily oral 10 mg/kg fluoxetine treatment, in addition to a 5-day course of TMZ, resulted in prolonged suppression of tumor growth (Figures 5D–5F). Most importantly, mouse survival of the group with 5 mg/kg TMZ combination therapy more than doubled (p = 0.0011), with two of six mice showing no tumor recurrence at all after 10 weeks of treatment (Figures 5G and S7K). In the 20 mg/kg TMZ combination therapy group, six of eight mice showed no tumor recurrence at all after 5 months of treatment (Figures 5G, S7L, and S7M). No evidence of systemic or neural toxicity, no weight loss, and no cell death or elevation of LAMP1 in the surrounding brain was detected. Taken together, these data suggest that adding fluoxetine at a clinically demonstrated safe dose to standard-of-care TMZ, followed by fluoxetine maintenance, could have a major effect on tumor progression, recurrence, and survival.
Combining fluoxetine with standard-of-care treatment improves the survival of patients with brain tumor
Realizing that fluoxetine has been prescribed for years, we wondered whether we could find “real-world evidence” that exists in the electronic medical records. We started by examining electronic medical records from the IBM MarketScan insurance claims dataset (2003–2017), which documents healthcare encounters of over 180 million American enrollees. The ascertained death status was available for 378,685 enrollees. Because GBM is a rare condition, and because we used very stringent exclusion criteria to identify patients with and without SSRI treatment, the sample size of actual analysis was n = 238; we choose to sacrifice statistical power over quality.
We started by looking for patients who have an ICD9 or ICD10 (International Classification of Diseases) code for “malignant neoplasm of brain” (Table S2), are over the age of 18 years, and lack any other cancers that could be metastatic. We then looked only for adult patients who had surgical resection of the tumor along with radiation therapy and TMZ, to ensure that we are looking at patients with GBM (Figure 6A; Tables S3 and S4). For a final cohort of 238 patients with GBM, we estimated survival probability and hazard ratio of all-cause deaths with and without SSRI exposure after controlling for age, sex, 6-month baseline pre-GBM comorbidities, and also for immortal time bias (Lévesque et al., 2010; Suissa, 2008). We found that patients who had fluoxetine added to standard of care had significantly longer median overall survival (fluoxetine versus control: 545 versus 318 days). The age, sex, and baseline comorbidity score adjusted hazard ratio of all-cause death in the fluoxetine-treated group was 0.42 (95% confidence interval [CI], 0.20–0.88; p = 0.022) compared with those not treated with any of the three SSRIs considered in this study (Figure 6B; Table S5). This survival benefit was not found in patients treated with two other SSRIs, citalopram and escitalopram (Figures 6C and 6D; Table S5), which were also shown not to have activity against glioma cell lines (Figure 2I), further suggesting the anti-GBM activity of fluoxetine is independent of its function as an SSRI and pointing to the unique anti-GBM activity of fluoxetine. To account for all addressable (represented in data) confounders in our observational analysis, we further performed a stricter propensity score-matched analysis of SSRI-treated and non-treated patients with GBM, accounting for age, sex, and baseline comorbidities (Table S4). As a result of this stricter 1:2 matching (each SSRI-treated patient is matched to two non-SSRI-treated patients), the matched cohort size shrunk, but the survival benefit of fluoxetine against GBM became even stronger (hazard ratio of 0.33 [95% CI, 0.13–0.86]) and remained statistically significant (p = 0.023) (Table S6). These results suggest that a combination of fluoxetine with standard-of-care treatment may help to improve the survival of patients with brain tumor (Figure S7N).
Figure 6. Real-world electronic medical record evidence for efficacy and specificity: combining fluoxetine, but not citalopram or escitalopram, significantly prolongs survival of patients with brain tumor.

(A) Outline of the strategy utilized for definition and enrichment of GBM patient cohort in electronic medical records from the IBM MarketScan dataset (2003–2017).
(B–D) Survival curve of patients in the GBM-enriched cohort treated with fluoxetine (B) and two other SSRI antidepressants, citalopram (C) and escitalopram (D), using time-dependent Kaplan-Meier curves. The adjusted hazards ratio was obtained from the extended Cox proportional hazards model after adjusting for age, sex, and 6-month baseline comorbidities and using SSRI antidepressant treatment as a time-dependent variable.
DISCUSSION
GBM has one of the most well-characterized mutational landscapes of any cancer type. Tumors with amplified, bona fide, growth-promoting oncogenes occur in over 50% of GBMs, presenting extremely compelling drug targets. However, the therapeutic promise of precision oncology has yet to be realized for patients with GBM. The challenges include: (1) the poor brain/plasma ratio of many targeted cancer drugs that results in dose-limiting toxicities that preclude effective target inhibition, (2) the unique physiology of the central nervous system that contributes to tumor progression in ways that are only beginning to be understood (Bi et al., 2020; Quail and Joyce, 2017), and (3) the frequency of ecDNA amplification in GBM and the rapid and reversible dynamics it causes collectively create significant therapeutic challenges. The hoped-for new GBM drugs, FDA approvals, and better outcomes for patients have yet to materialize. Here, by identifying the enhanced dependence of GBMs on SMPD1, showing how it is required for regulating plasma membrane dynamics and oncogenic signaling, and showing that fluoxetine, which has remarkably favorable pharmacokinetic properties and ability to effectively inhibit SMPD1 enzymatic activity, reveals a unique ability among SSRI antidepressants that can translate into benefit for patients. We have identified a potentially effective new way of treating GBM with a safe, repurposed, FDA-approved drug and determined the molecular mechanistic basis underlying it.
Antidepressants are commonly used in medical practice. As we have shown here, fluoxetine differs from other SSRIs with vastly differing effects on patient survival and on inhibiting oncogenic EGFR signaling. Therefore, it is not surprising that the two major studies that have looked at the effect of antidepressants on the outcome in patients with GBM did not find a significant signal; they did not distinguish among SSRIs (Caudill et al., 2011; Otto-Meyer et al., 2020). In fact, FDA leadership recently suggested that real-world evidence derived from data sources such as electronic health records and insurance databases may have an important role in complementing, but not replacing, randomized controlled clinical trials (Corrigan-Curay et al., 2018; Jarow et al., 2017; Sherman et al., 2016). Incorporating this type of clinical evidence greatly strengthens the mechanistic and mouse model data we provide, nominating fluoxetine in combination with standard of care as a treatment for GBM and suggesting the need for randomized clinical trials in the near term.
Our paper also provides new and unique insight into the critical dependency of GBMs on SMPD1 and its impact on plasma membrane dynamics, including EGFR signaling. We find a critical link between sphingomyelin metabolism and oncogenic receptor signaling on the plasma membrane of GBM cells. Lipids function as essential components of the plasma membrane, and their compositions are precisely regulated in forming signal microdomains (Lingwood and Simons, 2010; Sezgin et al., 2017; van Meer et al., 2008). Fluoxetine, by blocking SMPD1, causes sphingomyelin to accumulate, resulting in the loss of EGFR receptors from lipid rafts domains and from the cell surface of tumor cells. Interestingly, inhibiting SMPD1 was reported to similarly cause KRAS loss from the plasma membrane of MDCK cells (Cho et al., 2015). Therefore, it will be important in the future to determine whether other amplified growth factor receptors similarly induce SMPD1 dependency in GBM and other cancers. Further, sphingomyelins show interaction with cholesterol in the plasma membrane in regulating membrane properties and many intracellular signaling processes (Das et al., 2014; Endapally et al., 2019; Lingwood and Simons, 2010). SMPD1-mediated sphingomyelin metabolism alters the accessible cholesterol pool of the plasma membrane (Das et al., 2014; Endapally et al., 2019), indicating a potential role of membrane cholesterol in the fluoxetine-SMPD1-EGFR axis. This result is consistent with our previous findings that amplified growth factor receptors in GBM may generate a metabolic dependency on cholesterol and saturated phospholipids (Bi et al., 2019, 2020; Villa et al., 2016).
Fluoxetine was initially developed and approved as a SSRI for patients with depression (Wong et al., 2005), and it has been recently shown to inhibit SMPD1 enzymatic activity in some contexts (Gulbins et al., 2013; Kornhuber et al., 2008). Our data in GBM tumor cells indicate that fluoxetine blocks over 60% of SMPD1 enzymatic activity within 6 h and may act as an indirect inhibitor of EGFR by blocking SMPD1 and elevating sphingomyelin levels. Complete germline loss of SMPD1 causes lysosomal storage disorders because of excess sphingomyelins on the lysosomal membrane (Schuchman and Desnick, 2017). Lysosomal stress that was detected in GBM tumor cells treated with fluoxetine may also contribute to tumor cell death (Petersen et al., 2013) and may be a main mechanism of sensitization in non-EGFR-driven GBMs. Indeed, we found that GBM cells of many different mutational backgrounds were highly sensitive to fluoxetine, although not quite as sensitive as tumor cells containing amplified EGFRvIII or wild-type EGFR. We hypothesize that this sensitivity is mediated through lysosomal stress, which merits further study. Further, besides the DNA repair pathway, other downstream pathways may also potentially contribute to the sensitivity of GBM cells to fluoxetine-TMZ combination therapy (Ma et al., 2016).
Limitations of the study
GBMs exhibit considerable intratumoral, cellular genetic, and biochemical heterogeneity. Individual cells within EGFRvIII-amplified tumors can vary in EGFRvIII DNA, RNA, and protein levels, which may impact downstream signaling and the sensitivity to fluoxetine. Although our data show dramatic effects in models that capture this heterogeneity, we cannot exclude that there are likely differences in cell-to-cell response. We focused on EGFR/EGFRvIII amplification because it is the most commonly amplified RTK in GBMs. However, our focus on EGFR/EGFRvIII limited our analysis of other RTKs. Future studies will be needed to completely understand the spectrum of patients with GBM who could potentially benefit from fluoxetine treatment.
Real-world evidence is retrospective and may contain potential biases. For example, in our study, the electronic medical records were from patients who died in the hospital. This accounts for a small fraction of patients with GBM and may be related to the relatively shorter median survival of patients treated with standard of care in this cohort than often seen. The number of patients taking fluoxetine after GBM diagnosis also limited our interpretation of its clinical impact. A well-controlled, prospective, randomized clinical trial will be needed to determine whether addition of fluoxetine to standard-of-care treatment improves survival of patients with GBM and to optimize dosing.
STAR⋆METHODS
RESOURCE AVAILABILITY
Lead contact
Further information and requests for resources and reagents should be directed to and will be fulfilled by the lead contact, Paul S. Mischel (pmischel@stanford.edu).
Materials availability
All unique reagents generated in this study will be available upon request. A materials transfer agreement may be required.
Data and code availability
All RNA-seq data generated in this study have been deposited at the GEO database (GEO: GSE158674) and are publicly available as of the date of publication. More data of patient analysis in electronic medical records generated in this study have been deposited at Mendeley Data and are publicly available as of the date of publication. Accession numbers or DOIs are listed in the key resources table. Other data reported in this paper will be shared by the lead contact upon request.
All software and packages applied are publicly available and listed in the key resources table and methods. This paper does not report original code.
Any additional information required to reanalyze the data reported in this paper is available from the lead contact upon request.
KEY RESOURCES TABLE.
| REAGENT or RESOURCE | SOURCE | IDENTIFIER |
|---|---|---|
|
| ||
| Antibodies | ||
|
| ||
| Rabbit anti-pEGFR-Y1068, Clone D7A5 (WB 1:1000, IHC 1:800) | Cell Signaling | Cat#3777; RRID:AB_2096270 |
| Rabbit anti-EGFR (WB 1:10000) | Millipore | Cat# 06-847; RRID:AB_2096607 |
| Mouse anti-EGFR (Ab-1), Clone 528 (Flow 1:20) | Millipore | Cat#GR01; RRID:AB_564572 |
| Rabbit anti-EGFR (D38B1) conjugated with Alexa Fluor-488 (IF 1:200) | Cell Signaling | Cat#5616; RRID: AB_10691853 |
| Rabbit Anti-LAMP1, Clone D2D11 (IF and IHC 1:200) | Cell Signaling | Cat#9091; RRID:AB_2687579 |
| Rabbit Anti-LAMP1 (IHC 1:200) | Abcam | Cat#ab24170, RRID:AB_775978 |
| Rabbit Anti-PDGFRA, Clone D1E1E (WB 1:1000) | Cell Signaling | Cat#3174; RRID:AB_2162345 |
| Rabbit Anti-pPDGFRA-Tyr754, Clone 23B2 (WB 1:1000) | Cell Signaling | Cat#2992; RRID:AB_390728 |
| Rabbit Anti-FGFR1, Clone D8E4 (WB 1:1000) | Cell Signaling | Cat#9740; RRID:AB_11178519 |
| Mouse Anti- Phospho-FGF Receptor (Tyr653/654), Clone 55H2 (WB 1:500) | Cell Signaling | Cat#3476; RRID:AB_331369 |
| Rabbit Anti-Met, Clone D1C2 (WB 1:1000) | Cell Signaling | Cat#8198; RRID:AB_10858224 |
| Rabbit Anti-Phospho-Met (Tyr1234/1235), Clone D26 (WB 1:500) | Cell Signaling | Cat#3077; RRID:AB_2143884 |
| Rabbit anti-pAkt-S473, Clone D9E (WB 1:3000) | Cell Signaling | Cat#4060; RRID:AB_2315049 |
| Rabbit anti-pS6-S235/236, Clone D57.2.2E (WB 1:3000, IHC 1:400) | Cell Signaling | Cat#4858; RRID:AB_916156 |
| Mouse Anti-rH2AX/ phosphor-Histone H2A.X (Ser139), Clone JBW301 (IF 1:200) | Millipore | Cat#05-636; RRID:AB_309864 |
| Rabbit anti-Flotillin-1, Clone D2V7J (WB 1:1000) | Cell Signaling | Cat#18634; RRID:AB_2773040 |
| Rabbit anti- Gα(q), Clone D5V1B (WB 1:1000) | Cell Signaling | Cat#14373; RRID:AB_2665457 |
| Rabbit anti-Calnexin, Clone C5C9 (WB 1:1000) | Cell Signaling | Cal#2679; RRID:AB_2228381 |
| Mouse anti-actin, Clone AC40 (WB 1:3000) | Sigma | Cat#A4700; RRID:AB_476730 |
| Anti-rabbit IgG, HRP-linked (WB 1:2000) | Cell Signaling | Cat#7074; RRID:AB_2099233 |
| Anti-mouse IgG, HRP-linked (WB 1:2000) | Cell Signaling | Cat#7076; RRID:AB_330924 |
| Alexa Fluor anti-rabbit 546 (IF 1:500) | ThermoFisher Scientific | Cat#A11010; RRID:AB_2534085 |
| Alexa Fluor anti-mouse 488 (Flow and IF 1:500) | ThermoFisher Scientific | Cat#A11017; RRID:AB_2534084 |
| Mouse anti-Ki67, Clone 8D5 (IHC 1:500) | Cell Signaling | Cat#9449; RRID:AB_2797703 |
|
| ||
| Chemicals, peptides, and recombinant proteins | ||
|
| ||
| DMEM | Corning | Cat#10-013 |
| DMEM/F12 | GIBCO | Cat#11320-033 |
| Pen Strep Glutamine | GIBCO | Cat#10378-016 |
| Glutamax | GIBCO | Cat#35050-061 |
| B27 | GIBCO | Cat#17504-001 |
| Fetal Bovine Serum (FBS) | Omega Scientific | Cat#FB-21 |
| Epidermal Growth Factor (EGF) | Sigma | Cat#E9644 |
| Fibroblast Growth Factor (FGF) | Sigma | Cat#F0291 |
| Heparin | Sigma | Cat#H3149 |
| AGM BulletKit | LONZA | Cat#CC-3186 |
| C16 Ceramide (d18:1/16:0) | Avanti Polar Lipids | Cat#860516 |
| 16:0 SM (d18:1/16:0) | Avanti Polar Lipids | Cat#860584 |
| 24:0 SM (d18:1/24:0) | Avanti Polar Lipids | Cat#860592 |
| SM (d18:1/n16:0-d9) | Cayman Chemical | Cat#30141 |
| SM (d18:1/17:0) | Avanti Polar Lipids | Cat#860585P |
| Ceramide (d18:1/17:0) | Avanti Polar Lipids | Cat #860517P |
| Fatty acid-free Bovine Serum Albumin | Sigma | Cat#A6003 |
| MG132 | Cell Signaling | Cat#2194 |
| Chloroquine | Cell Signaling | Cat#14774 |
| LysoTracker | Invitrogen | Cat#L7528 |
| Low gelling temperature agarose | Sigma | Cat#A9045 |
| Trypan Blue Solution | GIBCO | Cat#15250061 |
| Opti-Prep Density Gradient Medium | Sigma | Cat#D1556 |
| rTdT | Invitrogen | Cat#10533065 |
| Digoxigenin-11-dUTP | Roche | Cat#11558706910 |
| Anti-Digoxigenin-POD | Roche | Cat#11207733910 |
| Crystal violet solution | Sigma | Cat#V5265 |
| Laurdan (6-Dodecanoyl-2-Dimethylaminonaphthalene) | ThermoFisher Scientific | Cat#D250 |
| Temozolomide | MedChemExpress | Cat#HY-17364 |
| Fluoxetine | MedChemExpress | Cat#HY-B0102A |
|
| ||
| Critical commercial assays | ||
|
| ||
| X-tremeGENE HP DNA Transfection Reagent | Roche | Cat#6366236001 |
| RNeasy Mini Kit | QIAGEN | Cat#74106 |
| SYBR Green Supermix | Bio-Rad | Cat#1708880 |
| BCA Protein Assay Kit | ThermoFisher Scientific | Cat#23225 |
| SuperSignal West Pico PLUS Chemiluminescent Substrate | ThermoFisher Scientific | Cat#34580 |
| FITC Annexin V Apoptosis Detection Kit I | BD Biosciences | Cat#556547 |
| Acid Sphingomyelinase Enzymatic Activity kit | Echelon | Cat#K-3200 |
| CellTiter-Glo | Promega | Cat#G7572 |
|
| ||
| Deposited data | ||
|
| ||
| RNA-seq | This study | GEO: GSE158674 |
| Data S1 | This study | https://data.mendeley.com/datasets/5gww3pgbj3/1 |
|
| ||
| Experimental models: Cell lines | ||
|
| ||
| Human: Normal Human Astrocyte (NHA) | LONZA | CC-2565 |
| Human: IMR90 | ATCC | CCL-186 |
| Human: RPE1 | ATCC | CRL-4000 |
| Human: U87 | ATCC | HTB-14 |
| Human: U87EGFRvIII | Wang et al., 2006 | N/A |
| Human: GBM39 patient-derived neurosphere cells | Nathanson et al., 2014 | N/A |
| Human: HK301 patient-derived neurosphere cells | Laks et al., 2016 | N/A |
| Human: HK296 patient-derived neurosphere cells | Laks et al., 2016 | N/A |
| Human: HK359 patient-derived neurosphere cells | Laks et al., 2016 | N/A |
| Human: HK336 patient-derived neurosphere cells | Laks et al., 2016 | N/A |
| Human: HK217 patient-derived neurosphere cells | Laks et al., 2016 | N/A |
| Human: HK390 patient-derived neurosphere cells | Laks et al., 2016 | N/A |
| Human: HK385 patient-derived neurosphere cells | Laks et al., 2016 | N/A |
| Human: HK254 patient-derived neurosphere cells | Laks et al., 2016 | N/A |
| Human: HK350 patient-derived neurosphere cells | Laks et al., 2016 | N/A |
| Human: HK250 patient-derived neurosphere cells | Laks et al., 2016 | N/A |
| Human: HK229 patient-derived neurosphere cells | Laks et al., 2016 | N/A |
| Human: TS576 patient-derived neurosphere cells | Hu et al., 2016 | N/A |
| Human: CA718 patient-derived neurosphere cells | Turner et al., 2017 | N/A |
| Human: DIPG25 Diffuse Intrinsic Pontine Glioma line | Nagaraja et al., 2019 | N/A |
| Human: DIPG38 Diffuse Intrinsic Pontine Glioma line | Nagaraja et al., 2019 | N/A |
| Human: DIPG36 Diffuse Intrinsic Pontine Glioma line | Nagaraja et al., 2019 | N/A |
| Human: DIPG50 Diffuse Intrinsic Pontine Glioma line | Buczkowicz et al., 2014 | N/A |
| See Table S1 for more detailed information of all cell lines used in this study | N/A | |
|
| ||
| Experimental models: Organisms/strains | ||
|
| ||
| Mouse: Athymic Nude Foxn1nu | Charles River Laboratories | Strain 490 |
|
| ||
| Oligonucleotides | ||
|
| ||
| SMPD1 qPCR forward primer: 5′TGCCAGGTTACATCGCATAG3′ | This study | N/A |
| SMPD1 qPCR reverse primer: 5′AGGTTGATGGCGGTGAATAG3′ | This study | N/A |
| SLC6A4 qPCR forward primer: 5′AACAACTGCTACCAAGATGC3′ | This study | N/A |
| SLC6A4 qPCR reverse primer: 5′CTCATCTCAGCCATGTAACC3′ | This study | N/A |
| HTR2C qPCR forward primer: 5′GATTATGTCTGGCCACTACC3′ | This study | N/A |
| HTR2C qPCR reverse primer: 5′GGAACTGATACACCGATCC3′ | This study | N/A |
| SGMS1 qPCR forward primer: 5′TACACTGTGGACGTGGTGGT3′ | This study | N/A |
| SGMS1 qPCR reverse primer: 5′CAGGAGGTTCATCTGGGAAG3′ | This study | N/A |
| SGMS2 qPCR forward primer: 5′CAATTCCTTGCTGCTTCTCC3′ | This study | N/A |
| SGMS2 qPCR reverse primer: 5′CCAATCTTCTGAACCCGTGA3′ | This study | N/A |
|
| ||
| Recombinant DNA | ||
|
| ||
| pLVX-Puro Vector | Clontech | Cat#632159 |
| pLVX-Puro-SMPD1 | This study | N/A |
| PLVX-Puro-AKT-E17A-CA | Bi et al., 2019 | N/A |
| Non-targeting control shRNA | Bi et al., 2019 | N/A |
| SMPD1-1 shRNA, target sequence: CTGGTTTAGCTGGATATGGGA | This study | N/A |
| SMPD1-2 shRNA, target sequence: CCCACATTTGGGAAAGTTCTT | This study | N/A |
| SLC6A4-1 shRNA, target sequence: GGACATTTAAAGAGCGTATTA | Sigma | TRCN0000422925 |
| SLC6A4-2 shRNA, target sequence: CAAGGCCTCCAGCCACTTATT | Sigma | TRCN0000423041 |
| HTR2C-1 shRNA, target sequence: CCGTTTCAATTCGCGGACTAA | Sigma | TRCN0000009101 |
| HTR2C-2 shRNA, target sequence: CCGCTGACGATTATGGTGATT | Sigma | TRCN0000009102 |
| SGMS1-1 shRNA, target sequence: GCGAAGAATAATGAAGCTCAT | Sigma | TRCN0000134296 |
| SGMS1-2 shRNA, target sequence: CTGTACCTGTATCGGTGTATT | Sigma | TRCN0000422754 |
| SGMS2-1 shRNA, target sequence: GCTGTAACCAAAGGTATAGTT | Sigma | TRCN0000122186 |
| SGMS2-1 shRNA, target sequence: GCTTGTTAAAGAGGTGCCAAA | Sigma | TRCN0000122885 |
|
| ||
| Software and algorithms | ||
|
| ||
| Image Lab Software | Bio-Rad | RRID:SCR_014210 |
| GraphPad Prism 8 | GraphPad Software | RRID:SCR_002798 |
| ImageJ | NIH | RRID:SCR_003070 |
| FlowJo v10 | Treestar | RRID: SCR_008520 |
| Leica LAS software | Leica | RRID:SCR_013673 |
| Visiopharm | Visiopharm | https://visiopharm.com/ |
| GSEA | Subramanian et al., 2005 | http://www.gsea-msigdb.org/gsea/index.jsp |
| cBioProtal | Cerami et al., 2012; Gao et al., 2013 | https://www.cbioportal.org/ |
| GEPIA | Tang et al., 2017 | http://gepia.cancer-pku.cn/ |
| DepMap Portal | Corsello et al., 2020; Ghandi et al., 2019 | https://depmap.org/portal |
EXPERIMENTAL MODEL AND SUBJECT DETAILS
Cell lines
Patient-derived GBM neurosphere lines were obtained as previously described (Buczkowicz et al., 2014; Laks et al., 2016; Nagaraja et al., 2019; Turner et al., 2017) and were cultured in DMEM/F12 medium supplemented with 1x B27, 20 ng/ ml of EGF, 20 ng/ ml of FGF, 1 μg/ ml heparin and 1x Glutamax (GIBCO). U87EGFRvIII cells were established by stably expressing EGFRvIII in U87 cells, as previously described (Wang et al., 2006). U87, U87EGFRvIII, RPE1, and IMR90 cells were maintained in DMEM supplemented with 10% FBS and 1% penicillin/streptomycin, while normal human astrocytes (NHA) were cultured according to the manufacturer’s standard protocol by using the astrocyte growth medium BulletKit (Lonza). The attached cells were maintained in 10% FBS medium and changed to 1% FBS medium for follow-up experiments as indicated in the methods. All cell lines were maintained at 37°C in a humidified incubator with 5% CO2. More detailed information for all cell lines used in this study is listed in Table S1.
Intracranial GBM xenograft models
All mice experiments were approved by the Institutional Animal Care and Use Committee (IACUC) at the University of California, San Diego. Intracranial GBM xenograft models were established as described previously (Bi et al., 2019). In brief, patient-derived neurosphere cells were first engineered to express a near-infrared fluorescent protein IRFP720, and U87EGFRvIII cells were stably expressed with the turboFP635 protein. A total number of 5 × 10⁴ U87EGFRvIII-FP635 cells, or 5 × 10⁴ GBM39-IRFP cells, or 2.5 ×10⁵ HK296-IRFP cells in 5 μl PBS were intracranially injected into brains of five-week-old female athymic nude mice (Charles River Laboratories). 6~8 mice were injected for each group. For drug treatment, fluoxetine solution stocks were prepared by dissolving fluoxetine in water. Equal volumes of fluoxetine stocks or vehicle (water) were administrated to mice once daily (4.2 mg/kg, 10 mg/kg, 15 mg/kg, or 16.4 mg/kg) by oral gavage after tumors were established at day 8~10. DMSO or temozolomide resuspended in DMSO was administrated to mice once daily (5 mg/kg or 20 mg/kg) via intraperitoneal injection starting from day 8 for 5 days. For U87EGFRvIII xenograft models, 10 mg/kg fluoxetine or vehicle was administrated to mice once daily by oral gavage for 10 days starting from day 8 after tumor cells injection. Tumor growth was assessed using an FMT 2500 fluorescence tomography system (PerkinElmer), and survival dates until the onset of neurologic symptoms were recorded for survival curves. All mice were housed in a conventional barrier facility at 22°C on a 12-hour light/dark cycle with free access to water and food, and their health status was checked by following the protocols.
METHOD DETAILS
Gene expression and shRNA transduction
Lentivirus SMPD1 expression plasmid was generated by cloning the full-length coding sequence of SMPD1 into a pLVX-Puro vector (EcoRI and XbaI). Lentivirus shRNA plasmids were purchased from Sigma, and shRNA sequences are listed in the Key resources table. For virus production, lentiviral shRNA or gene expression plasmids were transfected with lentivirus packaging plasmids (Clontech) into HEK293T cells, and the supernatant containing virus was collected at 72 hours after transfection. Virus titers were measured before use, and fresh culture medium was changed to the cells after overnight infection. Infection efficiency and selection concentrations of puromycin were determined for every cell line before the follow-up experiments.
DepMap data analysis
Gene expression, genetic dependency (combined RNAi-screening from Broad, Novartis, and Marcotte projects), and drug sensitivity (PRISM Repurposing Primary Screen 19Q4) datasets (Corsello et al., 2020; Ghandi et al., 2019; McFarland et al., 2018; Nusinow et al., 2020) of Cancer Cell Line Encyclopedia (CCLE) were downloaded from the DepMap portal (https://depmap.org/portal). Mean differences of mRNA expression levels and shRNA dependency scores (DEMETER2) were calculated between glioma cell lines and other CCLE cell lines, and two-tailed Student’s t test was performed to test the significance. For drug sensitivity, the cell viability response to selected compounds (replicate collapsed log fold change values relative to DMSO) of all glioma cell lines from the DepMap dataset was analyzed by Pearson correlation and plotted as a drug-drug sensitivity matrix.
Sphingolipid analysis by LC-MS
GBM cells were treated with DMSO or 5 μM fluoxetine in 1% FBS DMEM medium for 24 hours or 42 hours and harvested as pellets. Samples were then spiked with a set of internal standards and extracted with an organic solvent system consisting of equal parts of dichloromethane and methanol. Phase separation was achieved by the addition of an equal part of water. The organic layer was collected, the solvent was removed under argon, and the samples were reconstituted in 100 ul of isopropanol/acetonitrile (40/60, v/v). Sphingolipids were separated by liquid chromatography (LC), and the eluting metabolites were measured by mass spectrometry (MS/MS) according to methodologies established at the UCSD LIPID MAPS Lipidomics Core (https://www.ucsd-lipidmaps.org). Briefly, a Waters Acquity UPLC system (Waters Technologies, Milford, MA) with a Phenomenex Kinetex C18 column,150×2.1 mm, 1.7 μm (Phenomenex, Torrance, CA) was used for chromatographic separation. Gradient elution started at 40% mobile phase B for 10 minutes, then increased linearly to 100% B over 10 minutes, kept at 100% B for 30 minutes, and the column was equilibrated with 40% B for 8 minutes. Buffer A consisted of 100% H2O with 10mM ammonium formate and 0.1% formic acid modifiers. Buffer B consisted of isopropanol/acetonitrile (40/60, v/v) with 10mM ammonium formate and 0.1% formic acid as modifiers. The flow rate was 300 μl/minute, and 10 μl of sample was injected via autosampler.
The LC eluent was interfaced with a mass spectrometer 6500 QTrap (Sciex, Framingham, MA), controlled by Analyst v. 1.7 software, operated in Information Dependent Acquisition mode (IDA), using an Enhanced MS (EMS) scan from m/z 400–1000 at 10000 Da/s as a survey scan. Source parameters were automatically optimized using flow injection analysis into an isocratic flow of 80% mobile phase B using individual lipid molecules. To maximize metabolite coverage and identification, the sphingolipids were analyzed in positive and negative ion modes. The optimized source parameters of the Turbo V ion source for positive ion mode were as follows: Curtain Gas, 20; Collision Gas, High; IonSpray voltage, 5000; Temperature, 300; Gas 1, 30; Gas 2, 30, Declustering Potential, 100; Collision Energy Spread, 0; Collision Energy, 45. Source parameters for negative ion mode were: Curtain Gas, 20; Collision Gas, High; IonSpray voltage, −4500; Temperature, 300; Gas 1, 30; Gas 2, 30, Declustering Potential, −150; Collision Energy Spread, 0; Collision Energy, −10. From each survey scan, the ions exceeding a pre-set intensity threshold were chosen for Enhanced Product Ion scans (EPI). The lipid molecules were identified by molecular mass, elution time and MS/MS fragmentation patterns. At least three biological replicates were performed for each cell line per treatment. For quantitation, the MS signals of endogenous sphingolipid molecules were normalized to that of the internal standards and the cell numbers of each sample.
Sphingomyelin (d18:1/n16:0-d9) metabolomics
Sphingomyelin (d18:1/16:0-d9) was diluted and mixed with the FBS-free DMEM medium at room temperature for 1 hour before feeding the cell. GBM cells were pre-treated with 5 μM fluoxetine or DMSO in the FBS-free DMEM medium for 4 hours and then incubated with 2 μM sphingomyelin (d18:1/16:0-d9) and 5 μM fluoxetine or DMSO in FBS-free DMEM medium for another 2 hours. After three-times wash with PBS, cells were harvested as pellets and stored at −80°C for further analysis. The total cell metabolome was extracted in 4 mL 2:1:1 CHCl3/MeOH/DPBS (v/v/v) solution containing 1 nmol each of SM (d18:1/n17:0) and Ceramide (d18:1/n17:0) spiked in as an internal standard. The mixture was vortexed vigorously and centrifuged at 2,000 × g for 5 min at 4°C. The bottom organic phase was collected, and the remaining aqueous phase was re-extracted by the addition of 2 mL CHCl3. Both of the organic phases were pooled, dried down under N2 gas, and reconstituted in 150 μL 2:1 CHCl3/MeOH (v/v) for LC/MS analysis.
Metabolites analyzed in this study were quantified using LC/MS-based multiple reaction monitoring (MRM) methods (Agilent Technologies 6470 Triple Quad). MS analysis was performed using ESI with the following parameters: drying gas temperature, 350°C; drying gas flow, 9 l/min; nebulizer pressure, 45 Ψ; sheath gas temperature, 375°C; sheath gas flow, 12 l/min; fragmentor voltage, 85 V; and capillary voltage, 3.5 kV. The MRM transitions for the targeted LC/MS analysis of SM (d18:1/n17:0) and SM (d18:1/n16:0-d9) were the following: 717.9 to 184.4 and 712.9 to 184.4, respectively and the collision energy was set to 30. The separation of metabolites was achieved using a 50 mm × 4.6 mm 5 μm Gemini C18 column (Phenomenex) coupled to a guard column (Gemini: C18: 4 × 3 mm). The samples were analyzed in positive mode with the following buffer system: buffer A, 100% H2O with 10 mM Ammonium Acetate and 0.1% Formic acid (v/v) and buffer B, 100% MeOH with 10 mM Ammonium Acetate and 0.1% Formic acid (v/v). The LC gradient was the following after injection: start from 50% A for 1.1 minutes and increased to 80% B at 0.3 mL/min for 1.2 minutes; increase to 100% B at 0.3 mL/min over 8 minutes; maintain 100% B at 0.3 mL/min for 9.6 minutes and then back to 50% A at 0.3 mL/min and equilibrate for 4 minutes. Lipid species were quantified by measuring areas under the curve in comparison to the corresponding internal standards and then normalizing to the cell number.
SMPD1 enzymatic activity assay
The enzymatic activity of acid sphingomyelinase (SMPD1/ASM) was measured by the cleavage of HMU-PC using a commercial kit (Echelon, K-3200) as described previously (van Diggelen et al., 2005). GBM cells with indicated hours DMSO or fluoxetine treatment were collected. Cell pellets were then resuspended in water with proteinase inhibitor and sonicated in an ice water bath for 10 cycles (30 s on and 30 s off). Tumor samples were first homogenized in water with proteinase inhibitor by a rotor-stator tissue homogenizer and then sonicated on ice. After 5-minutes centrifugation (10,000 × g) at 4°C, protein concentration of each sample was determined. Equal volumes of 10 μg samples were added into each reaction and incubated at 37°C for 3 hours. After adding the stop buffer, the fluorescence of HMU was recorded on an Infinite M1000 Plate Reader (Tecan) at 360 nm excitation and 460 nm emission. Data were normalized to that of the indicated control group and plotted from four biological replicates.
Cell viability assay
Cell viability was assessed using a CellTiter-Glo luminescent cell viability assay kit (Promega). Attached cells or GBM neurosphere cells were seeded into each well of 384-well plates with DMEM medium supplemented with 1% FBS and 1% penicillin/streptomycin or DMEM/F12 medium supplemented with 1/4x B27, 20 ng/ ml of EGF, 20 ng/ ml of FGF, 1 μg/ ml heparin, and 1x Glutamax respectively. Equal volumes of vehicles or drugs diluted with the medium were added into the wells the next day, and the cells were cultured for 72 hours. After 15 minutes of incubation with CellTiter-Glo reagent at room temperature, the luminescent was recorded using an Infinite M1000 Plate Reader (Tecan). Four biological replicates were performed for each cell line per treatment. The area under the curve (AUC) was calculated by the AUC function in the DescTools R package with the “spline” method, which results in the area under the natural cubic spline interpolation.
Cell death and Annexin V-positive cell analysis
Annexin V-positive cells were determined by flow cytometry using a FITC Annexin V Apoptosis Detection Kit (BD Biosciences). In brief, cells were treated with DMSO or fluoxetine and cultured for 72 hours in DMEM medium with 1% FBS (attached cells) or DMEM/F12 medium supplemented with 1/4x B27, 20 ng/ ml of EGF, 20 ng/ ml of FGF, 1 μg/ ml heparin and 1x Glutamax (neurosphere cells). For shRNA experiments, cells after shRNA lentivirus infection were reseeded and cultured for 72 hours. Cells were then collected for Annexin V/ PI staining and analyzed by using a BD LSRII flow cytometer (BD Biosciences). For cell death trypan blue assay, cells were seeded in 6-well plates (attached cells) or 25 cm2 flasks (neurosphere cells) and cultured for five days after shRNA lentivirus infection or with drug treatment. Dead cells and live cells were counted by trypan blue assay using a TC10 automatic cell counter (Bio-Rad). At least three biological replicates were performed for each cell line per treatment.
Soft-agar colony formation assay
For each well of 12-well plates, 4000 HK296 cells or 2000 U87EGFRvIII cells were mixed with 0.4% low-gelling-temperature agarose (Sigma) in growth medium and immediately plated onto a solidified bottom layer containing 1% low-gelling-temperature agarose in the growth medium. Four biological replicates were performed for each treatment, and Cells were treated and fed with fresh growth medium every three days for 3 weeks. Colonies were then stained with 0.005% crystal violet, imaged by a ChemiDoc MP imaging system (Bio-Rad), and counted by ImageJ.
Crystal violet clonogenic assay
24 hours after shRNA or gene expression lentivirus infection, 2000 GBM cells were reseeded into each well of 6-well plates and cultured in 2 mL growth medium for 2 weeks. The medium was refreshed every three days and removed before crystal violet staining. Colonies were fixed with 80% methanol in ddH2O for 10 minutes and stained with 0.05% crystal violet for 20 minutes. After washed with water, plates were imaged on a ChemiDoc MP imaging system (Bio-Rad), and colony density was quantified by ImageJ.
RNA extraction and qRT-PCR
Total RNA extraction was performed using an RNeasy mini kit (QIAGEN) and the SuperScript IV VILO master mix (Invitrogen) was used for reverse transcription. Samples are mixed with primers and SYBR Green Supermix and amplified on a CFX96 real-time PCR detection system (Bio-Rad). The results were processed by the ΔΔCt method, and expression levels were normalized to the reference gene and indicated control group.
Immunofluorescence staining
Cells were seeded in laminin-coated chamber slides and treated with DMSO or 5 μM fluoxetine for 42 hours. After twice wash with PBS, cells were fixed in 4% PFA for 15 minutes, permeabilized with 0.2% Triton X-100 in PBS for 15 minutes and then blocked with 2% BSA in PBS for 45 minutes. Primary antibodies (anti-LAMP1, #9091, Cell Signaling at 1: 200 dilution; anti-phospho-histone H2A.X (Ser139), 05–636, Millipore at 1:200 dilution) in PBS with 0.02% Triton X-100 and 0.5% BSA was applied to cells and incubated overnight at 4°C. After four washes with PBS, cells were then incubated with fluorescent secondary antibody Alexa Fluor anti-Rabbit 546 (A11010, Invitrogen) or Alexa Fluor anti-Mouse 488 (A11017, Invitrogen) at a dilution of 1:1000 in PBS at room temperature for 1 hour. For EGFR staining, an EGFR antibody conjugated with Alexa Fluor 488 (#5616, Cell Signaling) was used at 1:200 dilution in overnight incubation. For LysoTracker staining, after 42 hours treatment of DMSO or 5 μM fluoxetine, cells were washed with PBS and incubated with 50 nM LysoTracker (L7528, Invitrogen) at 37°C for 1 hour. Cells were then washed with PBS, fixed in 4% PFA for 15 minutes. After four washes with PBS, cells were mounted with antifade reagent with DAPI (Life Technologies) for imaging on an Olympus FV1000 confocal microscope. Fluorescent intensity was quantified by ImageJ.
Drug and lipid treatment
For western blot, cells were collected after 48 hours of treatment unless otherwise indicated. GBM neurosphere cells were seeded in DMEM/F12 medium supplemented with 1/4x B27, 20 ng/ ml of EGF, 20 ng/ ml of FGF, 1 μg/ ml heparin, and 1x Glutamax, cultured overnight, and treated with DMSO or fluoxetine for indicated hours before harvesting for enzymatic assay or western blots. In proteasome and lysosome inhibitors experiments, GBM cells were treated with DMSO or fluoxetine for 24 hours and incubated for additional 6 hours in the absence or presence of 10 μM MG132 or 50 μM Chloroquine before collecting. For lipid treatment, 10 μM of sphingolipids conjugated with BSA or an equal amount of BSA solution was added into the growth medium and mixed on a shaker at room temperature for 30 minutes before treating cells. Cells were then cultured with the lipid or vehicle-adding medium for 48 hours and applied for further western blot analysis or immunofluorescence staining. In cell viability assay, GBM cells were first cultured with lipid or vehicle-adding medium overnight and then incubated together with fluoxetine or DMSO for 72 hours before CellTiter-Glo assay.
Membrane lipid order imaging of live cells
Membrane lipid order imaging of live GBM cells was performed as described previously (Owen et al., 2011). Briefly, GBM cells in glass-bottom dishes were treated with 5 μM fluoxetine for 40 hours in 1% FBS DMEM medium and then stained with 5 μM Laurdan (D250, Invitrogen) for 3 hours in serum-free medium at 37°C in a humidified incubator with 5% CO2. Cells were then imaged on a Leica SP5 Confocal/Multiphoton system with the excitation at 800 nm and the emission at 400–460 nm and 470–530 nm). Pseudo-colored generalized polarization (GP) images were achieved by using an ImageJ plug-in as described (Owen et al., 2011). GP values at the plasma membrane region of at least 60 cells were quantified by ImageJ and plotted as histograms.
Western blot analysis
Cells were washed with cold PBS and lysed with 1x RIPA lysis buffer containing 1x protease and phosphatase inhibitor cocktail on ice for 30 minutes. Tumor samples were homogenized on ice with cold PBS supplemented with protease and phosphatase inhibitor cocktail and then lysed with an equal volume of 2x RIPA buffer on ice for 30 minutes. BCA protein assay kit (Thermo Scientific) was used to determine the protein concentration. Equal amounts of protein samples were mixed with Laemmli sample buffer, boiled at 100°C for 5 minutes, electrophoresed using 4%–12% NuPAGE Bis-Tris mini gels, and then transferred onto nitrocellulose membranes by a Trans-Blot Turbo transfer system (Bio-Rad). Membranes were blocked with 5% BSA in TBST buffer and incubated with corresponding primary antibodies at 4°C overnight, followed by incubation with HRP-conjugated secondary antibodies at room temperature for 1 hour. After washing, the blots were developed with SuperSignal West Pico chemiluminescent substrate (Thermo Scientific) and imaged using Image Lab software on a ChemiDoc MP imaging system (Bio-Rad).
Immunohistochemistry analysis
Formalin-fixed, paraffin-embedded tissue sections were performed by the Tissue Technology Shared Resource (TTSR)-Histology Core at UCSD. Standard staining protocols were followed. In brief, the antigen was retrieved by boiling slides in 0.01 M sodium citrate (pH 6.0) for 15 minutes. Tissue sections were then incubated with primary antibodies overnight at 4°C, followed with 30 minutes incubation with biotinylated secondary antibodies at room temperature. Tissue sections for TUNEL staining were incubated with TdT/ dUTP at 37°C for 30 minutes and then with HRP-conjugated anti-digoxigenin at room temperature for another 30 minutes. Stained slides were imaged on an Olympus BX43 microscope and quantified in a double-blind fashion using Visiopharm image analysis software.
Cell surface EGFR and internalization analysis
The intensity of cell surface EGFR was determined by flow cytometry with an EGFR antibody that recognizes the extracellular domains of both wild-type EGFR and EGFRvIII proteins as described previously (Lu et al., 2007; Luwor et al., 2001). In brief, GBM39 and HK296 cells were first chilled on ice for 20 minutes and then incubated with a primary EGFR antibody (GR01, Millipore, mAb528, 1:20) on ice for one hour. After gently washed once with 10 mL cold PBS, the cells were incubated with an Alexa Fluor 488 goat anti-mouse second antibody (A11017, Invitrogen, 1:500) on ice for an additional hour. The cells were then gently washed once with 10 mL cold PBS and analyzed on a BD LSRFortessa X-20 flow cytometer (BD Biosciences). For EGFR internalization assay, GBM39 cells treated with 5 μM fluoxetine or DMSO for 48 hours were chilled on ice and incubated with the EGFR antibody (GR01, Millipore, mAb528, 1:40) on ice for one hour. Primary antibody-stained cells were either kept on ice or moved to 37°C for 15 or 30 minutes to allow internalization. Following internalization, the cells were washed and incubated with Alexa Fluor 488 goat anti-mouse second antibody (Cat#A11017, Invitrogen, 1:500) for another hour before analyzing by flow cytometer. Internalized EGFR level was defined as the decreased signal of surface EGFR after incubation at 37°C. Three to four biological replicates were performed for each treatment. A total of 10, 000 events for each sample was recorded and analyzed.
Density gradient fractionation
The detergent-free density gradient fractionation was performed as previously described (Cizmecioglu et al., 2016; Macdonald and Pike, 2005). In brief, GBM39 cells treated with 5 μM fluoxetine or DMSO for 48 hours were pelleted at 250 g for 5 minutes, washed once with cold PBS, and resuspended in 1 mL of cold homogenization buffer (20 mM Tris-HCl, pH7.8, 0.250 M sucrose, 1 mM CaCl2 and 1 mM MgCl2) with protease and phosphatase inhibitors. Homogenates were then passed through a 23 g needle for 20 times followed by centrifugation at 4°C at 1000 g for 10 min. 1 mL of supernatants were collected, mixed with 1 mL of 50% Opti-Prep solution (Sigma), and placed in the bottom of a 5 ml Ultra-Clear centrifuge tube (Beckman Coulter). 400 μl each of 20%, 17.5%, 15%, 12.5%, 10%, 7.5% and 5% Opti-Prep solutions were then poured onto the top. After ultracentrifugation at 100, 000 g for 2 hours at 4°C using an SW-55Ti rotor in a Beckman ultracentrifuge, equal volumes of six fractions were collected from the top layer to bottom layer and loaded for further western blot analysis. Lipid rafts fractions were characterized by the non-lipid rafts marker Calnexin and lipid rafts markers Flotilin-1 and Gα(q). The percentages of protein level in fraction 1 were calculated by dividing the amount of protein in fraction 1 by the total amount of protein in all six fractions and plotted from three independent experiments.
RNA-seq analysis
Neurosphere cells were treated with DMSO or 5 μM fluoxetine for 42 hours and collected for RNA extraction. RNA sequencing was performed by Novogene. RNA-Seq reads were aligned to the human reference transcriptome (GRCh38 release-98) and quantified using the Salmon software (Patro et al., 2017). The–gcBias flag was used to estimate a correction factor for systematic biases commonly present in RNA-seq data. The differential expression analysis was performed using the likelihood ratio test (LRT) in DE-Seq2 (version 1.32.0) (Love et al., 2014). The LRT examines two nested models for the read counts, a full model where gene expression was explained by fluoxetine treatment and cell lines and a reduced model, in which only cell lines were considered. The test determines if fluoxetine treatment contributed significantly to the gene expression beyond the expected expression level due to cell lines. Gene Set Enrichment Analysis (GSEA) was performed on all genes ranked by likelihood ratio test statistic against MSigDB v7.1 (Subramanian et al., 2005). Enriched terms, including EGFR signaling inhibitor down and up signatures (Kobayashi et al., 2006) (https://www.gsea-msigdb.org/gsea/msigdb/cards/KOBAYASHI_EGFR_SIGNALING_24HR_DN and https://www.gsea-msigdb.org/gsea/msigdb/geneset_page.jsp?geneSetName=KOBAYASHI_EGFR_SIGNALING_24HR_UP), were visualized using ClueGO (Bindea et al., 2009).
TCGA data analysis
TCGA GBM datasets were downloaded from Broad GDAC Firehose and matched for the following analysis. In survival association group analysis, we used the “lifelines” package in python to fit Cox proportional hazard models (Andersen and Gill, 1982). P values were calculated by log likelihood ratio tests. To evaluate whether a gene’s expression provides additional prognostic information beyond the baseline survival probability due to age at diagnosis, we compared the likelihood of two nested models: a full model with gene expression and age of patients and a reduced model, in which only age was considered. Proportional hazards model and log-rank test were applied to assess the prognostic significance of individual genes. Overall survival of patients with the top 25% and bottom 25% of SMPD1 expression in the TCGA GBM cohort (RNA-seq) was statistically compared by Log-rank test. Cox proportional hazard ratios were calculated. P values and numbers of patients of each cohort were indicated in the figure. The Gene Expression Profiling Interactive Analysis (GEPIA) web-server (Tang et al., 2017) was used to analyze the expression of metabolic genes between GBM tumors and normal brains based on TCGA and GTEx RNA-seq data. The genetic alterations of EGFR, SMPD1, and IDH1 in the merged cohort of LGG and GBM TCGA (PanCancer Altas) datasets were assessed using cBioPortal for Cancer Genomics (https://www.cbioportal.org/) (Cerami et al., 2012; Gao et al., 2013). Gene set enrichment analysis was performed to characterize genes differentially expressed in GBM clinical samples (TCGA GBM, HGU133A) with high or low SMPD1 expression. The median of the GBM cohort was chosen as the cutoff for high and low SMPD1 expression groups.
Patient survival in Electronic Medical Records
The ICD-9 and ICD-10 codes were used to initially identify subjects with brain cancer diagnosis in the IBM Health MarketScan database (2003–2017) (IBM Watson Health, 2018). Records of temozolomide prescription, radiation therapy, and surgical resection of tumor were used to enrich the final cohort for patients with GBM. More specifically, we used NDCs to query patient claims history for medications most frequently used for GBM treatment with or without depression symptoms: temozolomide (217 NDC codes), chemotherapy (2,110 NDCs), fluoxetine (910 NDCs), citalopram (692 NDCs), and escitalopram (338 NDCs). In addition, we used CPT codes J8700 and J9328 representing oral administration of temozolomide. To ascertain radiation therapy, we used CPT code range 77261– 77799, and radiation therapy services HCPCS codes in range G6001 to G6017. For detecting surgical resection of brain tumor, we used CPT codes relevant to craniectomy or craniotomy procedures for surgical resection of brain tumor (codes 61510, 61516, 61518, 61520, 61521, 61524, 61526, 61530, 61534, 61536, 61544, and 61545). For detecting chemotherapy treatment, we used CPT codes representing “chemotherapy administration and other highly complex drug or highly complex biologic agent administration” in range 96401– 96549; chemotherapy drugs HCPCS code range J9000-J9999, and codes for chemotherapy administration with intravenous infusion and other than infusion technique, G0498, Q0083, Q0084, and Q0085. To further detect antineoplastic therapies (radiation therapy, chemotherapy, immunotherapy, or their combinations), we used ICD-9 codes: V58.0, V58.1, V58.11, V58.12, V66.1, V66.2, V67.1, V67.2, and ICD10 codes: Z51.0, Z51.1, Z51.11, Z51.12, and Z08. For identifying brain cancer diagnoses, we used ICD-9 codes ‘191.x’ and ICD-10 codes ‘C71.x’. For identifying all other cancer diagnoses, we used the entire ICD sub-classification of malignant neoplasms (ICD-9 range 140–209 and ICD-10 code range C00-C96) excluding codes for malignant neoplasm of brain.
For each patient with GBM, we computed the number of days from index GBM diagnosis to the day the patient died in a hospital. To adjust results for the immortal time bias (Lévesque et al., 2010; Suissa, 2007), SSRI antidepressants exposure was computed as a time interval-dependent value (Zhou et al., 2005). The start date of the SSRI antidepressant exposure was the date of first SSRI antidepressant prescription dispensed after index GBM diagnosis. To limit potential bias due to the difference in probabilities of receiving SSRI treatment, we matched each SSRI treated patient to two non-SSRI treated patients based on pre-treatment covariates to improve the balance between treated and non-treated covariate distributions. The propensity-score matching was performed as a nonparametric preprocessing step for reducing model confounding in parametric causal inference. Matching was done on three covariates (age, sex, and the Elixhauser comorbidity index score) using the method implemented in the R “Matchit” package (version 3.0.2).
The Kaplan-Meier (KM) method (Kaplan and Meier, 1958) was performed to estimate the survival function for patients treated with one of the three SSRI antidepressants against those with standard GBM treatment but no SSRI antidepressant exposure. Further, an extended Cox proportional hazard regression model with time-dependent variable (Andersen and Gill, 1982; Therneau and Grambsch, 2000) was used to assess the variation in hazards associated with three SSRI antidepressants exposure. Separate experiments for each SSRI antidepressant were conducted to estimate the hazards ratio (HR) of all-cause death among the patients with GBM. Multiple observations from the same patient were indicated by the patient-level identifier in the mode to compute a robust (cluster) variance for the model. The validity of proportional hazards assumption was evaluated using Schoenfeld test (Grambsch and Therneau, 1994; Schoenfeld, 1980) performed on individual predictors and the over model. Cox PH regression was achieved in R (version 3.6.3), using “survival” package (Therneau and Lumley, 2015) (version 3.2–3) and “coxph” function with time dependent exposure modeling. The survival curves were produced using “survminer” R package (version 0.4.8.999). The Elixhauser comorbidity index was computed using R ‘icd’ package (version 4.0.9) and ‘comorbidity’ package (version 0.5.3). More details of the data overview, data extraction pipeline, exclusion criteria, enrichment for patients with GBM, statistical analyses, and results are available in Mendeley Data: https://doi.org/10.17632/5gww3pgbj3.1.
QUANTIFICATION AND STATISTICAL ANALYSIS
Unless otherwise indicated, all statistical analysis was performed using GraphPad Prism 8 software. Unpaired two-tailed Student’s t test with equal variances assumed was applied to compare two experimental groups, and one-way or two-way ANOVA followed by multiple comparisons test was used to assess differences between three or more experimental groups. Paired two-tailed Student’s t test was only performed in comparing the percentage of protein intensity in paired samples. Log-rank (Mantel-Cox) test was used in survival analysis. Fisher’s exact test was applied for mutual exclusivity analysis of genetic alterations in TCGA clinical samples and tumor recurrence analysis of PDX mice models. Bar graphs show mean ± SD or SEM as indicated in the legends, and p values less than 0.05 are defined to be significant. Numbers of samples, statistical tests, and p values analyzed in each experiment are reported in the respective figure legends or methods.
Supplementary Material
Highlights.
The unique membrane lipid composition makes GBMs sensitive to SMPD1 inhibition
Fluoxetine inhibits SMPD1, sphingomyelin metabolism, and EGFR signaling in GBM
Fluoxetine safely and potently shrinks GBM tumors and prevents recurrence in mice
Addition of fluoxetine to standard-of-care chemotherapy improves patient survival
ACKNOWLEDGMENTS
This work was supported by grants from the National Institute for Neurological Diseases and Stroke (NS73831 and NS080939), the Defeat GBM Program of the National Brain Tumor Society, the Ben and Catherine Ivy Foundation, an award from the Sharpe/National Brain Tumor Society Research Program, a Compute for the Cure Award from the Nvidia Foundation (P.S.M.), and a UCSD Neuroscience Microscopy Shared Facility Grant (P30 NS047101). P.S.M. dedicates this paper to Bob Sharpe, a friend and remarkable person who, during his battle with GBM, courageously and gracefully taught him so much about living.
Footnotes
DECLARATION OF INTERESTS
P.S.M. is co-founder of Boundless Bio, Inc. He has equity in the company, chairs the scientific advisory board, and serves as a consultant, for which he is compensated. P.S.M. is also consultant for Autobahn Therapeutics, Inc. and Sage Therapeutics. These consulting arrangements started after completion of this paper.
SUPPLEMENTAL INFORMATION
Supplemental information can be found online at https://doi.org/10.1016/j.celrep.2021.109957.
REFERENCES
- Andersen PK, and Gill RD (1982). Cox regression-model for counting-processes: a large sample study. Ann. Stat. 10, 1100–1120. [Google Scholar]
- Arkhipov A, Shan Y, Das R, Endres NF, Eastwood MP, Wemmer DE, Kuriyan J, and Shaw DE (2013). Architecture and membrane interactions of the EGF receptor. Cell 152, 557–569. [DOI] [PMC free article] [PubMed] [Google Scholar]
- Bi J, Ichu TA, Zanca C, Yang H, Zhang W, Gu Y, Chowdhry S, Reed A, Ikegami S, Turner KM, et al. (2019). Oncogene amplification in growth factor signaling pathways renders cancers dependent on membrane lipid remodeling. Cell Metab. 30, 525–538.e8. [DOI] [PMC free article] [PubMed] [Google Scholar]
- Bi J, Chowdhry S, Wu S, Zhang W, Masui K, and Mischel PS (2020). Altered cellular metabolism in gliomas - an emerging landscape of actionable co-dependency targets. Nat. Rev. Cancer 20, 57–70. [DOI] [PubMed] [Google Scholar]
- Bindea G, Mlecnik B, Hackl H, Charoentong P, Tosolini M, Kirilovsky A, Fridman WH, Pagè s F, Trajanoski Z, and Galon J (2009). ClueGO: a Cytoscape plug-in to decipher functionally grouped gene ontology and pathway annotation networks. Bioinformatics 25, 1091–1093. [DOI] [PMC free article] [PubMed] [Google Scholar]
- Bolo NR, Hodé Y, Nédélec JF, Lainé E, Wagner G, and Macher JP (2000). Brain pharmacokinetics and tissue distribution in vivo of fluvoxamine and fluoxetine by fluorine magnetic resonance spectroscopy. Neuropsychopharmacology 23, 428–438. [DOI] [PubMed] [Google Scholar]
- Brennan CW, Verhaak RG, McKenna A, Campos B, Noushmehr H, Salama SR, Zheng S, Chakravarty D, Sanborn JZ, Berman SH, et al. ; TCGA Research Network (2013). The somatic genomic landscape of glioblastoma. Cell 155, 462–477. [DOI] [PMC free article] [PubMed] [Google Scholar]
- Buczkowicz P, Hoeman C, Rakopoulos P, Pajovic S, Letourneau L, Dzamba M, Morrison A, Lewis P, Bouffet E, Bartels U, et al. (2014). Genomic analysis of diffuse intrinsic pontine gliomas identifies three molecular subgroups and recurrent activating ACVR1 mutations. Nat. Genet. 46, 451–456. [DOI] [PMC free article] [PubMed] [Google Scholar]
- Caudill JS, Brown PD, Cerhan JH, and Rummans TA (2011). Selective serotonin reuptake inhibitors, glioblastoma multiforme, and impact on toxicities and overall survival: the mayo clinic experience. Am. J. Clin. Oncol. 34, 385–387. [DOI] [PubMed] [Google Scholar]
- Cerami E, Gao J, Dogrusoz U, Gross BE, Sumer SO, Aksoy BA, Jacobsen A, Byrne CJ, Heuer ML, Larsson E, et al. (2012). The cBio cancer genomics portal: an open platform for exploring multidimensional cancer genomics data. Cancer Discov. 2, 401–404. [DOI] [PMC free article] [PubMed] [Google Scholar]
- Cho KJ, van der Hoeven D, Zhou Y, Maekawa M, Ma X, Chen W, Fairn GD, and Hancock JF (2015). Inhibition of Acid Sphingomyelinase Depletes Cellular Phosphatidylserine and Mislocalizes K-Ras from the Plasma Membrane. Mol. Cell. Biol. 36, 363–374. [DOI] [PMC free article] [PubMed] [Google Scholar]
- Cizmecioglu O, Ni J, Xie S, Zhao JJ, and Roberts TM (2016). Rac1-mediated membrane raft localization of PI3K/p110b is required for its activation by GPCRs or PTEN loss. eLife 5, e17635. [DOI] [PMC free article] [PubMed] [Google Scholar]
- Cloughesy TF, Cavenee WK, and Mischel PS (2014). Glioblastoma: from molecular pathology to targeted treatment. Annu. Rev. Pathol. 9, 1–25. [DOI] [PubMed] [Google Scholar]
- Corrigan-Curay J, Sacks L, and Woodcock J (2018). Real-World Evidence and Real-World Data for Evaluating Drug Safety and Effectiveness. JAMA 320, 867–868. [DOI] [PubMed] [Google Scholar]
- Corsello SM, Nagari RT, Spangler RD, Rossen J, Kocak M, Bryan JG, Humeidi R, Peck D, Wu X, Tang AA, et al. (2020). Discovering the anti-cancer potential of non-oncology drugs by systematic viability profiling. Nat. Can. 1, 235–248. [DOI] [PMC free article] [PubMed] [Google Scholar]
- Das A, Brown MS, Anderson DD, Goldstein JL, and Radhakrishnan A (2014). Three pools of plasma membrane cholesterol and their relation to cholesterol homeostasis. eLife 3, e02882. [DOI] [PMC free article] [PubMed] [Google Scholar]
- Broad DepMap (2020). DepMap 20Q1 Public. figshare. https://figshare.com/articles/dataset/DepMap_20Q1_Public/11791698/2.
- Dolma S, Selvadurai HJ, Lan X, Lee L, Kushida M, Voisin V, Whet-stone H, So M, Aviv T, Park N, et al. (2016). Inhibition of Dopamine Receptor D4 Impedes Autophagic Flux, Proliferation, and Survival of Glioblastoma Stem Cells. Cancer Cell 29, 859–873. [DOI] [PMC free article] [PubMed] [Google Scholar]
- Eli Lilly and Company (2017). PROZAC (fluoxetine) [package insert]. (US Food and Drug Administration; ). https://www.accessdata.fda.gov/drugsatfda_docs/label/2017/018936s108lbl.pdf. [Google Scholar]
- Endapally S, Frias D, Grzemska M, Gay A, Tomchick DR, and Radhakrishnan A (2019). Molecular Discrimination between Two Conformations of Sphingomyelin in Plasma Membranes. Cell 176, 1040–1053.e17. [DOI] [PMC free article] [PubMed] [Google Scholar]
- Gao J, Aksoy BA, Dogrusoz U, Dresdner G, Gross B, Sumer SO, Sun Y, Jacobsen A, Sinha R, Larsson E, et al. (2013). Integrative analysis of complex cancer genomics and clinical profiles using the cBioPortal. Sci. Signal. 6, pl1. [DOI] [PMC free article] [PubMed] [Google Scholar]
- Ghandi M, Huang FW, Jané-Valbuena J, Kryukov GV, Lo CC, McDonald ER 3rd, Barretina J, Gelfand ET, Bielski CM, Li H, et al. (2019). Next-generation characterization of the Cancer Cell Line Encyclopedia. Nature 569, 503–508. [DOI] [PMC free article] [PubMed] [Google Scholar]
- Grambsch PM, and Therneau TM (1994). Proportional Hazards Tests and Diagnostics Based on Weighted Residuals. Biometrika 81, 515–526. [Google Scholar]
- Gulbins E, Palmada M, Reichel M, Lüth A, Böhmer C, Amato D, Müller CP, Tischbirek CH, Groemer TW, Tabatabai G, et al. (2013). Acid sphingomyelinase-ceramide system mediates effects of antidepressant drugs. Nat. Med. 19, 934–938. [DOI] [PubMed] [Google Scholar]
- Guo D, Reinitz F, Youssef M, Hong C, Nathanson D, Akhavan D, Kuga D, Amzajerdi AN, Soto H, Zhu S, et al. (2011). An LXR agonist promotes glioblastoma cell death through inhibition of an EGFR/AKT/SREBP-1/LDLR-dependent pathway. Cancer Discov. 1, 442–456. [DOI] [PMC free article] [PubMed] [Google Scholar]
- Hannun YA, and Obeid LM (2018). Sphingolipids and their metabolism in physiology and disease. Nat. Rev. Mol. Cell Biol. 19, 175–191. [DOI] [PMC free article] [PubMed] [Google Scholar]
- Hu B, Wang Q, Wang YA, Hua S, Sauvé CG, Ong D, Lan ZD, Chang Q, Ho YW, Monasterio MM, et al. (2016). Epigenetic Activation of WNT5A Drives Glioblastoma Stem Cell Differentiation and Invasive Growth. Cell 167, 1281–1295.e18. [DOI] [PMC free article] [PubMed] [Google Scholar]
- IBM Watson Health (2018). IBM MarketScan Research Databases for Life Sciences Researchers (white paper).. https://www.ibm.com/downloads/cas/0NKLE57Y.
- Jarow JP, LaVange L, and Woodcock J (2017). Multidimensional Evidence Generation and FDA Regulatory Decision Making: Defining and Using “Real-World” Data. JAMA 318, 703–704. [DOI] [PubMed] [Google Scholar]
- Kaplan EL, and Meier P (1958). Nonparametric-Estimation from Incomplete Observations. J. Am. Stat. Assoc. 53, 457–481. [Google Scholar]
- Karson CN, Newton JE, Livingston R, Jolly JB, Cooper TB, Sprigg J, and Komoroski RA (1993). Human brain fluoxetine concentrations. J. Neuropsychiatry Clin. Neurosci. 5, 322–329. [DOI] [PubMed] [Google Scholar]
- Kim H, Nguyen NP, Turner K, Wu S, Gujar AD, Luebeck J, Liu J, Deshpande V, Rajkumar U, Namburi S, et al. (2020). Extrachromosomal DNA is associated with oncogene amplification and poor outcome across multiple cancers. Nat. Genet. 52, 891–897. [DOI] [PMC free article] [PubMed] [Google Scholar]
- Kobayashi S, Shimamura T, Monti S, Steidl U, Hetherington CJ, Lowell AM, Golub T, Meyerson M, Tenen DG, Shapiro GI, and Halmos B (2006). Transcriptional profiling identifies cyclin D1 as a critical downstream effector of mutant epidermal growth factor receptor signaling. Cancer Res. 66, 11389–11398. [DOI] [PubMed] [Google Scholar]
- Kornhuber J, Tripal P, Reichel M, Terfloth L, Bleich S, Wiltfang J, and Gulbins E (2008). Identification of new functional inhibitors of acid sphingomyelinase using a structure-property-activity relation model. J. Med. Chem. 51, 219–237. [DOI] [PubMed] [Google Scholar]
- Laks DR, Crisman TJ, Shih MY, Mottahedeh J, Gao F, Sperry J, Garrett MC, Yong WH, Cloughesy TF, Liau LM, et al. (2016). Large-scale assessment of the gliomasphere model system. Neuro-oncol. 18, 1367–1378. [DOI] [PMC free article] [PubMed] [Google Scholar]
- Lemmon MA, Schlessinger J, and Ferguson KM (2014). The EGFR family: not so prototypical receptor tyrosine kinases. Cold Spring Harb. Perspect. Biol. 6, a020768. [DOI] [PMC free article] [PubMed] [Google Scholar]
- Lévesque LE, Hanley JA, Kezouh A, and Suissa S (2010). Problem of immortal time bias in cohort studies: example using statins for preventing progression of diabetes. BMJ 340, b5087. [DOI] [PubMed] [Google Scholar]
- Lingwood D, and Simons K (2010). Lipid rafts as a membrane-organizing principle. Science 327, 46–50. [DOI] [PubMed] [Google Scholar]
- Love MI, Huber W, and Anders S (2014). Moderated estimation of fold change and dispersion for RNA-seq data with DESeq2. Genome Biol. 15, 550. [DOI] [PMC free article] [PubMed] [Google Scholar]
- Lu Y, Li X, Liang K, Luwor R, Siddik ZH, Mills GB, Mendelsohn J, and Fan Z (2007). Epidermal growth factor receptor (EGFR) ubiquitination as a mechanism of acquired resistance escaping treatment by the anti-EGFR monoclonal antibody cetuximab. Cancer Res. 67, 8240–8247. [DOI] [PubMed] [Google Scholar]
- Luwor RB, Johns TG, Murone C, Huang HJ, Cavenee WK, Ritter G, Old LJ, Burgess AW, and Scott AM (2001). Monoclonal antibody 806 inhibits the growth of tumor xenografts expressing either the de2–7 or amplified epidermal growth factor receptor (EGFR) but not wild-type EGFR. Cancer Res. 61, 5355–5361. [PubMed] [Google Scholar]
- Ma J, Yang YR, Chen W, Chen MH, Wang H, Wang XD, Sun LL, Wang FZ, and Wang DC (2016). Fluoxetine synergizes with temozolomide to induce the CHOP-dependent endoplasmic reticulum stress-related apoptosis pathway in glioma cells. Oncol. Rep. 36, 676–684. [DOI] [PMC free article] [PubMed] [Google Scholar]
- Macdonald JL, and Pike LJ (2005). A simplified method for the preparation of detergent-free lipid rafts. J. Lipid Res. 46, 1061–1067. [DOI] [PubMed] [Google Scholar]
- Mack SC, Hubert CG, Miller TE, Taylor MD, and Rich JN (2016). An epigenetic gateway to brain tumor cell identity. Nat. Neurosci. 19, 10–19. [DOI] [PMC free article] [PubMed] [Google Scholar]
- Mahé C, Bernhard M, Bobirnac I, Keser C, Loetscher E, Feuerbach D, Dev KK, and Schoeffter P (2004). Functional expression of the serotonin 5-HT7 receptor in human glioblastoma cell lines. Br. J. Pharmacol. 143, 404–410. [DOI] [PMC free article] [PubMed] [Google Scholar]
- McFarland JM, Ho ZV, Kugener G, Dempster JM, Montgomery PG, Bryan JG, Krill-Burger JM, Green TM, Vazquez F, Boehm JS, et al. (2018). Improved estimation of cancer dependencies from large-scale RNAi screens using model-based normalization and data integration. Nat. Commun. 9, 4610. [DOI] [PMC free article] [PubMed] [Google Scholar]
- Morton AR, Dogan-Artun N, Faber ZJ, MacLeod G, Bartels CF, Piazza MS, Allan KC, Mack SC, Wang X, Gimple RC, et al. (2019). Functional Enhancers Shape Extrachromosomal Oncogene Amplifications. Cell 179, 1330–1341.e13. [DOI] [PMC free article] [PubMed] [Google Scholar]
- Nagaraja S, Quezada MA, Gillespie SM, Arzt M, Lennon JJ, Woo PJ, Hovestadt V, Kambhampati M, Filbin MG, Suva ML, et al. (2019). Histone Variant and Cell Context Determine H3K27M Reprogramming of the Enhancer Landscape and Oncogenic State. Mol. Cell 76, 965–980.e12. [DOI] [PMC free article] [PubMed] [Google Scholar]
- Nathanson DA, Gini B, Mottahedeh J, Visnyei K, Koga T, Gomez G, Eskin A, Hwang K, Wang J, Masui K, et al. (2014). Targeted therapy resistance mediated by dynamic regulation of extrachromosomal mutant EGFR DNA. Science 343, 72–76. [DOI] [PMC free article] [PubMed] [Google Scholar]
- Nikolaev S, Santoni F, Garieri M, Makrythanasis P, Falconnet E, Guipponi M, Vannier A, Radovanovic I, Bena F, Forestier F, et al. (2014). Extrachromosomal driver mutations in glioblastoma and low-grade glioma. Nat. Commun. 5, 5690. [DOI] [PMC free article] [PubMed] [Google Scholar]
- Noack J, Choi J, Richter K, Kopp-Schneider A, and Régnier-Vigouroux A (2014). A sphingosine kinase inhibitor combined with temozolomide induces glioblastoma cell death through accumulation of dihydrosphingosine and dihydroceramide, endoplasmic reticulum stress and autophagy. Cell Death Dis. 5, e1425. [DOI] [PMC free article] [PubMed] [Google Scholar]
- Nusinow DP, Szpyt J, Ghandi M, Rose CM, McDonald ER 3rd, Kalocsay M, Jané-Valbuena J, Gelfand E, Schweppe DK, Jedrychowski M, et al. (2020). Quantitative Proteomics of the Cancer Cell Line Encyclopedia. Cell 180, 387–402.e16. [DOI] [PMC free article] [PubMed] [Google Scholar]
- Ogretmen B (2018). Sphingolipid metabolism in cancer signalling and therapy. Nat. Rev. Cancer 18, 33–50. [DOI] [PMC free article] [PubMed] [Google Scholar]
- Otto-Meyer S, DeFaccio R, Dussold C, Ladomersky E, Zhai L, Lauing KL, Bollu LR, Amidei C, Lukas RV, Scholtens DM, and Wainwright DA (2020). A retrospective survival analysis of Glioblastoma patients treated with selective serotonin reuptake inhibitors. Brain Behav. Immun. Health 2, 100025. [DOI] [PMC free article] [PubMed] [Google Scholar]
- Owen DM, Rentero C, Magenau A, Abu-Siniyeh A, and Gaus K (2011). Quantitative imaging of membrane lipid order in cells and organisms. Nat. Protoc. 7, 24–35. [DOI] [PubMed] [Google Scholar]
- Parasassi T, Gratton E, Yu WM, Wilson P, and Levi M (1997). Two-photon fluorescence microscopy of laurdan generalized polarization domains in model and natural membranes. Biophys. J. 72, 2413–2429. [DOI] [PMC free article] [PubMed] [Google Scholar]
- Patro R, Duggal G, Love MI, Irizarry RA, and Kingsford C (2017). Salmon provides fast and bias-aware quantification of transcript expression. Nat. Methods 14, 417–419. [DOI] [PMC free article] [PubMed] [Google Scholar]
- Petersen NH, Olsen OD, Groth-Pedersen L, Ellegaard AM, Bilgin M, Redmer S, Ostenfeld MS, Ulanet D, Dovmark TH, Lønborg A, et al. (2013). Transformation-associated changes in sphingolipid metabolism sensitize cells to lysosomal cell death induced by inhibitors of acid sphingomyelinase. Cancer Cell 24, 379–393. [DOI] [PubMed] [Google Scholar]
- Quail DF, and Joyce JA (2017). The Microenvironmental Landscape of Brain Tumors. Cancer Cell 31, 326–341. [DOI] [PMC free article] [PubMed] [Google Scholar]
- Sanchez-Vega F, Mina M, Armenia J, Chatila WK, Luna A, La KC, Dimitriadoy S, Liu DL, Kantheti HS, Saghafinia S, et al. ; Cancer Genome Atlas Research Network (2018). Oncogenic Signaling Pathways in The Cancer Genome Atlas. Cell 173, 321–337.e10. [DOI] [PMC free article] [PubMed] [Google Scholar]
- Schoenfeld D (1980). Chi-Squared Goodness-of-Fit Tests for the Proportional Hazards Regression Model. Biometrika 67, 145–153. [Google Scholar]
- Schuchman EH (2010). Acid sphingomyelinase, cell membranes and human disease: lessons from Niemann-Pick disease. FEBS Lett. 584, 1895–1900. [DOI] [PubMed] [Google Scholar]
- Schuchman EH, and Desnick RJ (2017). Types A and B Niemann-Pick disease. Mol. Genet. Metab. 120, 27–33. [DOI] [PMC free article] [PubMed] [Google Scholar]
- Sezgin E, Levental I, Mayor S, and Eggeling C (2017). The mystery of membrane organization: composition, regulation and roles of lipid rafts. Nat. Rev. Mol. Cell Biol. 18, 361–374. [DOI] [PMC free article] [PubMed] [Google Scholar]
- Sherman RE, Anderson SA, Dal Pan GJ, Gray GW, Gross T, Hunter NL, LaVange L, Marinac-Dabic D, Marks PW, Robb MA, et al. (2016). Real-World Evidence - What Is It and What Can It Tell Us? N. Engl. J. Med. 375, 2293–2297. [DOI] [PubMed] [Google Scholar]
- Squatrito M, and Holland EC (2011). DNA damage response and growth factor signaling pathways in gliomagenesis and therapeutic resistance. Cancer Res. 71, 5945–5949. [DOI] [PubMed] [Google Scholar]
- Subramanian A, Tamayo P, Mootha VK, Mukherjee S, Ebert BL, Gillette MA, Paulovich A, Pomeroy SL, Golub TR, Lander ES, and Mesirov JP (2005). Gene set enrichment analysis: a knowledge-based approach for interpreting genome-wide expression profiles. Proc. Natl. Acad. Sci. USA 102, 15545–15550. [DOI] [PMC free article] [PubMed] [Google Scholar]
- Suissa S (2007). Immortal time bias in observational studies of drug effects. Pharmacoepidemiol. Drug Saf. 16, 241–249. [DOI] [PubMed] [Google Scholar]
- Suissa S (2008). Immeasurable time bias in observational studies of drug effects on mortality. Am. J. Epidemiol. 168, 329–335. [DOI] [PubMed] [Google Scholar]
- Tang Z, Li C, Kang B, Gao G, Li C, and Zhang Z (2017). GEPIA: a web server for cancer and normal gene expression profiling and interactive analyses. Nucleic Acids Res. 45 (W1), W98–W102. [DOI] [PMC free article] [PubMed] [Google Scholar]
- Therneau TM, and Grambsch PM (2000). The Cox Model. In Modeling Survival Data: Extending the Cox Model (Springer; ), pp. 39–77. [Google Scholar]
- Therneau TM, and Lumley T (2015). Package ‘ survival (R Top Doc).
- Turner KM, Deshpande V, Beyter D, Koga T, Rusert J, Lee C, Li B, Arden K, Ren B, Nathanson DA, et al. (2017). Extrachromosomal oncogene amplification drives tumour evolution and genetic heterogeneity. Nature 543, 122–125. [DOI] [PMC free article] [PubMed] [Google Scholar]
- van Diggelen OP, Voznyi YV, Keulemans JL, Schoonderwoerd K, Ledvinova J, Mengel E, Zschiesche M, Santer R, and Harzer K (2005). A new fluorimetric enzyme assay for the diagnosis of Niemann-Pick A/B, with specificity of natural sphingomyelinase substrate. J. Inherit. Metab. Dis. 28, 733–741. [DOI] [PubMed] [Google Scholar]
- van Meer G, Voelker DR, and Feigenson GW (2008). Membrane lipids: where they are and how they behave. Nat. Rev. Mol. Cell Biol. 9, 112–124. [DOI] [PMC free article] [PubMed] [Google Scholar]
- Villa GR, Hulce JJ, Zanca C, Bi J, Ikegami S, Cahill GL, Gu Y, Lum KM, Masui K, Yang H, et al. (2016). An LXR-Cholesterol Axis Creates a Metabolic Co-Dependency for Brain Cancers. Cancer Cell 30, 683–693. [DOI] [PMC free article] [PubMed] [Google Scholar]
- Wang MY, Lu KV, Zhu S, Dia EQ, Vivanco I, Shackleford GM, Cavenee WK, Mellinghoff IK, Cloughesy TF, Sawyers CL, and Mischel PS (2006). Mammalian target of rapamycin inhibition promotes response to epidermal growth factor receptor kinase inhibitors in PTEN-deficient and PTEN-intact glioblastoma cells. Cancer Res. 66, 7864–7869. [DOI] [PubMed] [Google Scholar]
- Wen PY, Weller M, Lee EQ, Alexander BM, Barnholtz-Sloan JS, Barthel FP, Batchelor TT, Bindra RS, Chang SM, Chiocca EA, et al. (2020). Glioblastoma in adults: a Society for Neuro-Oncology (SNO) and European Society of Neuro-Oncology (EANO) consensus review on current management and future directions. Neuro-oncol. 22, 1073–1113. [DOI] [PMC free article] [PubMed] [Google Scholar]
- Wong DT, Perry KW, and Bymaster FP (2005). Case history: the discovery of fluoxetine hydrochloride (Prozac). Nat. Rev. Drug Discov. 4, 764–774. [DOI] [PubMed] [Google Scholar]
- Xu K, Ding L, Chang TC, Shao Y, Chiang J, Mulder H, Wang S, Shaw TI, Wen J, Hover L, et al. (2019). Structure and evolution of double minutes in diagnosis and relapse brain tumors. Acta Neuropathol. 137, 123–137. [DOI] [PMC free article] [PubMed] [Google Scholar]
- Zhou Z, Rahme E, Abrahamowicz M, and Pilote L (2005). Survival bias associated with time-to-treatment initiation in drug effectiveness evaluation: a comparison of methods. Am. J. Epidemiol. 162, 1016–1023. [DOI] [PubMed] [Google Scholar]
- Zhou YH, Chen Y, Hu Y, Yu L, Tran K, Giedzinski E, Ru N, Gau A, Pan F, Qiao J, et al. (2017). The role of EGFR double minutes in modulating the response of malignant gliomas to radiotherapy. Oncotarget 8, 80853–80868. [DOI] [PMC free article] [PubMed] [Google Scholar]
Associated Data
This section collects any data citations, data availability statements, or supplementary materials included in this article.
Supplementary Materials
Data Availability Statement
All RNA-seq data generated in this study have been deposited at the GEO database (GEO: GSE158674) and are publicly available as of the date of publication. More data of patient analysis in electronic medical records generated in this study have been deposited at Mendeley Data and are publicly available as of the date of publication. Accession numbers or DOIs are listed in the key resources table. Other data reported in this paper will be shared by the lead contact upon request.
All software and packages applied are publicly available and listed in the key resources table and methods. This paper does not report original code.
Any additional information required to reanalyze the data reported in this paper is available from the lead contact upon request.
KEY RESOURCES TABLE.
| REAGENT or RESOURCE | SOURCE | IDENTIFIER |
|---|---|---|
|
| ||
| Antibodies | ||
|
| ||
| Rabbit anti-pEGFR-Y1068, Clone D7A5 (WB 1:1000, IHC 1:800) | Cell Signaling | Cat#3777; RRID:AB_2096270 |
| Rabbit anti-EGFR (WB 1:10000) | Millipore | Cat# 06-847; RRID:AB_2096607 |
| Mouse anti-EGFR (Ab-1), Clone 528 (Flow 1:20) | Millipore | Cat#GR01; RRID:AB_564572 |
| Rabbit anti-EGFR (D38B1) conjugated with Alexa Fluor-488 (IF 1:200) | Cell Signaling | Cat#5616; RRID: AB_10691853 |
| Rabbit Anti-LAMP1, Clone D2D11 (IF and IHC 1:200) | Cell Signaling | Cat#9091; RRID:AB_2687579 |
| Rabbit Anti-LAMP1 (IHC 1:200) | Abcam | Cat#ab24170, RRID:AB_775978 |
| Rabbit Anti-PDGFRA, Clone D1E1E (WB 1:1000) | Cell Signaling | Cat#3174; RRID:AB_2162345 |
| Rabbit Anti-pPDGFRA-Tyr754, Clone 23B2 (WB 1:1000) | Cell Signaling | Cat#2992; RRID:AB_390728 |
| Rabbit Anti-FGFR1, Clone D8E4 (WB 1:1000) | Cell Signaling | Cat#9740; RRID:AB_11178519 |
| Mouse Anti- Phospho-FGF Receptor (Tyr653/654), Clone 55H2 (WB 1:500) | Cell Signaling | Cat#3476; RRID:AB_331369 |
| Rabbit Anti-Met, Clone D1C2 (WB 1:1000) | Cell Signaling | Cat#8198; RRID:AB_10858224 |
| Rabbit Anti-Phospho-Met (Tyr1234/1235), Clone D26 (WB 1:500) | Cell Signaling | Cat#3077; RRID:AB_2143884 |
| Rabbit anti-pAkt-S473, Clone D9E (WB 1:3000) | Cell Signaling | Cat#4060; RRID:AB_2315049 |
| Rabbit anti-pS6-S235/236, Clone D57.2.2E (WB 1:3000, IHC 1:400) | Cell Signaling | Cat#4858; RRID:AB_916156 |
| Mouse Anti-rH2AX/ phosphor-Histone H2A.X (Ser139), Clone JBW301 (IF 1:200) | Millipore | Cat#05-636; RRID:AB_309864 |
| Rabbit anti-Flotillin-1, Clone D2V7J (WB 1:1000) | Cell Signaling | Cat#18634; RRID:AB_2773040 |
| Rabbit anti- Gα(q), Clone D5V1B (WB 1:1000) | Cell Signaling | Cat#14373; RRID:AB_2665457 |
| Rabbit anti-Calnexin, Clone C5C9 (WB 1:1000) | Cell Signaling | Cal#2679; RRID:AB_2228381 |
| Mouse anti-actin, Clone AC40 (WB 1:3000) | Sigma | Cat#A4700; RRID:AB_476730 |
| Anti-rabbit IgG, HRP-linked (WB 1:2000) | Cell Signaling | Cat#7074; RRID:AB_2099233 |
| Anti-mouse IgG, HRP-linked (WB 1:2000) | Cell Signaling | Cat#7076; RRID:AB_330924 |
| Alexa Fluor anti-rabbit 546 (IF 1:500) | ThermoFisher Scientific | Cat#A11010; RRID:AB_2534085 |
| Alexa Fluor anti-mouse 488 (Flow and IF 1:500) | ThermoFisher Scientific | Cat#A11017; RRID:AB_2534084 |
| Mouse anti-Ki67, Clone 8D5 (IHC 1:500) | Cell Signaling | Cat#9449; RRID:AB_2797703 |
|
| ||
| Chemicals, peptides, and recombinant proteins | ||
|
| ||
| DMEM | Corning | Cat#10-013 |
| DMEM/F12 | GIBCO | Cat#11320-033 |
| Pen Strep Glutamine | GIBCO | Cat#10378-016 |
| Glutamax | GIBCO | Cat#35050-061 |
| B27 | GIBCO | Cat#17504-001 |
| Fetal Bovine Serum (FBS) | Omega Scientific | Cat#FB-21 |
| Epidermal Growth Factor (EGF) | Sigma | Cat#E9644 |
| Fibroblast Growth Factor (FGF) | Sigma | Cat#F0291 |
| Heparin | Sigma | Cat#H3149 |
| AGM BulletKit | LONZA | Cat#CC-3186 |
| C16 Ceramide (d18:1/16:0) | Avanti Polar Lipids | Cat#860516 |
| 16:0 SM (d18:1/16:0) | Avanti Polar Lipids | Cat#860584 |
| 24:0 SM (d18:1/24:0) | Avanti Polar Lipids | Cat#860592 |
| SM (d18:1/n16:0-d9) | Cayman Chemical | Cat#30141 |
| SM (d18:1/17:0) | Avanti Polar Lipids | Cat#860585P |
| Ceramide (d18:1/17:0) | Avanti Polar Lipids | Cat #860517P |
| Fatty acid-free Bovine Serum Albumin | Sigma | Cat#A6003 |
| MG132 | Cell Signaling | Cat#2194 |
| Chloroquine | Cell Signaling | Cat#14774 |
| LysoTracker | Invitrogen | Cat#L7528 |
| Low gelling temperature agarose | Sigma | Cat#A9045 |
| Trypan Blue Solution | GIBCO | Cat#15250061 |
| Opti-Prep Density Gradient Medium | Sigma | Cat#D1556 |
| rTdT | Invitrogen | Cat#10533065 |
| Digoxigenin-11-dUTP | Roche | Cat#11558706910 |
| Anti-Digoxigenin-POD | Roche | Cat#11207733910 |
| Crystal violet solution | Sigma | Cat#V5265 |
| Laurdan (6-Dodecanoyl-2-Dimethylaminonaphthalene) | ThermoFisher Scientific | Cat#D250 |
| Temozolomide | MedChemExpress | Cat#HY-17364 |
| Fluoxetine | MedChemExpress | Cat#HY-B0102A |
|
| ||
| Critical commercial assays | ||
|
| ||
| X-tremeGENE HP DNA Transfection Reagent | Roche | Cat#6366236001 |
| RNeasy Mini Kit | QIAGEN | Cat#74106 |
| SYBR Green Supermix | Bio-Rad | Cat#1708880 |
| BCA Protein Assay Kit | ThermoFisher Scientific | Cat#23225 |
| SuperSignal West Pico PLUS Chemiluminescent Substrate | ThermoFisher Scientific | Cat#34580 |
| FITC Annexin V Apoptosis Detection Kit I | BD Biosciences | Cat#556547 |
| Acid Sphingomyelinase Enzymatic Activity kit | Echelon | Cat#K-3200 |
| CellTiter-Glo | Promega | Cat#G7572 |
|
| ||
| Deposited data | ||
|
| ||
| RNA-seq | This study | GEO: GSE158674 |
| Data S1 | This study | https://data.mendeley.com/datasets/5gww3pgbj3/1 |
|
| ||
| Experimental models: Cell lines | ||
|
| ||
| Human: Normal Human Astrocyte (NHA) | LONZA | CC-2565 |
| Human: IMR90 | ATCC | CCL-186 |
| Human: RPE1 | ATCC | CRL-4000 |
| Human: U87 | ATCC | HTB-14 |
| Human: U87EGFRvIII | Wang et al., 2006 | N/A |
| Human: GBM39 patient-derived neurosphere cells | Nathanson et al., 2014 | N/A |
| Human: HK301 patient-derived neurosphere cells | Laks et al., 2016 | N/A |
| Human: HK296 patient-derived neurosphere cells | Laks et al., 2016 | N/A |
| Human: HK359 patient-derived neurosphere cells | Laks et al., 2016 | N/A |
| Human: HK336 patient-derived neurosphere cells | Laks et al., 2016 | N/A |
| Human: HK217 patient-derived neurosphere cells | Laks et al., 2016 | N/A |
| Human: HK390 patient-derived neurosphere cells | Laks et al., 2016 | N/A |
| Human: HK385 patient-derived neurosphere cells | Laks et al., 2016 | N/A |
| Human: HK254 patient-derived neurosphere cells | Laks et al., 2016 | N/A |
| Human: HK350 patient-derived neurosphere cells | Laks et al., 2016 | N/A |
| Human: HK250 patient-derived neurosphere cells | Laks et al., 2016 | N/A |
| Human: HK229 patient-derived neurosphere cells | Laks et al., 2016 | N/A |
| Human: TS576 patient-derived neurosphere cells | Hu et al., 2016 | N/A |
| Human: CA718 patient-derived neurosphere cells | Turner et al., 2017 | N/A |
| Human: DIPG25 Diffuse Intrinsic Pontine Glioma line | Nagaraja et al., 2019 | N/A |
| Human: DIPG38 Diffuse Intrinsic Pontine Glioma line | Nagaraja et al., 2019 | N/A |
| Human: DIPG36 Diffuse Intrinsic Pontine Glioma line | Nagaraja et al., 2019 | N/A |
| Human: DIPG50 Diffuse Intrinsic Pontine Glioma line | Buczkowicz et al., 2014 | N/A |
| See Table S1 for more detailed information of all cell lines used in this study | N/A | |
|
| ||
| Experimental models: Organisms/strains | ||
|
| ||
| Mouse: Athymic Nude Foxn1nu | Charles River Laboratories | Strain 490 |
|
| ||
| Oligonucleotides | ||
|
| ||
| SMPD1 qPCR forward primer: 5′TGCCAGGTTACATCGCATAG3′ | This study | N/A |
| SMPD1 qPCR reverse primer: 5′AGGTTGATGGCGGTGAATAG3′ | This study | N/A |
| SLC6A4 qPCR forward primer: 5′AACAACTGCTACCAAGATGC3′ | This study | N/A |
| SLC6A4 qPCR reverse primer: 5′CTCATCTCAGCCATGTAACC3′ | This study | N/A |
| HTR2C qPCR forward primer: 5′GATTATGTCTGGCCACTACC3′ | This study | N/A |
| HTR2C qPCR reverse primer: 5′GGAACTGATACACCGATCC3′ | This study | N/A |
| SGMS1 qPCR forward primer: 5′TACACTGTGGACGTGGTGGT3′ | This study | N/A |
| SGMS1 qPCR reverse primer: 5′CAGGAGGTTCATCTGGGAAG3′ | This study | N/A |
| SGMS2 qPCR forward primer: 5′CAATTCCTTGCTGCTTCTCC3′ | This study | N/A |
| SGMS2 qPCR reverse primer: 5′CCAATCTTCTGAACCCGTGA3′ | This study | N/A |
|
| ||
| Recombinant DNA | ||
|
| ||
| pLVX-Puro Vector | Clontech | Cat#632159 |
| pLVX-Puro-SMPD1 | This study | N/A |
| PLVX-Puro-AKT-E17A-CA | Bi et al., 2019 | N/A |
| Non-targeting control shRNA | Bi et al., 2019 | N/A |
| SMPD1-1 shRNA, target sequence: CTGGTTTAGCTGGATATGGGA | This study | N/A |
| SMPD1-2 shRNA, target sequence: CCCACATTTGGGAAAGTTCTT | This study | N/A |
| SLC6A4-1 shRNA, target sequence: GGACATTTAAAGAGCGTATTA | Sigma | TRCN0000422925 |
| SLC6A4-2 shRNA, target sequence: CAAGGCCTCCAGCCACTTATT | Sigma | TRCN0000423041 |
| HTR2C-1 shRNA, target sequence: CCGTTTCAATTCGCGGACTAA | Sigma | TRCN0000009101 |
| HTR2C-2 shRNA, target sequence: CCGCTGACGATTATGGTGATT | Sigma | TRCN0000009102 |
| SGMS1-1 shRNA, target sequence: GCGAAGAATAATGAAGCTCAT | Sigma | TRCN0000134296 |
| SGMS1-2 shRNA, target sequence: CTGTACCTGTATCGGTGTATT | Sigma | TRCN0000422754 |
| SGMS2-1 shRNA, target sequence: GCTGTAACCAAAGGTATAGTT | Sigma | TRCN0000122186 |
| SGMS2-1 shRNA, target sequence: GCTTGTTAAAGAGGTGCCAAA | Sigma | TRCN0000122885 |
|
| ||
| Software and algorithms | ||
|
| ||
| Image Lab Software | Bio-Rad | RRID:SCR_014210 |
| GraphPad Prism 8 | GraphPad Software | RRID:SCR_002798 |
| ImageJ | NIH | RRID:SCR_003070 |
| FlowJo v10 | Treestar | RRID: SCR_008520 |
| Leica LAS software | Leica | RRID:SCR_013673 |
| Visiopharm | Visiopharm | https://visiopharm.com/ |
| GSEA | Subramanian et al., 2005 | http://www.gsea-msigdb.org/gsea/index.jsp |
| cBioProtal | Cerami et al., 2012; Gao et al., 2013 | https://www.cbioportal.org/ |
| GEPIA | Tang et al., 2017 | http://gepia.cancer-pku.cn/ |
| DepMap Portal | Corsello et al., 2020; Ghandi et al., 2019 | https://depmap.org/portal |