Abstract
The epidermal growth factor receptor (EGFR) is frequently mutated in human cancer1,2, and is an important therapeutic target. EGFR inhibitors have been successful in lung cancer, where intracellular tyrosine kinase domain mutations activate the receptor1, but not in glioblastoma multiforme (GBM)3 – where mutations occur exclusively in the extracellular region. Here, we show that common extracellular GBM mutations prevent EGFR from discriminating between its activating ligands4. Different growth factor ligands stabilise distinct EGFR dimer structures5 that signal with different kinetics to specify or bias outcome5,6. EGF itself induces strong symmetric dimers that signal transiently to promote proliferation. Epiregulin (EREG) induces much weaker asymmetric dimers that drive sustained signalling and differentiation5. GBM mutations reduce the ability of EGFR to distinguish EREG from EGF in cellular assays, and allow EGFR to form strong (EGF-like) dimers in response to EREG and other low-affinity ligands. Using X-ray crystallography, we further show that the R84K GBM mutation symmetrises EREG-driven extracellular dimers so that they resemble dimers normally seen with EGF. A second GBM mutation, A265V, instead remodels key dimerisation contacts to strengthen asymmetric EREG-driven dimers. Our results argue for an important role in GBM of altered ligand discrimination by EGFR, with potential implications for therapeutic targeting.
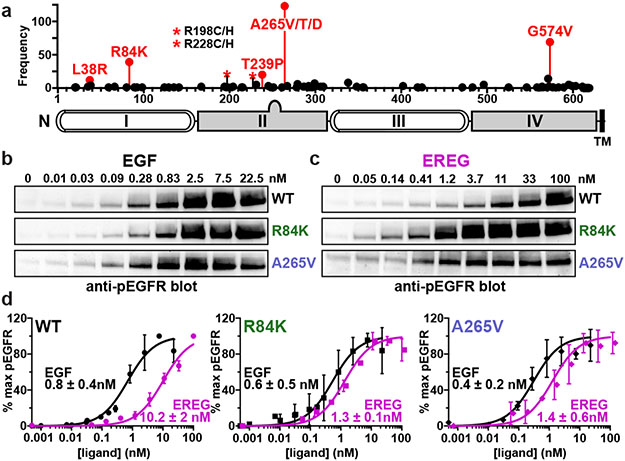
Identification of cancer-associated missense mutations has guided targeted cancer therapy while also yielding important mechanistic insights7. EGFR mutations in lung cancer occur in the intracellular tyrosine kinase domain and directly promote its activity8. By contrast, EGFR mutations in glioblastoma (GBM) are exclusively extracellular2,9 (Fig. 1a; mature receptor numbering), and their role as ‘driver’ mutations is much less clear – despite occurring in ~24% of cases2. Indeed, the importance of EGFR in GBM presents a substantial clinical puzzle3,10. The prognostic significance of EGFR mutation (including variant III) and amplification is complex in GBM, and EGFR inhibitors have not been successful10,11.
FIGURE 1. Extracellular EGFR mutations in glioblastoma, and effects on signaling.
a. Extracellular EGFR mutations in GBM9, using mature EGFR numbering. R198 and R228 (asterisks) are most commonly mutated to cysteine.
b.-c. Serum starved eHAP cells stably expressing wild-type, R84K, or A265V EGFR were stimulated with the noted EGF (b) or EREG (c) doses (5 min), and EGFR phosphorylation was assessed by immunoblotting cell lysates. Representative blots are shown. See Supplementary Fig. 1 for gel source data.
d. Quantitation of data in (b) and (c) as described in Extended Data Fig. 1c, plotting mean ± SD (n = 3 biologically independent samples). EC50 values (± SD) are quoted, which differ significantly for EREG and EGF with WT (p = 0.0016), but not with R84K (p = 0.087) or A265V (p = 0.052). p values from unpaired two-tailed Student’s t-tests.
GBM mutations impair ligand discrimination
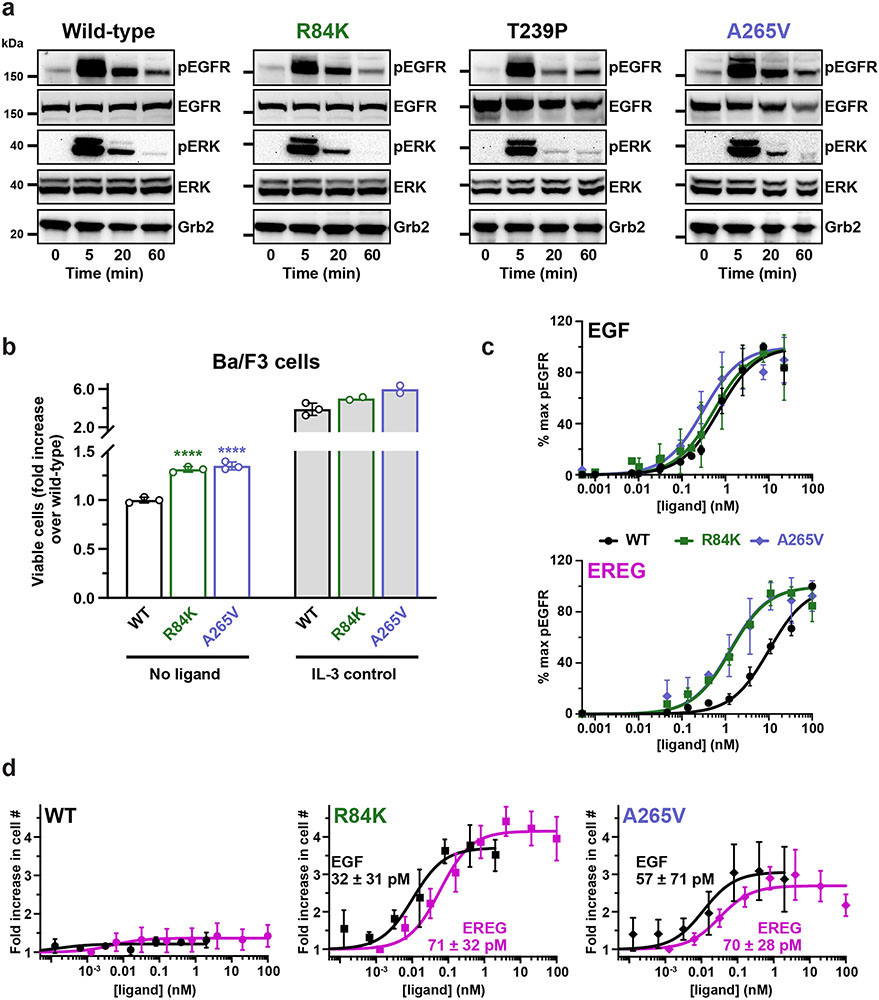
We asked whether common GBM mutations might exert their effects by altering the ability of EGFR to distinguish between its different activating ligands. Distinct EGFR ligands can induce divergent cell fates through the same receptor4 by inducing dimers of the receptor’s extracellular region (ECR) that have different structures and stabilities5. High-affinity ligands like EGF induce strong, symmetric ECR dimers that signal transiently to promote cell proliferation. Low affinity ligands like EREG induce much weaker, asymmetric dimers that promote sustained signalling and differentiation in some cells5. Common GBM mutations do not simply elevate EGF-independent (or dependent) activation of EGFR expressed in a null background in vitro (Extended Data Fig. 1a). They do promote a small (but statistically significant) increase in IL-3-independent Ba/F3 cell growth without EGF (Extended Data Fig. 1b) – suggesting weak transforming ability12,13. The most notable effect, however, is a selective enhancement of EGFR sensitivity to EREG in receptor autophosphorylation assays (Fig. 1b), reducing the >12-fold difference in potency between EGF and EREG to less than ~3-fold (Fig. 1c and Extended Data Fig. 1c).
Whereas EGF and EREG function as high- and low-affinity ligands respectively for wild-type EGFR5, their potencies for promoting EGFR autophosphorylation are no longer significantly different for R84K- or A265V-mutated EGFR (Fig. 1c). Importantly, the two ligands are also almost equipotent in promoting IL-3-independent growth of Ba/F3 cells that express R84K or A265V variants of EGFR (Extended Data Fig. 1d).
Stabilised EREG-induced EGFR dimers
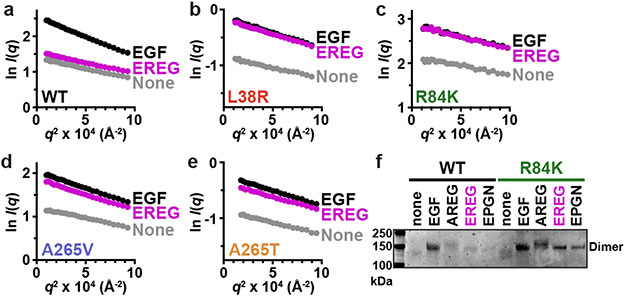
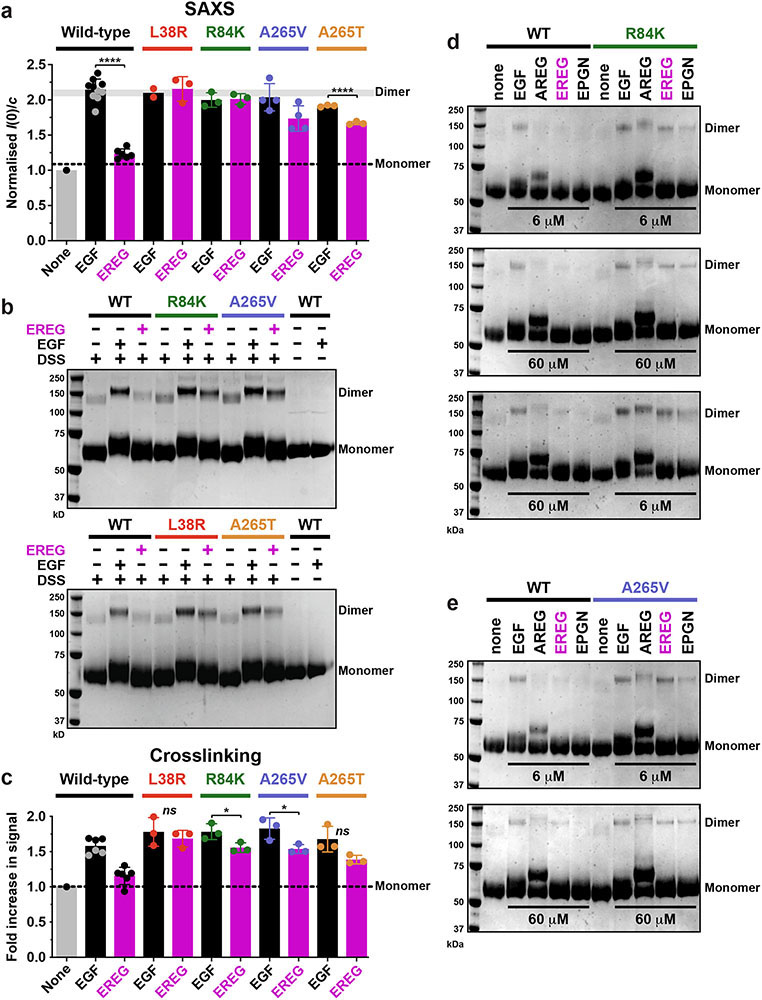
The ability of R84K and A265V mutations to enhance EREG’s potency suggested that they might allow it to stabilise stronger EGFR dimers than seen for wild-type receptor. In small-angle X-ray scattering (SAXS) studies of purified recombinant ECR (sEGFR: residues 1-501), saturation with EGF causes complete dimerisation (Fig. 2a), but saturation with EREG does not. SAXS provides quantitative shape-independent molecular weight information for proteins in solution – from the y intercept (I(0)) in Guinier plots such as those shown in Figs. 2a-e. Adding excess EGF doubles I(0) for wild-type sEGFR but EREG has no effect (compare y intercepts in Fig. 2a). By contrast, full dimerisation occurs with either EREG or EGF when sEGFR harbours an L38R, R84K, A265V, or A265T GBM mutation (Figs. 2b-e and Extended Data Fig. 2a) – with no increase in ligand-independent dimerisation. The ability of these mutations to enhance EREG-induced sEGFR dimerisation was also evident by chemical crosslinking (Fig. 2f and Extended Data Figs. 2b, c). We estimate from the SAXS results (with [sEGFR] of 70 μM) that these GBM mutations enhance dimerisation of EREG-bound sEGFR by several hundred fold (see legend to Extended Data Fig. 2a).
FIGURE 2. GBM mutations selectively enhance EREG-induced EGFR dimerization.
a.-e. SAXS studies of dimerisation of WT or mutated sEGFR (70 μM) induced by EGF and EREG (84 μM). Guinier plots (see Methods) show the natural logarithm of mass-normalised scattering intensity at angle q, I(q), plotted against q2. Extrapolation to the y axis gives I(0)/c, proportional to weight-averaged molecular mass. EREG fails to dimerise WT sEGFR, but induces dimers of all GBM variants. Representative data are shown for 3 biological replicates; see Extended Data Fig. 2a for quantitation.
f. Representative (n = 3) Coomassie stained gel from chemical cross-linking experiments showing that the R84K mutation promotes sEGFR dimerisation by all low-affinity EGFR ligands (adding 60 μM ligand to 5 μM sEGFR). See Supplementary Fig. 1 for gel source data.
Specific effects on low-affinity ligands
We next asked whether GBM mutations also strengthen dimers induced by other EGFR ligands. A 98-residue form of amphiregulin (AREG) induces only weak dimers of wild-type EGFR6, associated with sustained signalling (Extended Data Fig. 3). Chemical crosslinking studies showed that this dimerisation is also substantially enhanced by R84K or A265V mutations (Fig. 2f and Extended Data Figs. 2d, e). Moreover, epigen (EPGN)-induced sEGFR dimerisation is strengthened by GBM mutations, although to a lesser degree (Fig. 2f). To confirm that these effects do not simply reflect enhanced ligand-binding by mutated sEGFR variants, we added ten-fold more ligand (60 μM) to fully saturate wild-type and mutated sEGFR with identical results (Extended Data Figs. 2d, e).
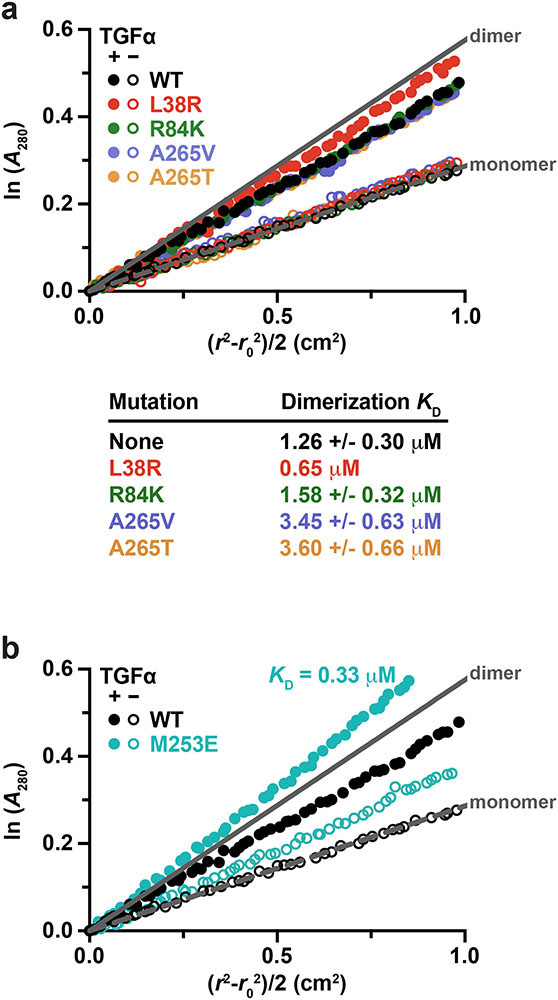
By contrast with these effects on EREG, AREG, and EPGN-induced dimers, none of the GBM mutations enhanced the (already-stronger) sEGFR dimerisation induced by transforming growth factor-α (TGFα) – a high-affinity EGFR ligand (Extended Data Fig. 4). L38R or R84K mutations did not significantly alter KD for TGFα-induced sEGFR dimers in sedimentation equilibrium analytical ultracentrifugation (SE-AUC) studies, and A265V or A265T mutations actually weakened dimerisation by ~2.5-fold.
R84K ‘symmetrises’ EREG-induced dimers
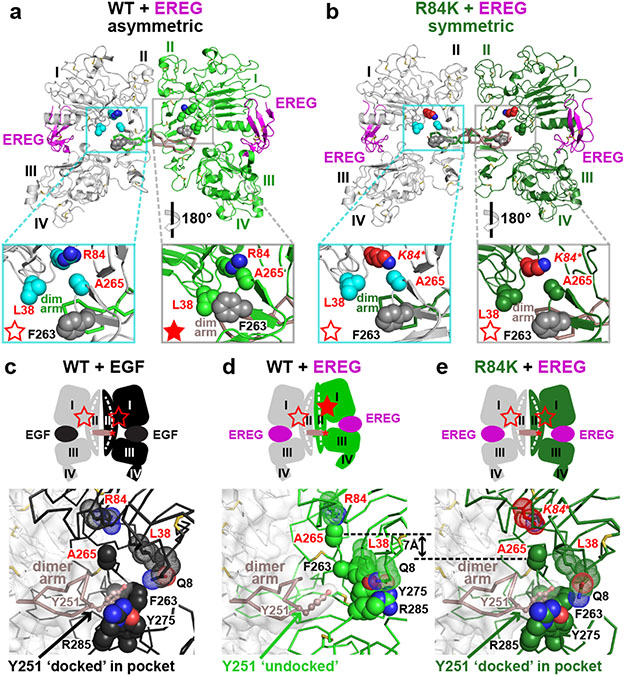
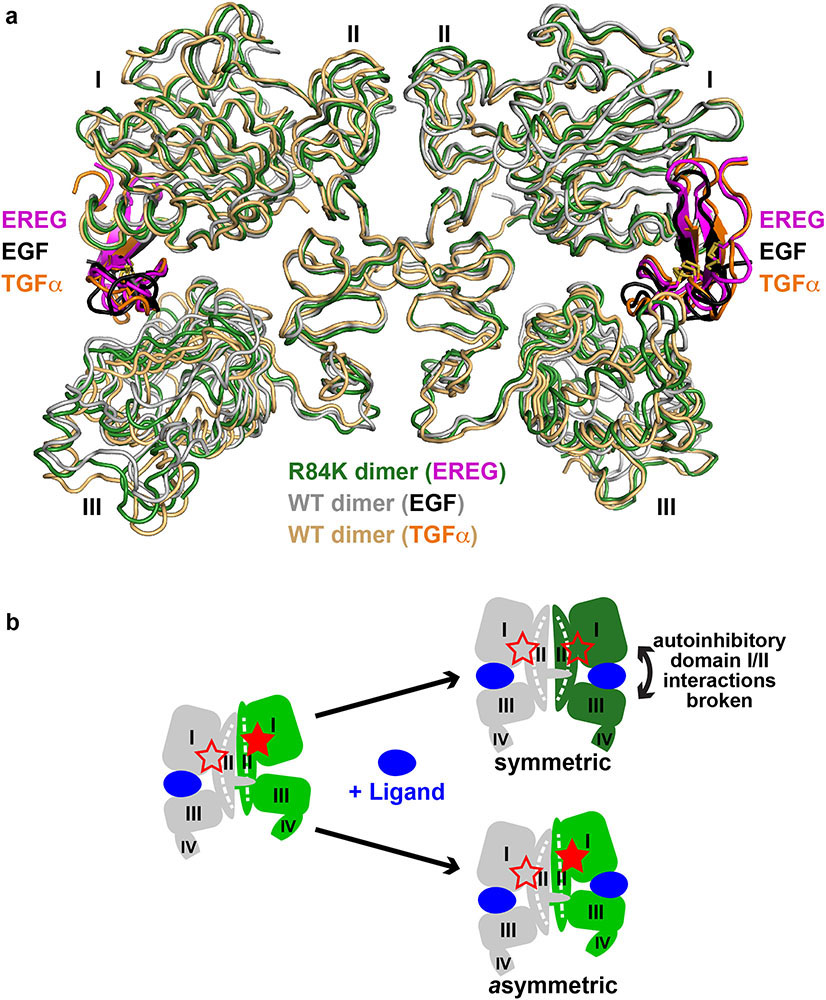
A 2.9 Å resolution crystal structure (Extended Data Table 1) revealed how the R84K mutation allows EREG to induce symmetric sEGFR dimers (Fig. 3b) that resemble strong wild-type sEGFR dimers induced by EGF14 or TGFα15 (Fig. 3, Extended Data Fig. 5a). Fig. 3a shows in wild-type sEGFR how R84 and other residues frequently mutated in GBM (L38 and A265) – plus F263 – normally help define the asymmetry (and low stability) of EREG-induced dimers. In the left-hand molecule of this asymmetric EREG-induced dimer, the L38, R84 and A265 side-chains (cyan) are well separated (open red star in Fig. 3a left insert), as they are in EGF-induced sEGFR dimers (Extended Data Fig. 6a). By contrast, R84 retains direct contact with A265 in the right-hand molecule (green) of this asymmetric dimer, and L38 contacts F263 (filled red star in Fig. 3a right insert). These R84/A265 and L38/F263 contacts are characteristic of unliganded16 and EPGN-bound5 sEGFR monomers (Extended Data Figs. 6b, c), and weak ligands like EREG cannot fully disrupt them (see legend to Extended Data 5b). The R84/A265 and L38/F263 contacts restrain the relative positions of domains I and II and prevent the domain II bend (around residue 238: see Extended Data Figs. 5b and 6d) that accompanies EGF-induced dimerisation16. The characteristic domain II bend is crucial for forming the F263/Y275/R285 pocket that accommodates the key tyrosine (Y251) of the adjacent molecule’s dimer arm in strong dimers (Fig. 3c). In the asymmetric EREG-induced sEGFRWT dimer, by contrast, the unbent domain II of the right-hand molecule (green in Figs. 3a, d) cannot dock Y251 from the adjacent dimer arm – explaining the greatly weakened dimerisation. The R84/A265 and L38/F263 contacts are thus autoinhibitory.
FIGURE 3. R84K GBM mutation symmetrises EREG-induced EGFR dimers.
a. EREG-induced asymmetric sEGFRWT dimer (PDB: 5WB7), with key GBM mutation sites shown as cyan (left) or green (right) spheres. The right-hand insert is rotated 180° about a vertical axis to compare L38/R84/A265 (and F263) positions between molecules. GBM-mutated residues are dispersed in the left-hand molecule (open red star), but clustered in the right (filled star).
b. Symmetric EREG-induced dimer of R84K-mutated sEGFR, with broken autoinhibitory interactions shown in zoomed regions (open red stars).
c.-e. Upper panels: Cartoons of sEGFR dimers, showing symmetry (c and e) or asymmetry (d) and status of autoinhibitory interactions (open or filled red stars). Dashed white curve/line in domain II denotes whether domain II is bent or straight.
Lower panels: Close-up of the Y251 side-chain in the dimer arm of the left-hand molecule docking into its binding site formed by F263, Y275, and R285 from the right-hand molecule in c and e, but remaining undocked in d. The 7 Å shift of A265 (and residues C-terminal to it) between EREG-bound WT (d) and R84K (e) is marked.
The GBM R84K mutation allows EREG to break R84/A265 and L38/F263 contacts in both protomers of the dimer (Fig. 3b), symmetrising and strengthening the dimer by allowing both dimer arm tyrosines to dock against the bent domain II of their adjacent molecules. The R84K mutation (red in Fig. 3b) does this by ‘releasing’ A265 to help break autoinhibitory domain I/II interactions in the right-hand molecule and allowing domain II to bend as it would with a high-affinity ligand. A265 moves ‘down’ in the plane of the page by >7Å (Figs. 3d,e), freeing the F263, Y275 and R285 side-chains to move toward the dimer interface and to form the docking site for Y251 of the opposing dimer arm (Fig. 3e) – substantially strengthening EREG-induced sEGFRR84K dimers.
Mutating R84 equalises EREG-binding sites
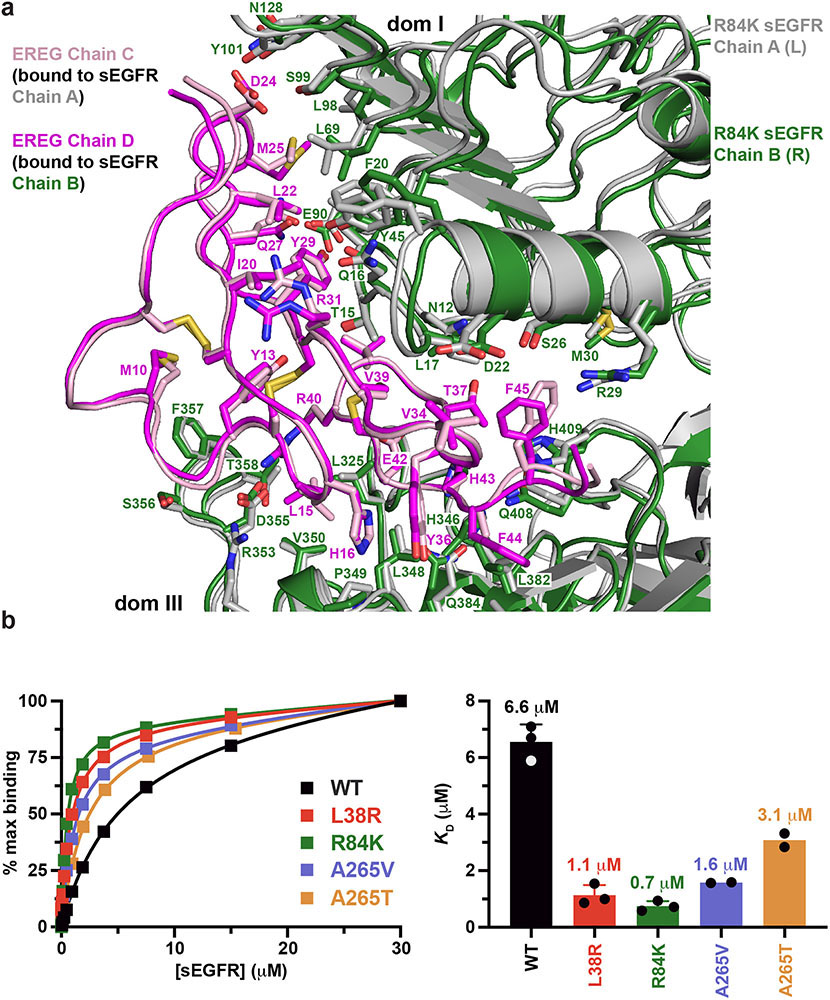
By symmetrising the EREG-induced sEGFR dimer, the R84K mutation both strengthens the dimer – allowing both dimer arms to dock fully – and enhances ligand binding. In asymmetric (weak) EREG-induced sEGFRWT dimers, one EREG-binding site (right in Fig. 3a) buries 34% less surface area than the other5 (1,902 Å2 versus 2,878 Å2). The R84K mutation equalises the two sites (Extended Data Fig. 7a), which bury 2,581 Å2 and 2,726 Å2 respectively, bringing the total area buried closer to the number seen with EGF or TGFα (~2,970 Å2 per site). These changes also increase the EREG-binding affinity of R84K-mutated sEGFR by almost 10-fold (Extended Data Fig. 7b) – consistent with diminished EGFR ligand discrimination.
Effects of other GBM mutations
Our analysis of sEGFRR84K suggests similar effects for other GBM mutations. An L38R substitution likely breaks autoinhibitory domain I/II interactions in a similar way, disrupting L38/F263 contacts (Fig. 3a, right insert) to symmetrise the dimer. Indeed, the L38R mutation enhances EREG-induced sEGFR dimerisation (Fig. 2b) and increases EREG-binding affinity by ~6-fold (Extended Data Fig. 7b). Interestingly, despite participating in autoinhibitory domain I/II interactions, F263 is not mutated in GBM – consistent with its key role in forming the F263/Y275/R285 pocket that docks the dimer arm (Figs. 3c-e). Accordingly, F263 mutations impair function17 rather than enhancing dimerisation. Turning to other GBM mutations, R198 and R228 substitutions (asterisks in Fig. 1a) could disrupt domain I/II interactions with effects similar to those of L38R or R84K – with the caveat that they are most frequently substituted with cysteine, which might cause aberrant disulphide crosslinking. We also investigated substitutions at A265, the residue most commonly mutated in GBM. A265V or A265T mutations both selectively stabilise EREG-induced sEGFR dimers (Figs. 2d,e), but slightly less well than L38R or R84K. Both A265 substitutions also increase EREG binding affinity (Extended Data Fig. 7b), again with slightly smaller effects than seen with L38R or R84K (by ~2-4 fold).
A265V mutation reorients the dimer arm
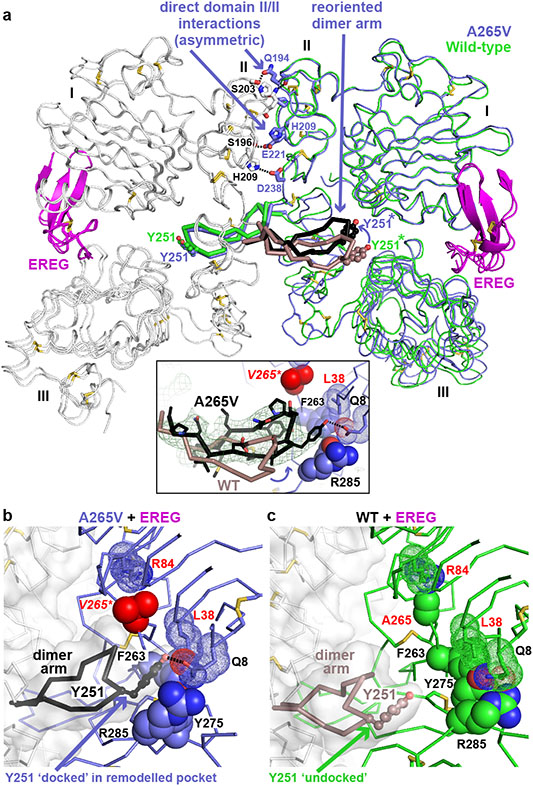
Crystallographic studies of an EREG-induced sEGFRA265V dimer showed how this mutation uses a slightly different mechanism from R84K to strengthen EREG-induced dimers. Rather than symmetrising the dimer, the A265V mutation modifies the pocket for the opposing dimer arm’s tyrosine so that it can dock effectively even in an asymmetric dimer (Fig. 4a), with the autoinhibitory domain I/II interactions in the right-hand protomer retained (Extended Data Fig. 8a). The asymmetry in Fig. 4a is also clear in differences between the two ligand-binding sites in the EREG-induced sEGFRA265V dimer, which closely resemble those in EREG-induced sEGFRWT dimers (Extended Data Figs. 8c,d). This likely explains why A265V and A265T mutations have smaller effects than L38R or R84K on EREG-binding affinity (Extended Data Fig. 7b).
FIGURE 4. A265V mutation optimises dimer arm docking in EREG-induced dimers.
a. Overlay of EREG-induced sEGFRWT and sEGFRA265V dimers. The left-hand molecule is grey, and the right-hand molecule slate blue (A265V) or green (WT). The dimer arm of the left-hand molecule is black (A265V) or salmon (WT). The insert shows an unbiased ∣Fo∣-∣Fc∣ polder OMIT map18 at 3.5 Å resolution (contoured at 2σ), calculated using A265V data and omitting L243-P257 from the model.
b. Close-up of (black) dimer arm docking in the unique site (slate blue) formed in the A265V-mutated EREG-induced dimer. The mutated V265 is red.
c. Close-up of undocked dimer arm (salmon) in EREG-induced WT sEGFR dimers.
With asymmetry and domain I/II autoinhibitory interactions retained, how does the A265V mutation enhance dimer arm docking? The overlay in Fig. 4a shows a substantial reorientation of the dimer arm in the sEGFRA265V dimer (black) compared with its position in the sEGFRWT dimer (salmon), emphasised in a polder OMIT map18 (Fig. 4a insert). This dimer arm reorientation allows Y251 from the left protomer to dock uniquely in a remodeled pocket (Fig. 4b) that includes F263/Y275/R285, but also engages the side-chains of Q8 and L38 from domain I in a way not seen in any previous EGFR dimer – including polar Q8/Y251 interactions (Fig. 4b). This unique docking mode is made possible by a 2-3 Å displacement of domain II’s backbone beyond position 265 when the A265 side-chain is increased in size (to V) and its contact with R84 is retained (Fig. 4b and Extended Data Fig. 8b). The L38/F263 interaction is also maintained (but altered in detail). The F263, Y275 and R285 side-chains all move slightly (red arrows in Extended Data Fig. 8b) and combine with Q8 and L38 to create a new docking site for the opposing dimer arm (Fig. 4b). Similar dimer arm re-docking (with a different structural origin) also explains strengthening of asymmetric ErbB3/ErbB2 dimers by the oncogenic S310F mutation in ErbB219 – providing important mechanistic links between different extracellular cancer-associated mutations in this receptor family.
The EREG-induced sEGFRA265V dimer also retains the asymmetric interface between N-terminal parts of domain II (Fig. 4a) seen in EREG-induced wild-type sEGFR dimers5. These interactions involve residues conserved in asymmetric Drosophila EGFR dimers20, and resemble the domain II interface seen in asymmetric ErbB3/ErbB2 dimers19. Alone, this interface (which buries just 634 Å2) can support only weak sEGFR dimerisation. When added to the remodeled dimer arm contacts shown in Fig. 4b, however, it can support strong dimerisation of A265-mutated sEGFR.
Conclusions
Our findings identify a ‘decision switch’ for ligand discrimination by EGFR, comprising autoinhibitory domain I/II contacts in the receptor – where GBM mutations are concentrated. High-affinity ligands like EGF or TGFα overcome these contacts readily to optimise the strength of the resulting (symmetric) EGFR dimer. By contrast, low-affinity ligands like EREG and EPGN cannot fully overcome these interactions, so induce only weak (asymmetric) dimers. This makes them partial agonists, stimulating responses with altered kinetics5 and thus biasing signalling as described for several receptor tyrosine kinases5,6. GBM mutations that disrupt domain I/II autoinhibitory interactions in EGFR (R84K, A265V, A265T, L38R and likely others) remove this distinction (and barrier), allowing EREG and other low-affinity ligands to induce strong EGFR dimers that resemble those formed with EGF and TGFα. Thus, GBM mutations appear to thwart EGFR’s ability to discriminate between its ligands.
Although EGFR is one of the most commonly altered genes in GBM2, its roles in GBM initiation and progression remain unclear. EGFR inhibition has not been a successful clinical strategy3. Moreover, aberrant forms of EGFR seen in GBM do not appear to be highly active. The common EGFR vIII variant is only weakly activated, and single amino acid substitutions seen in GBM do not promote strong ligand-independent activation – still requiring ligand for strong signalling21,22. Rather than simply activating EGFR to promote tumour development like EGFR mutations in lung cancer1, our data suggest that EGFR aberrations in GBM may also (or instead) alter the qualitative nature of EGFR signalling, as has been suggested for EGFR vIII23 – possibly signalling to the microenvironment to promote tumour growth24. EREG is known to promote cell differentiation through EGFR in multiple cell types5. One possibility is that GBM mutations cause EGFR-driven responses to EREG and other ligands to become more EGF-like, impairing the ability of these ligands to promote normal differentiation of progenitor cells, which could promote glioma25. Indeed, EGFR aberrations appear to occur early in GBM development26, and altered signalling could play a role in expanding a stem cell population27 to set the stage for GBM development28. Consistent with this, although over half of GBM patients have EGFR aberrations, analysis of TCGA data does not suggest significant differences in prognosis for these patients compared with those with normal EGFR (Extended Data Fig. 9)2.
Intriguingly, ECR mutations in the EGFR relative ErbB3 are also found in cancer29 – primarily in gastrointestinal tumours – and occur in the same domain I/II interaction region as EGFR GBM mutations. These mutations might selectively enhance ErbB3 heterodimerisation with EGFR or ErbB2 in response to certain ligands, biasing the complex network of ErbB receptor signalling to rebalance proliferation versus differentiation. Extracellular ErbB2 mutations may also influence heterodimerisation preferences and/or strength to influence signalling outcomes, as recently described for ErbB3/ErbB2 heterodimers stabilised by an oncogenic S310F ErbB2 mutation19. Our structural model for how such EGFR family mutations influence ligand discrimination and signalling has significant potential value for devising new targeted therapeutic approaches in situations where they promote disease.
METHODS
Protein Expression and Purification
DNA encoding the natural signal peptide and residues 1-501 of mature human EGFR, with a C-terminal hexahistidine tag, was subcloned into pFastbac1 (ThermoFisher Scientific) and recombinant baculovirus was generated using the Bac-to-Bac system. Q5 site-directed mutagenesis (New England BioLabs) was used to generate sEGFR variants harbouring extracellular mutations. Protein expression was induced by baculovirus infection of 6-8 litre cultures of Sf9 cells in ESF921 medium (Expression Systems) at a density of ~2 × 10⁶ cells/ml. Conditioned medium was harvested 3-4 days post-infection, concentrated ~5-fold using a 10 kDa Sartocon Slice ECO Hydrosart cassette (Sartorius), and diafiltered against 4 volumes of 10 mM HEPES, pH 8.0, containing 150 mM NaCl (buffer A). The sample was then loaded onto 3 ml bed volume of Ni-NTA resin (Qiagen) by gravity at 4°C. After extensive washing with buffer A containing 10 mM imidazole, sEGFR proteins were eluted using an imidazole gradient ranging from 25 to 300 mM. Proteins were buffer exchanged into 25 mM MES, pH 6.0 (buffer S), containing 50 mM NaCl and loaded onto a Fractogel SO3− cation exchange column (Millipore) that was subsequently developed using a gradient from 50 mM to 1 M NaCl in buffer S, eluting sEGFR with an isocratic pause at 240 mM NaCl (24 mS/cm). Fractions containing sEGFR were pooled, concentrated, and purified further using a Superose 6 10/300 GL (Cytiva Life Sciences) equilibrated in buffer A. Protein purity was assessed using Coomassie-stained SDS-PAGE. Epiregulin was produced exactly as described5, and human epidermal growth factor, TGFα, amphiregulin (AREG) and epigen (EPGN) were purchased (R&D Systems) and resuspended in buffer A.
Small-Angle X-ray Scattering
SAXS data were recorded at 4°C on a Rigaku BioSAXS-2000nano 2D Kratky block camera system with a Rigaku 007HF rotating anode source and a Rigaku HyPix-3000 HPAD CCD detector, with 90 min exposures using SAXLab Version 4.0.2 (Rigaku). Protein (sEGFR) concentration was ~4 mg/ml (70 μM) in buffer A. Ligands were added at a 1.2-fold molar excess (84 μM), such that >80% saturation of sEGFR with ligand should be reached in each case. Data were reduced, and matched buffers were subtracted using BioXTAS RAW Version 2.1.030 to yield the corrected scattering profile – in which intensity (I) is plotted as a function of q (q = 4πsinθ/λ, where 2θ is the scattering angle), and data were analysed using the ATSAS suite31, version 2.8.4. All samples were monodisperse as evidenced by linear Guinier regions in the Guinier plots shown in Fig. 2, in which the natural logarithm of the scattering intensity at angle q, I(q), normalised for mass concentration, is plotted against q2. Extrapolation to the y axis intercept allows estimation of I(0), or forward scatter, which is proportional to the weight-averaged molecular mass of molecules in a SAXS sample: ln I(q) = ln I(0) – (Rg2/3)q2, where Rg is the radius of gyration. For WT sEGFR (Fig. 2a), I(0) doubles upon EGF binding, representing dimerisation, but is unaffected by EREG – which fails to induce sEGFR dimers at this sEGFR concentration. Values for I(0) were calculated from the Guinier region, where q*Rg < 1.4, and normalised by mass concentration of receptor protein to give I(0)/c. Measured I(0)/c values were divided by the I(0)/c value obtained for unliganded (monomeric) sEGFR (collected on the same day) to give the fold-change in oligomeric state as described5,32. I(0)/c is proportional to the weight-averaged molecular mass of molecules in a solution scattering sample32. All SAXS experiments were repeated at least 3 times with different protein preparations.
Covalent Crosslinking
Purified sEGFR proteins (5 μM) were incubated without ligand, or with either 6 μM or 60 μM ligand (EGF, EREG, AREG, or EPGN) in buffer A. Crosslinking was performed using disuccinimidyl suberate (DSS) at 100 μM (ThermoFisher Scientific) for 30 min at room temperature, in parallel with untreated controls (lacking DSS) in Extended Data Fig. 2b. In each case, after crosslinking. an aliquot (20 μl) was mixed with 4X Pierce™ LDS sample buffer (ThermoFisher Scientific) containing 50 μM DTT, boiled for 2 min, and analyzed by SDS-PAGE (4-12%) with Coomassie Blue staining. Gel images were collected using a GelDoc-EZ imager (Bio-Rad), running Image Lab Version 5.2.1. Images were quantitated using ImageJ Version 1.53m (Extended Data Fig. 2c).
Crystallography
Crystals of sEGFR variants bound to epiregulin (EREG) were obtained using the hanging-drop method, mixing equal volumes of protein and reservoir solution and equilibrating this over reservoir solution at 21°C. For EREG:sEGFRR84K crystals, a mixture of sEGFRR84K (~8 mg/ml) and EREG (1.2-fold molar excess) was diluted 1:1 with reservoir solution containing 100 mM HEPES (pH 7.5), 12% PEG3350, with 3% (w/v) D-(+)-trehalose dihydrate. Crystals appeared within 3 days, and were cryoprotected in 100 mM HEPES (pH 7.5), 12% PEG3350, 7% glycerol, and 7% ethylene glycol. For EREG:sEGFRA265V crystals, a mixture of sEGFRA265V (~8 mg/ml) and EREG (1.2-fold molar excess) was diluted 1:1 with reservoir solution containing 1% w/v tryptone, 1 mM sodium azide, 50 mM HEPES (pH 7.0), 20% PEG3350. Crystals appeared within 3 days, and were cryoprotected in 100 mM HEPES (pH 7.5), 16% PEG3350, 7% glycerol, and 7% ethylene glycol.
Crystals of EREG-bound sEGFRR84K diffracted to 2.9 Å resolution at the Advanced Photon Source (APS) GM/CA @ APS beamline, 23ID-B, and belonged to space group P212121 (Extended Data Table 1). The asymmetric unit contained one 2:2 EREG:sEGFRR84K dimer and 53% solvent. Similar crystals were also obtained using 10 mM spermine tetrahydrochloride instead of trehalose as additive that diffracted to 3.2 Å (PDB ID 7LFR) and gave the same conclusions (main chain atom root-mean-square deviation was 0.5 Å between the two structures). Crystals of EREG-bound sEGFRA265V diffracted to 3.5 Å resolution at GM/CA @ APS, and belonged to space group P21 – with two 2:2 EREG:sEGFRA265V dimers per asymmetric unit and 52% solvent. The two EREG:sEGFRA265V dimers overlay with a main chain atom root-mean-square deviation of 1.4 Å after refinement. Figures were generated with the B and C receptor chains (bound to ligand chains G and F respectively).
Datasets (collected at a wavelength of 1.033 Å) were integrated using XDS33 (Version 20200417), and scaled using SCALA (Version 3.3.22) from the CCP4 program suite34 (Version 7.1). Structures were solved by molecular replacement with Phaser35 (Version 2.8.3), using the EGFR chains from an EREG-induced sEGFRWT dimer (PDB: 5WB7)5 as search model. The resulting maps showed clear electron density for ligand in each binding site. Cycles of model building using Coot36 were alternated with rounds of refinement in Buster37, Refmac34 or Phenix38 (Version 1.18.2_3874), employing composite omit maps also generated using Phenix. TLS refinement39 was employed in later stages, with anisotropic motion tensors refined for each of the receptor domains and ligand molecules. Final structures were refined using Phenix and validated with the MolProbity40 and wwPDB servers. Analysis of Ramachandran statistics for the final EREG:sEGFRR84K model showed 93.3%, 6.3%, and 0.5% of residues in favoured, allowed and disallowed regions respectively. For the EREG:sEGFRA265V, the corresponding numbers were 93.8%, 6.0% and 0.2%.
Sedimentation Equilibrium Analytical Ultracentrifugation (SE-AUC)
Ligand-induced dimerisation of TGFα-bound sEGFR variants was analyzed in SE-AUC experiments using an XL-I analytical ultracentrifuge (Beckman) exactly as described41, run using ProteomeLab XL-A/XL-I (Version 6.2). Samples (at 2, 5, and 10 μM) of wild-type or mutated sEGFR in buffer A were analyzed both in the presence and in the absence of a 1.2-fold molar excess of TGFα, used (rather than EGF) because it contributes very little to absorbance at 280 nm, having just one tyrosine and no tryptophans. Radial A280 data were collected at 20°C with speeds of 6,000, 9,000, and 12,000 rpm using an An-Ti 60 rotor. The resulting nine datasets (three concentrations at three speeds) were fit to a model describing simple dimerisation of a 1:1 sEGFR/TGFα complex, assuming that all sEGFR was saturated with TGFα and that TGFα does not contribute significantly to A280:
where Ar is the absorbance at radius r, A0 is the absorbance at the reference radius r0, M is the molecular weight of the 1:1 sEGFR/TGFα complex (the sum of the measured monomeric sEGFR and TGFα molecular weights), H is the constant [(1 – ∇ρ)ω2]/2RT, ∇ is the partial specific volume (estimated at 0.71 ml/g), ρ is the solvent density (1.003 g/ml), ω is the angular velocity of the rotor (radians/sec), R is the gas constant, T is the absolute temperature, and KA is the fitted parameter corresponding to the equilibrium constant for dimerisation of the 1:1 sEGFR/TGFα complex. The fitted KA value is converted to the dissociation constant KD (KD = 1/KA) reported in Extended Data Fig. 4a using the calculated extinction coefficient for the 1:1 sEGFR/TGFα complex. At least three independent groups of experiments were performed (except with L38R) and fit for each mutated protein. Estimated KD values are quoted the mean ± standard deviation of estimates from individual experiments. Data fitting used HeteroAnalysis (Version 1.1.0.58), from the U. Conn Biophysics Facility.
Surface Plasmon Resonance (SPR)
SPR analysis of ligand binding was performed using a Biacore 3000 instrument exactly as described42. EREG was immobilised on a CM5 sensorchip (Cytiva Life Sciences) using amine coupling, to a final level of ~2,500 Response Units. Purified sEGFR variants were injected onto the sensorchip at a variety of concentrations at 5 μl/min for 8 min (sufficient for binding to reach steady state) in degassed 10 mM HEPES (pH 7.4), 150 mM NaCl, 3 mM EDTA and 0.005% Surfactant P-20 at room temperature. Between injections, the sensorchip surface was regenerated using a 20 μl injection of 10 mM sodium acetate (pH 5.0) containing 1 M NaCl. The final steady-state signal was background-corrected by subtracting the signal obtained with a control surface. To estimate receptor/ligand affinities, steady state SPR signal values were plotted against [sEGFR] and fit to a simple single-site saturation-binding model.
Cell signalling and proliferation studies
Fully-haploid engineered HAP1 (eHAP) human cells43 were obtained from Horizon (now Perkin Elmer), and were cultured in complete IMDM medium (ThermoFisher # 12440-053) containing 10% FBS and 100 U/ml penicillin, with 100 μg/ml streptomycin. IL-3 dependent murine Ba/F3 cells (from DSMZ) were cultured in RPMI 1640 (LifeTech 11875-093) supplemented with 10% FBS, 1 mM pyruvate, 10 mM HEPES, 1 ng/ml IL-3 (PeproTech #213-13) and PenStrep. Transfections of full-length human EGFR (wild-type or noted variants) into Ba/F3 or eHAP cells were performed by electroporation using a Nucleofector 2b device (Lonza) as described previously44. Transfected cells were selected for 2 weeks in G418-containing medium. Expression levels of EGFR variants in eHAP cells were confirmed by Western blotting using anti-EGFR (R&D AF231, 1:1000). Stably transfected Ba/F3 cells were sorted by flow cytometry to select cells with similar expression levels of wild-type or mutated EGFR, using phycoerythrin (PE)-conjugated mouse anti-human EGFR (BD Pharmingen #555997), at 1:4 dilution on a FACS Melody flow cytometer (BD Biosciences). Cell lines were not authenticated, but were routinely checked for mycoplasma contamination.
For cell signalling studies, eHAP or MCF-7 cells were serum-starved overnight and either left unstimulated or stimulated with the noted concentrations of EGF or EREG for 5 min (dose-dependence studies in Fig. 1b-d and Extended Data Fig. 1c), with a fixed 100 ng/ml EGF for the indicated time intervals (Extended Data Fig. 1a), or with 1 μM AREG or 16 nM EGF (Extended Data Fig. 3). Total cell lysates were prepared and analyzed by Western blotting as described previously44. Primary antibodies were all used at a 1:1000 dilution as follows: for phosphorylated EGFR (pY845: CST#2231; pY1068: CST#3777; pY1173: CST#4407), total EGFR (R&D AF231), and ERK1/2 (pT202/pY204: CST #9106; total ERK: CST#4696). Secondary antibodies were horse anti-mouse IgG horseradish peroxidase (HRP)-linked antibody (CST #7076) used at 1:10,000 dilution, WestVision anti-rabbit IgG (H+L) HRP polymer (Vector Labs WB-1000) used at 1:10,000, and rabbit anti-goat IgG conjugated to HRP (R&D HAF017) used at 1:1000 dilution. Chemiluminescence signals were detected using SuperSignal West Pico Chemiluminescent Substrate (ThermoFisher Scientific), visualised and quantitated using a Kodak Image Station 440CF (Kodak Scientific). Blotting for Grb2 (CST #3972, 1:1000) was used as a loading control as described45.
For Ba/F3 cell proliferation studies, cells were plated in triplicate in 96-well flat bottom plates in starvation medium without FBS or IL-3. Cells were either left untreated or were stimulated with ligand as noted for 72 h. For dose-dependence studies, varying concentrations of EGF or EREG were used as noted in Extended Data Fig. 1d. Viable cell numbers were detected with the CyQuant Direct assay (Invitrogen #C35011) measuring fluorescence signals (excitation 485 nm, emission 528 nm) using a BioTek Synergy 2 plate reader.
Overall survival analysis of GBM patients
The molecular profile and overall survival data of glioblastoma patients were downloaded from cBioPortal (www.cbioportal.org)46. The patient cohort was built based on two glioblastoma cohorts (study ID: gbm_tcga_pub2013 and gbm_tcga_pan_can_atlas_2018). Glioblastoma patients were divided into various groups according to their EGFR alteration profiles and overall survivals were compared among these patients. To compare pairwise survival differences, two-sided log-rank tests were implemented to evaluate the Kaplan-Meier curves, with no corrections made for multiple comparisons. R packages including data.table, dplyr, survimer, survival, and ggplot2 were used in the survival analysis47.
Reporting summary
Further information on research design is available in the Nature Research Reporting Summary linked to this paper.
Data availability
Atomic coordinates and structure factors for the refined structural models described in this paper have been deposited in the Protein Data Bank (PDB) under accession codes 7LEN (EREG:sEGFRR84K, crystallized with trehalose), 7LFR (EREG:sEGFRR84K, crystallized with spermine) and 7LFS (EREG:sEGFRA265V). Source data are provided with this paper.
Extended Data
Extended Data Fig. 1. Ligand-dependence of GBM-mutated EGFR.
a. Full-length human EGFR – WT or harbouring an R84K, T239P or A265V mutation – was stably expressed in the engineered haploid eHAP cell line43, which has negligible endogenous EGFR (undetectable by Western blotting). Stably transfected cells were serum-starved overnight and either left unstimulated or stimulated with EGF (100 ng/ml) for the indicated times. Levels of phosphorylated EGFR (pY845: CST #2231, used at 1:1000) and ERK1/2 (pT202/pY204: CST #9106, used at 1:1000), were then detected by immunoblotting of whole cell lysates, also blotting for total EGFR and ERK (see Methods) and Grb2 as loading control5,45. EGFR phosphorylation and ERK phosphorylation are both ligand-dependent in all cases, with no evidence for constitutive activation of the mutated receptors. Representative blots are shown for 3 biologically independent experiments. See Supplementary Figure 1 for gel source data.
b. IL-3-dependent Ba/F3 cells were stably transfected with WT EGFR or with variants harbouring an R84K or A265V mutation. Cells were either left untreated or were treated with IL-3 (2 ng/ml) for 72 h, after which a CyQuant Direct proliferation assay was used to detect the number of viable cells in each condition. Resulting fluorescence signals were normalised to that seen with untreated WT and shown as mean ± SD (n = 3 experiments for ‘test’ samples). IL-3 treatment promotes robust proliferation in all cases (as positive control: n = 3 for WT, n = 2 for R84K and A265V). As previously reported12,13,48, the mutated EGFRs promoted statistically significant increases in viable cell numbers compared with WT EGFR in the absence of ligand (or IL-3), but effects were very small at these expression levels – with the number of viable cells increased (compared with WT) by just 1.31-fold (p = 0.0002) for R84K and 1.35-fold for A265V (p = 0.0003). p values are for unpaired two-tailed Student’s t-tests.
c. Chemiluminescence signals for phosphorylated EGFR in ligand dose-response experiments (see Figs. 1b and c) were quantitated and normalised for Grb2 signals either on different gels as sample processing controls (for gel source data, see Supplementary Figure 1) or for Grb2 loaded on the same gel using the Multistrip Western Blotting approach45, with both giving identical results. The resulting pEGFR/Grb2 ratios were plotted (mean ± SD, n = 3 biologically independent experiments) here and in Fig. 1d as dose-response curves. Responses were normalised to 100% (maximum value) and 0% (without ligand) and the resulting curves were individually fit to a simple model: pEGFR = (100 x [ligand])/(EC50 + [ligand]) for each experiment. Mean EC50 values (± SD) are listed in Fig. 1d.
d. Ba/F3 cells stably transfected with WT EGFR or variants harbouring R84K or A265V mutations were sorted by flow cytometry (see Methods) to yield cell populations with similar levels of cell surface EGFR. Cells were either left untreated or were treated with noted doses of EGF or EREG for 72 h. A CyQuant Direct proliferation assay was used to measure the number of viable cells in each condition. Results were divided by the signal from untreated cells to give ‘fold increase’ in cell number, and are plotted across all experiments (mean ± SD, n = 3 biologically independent experiments). EC50 values for each ligand were calculated individually for each experiment using the equation: cell# = (max x [ligand])/(EC50 + [ligand]), and mean values (n = 3) are listed (± SD) on the graphs. EC50 values for EGF and EREG are not significantly different for R84K (p = 0.2072) or A265V (p = 0.7915), reflecting loss of ligand discrimination. p values are for unpaired two-tailed Student’s t-tests.
Extended Data Fig. 2. Cross-linking studies of ligand-induced sEGFR dimerisation.
a. Quantitation and summary of SAXS I(0)/c measurements reported in Fig. 2 across multiple repeats. For sEGFRWT, only EGF (black) doubles the I(0) value, representing selective EGF-induced dimerisation. By contrast, both EREG (magenta) and EGF (black) induce dimerisation of sEGFR harbouring L38R (red), R84K (green), A265V (blue) or A265T (gold) mutations – with EREG-induced dimerisation of A265 variants appearing slightly less robust. Data represent mean I(0)/c ± SD for 10 repeats (WT + EGF), 6 repeats (WT + EREG), 4 repeats (A265V + EGF and A265V + EREG), 3 repeats (L38R + EREG, R84K + EGF, R84K + EREG, A265T + EGF, A265T + EREG), and 2 repeats (L38R + EGF) – where a repeat corresponds to a biologically independent sample. An additional single experiment was undertaken for T239P + EREG, which showed an elevation of I(0)/c by 1.44 fold. The degree of sEGFR dimerisation for EGF and EREG is significantly different only for WT (p < 0.0001) and A265T (p < 0.0001). p values are from unpaired two-tailed Student’s t-tests.
We estimate based on the SAXS data in Figs. 2a-e that the GBM mutations studied here strengthen dimerisation of EREG-bound sEGFR by several hundred fold based on the following considerations. Since sEGFRWT at 70 μM shows no dimerisation when saturated with EREG, the dissociation constant (KD) for dimers of the EREG:sEGFR complex must be >450 μM (assuming that we could detect a minimum of 10% dimer by SAXS). By contrast, the complete dimerisation seen for the EREG:sEGFR complex with mutated variants (when corrected for differences in ligand-binding affinities) places a lower limit of ~0.7 μM on KD for these dimers. Thus, GBM mutations must enhance dimerisation of the EREG:sEGFR complex by at least ~650-fold.
b. Representative crosslinking analysis of sEGFR dimerisation (n = 3 biologically independent samples for each mutated variant). Different sEGFR variants at 5 μM were incubated alone or with the noted ligand (EGF or EREG) at 6 μM, and subjected to 100 μM DSS for 30 min (see Methods). Samples were then subjected to SDS-PAGE and stained with Coomassie Blue. Dimer and monomer bands are marked (note the shift in monomer band position following ligand cross-linking). EGF promotes dimerisation of all variants. EREG fails to increase sEGFRWT dimerisation above that seen without ligand, but detectably enhances dimerisation of all variants with GBM mutations, consistent with the SAXS data shown in Fig. 2. See Supplementary Figure 1 for gel source data, and (c) for quantitation and reproducibility information.
c. Quantitation of data in (b), including additional repeats for each variant. For sEGFRWT, EGF induces substantially more dimerisation than EREG (p < 0.0001), whereas the difference between EGF and EREG is not significant for L38R (p = 0.0522) or A265T (p = 0.0577), and only just reaches statistical significance for R84K (p = 0.0410) and A265V (p = 0.0377). p values are for unpaired two-tailed Student’s t-tests. Data in the graph represent mean ± SD for 6 repeats (WT + EGF and WT + EREG), or 3 repeats (A265V + EGF, A265V + EREG, R84K + EGF, R84K + EREG, A265T + EGF, A265T + EREG, L38R + EGF, and L38R + EREG), where repeats refer to biologically independent samples.
d. Top panel: WT and R84K-sEGFR (5 μM) were crosslinked alone or with the noted ligands (EGF, AREG EREG, or EPGN) at 6 μM. Middle panel: as in Top panel, but with 60 μM ligand. Bottom panel: Crosslinking studies were performed with 60 μM ligand added to sEGFRWT and 6 μM added to sEGFRR84K, to account for affinity differences. Data are representative of three biologically independent samples. See Supplementary Figure 1 for gel source data.
e. As for (d), but using sEGFRA265V with 6 μM or 60 μM ligand as marked, for 5 biologically independent samples of sEGFRA265V with EGF and EREG, but n = 2 for AREG and EPGN. See Supplementary Figure 1 for gel source data.
Extended Data Fig. 3. Kinetics of EGFR and ERK activation by AREG (98aa) and EGF in MCF7 cells.
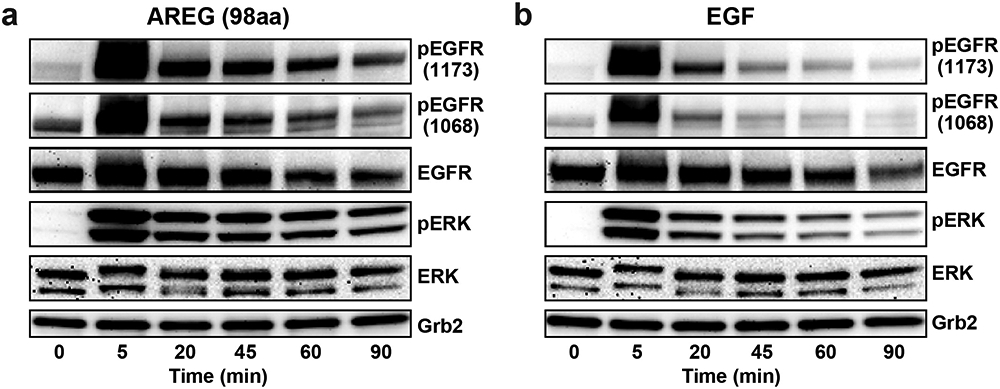
Representative time courses (of 3 biologically independent repeats with similar results in each case) of EGFR phosphorylation at Y1173 and Y1068, as well as ERK phosphorylation, in parental MCF-7 cells induced by saturating levels of (a) AREG (1 μM) or (b) EGF (16 nM), exactly as described5. Cells were starved overnight, and were then left unstimulated or stimulated with ligand for the noted times at 37°C, using growth factor ligands added to starvation medium. Analysis by immunoblotting was then performed exactly as described5,44. Note that the commercially available 98aa form of AREG used here appears to elicit sustained signalling and weak dimerisation of sEGFR in these studies – consistent with other work6. We previously reported that a shorter in-house-produced 90aa form of AREG induces more transient (EGF-like) signalling and stronger sEGFR dimerisation5. Different signalling properties of AREG forms with different carboxy termini have been reported by others49-51, and will be the subject of separate detailed studies. See Supplementary Figure 1 for gel source data.
Extended Data Fig. 4. SE-AUC studies of TGFα-induced sEGFR dimerization.
a. The noted sEGFR variants were subjected to sedimentation equilibrium analytical ultracentrifugation (SE-AUC) as described in Methods, with or without adding a 1.2-fold excess of TGFα. The low UV absorbance of TGFα allows precise quantitation of TGFα-induced sEGFR dimerisation using SE-AUC as described41. Representative data are shown (n = 3 biologically independent samples) for 10 μM sEGFR at 6,000 rpm, with the natural logarithm of the absorbance, ln(A280), at radial distance r plotted against (r2 – r02)/2. This transformation of the data gives a straight line for a single species, with slope proportional to molecular weight. Expected data for pure monomer and pure sEGFR:TGFα dimer are shown as dotted and solid grey lines (marked). Data points are colour coded for the different variants as described in the key, with filled circles representing data with added ligand and open circles without. No dimerisation was seen in the absence of ligand for any variant under these conditions, consistent with the SAXS studies shown in Fig. 2 and our previous work52. KD values for each sEGFR:TGFα complex are listed below the graph, determined by global fit of SE-AUC data as described previously41 and in Methods. Mean values ± S.D. from 3 biologically independent samples are reported for all cases except L38R (where n = 1). Whereas sEGFRR84K dimerises with essentially the same KD as sEGFRWT following TGFα binding, sEGFRA265V and sEGFRA265T dimerise slightly more weakly (p = 0.006 and 0.005 respectively, for unpaired two-tailed Student’s t-tests).
b. Effects on ligand-dependent dimerisation also appear specific for GBM extracellular mutations. A rare extracellular EGFR lung cancer mutation (M253E)53, not seen in GBM, instead enhances both ligand-independent (confirmed by crosslinking) and ligand-induced sEGFR dimerisation. SE-AUC analysis of sEGFR harbouring the M253E mutation is shown. Unlike GBM variants, M253E-mutated sEGFR dimerises constitutively, being substantially dimeric in the absence of ligand. TGFα-bound M253E sEGFR also appears to form species larger than dimers, with an estimated KD in the range of 0.33 μM. M253E-mutated sEGFR was used at 10 μM, and the sample was spun at 6,000 rpm. This experiment has only been done with one biologically independent sample of sEGFRM253E (in triplicate with- and without TGFα), as the protein is difficult to produce in sufficient quantities.
Extended Data Fig. 5. Symmetry of the EREG-induced sEGFRR84K dimer and implications for negative cooperativity in EGFR.
a. Overlay of the EREG-induced sEGFRR84K dimer (dark green ribbons) with the symmetric dimers of sEGFRWT induced by TGFα (1MOX15, gold ribbons) or EGF (3NJP14,17, grey ribbons). EREG, TGFα and EGF are coloured magenta, orange, and black respectively.
b. Schematic of half-of-the-sites negative cooperativity in ligand binding to WT EGFR20,54,55 for any ligand (blue). As we previously described in detail for the Drosophila EGFR20, and as also seems to apply to human EGFR54, binding of a single ligand can promote formation of asymmetric sEGFR dimers (left-hand side of cartoon) with autoinhibitory domain I/II interactions broken (open red star) only in one protomer. This asymmetric dimerisation is driven by contacts involving N-terminal regions of domain II as well as altered dimer arm docking5,20 – together restraining domain II in the unliganded protomer. When a second ligand binds to this dimer, it must ‘wedge’ apart the two ligand-binding domains (I and III) in the right-hand protomer to drive formation of the symmetric dimer (top right in cartoon). This requires disruption of autoinhibitory domain I/II interactions in both molecules (both red stars are open). It also requires disruption of domain II dimer interface contacts – with a resulting bend in domain II (Extended Data Fig. 6d) – giving rise to the symmetric 2:2 dimer. This is readily achieved by high-affinity ligands such as EGF and TGFα, but low-affinity EGFR ligands like EREG56 cannot disrupt the autoinhibitory domain I/II interactions or bend the restrained domain II to optimise dimer arm contacts. As a consequence, low-affinity ligands fail to wedge apart domains I and III in the right-hand protomer – instead binding to an unaltered asymmetric dimer (lower right in cartoon) through a compromised set of ligand/receptor interactions (i.e. a remodeled binding site5: see Extended Data Fig. 8d). The R84K mutation lowers this barrier to dimer ‘symmetrisation’ by weakening autoinhibitory domain I/II interactions so that the second ligand-binding event more readily bends domain II and symmetrises dimers. This appears to be the origin of the R84K mutation’s ability to selectively stabilise dimers induced by low-affinity EGFR ligands. Weakening of autoinhibitory domain I/II interactions may also explain the enhanced ligand-binding affinity seen for R84K EGFR (Extended Data Fig. 7b). The ability of the R84K mutation to equalise the two EREG-binding sites in a dimer, and to increase EREG affinity also argues that this mutation removes a barrier to ligand binding, and may diminish the half-of-the-sites negative cooperativity seen in wild-type EGFR20,54,57,58.
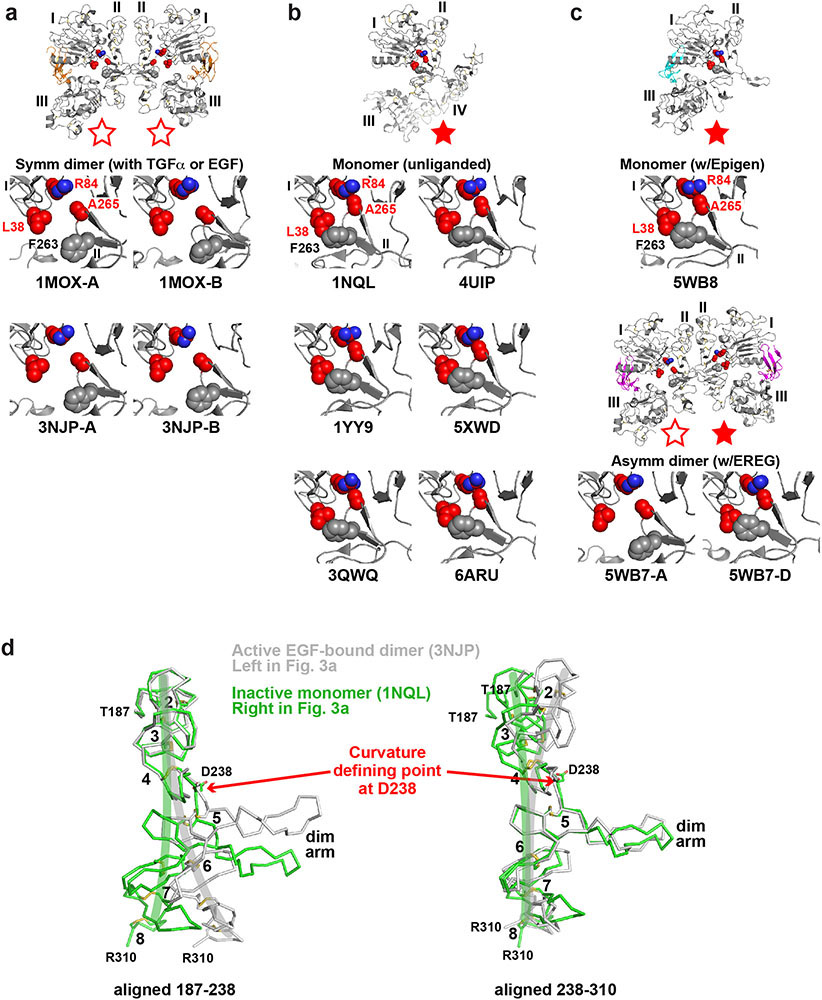
Extended Data Fig. 6. Autoinhibitory domain I/II interactions in different sEGFR structures.
a. As expected for autoinhibitory interactions, R84/A265 and L38/F263 interactions are broken in ‘active’ symmetric dimers of sEGFR induced upon activation with TGFα (1MOX15) or EGF (3NJP14,17). This configuration is represented by open red stars, as in Fig. 3.
b. Disposition of key GBM-mutated residues (L38, R84 and A265, coloured red) for comparison in ‘inactive’ configurations of the EGFR extracellular region. The positions of these side-chains are shown in monomeric tethered forms of sEGFR59-63. In each case, the R84 side-chain directly contacts that of A265, and the L38 side-chain is in van der Waal’s contact with that of F263 (grey spheres: not mutated in GBM). These represent autoinhibitory interactions between domains I and II as described in the text and pointed out in our previous studies64. This configuration is represented as a filled red star.
c. Importantly, the autoinhibitory R84/A265 and L38/F263 interactions are also retained in the ligand-bound monomer seen observed when EPGN binds to sEGFRWT (5WB85). Moreover, as shown in the lower two panels, these autoinhibitory interactions are retained in the right-hand molecule of the asymmetric EREG-induced dimer of sEGFRWT (5WB7: Fig. 3a) – see filled red star – but are lost in the left-hand molecule (open red star).
d. Comparison of the ‘bend’ in domain II in inactive monomeric forms of sEGFR (light green) and active dimeric forms (grey) – colours corresponding to those used for sEGFR chains in Fig. 3a. The structures of unliganded monomeric sEGFR (PDBID: 1NQL59) and an EGF-induced WT sEGFR dimer (PDBID: 3NJP14) were used. Only residues 187-310 of domain II are shown. In the left-hand panel, the two structures are overlaid using residues 187-238 as reference. In the right-hand panel, residues 238-310 are used as reference. This analysis reveals that the two structures differ by a bend at residue D238 (marked as ‘Curvature defining point’). The approximate direction of curvature is shown by green and grey brush strokes on each structure. The dimer arm is labelled, as are disulphide-bonded modules 2-8 of domain II59. This figure is based on one by Ferguson16.
Extended Data Fig. 7. Similarity of the two ligand-binding sites in EREG-induced sEGFRR84K dimers.
a. Comparison of the two EREG-binding sites in the symmetric dimer of R84K-mutated sEGFR dimer, overlaid by superposition of the ligand chains. Chain A of sEGFRR84K (left in Fig. 3b) is shown in grey ribbons, and chain B (right in Fig. 3b) is shown in dark green ribbons – with the respective bound ligands coloured pink and magenta. Side-chains involved in direct EREG/sEGFR contacts are shown and labelled. Those in the ligands superimpose very well (see Y13, H16, M25, Y29, for example), with a few exceptions (e.g. R31 and F45). Similarly, sEGFR side-chains in the binding sites overlay well, including D22, R29, Y45, E90 and S99 in domain I and D355, L348, F357, and H409 in domain III. Accordingly, the rmsd for all atoms in the 56 residues involved in ligand/receptor contacts (35 from sEGFR, 21 from EREG) is 1.4 Å.
b. Comparison of EREG binding to different sEGFR variants as assessed using SPR (see Methods). Representative binding curves for one biological replicate are plotted on the left (n = 3 for WT, L38R, R84K, and n = 2 for A265V and A265T). The WT sEGFR construct used in these studies bound to immobilised EREG in SPR studies with a KD value of 6.6 ± 0.6 μM (n = 3 biologically independent samples; mean ± SD). GBM mutations in domain I increased ligand-binding affinity by ~6 fold for L38R (p < 0.0001: n = 3) and almost 10-fold for R84K (p < 0.0001: n = 3), with KD values respectively of 1.1 ± 0.4 μM and 0.7 ± 0.2 μM. Domain II GBM mutations increased ligand-binding affinity by 4.2-fold for A265V (n = 2) and just ~2-fold for A265T (n = 2), with KD values respectively of 1.6 and 3.1 μM respectively (no SD is quoted for n = 2). These smaller differences are consistent with the asymmetry retained in the A265V ligand binding sites. p values where quoted are for unpaired two-tailed Student’s t-tests.
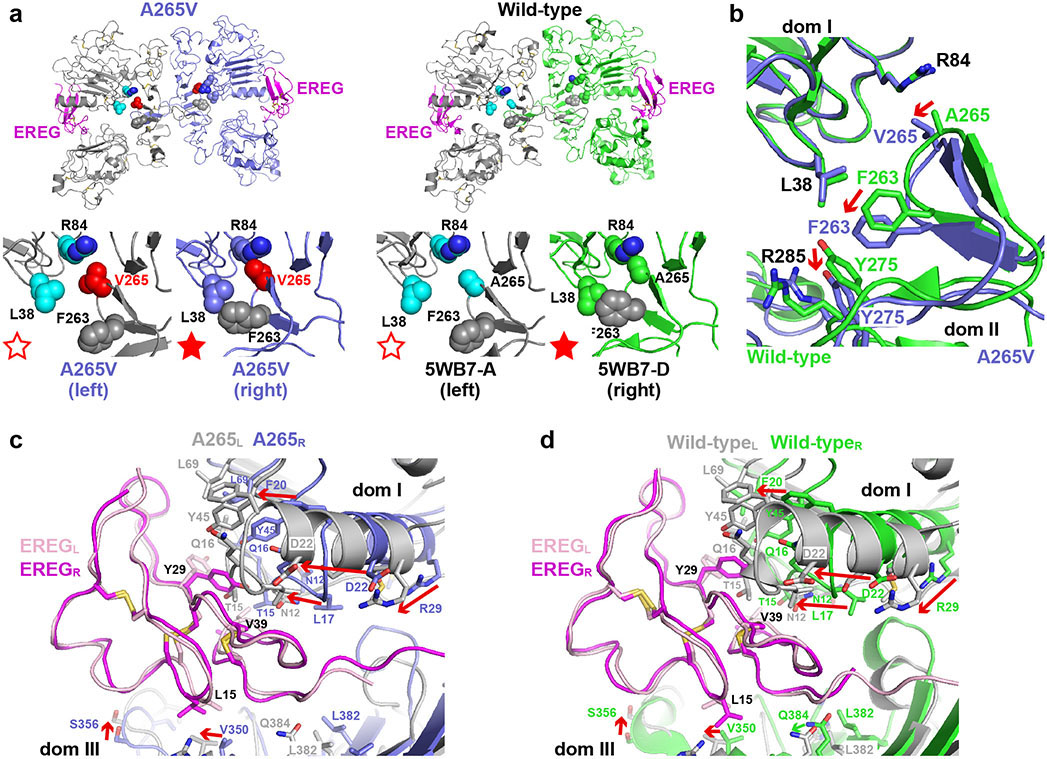
Extended Data Fig. 8. Structural features of the asymmetric dimer of sEGFRA265V induced by EREG.
a. The asymmetric A265V-mutated (left) and WT (right) sEGFR dimers induced by EREG are compared, with disposition of the autoinhibitory domain I/II residues shown in the lower panels. Colours parallel those used in Figs. 3 and 4, with the right-hand molecule coloured slate blue for A265V and light green for WT sEGFR. Side-chain contacts between residues at positions 38 and 263 and between residues 84 and 265 are retained in the right molecule (filled red star) but not the left (open red star) in each case. V265, corresponding to the GBM substitution (A265V), is coloured red.
b. Local structural consequences of the A265V mutation in the domain I/II interface region of EREG-induced sEGFR dimers. The right-hand side of the EREG-bound WT and A265V-mutated sEGFR structures shown in (a) are superimposed using domain I as reference, with WT sEGFR shown in light green and A265V sEGFR in slate blue. Replacing A265 with a valine displaces the Cα position for residue 265 by ~1.2 Å (red arrow), and this is propagated to a shift in position of F263 by ~2.5 Å (red arrow). As a result of consequent small displacements in domain II constituents beyond this position, the locations of Y275 and R285 – which provide the docking side for the dimer arm Y251 residue in Fig. 4b – are altered, allowing remodeling of this binding site to enhance dimerisation strength as described in the text.
c.-d. Comparison of the binding sites on the two sides of the EREG-induced dimer for A265V-mutated sEGFR (c) and WT sEGFR (d), illustrating that the differences seen between the two sites in the asymmetric WT dimer5 are retained in the A265V variant despite stronger dimerisation and slightly stronger ligand binding. The regions corresponding to the two ligand-binding sites are superimposed with EREG as the reference. The left-hand molecule is coloured grey in each case, and the right-hand molecule slate blue in (c) for A265V and light green in (d) for WT. The pink ligand is bound to the left-hand (grey) sEGFR molecule, and the magenta ligand is bound to the right-hand sEGFR molecule. For clarity, ligand side-chains that are not substantially different in orientation are omitted – the exceptions being L15, Y29, and V39, which are consistently reoriented between the two sites. Contact side-chains in the receptor are shown, illustrating their substantial displacement with respect to the ligand in the two sites, with a contact residue RMSD between the two sites of 3.0 Å in both A265V and WT (compared with 1.4 Å for the two sites in EREG-bound R84K). Examples include the ~10 Å displacement of D22 and R29, and ~7 Å displacements of L17 and F20 that are marked by red arrows in domain I. These changes are essentially the same in A265V and WT. Shifts in domain III are generally smaller, but are essentially the same in A265V and WT sEGFR. Thus, the compromised binding to the right-hand molecule previously reported5 is fully retained in the A265V variant despite stronger dimerisation.
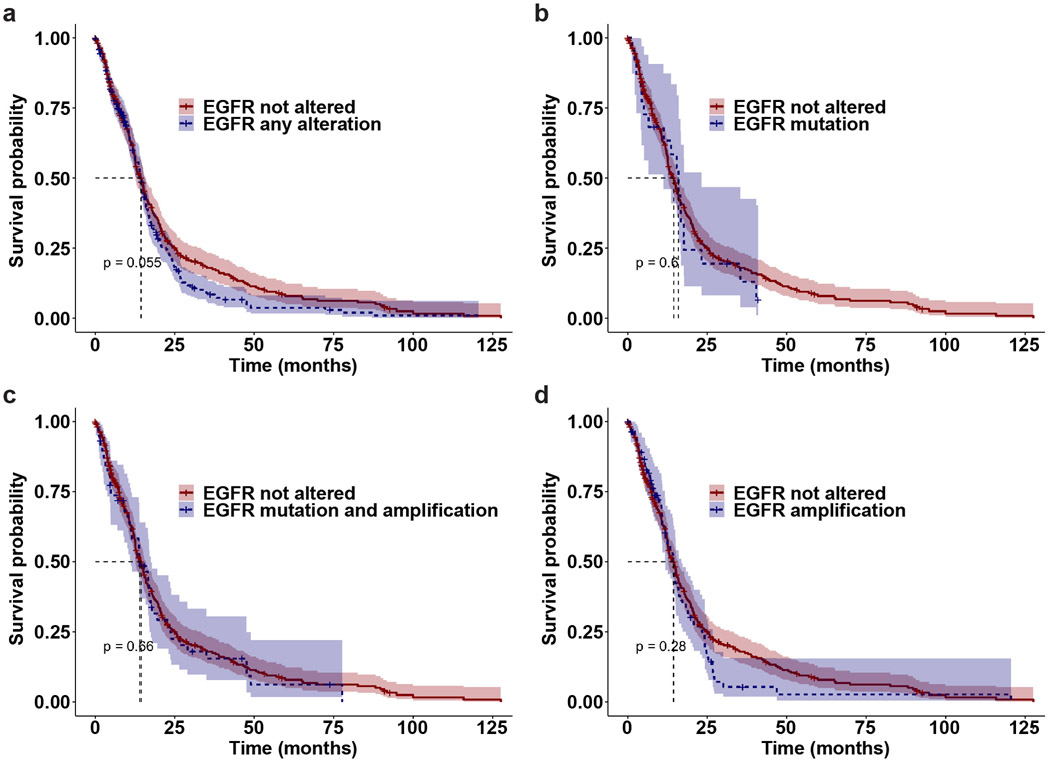
Extended Data Fig. 9. Kaplan-Meier estimates of overall survival in glioblastoma patients with different EGFR status from the TCGA database.
Two-sided log-rank tests were performed to assess the overall survival differences between different patient groups, with no corrections made for multiple pairwise comparisons. Patients with no EGFR alteration (n = 322 patients; red line) had median overall survival times of 14.4 months (95% CI, 12.7-15.8), which was not statistically significantly different from:
a. Patients with any EGFR alteration (n = 270 patients; blue dashed line), who had median overall survival times of 14.3 months (95% CI, 13.3-15.6), p = 0.06.
b. Patients with an EGFR mutation (n = 22 patients; blue dashed line), who had median overall survival times of 15.9 months (95% CI, 11.3-23.2), p = 0.6.
c. Patients with an EGFR mutation and EGFR amplification (n = 58 patients; blue dashed line), who had median overall survival times of 13.9 months (95% CI, 11.2-17.5), p = 0.66.
d. Patients with EGFR amplification (n = 85 patients; blue dashed line), who had median overall survival times of 14.3 months (95% CI, 11.8-16.8), p = 0.28.
Extended Data Table 1.
Data collection and refinement statistics
| sEGFRR84K-epiregulin PDB: 7LEN |
sEGFRA265V-epiregulin PDB: 7LFS |
|
|---|---|---|
| Data collection a | ||
| Space group | P 21 21 21 | P2i |
| Cell dimensions | ||
| a, b, c (A) | 77.74, 86.60, 197.79 | 77.97, 201.33, 92.15 |
| α, β, γ (°) | 90.00, 90.00, 90.00 | 90.00, 99.04, 90.00 |
| Resolution (Å) | 50.0 – 2.9 (3.1 – 2.9)b | 50.0 – 3.5 (3.7 – 3.5) |
| R sym | 0.134 (1.35) | 0.075 (1.20) |
| I / σ/ | 10.9 (1.3) | 8.4 (1.1) |
| CC1/2 c | 0.489 | 0.473 |
| Completeness (%) | 99.8 (99.0) | 99.2 (97.0) |
| Redundancy | 6.7 (6.5) | 3.5 (3.6) |
| Refinement | ||
| Resolution (Å) | 43.48 – 2.90 | 48.06 – 3.50 |
| No. reflections | 30250 (2683) | 35030 (2789) |
| Rwork / Rfree | 0.237/0.295 | 0.266/0.315 |
| No. atoms | ||
| Protein | 8423 | 16443 |
| B-factors | ||
| Protein | 82.0 | 99.0 |
| R.m.s. deviations | ||
| Bond lengths (Å) | 0.007 | 0.002 |
| Bond angles (°) | 1.164 | 0.546 |
Each dataset was collected from a single crystal.
Values in parentheses are for highest-resolution shell.
CC1/2 reported for the highest-resolution shell.
Supplementary Material
ACKNOWLEDGEMENTS
We thank members of the Lemmon and Ferguson laboratories for discussions and comments on the manuscript. This work was supported by NCI grant R01-CA198164 (to M.A.L. and K.M.F.). Crystallographic data were collected at GM/CA@APS, funded by NCI (ACB-12002) and NIGMS (AGM-12006). The Eiger 16M detector at GM/CA-XSD was funded by NIH grant S10 OD012289. This research also used resources of the Advanced Photon Source, a U.S. Department of Energy (DOE) Office of Science User Facility operated for the DOE Office of Science by Argonne National Laboratory under Contract No. DE-AC02-06CH11357. GBM patient survival analysis used data generated by the TCGA Research Network: https://www.cancer.gov/tcga.
Footnotes
COMPETING INTERESTS
The authors declare no competing interests.
Supplementary Information The online version contains supplementary material available at https://doi.org/10.1038/s41586-021-04393-3
REFERENCES
- 1.Sharma SV, Bell DW, Settleman J & Haber DA Epidermal growth factor receptor mutations in lung cancer. Nat. Rev. Cancer 7, 169–181 (2007). [DOI] [PubMed] [Google Scholar]
- 2.Brennan CW et al. The somatic genomic landscape of glioblastoma. Cell 155, 462–477 (2013). [DOI] [PMC free article] [PubMed] [Google Scholar]
- 3.An Z, Aksoy O, Zheng T, Fan QW & Weiss WA Epidermal growth factor receptor and EGFRvIII in glioblastoma: signaling pathways and targeted therapies. Oncogene 37, 1561–1575 (2018). [DOI] [PMC free article] [PubMed] [Google Scholar]
- 4.Wilson KJ, Gilmore JL, Foley J, Lemmon MA & Riese DJ 2nd. Functional selectivity of EGF family peptide growth factors: implications for cancer. Pharmacol. Ther 122, 1–8 (2009). [DOI] [PMC free article] [PubMed] [Google Scholar]
- 5.Freed DM et al. EGFR ligands differentially stabilize receptor dimers to specify signaling kinetics. Cell 171, 683–695 (2017). [DOI] [PMC free article] [PubMed] [Google Scholar]
- 6.Macdonald-Obermann JL & Pike LJ Different epidermal growth factor (EGF) receptor ligands show distinct kinetics and biased or partial agonism for homodimer and heterodimer formation. J. Biol. Chem 289, 26178–26188 (2014). [DOI] [PMC free article] [PubMed] [Google Scholar]
- 7.Martínez-Jiménez F et al. A compendium of mutational cancer driver genes. Nat. Rev. Cancer 20, 555–572 (2020). [DOI] [PubMed] [Google Scholar]
- 8.Eck MJ & Yun CH Structural and mechanistic underpinnings of the differential drug sensitivity of EGFR mutations in non-small cell lung cancer. Biochim. Biophys. Acta 1804, 559–566 (2010). [DOI] [PMC free article] [PubMed] [Google Scholar]
- 9.Tate JG et al. COSMIC: the Catalogue Of Somatic Mutations In Cancer. Nucleic Acids Res. 47, D941–D947 (2019). [DOI] [PMC free article] [PubMed] [Google Scholar]
- 10.Heimberger AB et al. Prognostic effect of epidermal growth factor receptor and EGFRvIII in glioblastoma multiforme patients. Clin. Cancer Res 11, 1462–1466 (2005). [DOI] [PubMed] [Google Scholar]
- 11.Eskilsson E et al. EGFR heterogeneity and implications for therapeutic intervention in glioblastoma. Neuro. Oncol 20, 743–752 (2018). [DOI] [PMC free article] [PubMed] [Google Scholar]
- 12.Lee JC et al. Epidermal growth factor receptor activation in glioblastoma through novel missense mutations in the extracellular domain. PLoS Med. 3, e485 (2006). [DOI] [PMC free article] [PubMed] [Google Scholar]
- 13.Ng PK et al. Systematic functional annotation of somatic mutations in cancer. Cancer Cell 33, 450–462 (2018). [DOI] [PMC free article] [PubMed] [Google Scholar]
- 14.Lu C et al. Structural evidence for loose linkage between ligand binding and kinase activation in the epidermal growth factor receptor. Mol. Cell. Biol 30, 5432–5443 (2010). [DOI] [PMC free article] [PubMed] [Google Scholar]
- 15.Garrett TPJ et al. Crystal structure of a truncated epidermal growth factor receptor extracellular domain bound to transforming growth factor alpha. Cell 110, 763–773 (2002). [DOI] [PubMed] [Google Scholar]
- 16.Ferguson KM Structure-based view of epidermal growth factor receptor regulation. Annu. Rev. Biophys 37, 353–373 (2008). [DOI] [PMC free article] [PubMed] [Google Scholar]
- 17.Ogiso H et al. Crystal structure of the complex of human epidermal growth factor and receptor extracellular domains. Cell 110, 775–787 (2002). [DOI] [PubMed] [Google Scholar]
- 18.Liebschner D et al. Polder maps: improving OMIT maps by excluding bulk solvent. Acta Crystallogr. D Struct. Biol 73, 148–157 (2017). [DOI] [PMC free article] [PubMed] [Google Scholar]
- 19.Diwanji D et al. Structures of the active HER2/HER3 receptor complex reveal dynamics at the dimerization interface induced by binding of a single ligand. Nature, in press (2021). [Google Scholar]
- 20.Alvarado D, Klein DE & Lemmon MA Structural basis for negative cooperativity in growth factor binding to an EGF receptor. Cell 142, 568–579 (2010). [DOI] [PMC free article] [PubMed] [Google Scholar]
- 21.Binder ZA et al. Epidermal growth factor receptor extracellular domain mutations in glioblastoma present opportunities for clinical imaging and therapeutic development. Cancer Cell 34, 163–177 (2018). [DOI] [PMC free article] [PubMed] [Google Scholar]
- 22.Orellana L et al. Oncogenic mutations at the EGFR ectodomain structurally converge to remove a steric hindrance on a kinase-coupled cryptic epitope. Proc. Natl. Acad. Sci. U. S. A 116, 10009–10018 (2019). [DOI] [PMC free article] [PubMed] [Google Scholar]
- 23.Fan QW et al. EGFR phosphorylates tumor-derived EGFRvIII driving STAT3/5 and progression in glioblastoma. Cancer Cell 24, 438–449 (2013). [DOI] [PMC free article] [PubMed] [Google Scholar]
- 24.An Z et al. EGFR cooperates with EGFRvIII to recruit macrophages in glioblastoma. Cancer Res. 78, 6785–6794 (2018). [DOI] [PMC free article] [PubMed] [Google Scholar]
- 25.Friedmann-Morvinski D et al. Dedifferentiation of neurons and astrocytes by oncogenes can induce gliomas in mice. Science 338, 1080–1084 (2012). [DOI] [PMC free article] [PubMed] [Google Scholar]
- 26.Del Vecchio CA et al. EGFRvIII gene rearrangement is an early event in glioblastoma tumorigenesis and expression defines a hierarchy modulated by epigenetic mechanisms. Oncogene 32, 2670–2681 (2013). [DOI] [PubMed] [Google Scholar]
- 27.Emlet DR et al. Targeting a glioblastoma cancer stem-cell population defined by EGF receptor variant III. Cancer Res. 74, 1238–1249 (2014). [DOI] [PMC free article] [PubMed] [Google Scholar]
- 28.Alcantara Llaguno S et al. Cell-of-origin susceptibility to glioblastoma formation declines with neural lineage restriction. Nat. Neurosci 22, 545–555 (2019). [DOI] [PMC free article] [PubMed] [Google Scholar]
- 29.Jaiswal BS et al. Oncogenic ERBB3 mutations in human cancers. Cancer Cell 23, 603–617 (2013). [DOI] [PubMed] [Google Scholar]
- 30.Hopkins JB, Gillilan RE & Skou S BioXTAS RAW: improvements to a free open-source program for small-angle X-ray scattering data reduction and analysis. J. Appl. Cryst 50, 1545–1553 (2017). [DOI] [PMC free article] [PubMed] [Google Scholar]
- 31.Manalastas-Cantos K et al. ATSAS 3.0: expanded functionality and new tools for small-angle scattering data analysis. J. Appl. Crystallogr 54, 343–355 (2021). [DOI] [PMC free article] [PubMed] [Google Scholar]
- 32.Lemmon MA et al. Two EGF molecules contribute additively to stabilization of the EGFR dimer. EMBO J. 16, 281–294 (1997). [DOI] [PMC free article] [PubMed] [Google Scholar]
- 33.Kabsch W XDS. Acta Crystallogr. D Biol. Crystallogr 66, 125–132 (2010). [DOI] [PMC free article] [PubMed] [Google Scholar]
- 34.CCP4. The CCP4 suite: Programs for protein crystallography. Acta Crystallogr. D Biol. Crystallogr 50, 760–763 (1994). [DOI] [PubMed] [Google Scholar]
- 35.McCoy AJ et al. Phaser crystallographic software. J. Appl. Cryst 40, 658–674 (2007). [DOI] [PMC free article] [PubMed] [Google Scholar]
- 36.Emsley P & Cowtan K Coot: model-building tools for molecular graphics. Acta Crystallogr. D Biol. Crystallogr 60, 2126–2132 (2004). [DOI] [PubMed] [Google Scholar]
- 37.Smart OS et al. Exploiting structure similarity in refinement: automated NCS and target-structure restraints in BUSTER. Acta Crystallogr. D Biol. Crystallogr 68, 368–380 (2012). [DOI] [PMC free article] [PubMed] [Google Scholar]
- 38.Adams PD et al. PHENIX: a comprehensive Python-based system for macromolecular structure solution. Acta Crystallogr D Biol Crystallogr 66, 213–221 (2010). [DOI] [PMC free article] [PubMed] [Google Scholar]
- 39.Winn MD, Isupov MN & Murshudov GN Use of TLS parameters to model anisotropic displacements in macromolecular refinement. Acta Crystallogr. D Biol. Crystallogr 57, 122–133 (2001). [DOI] [PubMed] [Google Scholar]
- 40.Chen VB et al. MolProbity: all-atom structure validation for macromolecular crystallography. Acta Crystallogr. D Biol. Crystallogr 66, 12–21 (2010). [DOI] [PMC free article] [PubMed] [Google Scholar]
- 41.Dawson JP et al. Epidermal growth factor receptor dimerization and activation require ligand-induced conformational changes in the dimer interface. Mol. Cell. Biol 25, 7734–7742 (2005). [DOI] [PMC free article] [PubMed] [Google Scholar]
- 42.Ferguson KM, Darling PJ, Mohan MJ, Macatee TL & Lemmon MA Extracellular domains drive homo- but not hetero-dimerization of erbB receptors. EMBO J. 19, 4632–4643 (2000). [DOI] [PMC free article] [PubMed] [Google Scholar]
- 43.Essletzbichler P et al. Megabase-scale deletion using CRISPR/Cas9 to generate a fully haploid human cell line. Genome Res. 24, 2059–2065 (2014). [DOI] [PMC free article] [PubMed] [Google Scholar]
- 44.Kiyatkin A, van Alderwerelt van Rosenburgh IK, Klein DE & Lemmon MA Kinetics of receptor tyrosine kinase activation define ERK signaling dynamics. Sci. Signal 13, eaaz5267 (2020). [DOI] [PMC free article] [PubMed] [Google Scholar]
- 45.Aksamitiene E, Hoek JB & Kiyatkin A Multistrip Western blotting: a tool for comparative quantitative analysis of multiple proteins. Methods Mol. Biol 1312, 197–226 (2015). [DOI] [PubMed] [Google Scholar]
- 46.Gao J et al. Integrative analysis of complex cancer genomics and clinical profiles using the cBioPortal. Sci. Signal 6, pl1 (2013). [DOI] [PMC free article] [PubMed] [Google Scholar]
- 47.Therneau TM A package for survival analysis in R. https://CRAN.R-project.org/package=survival (2020). [Google Scholar]
- 48.Kohsaka S et al. A method of high-throughput functional evaluation of EGFR gene variants of unknown significance in cancer. Sci. Transl. Med 9, eaan6566 (2017). [DOI] [PubMed] [Google Scholar]
- 49.Neelam B et al. Structure-function studies of ligand-induced epidermal growth factor receptor dimerization. Biochemistry 37, 4884–4891 (1998). [DOI] [PubMed] [Google Scholar]
- 50.Thompson SA, Harris A, Hoang D, Ferrer M & Johnson GR COOH-terminal extended recombinant amphiregulin with bioactivity comparable with naturally derived growth factor. J. Biol. Chem 271, 17927–17931 (1996). [DOI] [PubMed] [Google Scholar]
- 51.Adam R et al. Modulation of the receptor binding affinity of amphiregulin by modification of its carboxyl terminal tail. Biochim. Biophys. Acta 1266, 83–90 (1995). [DOI] [PubMed] [Google Scholar]
- 52.Bessman NJ, Bagchi A, Ferguson KM & Lemmon MA Complex relationship between ligand binding and dimerization in the epidermal growth factor receptor. Cell Reports 9, 1306–1317 (2014). [DOI] [PMC free article] [PubMed] [Google Scholar]
- 53.Yu S et al. The non-small cell lung cancer EGFR extracellular domain mutation, M277E, is oncogenic and drug-sensitive. Onco. Targets Ther 10, 4507–4515 (2017). [DOI] [PMC free article] [PubMed] [Google Scholar]
- 54.Liu P et al. A single ligand is sufficient to activate EGFR dimers. Proc. Natl. Acad. Sci. U. S. A 109, 10861–10866 (2012). [DOI] [PMC free article] [PubMed] [Google Scholar]
- 55.Bessman NJ, Freed DM & Lemmon MA Putting together structures of epidermal growth factor receptors. Curr. Opin. Struct. Biol 29, 95–101 (2014). [DOI] [PMC free article] [PubMed] [Google Scholar]
- 56.Singh B, Carpenter G & Coffey RJ EGF receptor ligands: recent advances. F1000Res. 5, F1000 Faculty Rev-2270 (2016). [DOI] [PMC free article] [PubMed] [Google Scholar]
- 57.Macdonald JL & Pike LJ Heterogeneity in EGF-binding affinities arises from negative cooperativity in an aggregating system. Proc. Natl. Acad. Sci. U. S. A 105, 112–117 (2008). [DOI] [PMC free article] [PubMed] [Google Scholar]
- 58.Ferguson KM, Hu C & Lemmon MA Insulin and epidermal growth factor receptor family members share parallel activation mechanisms. Protein Sci. 29, 1331–1344 (2020). [DOI] [PMC free article] [PubMed] [Google Scholar]
- 59.Ferguson KM et al. EGF activates its receptor by removing interactions that autoinhibit ectodomain dimerization. Mol. Cell 11, 507–517 (2003). [DOI] [PubMed] [Google Scholar]
- 60.Ramamurthy V et al. Structures of adnectin/protein complexes reveal an expanded binding footprint. Structure 20, 259–269 (2012). [DOI] [PubMed] [Google Scholar]
- 61.Matsuda T et al. Cell-free synthesis of functional antibody fragments to provide a structural basis for antibody-antigen interaction. PLoS One 13, e0193158 (2018). [DOI] [PMC free article] [PubMed] [Google Scholar]
- 62.Li S et al. Structural basis for inhibition of the epidermal growth factor receptor by cetuximab. Cancer Cell 7, 301–311 (2005). [DOI] [PubMed] [Google Scholar]
- 63.Lee JJ et al. Enzymatic prenylation and oxime ligation for the synthesis of stable and homogeneous protein-drug conjugates for targeted therapy. Angew. Chem. Int. Ed. Engl 54, 12020–12024 (2015). [DOI] [PubMed] [Google Scholar]
- 64.Alvarado D, Klein DE & Lemmon MA ErbB2 resembles an autoinhibited invertebrate epidermal growth factor receptor. Nature 461, 287–291 (2009). [DOI] [PMC free article] [PubMed] [Google Scholar]
Associated Data
This section collects any data citations, data availability statements, or supplementary materials included in this article.
Supplementary Materials
Data Availability Statement
Atomic coordinates and structure factors for the refined structural models described in this paper have been deposited in the Protein Data Bank (PDB) under accession codes 7LEN (EREG:sEGFRR84K, crystallized with trehalose), 7LFR (EREG:sEGFRR84K, crystallized with spermine) and 7LFS (EREG:sEGFRA265V). Source data are provided with this paper.


