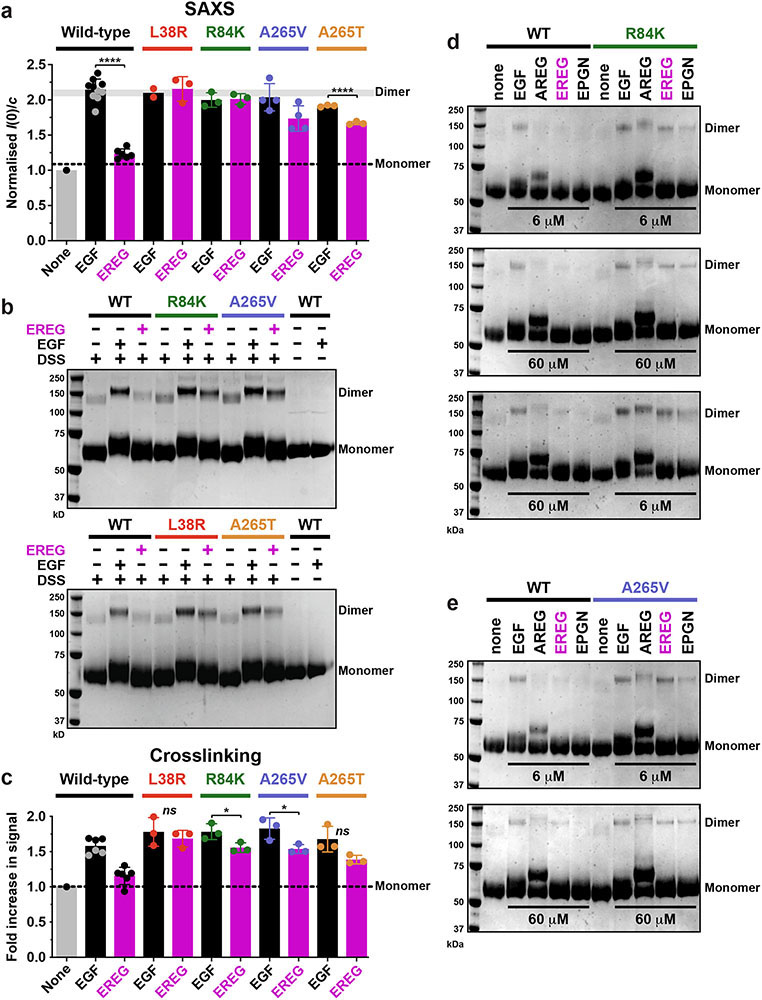
Extended Data Fig. 2. Cross-linking studies of ligand-induced sEGFR dimerisation.
a. Quantitation and summary of SAXS I(0)/c measurements reported in Fig. 2 across multiple repeats. For sEGFRWT, only EGF (black) doubles the I(0) value, representing selective EGF-induced dimerisation. By contrast, both EREG (magenta) and EGF (black) induce dimerisation of sEGFR harbouring L38R (red), R84K (green), A265V (blue) or A265T (gold) mutations – with EREG-induced dimerisation of A265 variants appearing slightly less robust. Data represent mean I(0)/c ± SD for 10 repeats (WT + EGF), 6 repeats (WT + EREG), 4 repeats (A265V + EGF and A265V + EREG), 3 repeats (L38R + EREG, R84K + EGF, R84K + EREG, A265T + EGF, A265T + EREG), and 2 repeats (L38R + EGF) – where a repeat corresponds to a biologically independent sample. An additional single experiment was undertaken for T239P + EREG, which showed an elevation of I(0)/c by 1.44 fold. The degree of sEGFR dimerisation for EGF and EREG is significantly different only for WT (p < 0.0001) and A265T (p < 0.0001). p values are from unpaired two-tailed Student’s t-tests.
We estimate based on the SAXS data in Figs. 2a-e that the GBM mutations studied here strengthen dimerisation of EREG-bound sEGFR by several hundred fold based on the following considerations. Since sEGFRWT at 70 μM shows no dimerisation when saturated with EREG, the dissociation constant (KD) for dimers of the EREG:sEGFR complex must be >450 μM (assuming that we could detect a minimum of 10% dimer by SAXS). By contrast, the complete dimerisation seen for the EREG:sEGFR complex with mutated variants (when corrected for differences in ligand-binding affinities) places a lower limit of ~0.7 μM on KD for these dimers. Thus, GBM mutations must enhance dimerisation of the EREG:sEGFR complex by at least ~650-fold.
b. Representative crosslinking analysis of sEGFR dimerisation (n = 3 biologically independent samples for each mutated variant). Different sEGFR variants at 5 μM were incubated alone or with the noted ligand (EGF or EREG) at 6 μM, and subjected to 100 μM DSS for 30 min (see Methods). Samples were then subjected to SDS-PAGE and stained with Coomassie Blue. Dimer and monomer bands are marked (note the shift in monomer band position following ligand cross-linking). EGF promotes dimerisation of all variants. EREG fails to increase sEGFRWT dimerisation above that seen without ligand, but detectably enhances dimerisation of all variants with GBM mutations, consistent with the SAXS data shown in Fig. 2. See Supplementary Figure 1 for gel source data, and (c) for quantitation and reproducibility information.
c. Quantitation of data in (b), including additional repeats for each variant. For sEGFRWT, EGF induces substantially more dimerisation than EREG (p < 0.0001), whereas the difference between EGF and EREG is not significant for L38R (p = 0.0522) or A265T (p = 0.0577), and only just reaches statistical significance for R84K (p = 0.0410) and A265V (p = 0.0377). p values are for unpaired two-tailed Student’s t-tests. Data in the graph represent mean ± SD for 6 repeats (WT + EGF and WT + EREG), or 3 repeats (A265V + EGF, A265V + EREG, R84K + EGF, R84K + EREG, A265T + EGF, A265T + EREG, L38R + EGF, and L38R + EREG), where repeats refer to biologically independent samples.
d. Top panel: WT and R84K-sEGFR (5 μM) were crosslinked alone or with the noted ligands (EGF, AREG EREG, or EPGN) at 6 μM. Middle panel: as in Top panel, but with 60 μM ligand. Bottom panel: Crosslinking studies were performed with 60 μM ligand added to sEGFRWT and 6 μM added to sEGFRR84K, to account for affinity differences. Data are representative of three biologically independent samples. See Supplementary Figure 1 for gel source data.
e. As for (d), but using sEGFRA265V with 6 μM or 60 μM ligand as marked, for 5 biologically independent samples of sEGFRA265V with EGF and EREG, but n = 2 for AREG and EPGN. See Supplementary Figure 1 for gel source data.

