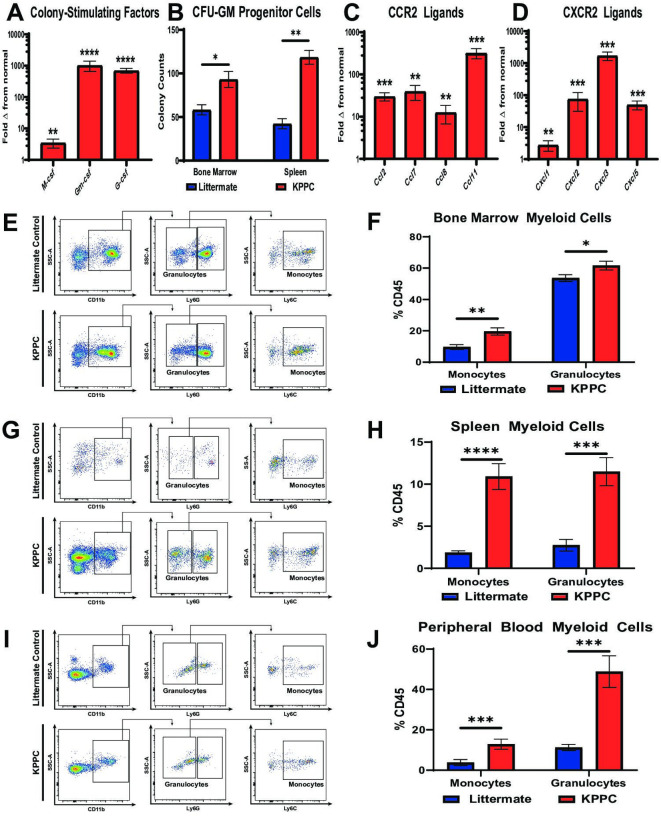
Figure 3.
iCCA tumours induce myelopoiesis and systemic accumulation of myeloid cells. (A) qRT-PCR analysis shows mean fold change in normalised mRNA expression levels of colony-stimulating factors including M-csf, Gm-csf and G-csf in normal livers from littermate controls (n=10) compared with established iCCA tumours from KPPC mice (n=8). (B) graph compares CFU-GM in bone marrow and splenocyte cell suspensions isolated from littermate controls and KPPC mice with established iCCA tumours. n=6–7 per group. (C and D) Graphs compare mean fold change in normalised mRNA expression levels for C-C chemokine receptor type 2 (CCR2) ligands (C) and C-X-C chemokine receptor type 2 (CXCR2) ligands (D) in normal livers from littermate controls (n=10) versus established iCCA tumours from KPPC mice (n=8) by qRT-PCR analysis. (E, G and I) Representative flow cytometry plots show gating strategies for defining myeloid cell subsets in suspensions of bone marrow mononuclear cells (E), splenocytes (G) and peripheral blood (I) from littermate controls and KPPC mice with established iCCA tumours. (F, H and J) Graphs compare the prevalence of Ly6C+ monocytes and Ly6G+ granulocytes in bone marrow (F, n=12–13/group), spleens (H, n=12–13/group) and peripheral blood (J, n=11–13/group) from littermate controls and KPPC mice with established iCCA tumours. All bars indicate means±SEM, and p values were determined by Mann-Whitney U test. *P<0.05, **p<0.01, ***p<0.001 and ****p< 0.0001. Gm-csf, granulocyte–macrophage colony-stimulating factor; G-csf, granulocyte colony-stimulating factor; GM-CFUs, granulocyte–macrophage colony-forming units; iCCA, intrahepatic cholangiocarcinoma; M-csf, macrophage colony-stimulating factor; qRT-PCR, quantitative real-time polymerase chain reaction.

