Abstract
In this paper, a compartmental mathematical model has been utilized to gain a better insight about the future dynamics of COVID-19. The total human population is divided into eight various compartments including susceptible, exposed, pre-asymptomatic, asymptomatic, symptomatic, quarantined, hospitalized and recovered or removed individuals. The problem was modeled in terms of highly nonlinear coupled system of classical order ordinary differential equations (ODEs) which was further generalized with the Atangana-Balaeanu (ABC) fractional derivative in Caputo sense with nonlocal kernel. Furthermore, some theoretical analyses have been done such as boundedness, positivity, existence and uniqueness of the considered. Disease-free and endemic equilibrium points were also assessed. The basic reproduction was calculated through next generation technique. Due to high risk of infection, in the present study, we have considered the reported cases from three continents namely Americas, Europe, and south-east Asia. The reported cases were considered between 1st May 2021 and 31st July 2021 and on the basis of this data, the spread of infection is predicted for the next 200 days. The graphical solution of the considered nonlinear fractional model was obtained via numerical scheme by implementing the MATLAB software. Based on the fitted values of parameters, the basic reproduction number for the case of America, Asia and Europe were calculated as , and respectively. It is also observed that the spread of infection in America is comparatively high followed by Asia and Europe. Moreover, the effect of fractional parameter is shown on the dynamics of spread of infection among different classes. Additionally, the effect of quarantined and treatment of infected individuals is also shown graphically. From the present analysis it is observed that awareness of being quarantine and proper treatment can reduce the infection rate dramatically and a minimal variation in quarantine and treatment rates of infected individuals can lead us to decrease the rate of infection.
Keywords: COVID-19, Atangana-Baleanu (ABC) Fractional Derivative, MATLAB, Basic Reproduction Number, Disease Free Equilibrium, Endemic Equilibrium
Graphical Abstract
1. Introduction
COVID-19 affected many countries in terms of public health and economy (Bendavid et al., 2021). In the last couple of months, several SARS-CoV-2 variants have been emerged with some of them demonstrating active circulation and transmission dynamics (Khan and Atangana, 2020, Sánchez et al., 2020). Predicting and understanding the future viral transmission is key for infection control and prevention (Burki, 2020, Jin et al., 2020, Pellis et al., 2021, Zhao and Chen, 2020). Mathematical models are precious tools for this purpose. Indeed, different types of mathematical models with different fractional derivatives are utilized to investigate the dynamics and control of COVID-19 (Grassly et al., 2020, Grigorieva et al., 2020, Kassa et al., 2020, Memon et al., 2021). Many studies are reported for the dynamics and forecasting of COVID-19 by considering real data of different regions. Like, the early dynamics and clinical severity of COVID-19 in China by using mathematical tools can be seen in (Kucharski et al., 2020, Wu et al., 2020). Similarly, mathematical modeling and forecasting with intervention strategies, social media advertisement, isolation, quarantine, community awareness, global information compaigns with the consideration of real data from India in order to predict the future scenario of the disease can be seen in (Khajanchi et al., 2020, Khajanchi et al., 2021b, Khajanchi and Sarkar, 2020, Rai et al., 2022, Samui et al., 2020, Sarkar et al., 2020, Tiwari et al., 2021).
Fractional derivative is a powerful tool to discuss the complexity of the physical and engineering problems. Observations indicates that some physical phenomenon cannot be explained properly through classical order derivatives. Non-integer order derivatives are proven to be a best tool to best fit the theoretical results with the real data (Qureshi and Atangana, 2019, Yavuz and Özdemir, 2019, Yusuf et al., 2020). The applications and uses of fractional derivatives can be seen in different physical, engineering and health sciences such as sustainable energy, fluid mechanics, infectious disease modeling, biochemistry, electrical circuits and so on (Z. Ahmad et al., 2020b, Ahmad et al., 2021; Ahmad et al., 2021, Ahmad et al., 2021, Ahmad et al., 2021, Ahmad et al., 2021; Ali et al., 2020; Murtaza et al., 2022; Sinan et al., 2022). Besides this, previous work reported on the fractional dynamics of COVID-19 which is proved to be best fit with the real data. The reported study indicates that fractional models with power law kernel, exponential kernel or Mittag-Leffler kernel gives us best results as compared to classical models. Yadav and Verma investigated the transmission of COVID-19 in Wuhan China by using fractional derivatives (Yadav and Renu Verma, 2020). They observed that the real data can be best fit in case of fractional order derivative. Rajagopal et al. investigated the spread of COVID-19 in Italy (Rajagopal et al., 2020). They compared the results for the case of integer and non-integer derivative and found less error with the real data for the case of fractional derivative. Nisar et al. predicted the spread of COVID-19 via fractional derivatives (Nisar et al., 2021). They compared their model’s results with the real data of Wuhan China for initial days.
Some physical problems obey power law while some satisfy exponential law. Reported studies indicates that epidemiological problems can be best explain with the exponential laws because it obeys exponential laws. The fractional differential operators having exponential or Mittag-Leffler kernels can best explain the problems concerned with exponential laws. Due to the cross-over behavior, the fractional operator having Mittag-Leffler kernel i.e., Atangana-Baleanu fractional differential operator can best explain the complex dynamics of epidemiological problems (Ahmad et al., 2021, Ahmad et al., 2021, Ahmad et al., 2021, Ahmad et al., 2021; S. Ahmad et al., 2020; Z. Ahmad et al., 2020a; Arfan et al., 2021; Naik et al., 2020; Qureshi et al., 2019a, Qureshi et al., 2019b; Qureshi and Yusuf, 2019b, Qureshi and Yusuf, 2019a; Shah et al., 2020; Shatanawi et al., 2021). Qureshi et al. predicted the transmission of varicella zoster virus via different fractional operators i.e., Caputo, Caputo Fabrizio (CF) and Atangana-Baleanu (AB) fractional operators (Qureshi et al., 2019b). They found that AB fractional derivative gives the highest performance as compared to the rest of fractional derivatives. Similarly, it was reported the comparison of different fractional operators for the dynamics of diarrhea and found that AB fractional derivative gives the outstanding performance (Qureshi et al., 2019a). Qureshi and Yusuf reported the dynamics of chicken pox disease among the children in Schenzen city of China (Qureshi and Yusuf, 2019a, Qureshi and Yusuf, 2019b). They investigated their results by generalizing the classical model through different fractional derivatives and found that the dynamics can be best explain with AB fractional differential operator. Ahmad et al. analyzed the dynamics of COVID-19 in Pakistan by using AB fractional derivative (Z. Ahmad et al., 2020a). Naik et al. investigated the future scenario of COVID-19 in Pakistan by using different fractional operators and they noticed that AB fractional derivative gives us the highest efficiency rate with the real data (Naik et al., 2020). In the same way, Arfan et al. utilized the generalized Euler method for the results of fractional order COVID-19 model to predict the spread of COVID-19 in Pakistan (Arfan et al., 2021). Shatanawi et al. analyzed the spread of TB in Yemen for the period between 2000 and 2019 by using generalized AB fractional operator (Shatanawi et al., 2021). Shah et al. forecast the spread of COVID-19 using factional derivative by implementing Adomian decomposition technique (Shah et al., 2020). The modified Euler method was utilized by Ahmad et al. for the solution of the fractional order COVID-19 model in order to forecast the transmission of COVID-19 in Wuhan, China (S. Ahmad et al., 2020). Similarly, Abdullah et al. analyzed the transmission of COVID-19 in Wuhan, China under the consideration of fractional derivative (Ahmad et al., 2021, Ahmad et al., 2021, Ahmad et al., 2021, Ahmad et al., 2021). Shaikh et al. analyzed fractional order COVID-19 model for the spread and control of COVID-19 in India (Shaikh et al., 2020). Singh et al. reported the stability analysis and numerical investigation of the non-integer COVID-19 model (Singh et al., 2021). Danane et al. studied the numerical analysis of the stochastic COVID-19 model with the Levy noise model (Danane et al., 2021).
The main concern of epidemiological models is to find some possible ways to vanish or minimize the spread of infection. For this, the optimal control is proved to be a best tool and is applied to many infectious disease problems. Sharomi and Malik studied some applications of optimal control in epidemiological problems (Sharomi and Malik, 2017). Agusto and Khan reported the spread of dengue infection with the implementation of optimal control strategies and found that optimal control can drastically reduce the transmission of illness (Agusto and Khan, 2018). Sinan et al. reported the analysis for the transmission of malaria disease with optimal control and observed that optimal control such as spray of insecticides or proper treatment can quickly reduce the disease spread (Sinan et al., 2022). Ali et al. reported the optimal control of zika virus disease with the fractional derivatives (Ali et al., 2022a, Ali et al., 2022b). Similarly the utilization of the idea of optimal control for the control of COVID-19 can be seen in (Aba Oud et al., 2021; S. W. Ahmad et al., 2021, Ahmad et al., 2021, Ahmad et al., 2021, Ahmad et al., 2021; Grigorieva et al., 2020; Zamir et al., 2020).
This study aimed to present a mathematical model for the dynamics of COVID-19 spread among human population. The constructed model was applied on the data obtained from three regions (Americas, Europe and southeast Asia) for the period between 1st May 2021 and 31st July 2021. Based on the above-mentioned literature, no one considered the fractional order analysis of COVID-19 model by considering such type of compartmental study such as by including quarantine and hospitalization or asymptomatic pre-symptomatic or symptomatic classes which makes it a more general model. Moreover, in the present analysis, we have considered the recent time interval in order to choose the real reported data which can give us the most accurate future scenario of the disease. Introduction and detailed literature review is provided in Section 1 of this manuscript while the basic preliminaries are given Section 2. The mathematical formulation of the considered problem is provided is Section 3. Positivity and boundedness of the considered model and the equilibria and basic reproduction number was also calculated which are given in 4, 5 respectively. Moreover, the classical model was generalized using Atangana-Baleanu fractional operator which has nonlocal kernel and is provided in Section 6. The uniqueness for the solution fractional model is also shown and is given in Section 7. The graphical solutions of the considered model were achieved via numerical scheme by making use of computational software MATLAB which is provided in Section 8. The model fitting of the considered problem is given in Section 9 while the discussion and conclusion of the results are elaborated in 10, 11 respectively. On the basis of available data, the future scenario for the spread of COVID-19 was predicted for the next 200 days. The effect of fractional parameter ϕ was shown graphically. The impact of quarantine and hospitalization on the dynamics of COVID-19 among different classes was dementated.
2. Basic Preliminaries
Definition 2.1
The Atangana-Baleanu (AB) time fractional derivative in Caputo sense with fractional order ϕ is defined as (Atangana and Baleanu, 2016, Atangana and İğret Araz, 2021).
| (1) |
Here, is the normalization function and is the Mittage-Leffler function (Sene, 2020).
Definition 2.2
The integral operator for the ABC fractional derivative can be defined as (Atangana, 2017; Atangana and İğret Araz, 2021):
| (2) |
Definition 2.3
The numerical scheme for the solution of fractional order ODE is defined by Toufik and Atangana (Toufik and Atangana, 2017):
Consider a non-linear fractional ODE:
| (3) |
The numerical solution for Eq. (3) is given as (Toufik and Atangana, 2017):
| (4) |
3. Mathematical Modeling
In the present model, we have considered the spread of COVID-19 in the human population in different continents of the world i.e., southeast Asia, Europe and Americas (North and South America). The total population is denoted with which is further classified into different compartments i.e., susceptible population is denoted by , are the exposed, pre-symptomatic are denoted with , while symptomatic and asymptomatic individuals are represented by and respectively. Similarly, and are the quarantined and recovered infectious individuals and are the recovered or removed/deceased individuals. The flow diagram for the considered problem is displayed in Fig. 1, where susceptible individuals can interact with and with a route and become exposed. More importantly, consists of early-infected individuals. Similarly, the exposed individuals further enter to the pre-symptomatic compartment with a rate of whereas the pre-symptomatic has the ability to transmit the disease. After the completion of mean incubation period, the individuals are divided in to two groups. Some of the infectious individuals have the disease symptoms while some are not. The individuals which do not have clear symptoms will enter to the asymptomatic class with a rate of while those individuals having clear clinical symptoms of COVID-19 will enter to the symptomatic class with the positive rates . Similarly, some of the pre-symptomatic class will recover or die out due to the infection with the positive rate while some of the pre-symptomatic individuals will enter to the quarantine class with a positive rate . Additionally, the symptomatic infectious individuals are quarantined or hospitalized with a positive rate and respectively. and are the recovery or removal rates due to the disease of symptomatic or asymptomatic infected individuals respectively. At the last, these hospitalized and quarantined individuals are recovered or removed due to the disease with the rates and respectively. The natural death rate of all the classes is denoted with while the recruitment or birth rate is denoted by . The flow diagram of the considered model for the spread of COVID-19 is given as:
Fig. 1.
Graphical Scheme of the model.
The system of equations for the considered problem with non-negative IC’s is given by:
| (5) |
With
| (6) |
4. Positivity and Boundedness of the COVID-19 Model
In this section, we will show that the solution of the considered problem is bounded as well as non-negative. For this, we will state the following lemma (Ahmad et al., 2021, Ahmad et al., 2021, Ahmad et al., 2021, Ahmad et al., 2021; Z. Ahmad et al., 2020b, Ahmad et al., 2020a):
Lemma 4.1
Consideris open, If , , then is the invariant domain of the subsequent equations.
| (7) |
Where
| (8) |
Preposition 4.1
The system (5) is invariant in .
Proof: By rewriting the system (5), we have:
| (9) |
| (10) |
We noted that
| (11) |
Hence, is invariant set.
Preposition 4.2
The system (5) is bounded in the region:
Proof:
Boundedness of the problem (5) can be verified by adding all equations of system (5), we obtained:
| (12) |
The solution of Eq. (12) takes the form:
| (13) |
It can be clearly seen from Eq. (13) that if then which means that the feasible region for the given model will be:
| (14) |
Hence the solution of the considered COVID-19 model is bounded.
5. Model Equilibria and Basic Reproduction Number
The possible equilibrium points of model (5) can be obtained via the steady state by assuming:
| (15) |
Using Eq. (15), model (5) becomes:
| (16) |
The possible unique disease-free equilibrium (DFE) of system (16) can be achieved by considering . The possible DFE is given as:
| (17) |
Now have to compute the basic reproduction number . The basic reproduction number gives the average number of the secondary infections created by a single infective individual during its entire infection period in a susceptible individuals (Khajanchi et al., 2021a). is typically known as a basic reproduction number or a contact number in the epidemiological models [1,17] and obtained by next generation matrix approach (Van Den Driessche and Watmough, 2002a). For this, we introduce the two matrices F and V at by applying the procedure of Next Generation Technique (Van Den Driessche and Watmough, 2002b):
| (18) |
and
| (19) |
According to the next generation technique given in (Van Den Driessche and Watmough, 2002b) [28], the spectral radius is the essential which is given below:
| (20) |
Where
| (21) |
Next, we have to find the endemic equilibrium (EE) of the considered problem which is symbolized by and is given as:
| (22) |
Where
6. Fractional Model of COVID-19 with Mittag-Leffler Function
To generalize the classical model of COVID-19 given in Eq. (5), we apply the definition of Atangana-Baleanu fractional operator in Caputo sense. Thus, Eq. (5) becomes:
| (23) |
Where is the definition of ABC fractional derivative having fractional order .
7. Uniqueness of the AB-Time Fractional Model
This section of the present paper provides the existence of a unique solution of the ABC-time fractional model, which is given in Eq. (23). Let us consider be a Banach space of the real-valued continuous functions with supremum norm defined on the interval and with the norm , where , , , , , , and . By applying the ABC-fractional integral operator given in Eq. (23), the equation takes the following form:
| (24) |
Which implies:
| (25) |
Where
| (26) |
The expressions and are thought to satisfy the Lipchitz condition if and only if and are upper bounded. Let us consider and be the two functions, then we have:
| (27) |
| (28) |
Equivalent to:
| (29) |
Where having is the corresponding Lipchitz constant.
In similar way, we can attain:
| (30) |
Hence, the above functions satisfy the Lipchitz condition with the corresponding Lipchitz constants, i.e., and .
Recursively, we can write Eq. (25) as:
| (31) |
By the difference of consecutive terms, we get:
| (32) |
It is important to mention here that , , ,, and . Moreover, using (29), (30) and taking , , , , , and , we reach the following form:
| (33) |
Theorem
The present fractional model (23) has a unique solution forif the following condition satisfies (Ahmad et al., 2021, Ahmad et al., 2021, Ahmad et al., 2021, Ahmad et al., 2021; Qureshi and Yusuf, 2019c; Sinan et al., 2022, Sinan et al., 2021):
Proof
: As it is already shown that and are bounded functions. It is also shown in (29), (30) that ,,,,,, and satisfy the Lipchitz condition. Thus, by implementing the recursive application, Eq. (33) takes the following shape:
| (34) |
Therefore, the above-mentioned sequences exist and satisfy , , , , , , and as . Further, by applying the triangular inequality for any j, we get:
| (35) |
Where by assertion and are the terms and given enclosed in brackets of Eq. (34), correspondingly. Thus and represents the Cauchy sequences in . As a result, they are all uniformly convergent. As is applied to Eq. (31), it shows that the limit of these sequences is the model (23) unique solution. The existence of a unique solution for the system (23) is eventually established.
8. Numerical scheme for the Solution of the Fractional Model
Applying the procedure in Definition (2.3), the numerical algorithm for the model (23) can be stated as:
| (36) |
Which implies
| (37) |
| (38) |
| (39) |
| (40) |
| (41) |
| (42) |
| (43) |
| (44) |
9. Model Fitting and Forecasting
In the present analysis, three continents are targeted to investigate the spread of COVID-19 namely South East Asia, Europe and Americas (North and South America which is considered as a single continent). These three continents are chosen on the basis of high rate of spread of the infection throughout the population. The real data is considered for the period of the last three months i.e., 1st May 2021–31 st July 2021. The reported cases for the selected regions are displayed in the bar chart given in Fig. 2. To match the considered model with the real data, some parameters are found in the literature while some ( Table 1) are fitted or estimated. The detail of model fitting for each continent is given below:
Fig. 2.
Cumulative reported cases in south-east Asia, Europe and Americas between 1st May 2021 and 31st July 2021.
Table 1.
List of Parameters with Description.
| Parameter | Description |
|---|---|
| Contact rate among asymptomatic and susceptible individuals | |
| Contact rate among pre-asymptomatic and susceptible individuals | |
| Contact rate among symptomatic and susceptible individuals | |
| Contact rate among quarantined and susceptible individuals | |
| Contact rate among hospitalized and susceptible individuals | |
| Incubation period | |
| Proportion of exposed developing asymptomatic infections | |
| Disease progression rate from the pre-asymptomatic to asymptomatic individuals | |
| Disease progression rate from the pre-asymptomatic to infectious individuals | |
| Quarantined rate of pre-asymptomatic individuals | |
| Quarantined rate of symptomatic individuals | |
| Hospitalization rate of symptomatic individuals | |
| Recovery or removal rate of symptomatic individuals | |
| Recovery or removal rate of hospitalized individuals | |
| Recovery or removal rate of quarantined individuals | |
| Recovery or removal rate of pre-asymptomatic individuals | |
| Recovery or removal rate of asymptomatic individuals | |
| recruitment rate | |
| Natural mortality rate |
9.1. South East Asia
The real reported cases in the south east Asia chosen are between 1st May 2021–31 st July 2021 which are displayed in the bar graph displayed in Fig. 3. Some parameters values are found in the literature while some are estimated or fitted. The fitted model with the real data is portrayed in Fig. 4. According to WHO (“WHO Coronavirus (COVID-19) Dashboard | WHO Coronavirus (COVID-19) Dashboard With Vaccination Data,” n.d.), the cases which are reported on 1st May 2021 are 22,280,802 which gradually increases and becomes 38,264,653 on 31st July 2021. The total population of south east Asia for the year 2021 is reported as 655 million (“Southeast Asia - Wikipedia,” n.d.). Life expectancy in south east Asia is given as 76.22 years 2021 (“Life expectancy at birth, total (years) - East Asia & Pacific | Data,” n.d.). Similarly, other initial conditions are chosen randomly such that exposed individuals are chosen as 6 million, pre-asymptomatic and asymptotic individuals are considered to be 6 million and 4 million respectively. The symptomatic individuals are considered as the total reported cases on 1st May 2021 i.e., 22,280,802. In the same way, quarantined and hospitalized individuals are taken as 5 million and 1 million respectively. While the sum of recovered and removed which is denoted by are considered as 10 million. The remaining total population is considered to be susceptible which is approximately equal to 600 million. Other parameters are fitted which are given in Table 2. On the basis of table values, the basic reproduction number for the spread of COVID-19 in the continent of south east Asia is estimated as 2.8797.
Fig. 3.
Cumulative reported cases in south-east Asia between 1st May 2021 and 31st July 2021.
Fig. 4.
Model Fitting versus reported cases in south-east Asia between 1st May 2021 and 31st July 2021.
Table 2.
Fitted Parameters for south-east Asia.
| Parameter | Value | Source |
|---|---|---|
| 0.5841 | Fitted | |
| 0.6233 | Fitted | |
| 0.2346 | Fitted | |
| 0.1241 | Fitted | |
| 0.1454 | Fitted | |
| 0.1981 | Fitted | |
| 0.6000 | Fitted | |
| 0.2342 | Fitted | |
| 0.1223 | Fitted | |
| 0.0561 | Fitted | |
| 0.3345 | Fitted | |
| 0.0634 | Fitted | |
| 0.0145 | Fitted | |
| 0.0184 | Fitted | |
| 0.0193 | Fitted | |
| 0.3360 | Fitted | |
| 0.4480 | Fitted | |
| Estimated | ||
| (“Life expectancy at birth, total (years) - East Asia & Pacific | Data,” n.d.) |
9.2. Europe
The same interval of time for the reported cases is chosen for the case of Europe and the cumulative reported cases are displayed in Fig. 5. According to WHO (“WHO Coronavirus (COVID-19) Dashboard | WHO Coronavirus (COVID-19) Dashboard With Vaccination Data,” n.d.), the cases which are reported in Europe on 1st May 2021 are 51,503,191 which rapidly increases up to 60,036,987 at the end of July 2021. The total population of Europe is reported as 746.4 million (“Europe https://data.worldbank.org/indicator/SP.DYN.LE00. IN - Wikipedia,” n.d.). Life expectancy in Europe is recorded as 81.06 years (“Life expectancy at birth, total (years) - European Union | Data,” n.d.). Similarly, other initial conditions are chosen randomly as the previous case while symptomatic individuals are considered as the total reported cases on 1st May 2021 i.e. 51,503,191. Other parameters are fitted or estimated which are given in Table 3 while the fitted model with the real data is depicted in Fig. 6. On the basis of table values, the basic reproduction number for the spread of COVID-19 in the continent of Europe is calculated as 2.23507.
Fig. 5.
Cumulative reported cases in Europe between 1st May 2021 and 31st July 2021.
Table 3.
Fitted Parameters for Europe.
| Parameter | Value | Source |
|---|---|---|
| 0.5126 | Fitted | |
| 0.5252 | Fitted | |
| 0.2175 | Fitted | |
| 0.1126 | Fitted | |
| 0.1526 | Fitted | |
| 0.1926 | Fitted | |
| 0.5982 | Fitted | |
| 0.2120 | Fitted | |
| 0.1463 | Fitted | |
| 0.0684 | Fitted | |
| 0.1545 | Fitted | |
| 0.0723 | Fitted | |
| 0.0267 | Fitted | |
| 0.0192 | Fitted | |
| 0.0294 | Fitted | |
| 0.3725 | Fitted | |
| 0.4051 | Fitted | |
| Estimated | ||
| (“Life expectancy at birth, total (years) - European Union | Data,” n.d.) |
Fig. 6.
Model Fitting versus reported cases in Europe between 1st May 2021 and 31st July 2021.
9.3. Americas
The time interval for the spread of COVID-19 is chosen same as the case of Europe and south-east Asia. The cumulative corona virus cases in the continent of Europe for the considered period is portrayed in Fig. 7. According to WHO (“WHO Coronavirus (COVID-19) Dashboard | WHO Coronavirus (COVID-19) Dashboard With Vaccination Data,” n.d.), the cases which are reported in America on 1st May 2021 are 62,109,967 which rapidly increases up to 77,003,547 at the end of July 2021. The total population of America for the year 2021 is reported as 1.002 billion (“United States Population, 2021 - Worldometer,” n.d.). Life expectancy in America is recorded as 79.11 (“United States of America - Place Explorer - Data Commons,” n.d.). Similarly, other initial conditions are chosen randomly as the case of Europe and Asia while the symptomatic individuals are considered as the total reported cases on 1st May 2021. Other parameters are fitted which are given in Table 4. The curve fitting between real data and considered model is displayed in Fig. 8. On the basis of table values, the basic reproduction number for the spread of COVID-19 in the continents of Americas is calculated as 2.92819.
Fig. 7.
Cumulative reported cases in Americas between 1st May 2021 and 31st July 2021.
Table 4.
Fitted Parameters for Americas.
| Parameter | Value | Source |
|---|---|---|
| 0.5148 | Fitted | |
| 0.6532 | Fitted | |
| 0.1928 | Fitted | |
| 0.1395 | Fitted | |
| 0.1294 | Fitted | |
| 0.1029 | Fitted | |
| 0.5732 | Fitted | |
| 0.2253 | Fitted | |
| 0.1109 | Fitted | |
| 0.0534 | Fitted | |
| 0.3102 | Fitted | |
| 0.0590 | Fitted | |
| 0.0140 | Fitted | |
| 0.0178 | Fitted | |
| 0.0165 | Fitted | |
| 0.3778 | Fitted | |
| 0.5487 | Fitted | |
| Estimated | ||
| (“United States of America - Place Explorer - Data Commons,” n.d.) |
Fig. 8.
Model Fitting versus reported cases in Americas between 1st May 2021 and 31st July 2021.
10. Results and Discussion
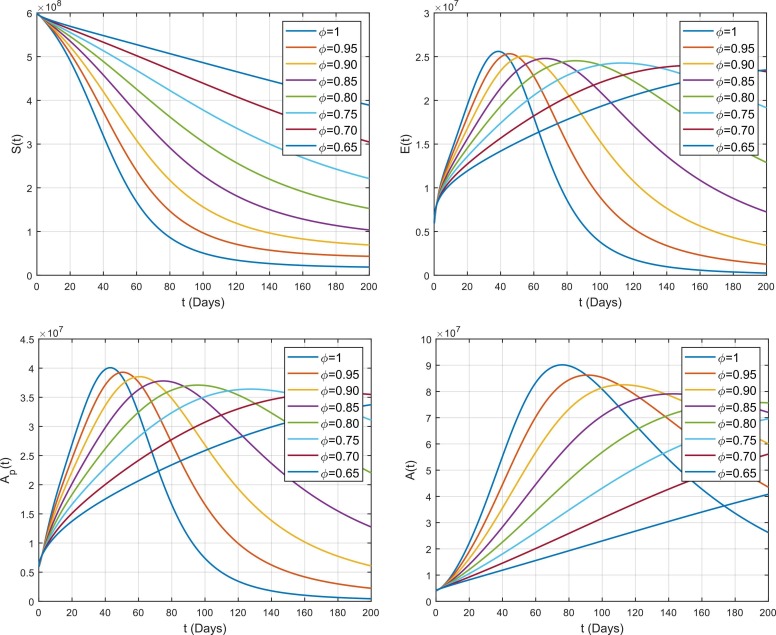
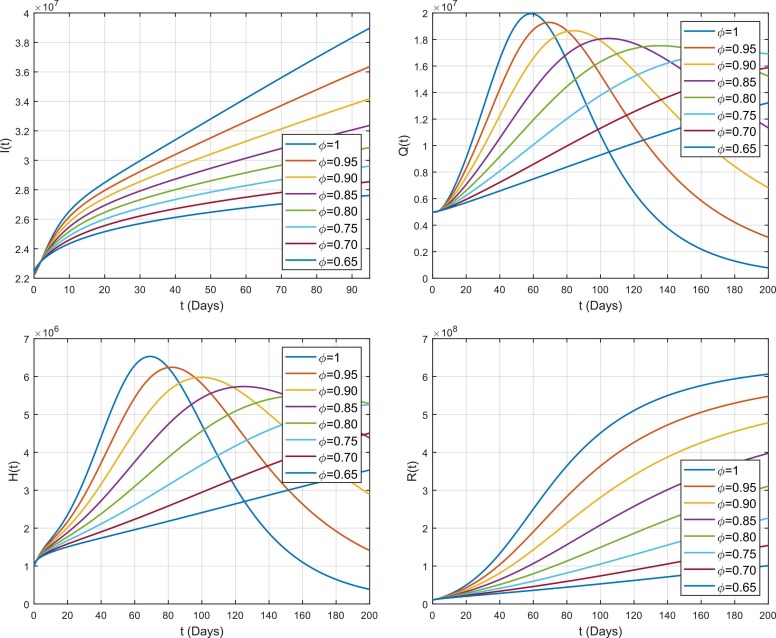
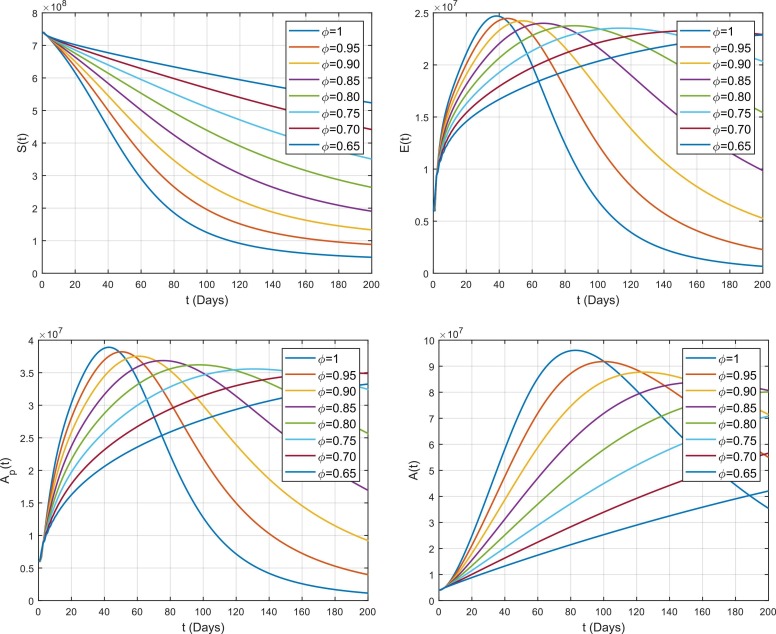
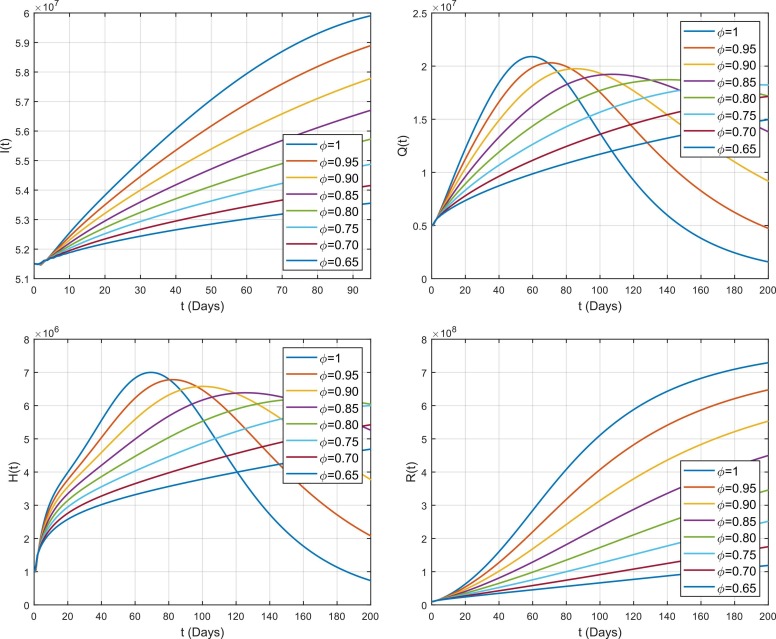
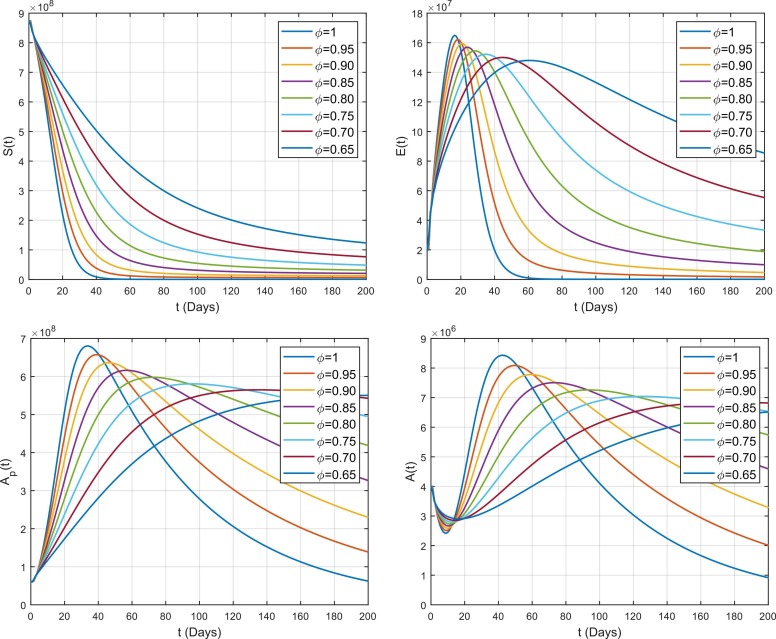
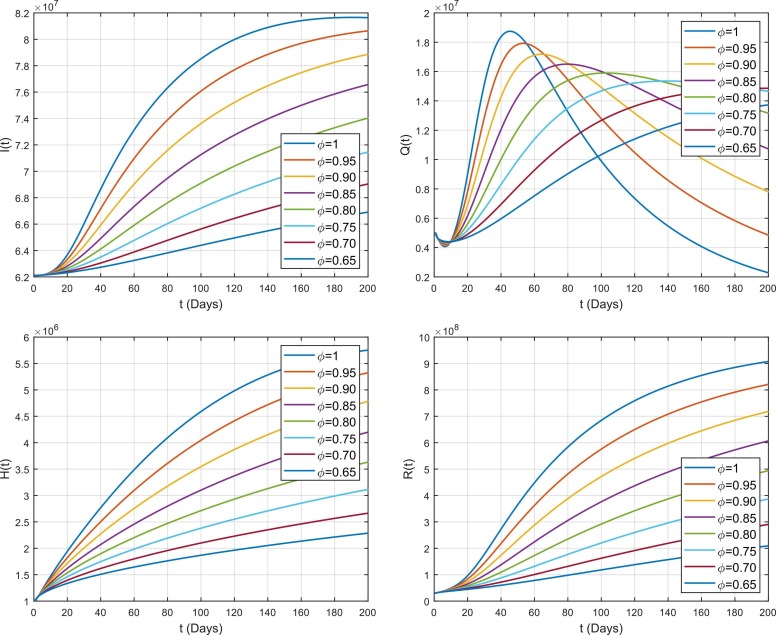
The impact of fractional parameter on different compartments for the case of south-east Asia is displayed in Fig. 9. Similarly, Fig. 10, Fig. 11 portrays the impact of on different subclasses for the cases of Europe and America. By varying while keeping other values fixed, the obtained solutions generate interesting results and gives a variety of solutions of the present model. On the basis of real data reported between 1st May 2021 and 31st July 2021, the results are predicted for the next 200 days. It is noticed that the effect of is same in all cases i.e., Asia, Europe and Americas. From Fig. 1, it is noticed that by decreasing , the susceptible individuals S(t) increases which means that less people become exposed. Similarly, increase in S(t) leads to decrease in exposed class and less people becomes exposed by decreasing . These exposed individuals gradually move to pre-asymptomatic class which is also decreases by decreasing . Now, there are two routes to move the pre-asymptomatic individuals i.e., Asymptomatic and symptomatic individuals . Some of pre-asymptomatic individuals move to enter asymptomatic class . It is noticed that also decreases by decreasing . Some pre-symptomatic individuals with clear symptoms join the asymptomatic class where is also decreases with decrease in . Furthermore, these symptomatic individuals move to the quarantined , hospitalized or recovered/removed class with different rates. It has been observed that and also decreases by decreasing because decreases which means that there will be not enough infected individuals which move to the and . Similarly, recovered or removed individuals also decreases by decreasing because all the classes from which the infected individuals move to join the recovered or removed class decreases with decrease in .
Fig. 9.
Impact of fractional parameter on the dynamics of COVID-19 among different compartments in south-east Asia.
Fig. 10.
Impact of fractional parameter on the dynamics of COVID-19 among different compartments in Europe.
Fig. 11.
Impact of fractional parameter on the dynamics of COVID-19 among different compartments in Americas.
The variation against for the dynamics of different compartments for the case of Europe and Americas is same as the case of south-east Asia which is already discussed above. However, some differences are noticed for the case of Asia and Europe. From the figures, it is noticed that the spread of COVID-19 in Asia is comparatively fast to Europe. Similarly, the transmission of disease in Americas is very fast as comparatively to both Europe and Asia. It is also given that the basic reproduction number estimated for Asia is high than that of Europe while the basic reproduction number for America is much greater that of the both cases Europe and Asia which is also shown clearly through figures that how the transmission of COVID-19 is high in Americas as compared to the other regions.
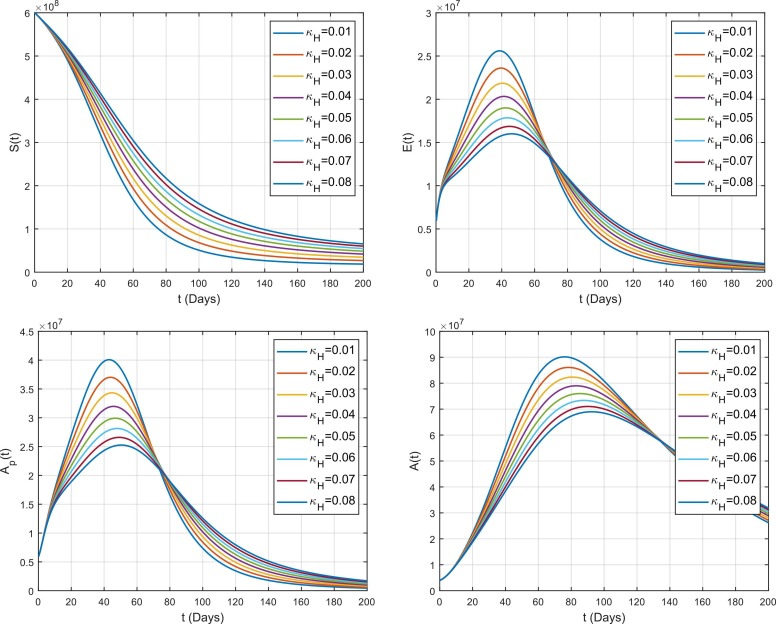
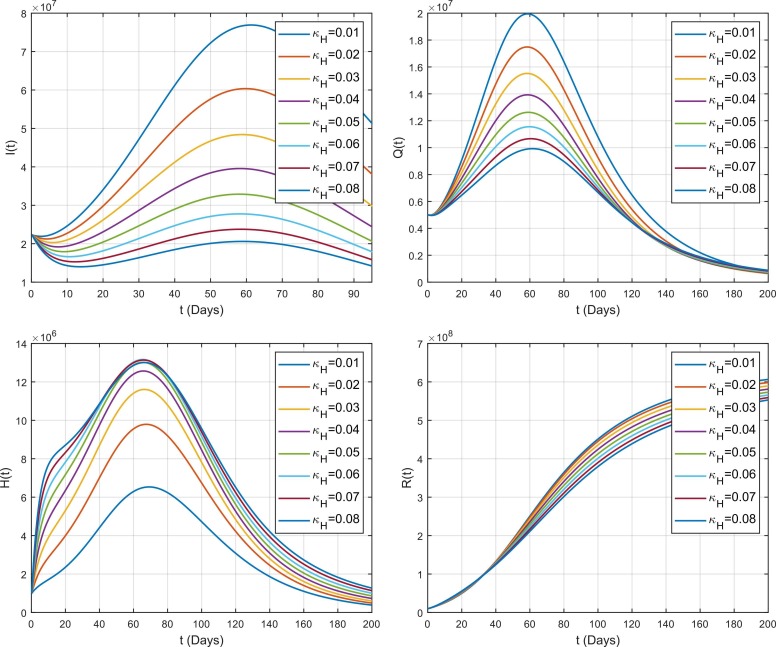
The effect of hospitalization rate of symptomatic individuals on the spread of COVID-19 in different compartment is shown in Fig. 12. It is observed that dramatically decreases the number of infected individuals over time in the symptomatic class . It means that by increasing the facilities of treatment in public can control the spread of COVID-19. Similarly, it also increases the number of hospitalized individuals which is obvious. In the same way, is also responsible in the decrease of because most of the infected individuals from enters to and there will be not enough individuals left to enter . Additionally, also increases the number of susceptible population because there will be not enough number of individuals left in symptomatic class which also decreases the interaction rate between susceptible and infected population which results to keep more people in the susceptible class . As the interaction decreases which results to decrease the spread of virus in overall compartments i.e., and because they are dependent to each other. Finally, the effect of on the recovered population can also be seen from the figure. As, we have already noticed that decreases the spread as well as interaction among all compartments. So, there will be a smaller number of individuals being infected which means that there will also be a smaller number of individuals become recovered because most of the people will still remain as susceptible.
Fig. 12.
Impact of rate of hospitalization on the dynamics of COVID-19 among different compartments.
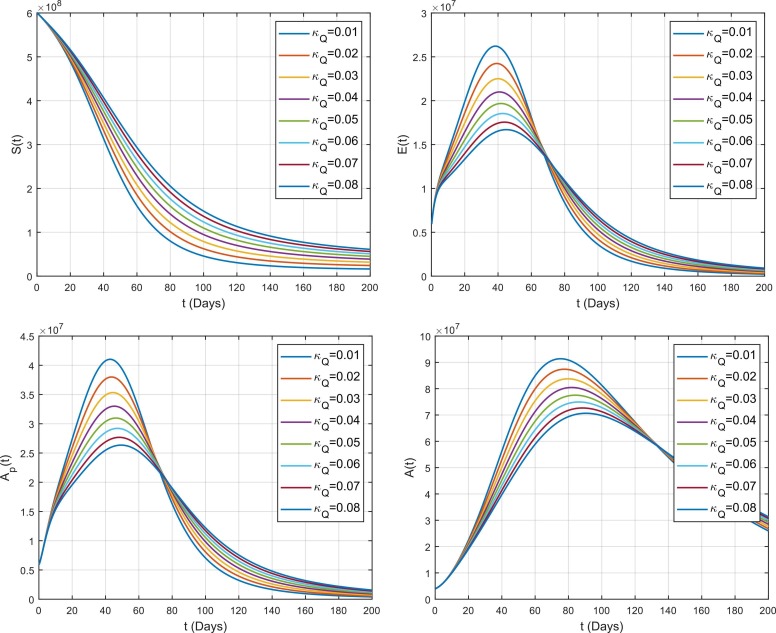
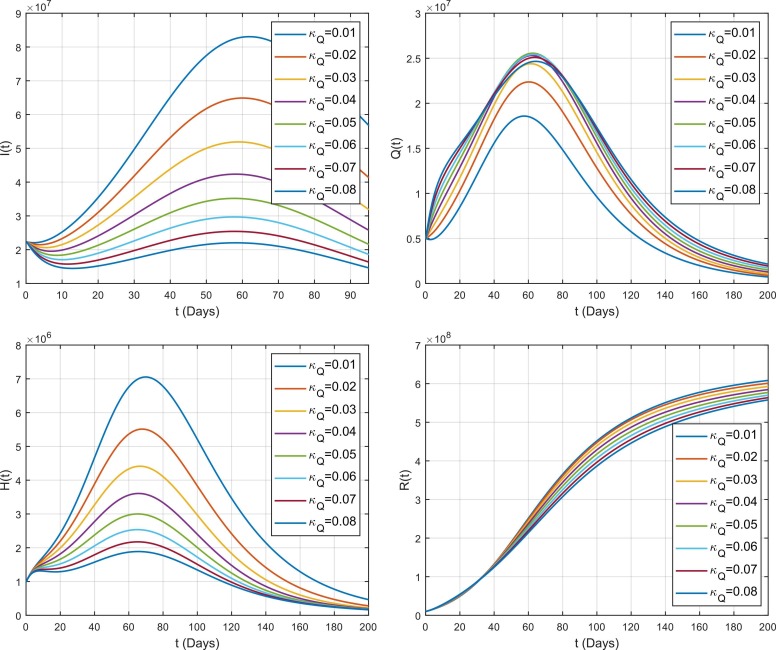
The effect of quarantine rate of symptomatic individuals on the spread of COVID-19 in different compartment is shown in Fig. 13. It has been noticed that decreases the number of infected individuals . So, by increasing the awareness of being quarantine among the public, we can better control the spread of COVID-19. Similarly, it also increases the number of quarantined individuals . is also responsible in the decrease of because most of the infected individuals from enters to and there will be not enough individuals left to enter . Additionally, also increases the number of susceptible population because there will be not enough number of individuals left in symptomatic class which also decreases the interaction rate between susceptible and infected population which results to keep more people in the susceptible class . As the interaction decreases which results to decrease the spread of virus in overall compartments i.e., and because they are dependent to each other. Finally, the effect of on the recovered population can also be seen from the figure. As, we have already noticed that decreases the spread as well as interaction among all compartments. So, there will be less number of individuals being infected which means that there will also be less number of individuals become recovered because most of the people will still remain as susceptible.
Fig. 13.
Impact of rate of quarantine on the dynamics of COVID-19 among different compartments.
The quarantine parameter and hospitalization parameter , which are used as the control parameters of COVID-19 in the present analysis. From Fig. 12, Fig. 13, we have observed that a minimal variation in both the quarantine and hospitalization parameters can reduce the spread of infection more quickly. The graphs show that by varying and , it reduces the number of infected individuals dramatically. Hence, if the health authorities aware the people of being quarantine by means of campaign through TV channels, newspapers and social media and also if they facilitate public with a proper treatment, then control of disease can be reduced more quickly.
11. Concluding Remarks
Different mathematical paradigms can provide considerable insights and scientific evidences pertinent to any ongoing epidemic dynamics. Based on those valuable information, health officials and public health- experts can set up potential control strategies to battle against any epidemic. From the emergence of the novel coronavirus in China, researchers and scientists are working relentlessly to develop various mathematical modeling approaches to gain a deeper understanding on the progression dynamics of COVID-19 in the world. On the basis of robust forecasting results of reliable epidemiological models, government officials can deploy different public health intervention strategies to control the rapid transmission of the virus. Herein, the dynamics and transmission of COVID-19 is predicted for the next 200 days. Based on the fitted values of parameters, the basic reproduction number for the case of America, Asia and Europe is, and respectively. This means that the spread of COVID-19 in America is high which is follower by Asia and Europe. Basic Reproduction number is very crucial number through which we can find that the disease is an endemic or it will vanish and approach to it disease free equilibrium. Here, the basic reproduction number is between 2 and 3 for all the considered regions which means that every infected individual will infect at least 2–3 susceptible individuals and the disease dynamics will approach to endemic state because . Our data indicates that awareness of being quarantined and proper treatment can minimize the virus risk. the number of infected cases is expected to decrease in a faster way if governments continue to adhere to COVID-19 restrictions and control measures. We believe that if the government restricts people to their homes only, avoids shaking hands, follows proper hand washing procedures, limits visits to endemic areas, restricts places where infection can be spread further, and carefully monitors physical and social distances, the number of infected cases will reduce more quickly.
This work can be extended in different directions such as by including different classes of human population be categorized the population via age wise or gender or characteristic wise. Moreover, the present problem can be analyzed through a different numerical or analytical technique. The idea of different fractional operators such as Caputo, Caputo-Fabrizio, generalized Caputo or AB or Prabhakar type fractional operators can be utilized and the results can be compared to show that which type of fractional operator can give us the best results. The idea of different fractal-fractional operators of different kernels can be implemented to the existing model. In addition to that, this model can be used for a different area, location or the data of different time interval can be used. This model can also be linked to other diseases through the co-infection model. Different incidence rates such as generalized, bilinear, saturated or half saturated type or many others can be used.
Declaration of Competing Interest
The authors declare that they have no known competing financial interests or personal relationships that could have appeared to influence the work reported in this paper.
Acknowledgements
The authors acknowledge the generous charitable donation from the late Sheikh Ibraheem Ahmed Azhar as a contribution to the scientific research community.
References
- Aba Oud M.A., Ali A., Alrabaiah H., Ullah S., Khan M.A., Islam S. A fractional order mathematical model for COVID-19 dynamics with quarantine, isolation, and environmental viral load. Adv. Differ. Eqs. 2021;2021:1–19. doi: 10.1186/S13662-021-03265-4/FIGURES/9. [DOI] [PMC free article] [PubMed] [Google Scholar]
- Agusto F.B., Khan M.A. Optimal control strategies for dengue transmission in pakistan. Math. Biosci. 2018;305:102–121. doi: 10.1016/J.MBS.2018.09.007. [DOI] [PubMed] [Google Scholar]
- Ahmad Abdullah, Owyed S., Abdel-Aty S., Mahmoud A.H., Shah E.E., K. Alrabaiah H. Mathematical analysis of COVID-19 via new mathematical model. Chaos, Solitons Fractals. 2021;143 doi: 10.1016/J.CHAOS.2020.110585. [DOI] [PMC free article] [PubMed] [Google Scholar]
- Ahmad S., Ullah A., Al-Mdallal Q.M., Khan H., Shah K., Khan A. Fractional order mathematical modeling of COVID-19 transmission. Chaos, Solitons Fractals. 2020;139 doi: 10.1016/J.CHAOS.2020.110256. [DOI] [PMC free article] [PubMed] [Google Scholar]
- Ahmad S.W., Sarwar M., Rahmat G.U.L., Shah K., Ahmad H., Mousa A.A.A. Fractional order model for the CORONAVIRUS (COVID-19) in Wuhan. CHINA. 2021;30 doi: 10.1142/S0218348×22400072. [DOI] [Google Scholar]
- Ahmad z, Ali F., Alqahtani A.M., Khan N., Khan I. Dyn. Coop. React. Based Chem. Kinet. React. Speed.: a Comp. Anal. Singul. nonsingular Kernels. 2021 doi: 10.1142/S0218348×22400485. [DOI] [Google Scholar]
- Ahmad Z., Arif M., Khan I. Dynamics of fractional order sir model with a case study of COVID-19 in Turkey. City Univ. Int. J. Comput. Anal. 2020;4:19–37. doi: 10.33959/CUIJCA.V4I01.43. [DOI] [Google Scholar]
- Ahmad Z., Ali F., Khan N., Khan I. Dynamics of fractal-fractional model of a new chaotic system of integrated circuit with Mittag-Leffler kernel. Chaos, Solitons Fractals. 2021;153 doi: 10.1016/J.CHAOS.2021.111602. [DOI] [Google Scholar]
- Ahmad Z., Arif M., Ali F., Khan I., Nisar K.S. A report on COVID-19 epidemic in Pakistan using SEIR fractional model. Sci. Rep. 2020;2020(101 10):1–14. doi: 10.1038/s41598-020-79405-9. [DOI] [PMC free article] [PubMed] [Google Scholar]
- Ali A., Iqbal Q., Asamoah J.K.K., Islam S. Mathematical modeling for the transmission potential of Zika virus with optimal control strategies. Eur. Phys. J. 2022;2022(1371 137):1–30. doi: 10.1140/EPJP/S13360-022-02368-5. [DOI] [Google Scholar]
- Ali A., Islam S., Khan M.R., Rasheed S., Allehiany F.M., Baili J., Khan M.A., Ahmad H. Dynamics of a fractional order Zika virus model with mutant. Alex. Eng. J. 2022;61:4821–4836. doi: 10.1016/J.AEJ.2021.10.031. [DOI] [Google Scholar]
- Ali F., Ahmad Z., Arif M., Khan I., Nisar K.S. A time fractional model of generalized couette flow of couple stress nanofluid with heat and mass transfer: applications in engine oil. IEEE Access. 2020;8:146944–146966. doi: 10.1109/ACCESS.2020.3013701. [DOI] [Google Scholar]
- Arfan M., Shah K., Abdeljawad T., Mlaiki N., Ullah A. A Caputo power law model predicting the spread of the COVID-19 outbreak in Pakistan. Alex. Eng. J. 2021;60:447–456. doi: 10.1016/J.AEJ.2020.09.011. [DOI] [Google Scholar]
- Atangana A. Fractal-fractional differentiation and integration: Connecting fractal calculus and fractional calculus to predict complex system. Chaos, Solitons Fractals. 2017;102:396–406. doi: 10.1016/J.CHAOS.2017.04.027. [DOI] [Google Scholar]
- Atangana A., Baleanu D. New fractional derivatives with nonlocal and non-singular kernel: theory and application to heat transfer model. Therm. Sci. 2016;20:763–769. [Google Scholar]
- Atangana A., İğret Araz S. Modeling and forecasting the spread of COVID-19 with stochastic and deterministic approaches: Africa and Europe. Adv. Differ. Equ. 2021:1–107. doi: 10.1186/S13662-021-03213-2. 2021 20211 2021. [DOI] [PMC free article] [PubMed] [Google Scholar]
- Bendavid E., Oh C., Bhattacharya J., Ioannidis J.P.A. Assessing mandatory stay-at-home and business closure effects on the spread of COVID-19. Eur. J. Clin. Invest. 2021;51 doi: 10.1111/ECI.13484. [DOI] [PMC free article] [PubMed] [Google Scholar]
- Burki T. China’s successful control of COVID-19. Lancet Infect. Dis. 2020;20:1240–1241. doi: 10.1016/S1473-3099(20)30800-8. [DOI] [PMC free article] [PubMed] [Google Scholar]
- Danane J., Allali K., Hammouch Z., Nisar K.S. Mathematical analysis and simulation of a stochastic COVID-19 Lévy jump model with isolation strategy. Results Phys. 2021;23 doi: 10.1016/J.RINP.2021.103994. [DOI] [PMC free article] [PubMed] [Google Scholar]
- Grassly N.C., Pons-Salort M., Parker E.P.K., White P.J., Ferguson N.M., Ainslie K., Baguelin M., Bhatt S., Boonyasiri A., Brazeau N., Cattarino L., Coupland H., Cucunuba Z., Cuomo-Dannenburg G., Dighe A., Donnelly C., van Elsland S.L., FitzJohn R., Flaxman S., Fraser K., Gaythorpe K., Green W., Hamlet A., Hinsley W., Imai N., Knock E., Laydon D., Mellan T., Mishra S., Nedjati-Gilani G., Nouvellet P., Okell L., Ragonnet-Cronin M., Thompson H.A., Unwin H.J.T., Vollmer M., Volz E., Walters C., Wang Y., Watson O.J., Whittaker C., Whittles L., Xi X. Comparison of molecular testing strategies for COVID-19 control: a mathematical modelling study. Lancet Infect. Dis. 2020;20:1381–1389. doi: 10.1016/S1473-3099(20)30630-7. [DOI] [PMC free article] [PubMed] [Google Scholar]
- Grigorieva, E., Khailov, E., Korobeinikov, A., 2020. Optimal quarantine strategies for COVID-19 control models. [DOI] [PMC free article] [PubMed]
- Jin Y., Yang H., Ji W., Wu W., Chen S., Zhang W., Duan G. Virology, Epidemiology, Pathogenesis, and Control of COVID-19. Viruses 2020. 2020;Vol. 12:372. doi: 10.3390/V12040372. 372 12. [DOI] [PMC free article] [PubMed] [Google Scholar]
- Kassa S.M., Njagarah J.B.H., Terefe Y.A. Analysis of the mitigation strategies for COVID-19: From mathematical modelling perspective. Chaos, Solitons Fractals. 2020;138 doi: 10.1016/J.CHAOS.2020.109968. [DOI] [PMC free article] [PubMed] [Google Scholar]
- Khajanchi S., Sarkar K. Forecasting the daily and cumulative number of cases for the COVID-19 pandemic in India. Chaos Interdiscip. J. Nonlinear Sci. 2020;30 doi: 10.1063/5.0016240. [DOI] [PMC free article] [PubMed] [Google Scholar]
- Khajanchi, S., Sarkar, K., Mondal, J., 2020. Dynamics of the COVID-19 pandemic in India. 10.21203/rs.3.rs-27112/v1. [DOI]
- Khajanchi S., Bera S., Roy T.K. Mathematical analysis of the global dynamics of a HTLV-I infection model, considering the role of cytotoxic T-lymphocytes. Math. Comput. Simul. 2021;180:354–378. doi: 10.1016/J.MATCOM.2020.09.009. [DOI] [Google Scholar]
- Khajanchi S., Sarkar K., Mondal J., Nisar K.S., Abdelwahab S.F. Mathematical modeling of the COVID-19 pandemic with intervention strategies. Results Phys. 2021;25 doi: 10.1016/J.RINP.2021.104285. [DOI] [PMC free article] [PubMed] [Google Scholar]
- Khan M.A., Atangana A. Modeling the dynamics of novel coronavirus (2019-nCov) with fractional derivative. Alex. Eng. J. 2020;59:2379–2389. doi: 10.1016/J.AEJ.2020.02.033. [DOI] [Google Scholar]
- Kucharski A.J., Russell T.W., Diamond C., Liu Y., Edmunds J., Funk S., Eggo R.M., Sun F., Jit M., Munday J.D., Davies N., Gimma A., van Zandvoort K., Gibbs H., Hellewell J., Jarvis C.I., Clifford S., Quilty B.J., Bosse N.I., Abbott S., Klepac P., Flasche S. Early dynamics of transmission and control of COVID-19: a mathematical modelling study. Lancet Infect. Dis. 2020;20:553–558. doi: 10.1016/S1473-3099(20)30144-4/ATTACHMENT/60AE6635-8A55-49D0-A2CE-31F41FC9FBA2/MMC1.PDF. [DOI] [PMC free article] [PubMed] [Google Scholar]
- Memon Z., Qureshi S., Memon B.R. Assessing the role of quarantine and isolation as control strategies for COVID-19 outbreak: a case study. Chaos, Solitons Fractals. 2021;144 doi: 10.1016/J.CHAOS.2021.110655. [DOI] [PMC free article] [PubMed] [Google Scholar]
- Murtaza S., Kumam P., Ahmad Z., Seangwattana T., Ali I.E. Numerical Analysis of Newley Developed Fractal-Fractional Model of Casson Fluid with Exponential Memory. Fractals. 2022 doi: 10.1142/S0218348×2240151X. [DOI] [Google Scholar]
- Naik P.A., Yavuz M., Qureshi S., Zu J., Townley S. Modeling and analysis of COVID-19 epidemics with treatment in fractional derivatives using real data from Pakistan. Eur. Phys. J. 2020;2020(13510 135):1–42. doi: 10.1140/EPJP/S13360-020-00819-5. [DOI] [PMC free article] [PubMed] [Google Scholar]
- Nisar K.S., Ahmad S., Ullah A., Shah K., Alrabaiah H., Arfan M. Mathematical analysis of SIRD model of COVID-19 with Caputo fractional derivative based on real data. Results Phys. 2021;21 doi: 10.1016/J.RINP.2020.103772. [DOI] [PMC free article] [PubMed] [Google Scholar]
- Pellis L., Scarabel F., Stage H.B., Overton C.E., Chappell L.H.K., Fearon E., Bennett E., Lythgoe K.A., House T.A., Hall I., Group, U. of M.C.-19 M Challenges in control of COVID-19: short doubling time and long delay to effect of interventions. Philos. Trans. R. Soc. B. 2021;376 doi: 10.1098/RSTB.2020.0264. [DOI] [PMC free article] [PubMed] [Google Scholar]
- Qureshi S., Atangana A. Mathematical analysis of dengue fever outbreak by novel fractional operators with field data. Phys. A Stat. Mech. its Appl. 2019;526 doi: 10.1016/J.PHYSA.2019.121127. [DOI] [Google Scholar]
- Qureshi S., Yusuf A. Modeling chickenpox disease with fractional derivatives: from caputo to atangana-baleanu. Chaos, Solitons Fractals. 2019;122:111–118. doi: 10.1016/J.CHAOS.2019.03.020. [DOI] [Google Scholar]
- Qureshi S., Yusuf A. Fractional derivatives applied to MSEIR problems: Comparative study with real world data. Eur. Phys. J. 2019;2019(1344 134):1–13. doi: 10.1140/EPJP/I2019-12661-7. [DOI] [Google Scholar]
- Qureshi S., Yusuf A. Fractional derivatives applied to MSEIR problems: Comparative study with real world data. Eur. Phys. J. 2019;2019(1344 134):1–13. doi: 10.1140/EPJP/I2019-12661-7. [DOI] [Google Scholar]
- Qureshi S., Bonyah E., Shaikh A.A. Classical and contemporary fractional operators for modeling diarrhea transmission dynamics under real statistical data. Phys. A Stat. Mech. its Appl. 2019;535 doi: 10.1016/J.PHYSA.2019.122496. [DOI] [Google Scholar]
- Qureshi S., Yusuf A., Shaikh A.A., Inc M. Transmission dynamics of varicella zoster virus modeled by classical and novel fractional operators using real statistical data. Phys. A Stat. Mech. its Appl. 2019;534 doi: 10.1016/J.PHYSA.2019.122149. [DOI] [Google Scholar]
- Rai R.K., Khajanchi S., Tiwari P.K., Venturino E., Misra A.K. Impact of social media advertisements on the transmission dynamics of COVID-19 pandemic in India. J. Appl. Math. Comput. 2022;68:19–44. doi: 10.1007/S12190-021-01507-Y/FIGURES/9. [DOI] [PMC free article] [PubMed] [Google Scholar]
- Rajagopal K., Hasanzadeh N., Parastesh F., Hamarash I.I., Jafari S., Hussain I. A fractional-order model for the novel coronavirus (COVID-19) outbreak. Nonlinear Dyn. 2020 1011 101, 711–718. 2020 doi: 10.1007/S11071-020-05757-6. [DOI] [PMC free article] [PubMed] [Google Scholar]
- Samui P., Mondal J., Khajanchi S. A mathematical model for COVID-19 transmission dynamics with a case study of India. Chaos, Solitons Fractals. 2020;140 doi: 10.1016/J.CHAOS.2020.110173. [DOI] [PMC free article] [PubMed] [Google Scholar]
- Sánchez Y.G., Sabir Z., Guirao J.L.G. Des. a Nonlinear Sitr Fractal Model Based Dyn. a Nov. Corona (COVID-19) 2020;12 doi: 10.1142/S0218348×20400265. [DOI] [Google Scholar]
- Sarkar K., Khajanchi S., Nieto J.J. Modeling and forecasting the COVID-19 pandemic in India. Chaos, Solitons Fractals. 2020;139 doi: 10.1016/J.CHAOS.2020.110049. [DOI] [PMC free article] [PubMed] [Google Scholar]
- Sene N. SIR epidemic model with Mittag–Leffler fractional derivative. Chaos, Solitons Fractals. 2020;137 doi: 10.1016/J.CHAOS.2020.109833. [DOI] [PMC free article] [PubMed] [Google Scholar]
- Shah K., Abdeljawad T., Mahariq I., Jarad F., Deniz S. Qualitative Analysis of a Mathematical Model in the Time of COVID-19. Biomed. Res. Int. 2020:2020. doi: 10.1155/2020/5098598. [DOI] [PMC free article] [PubMed] [Google Scholar]
- Shaikh A.S., Shaikh I.N., Nisar K.S. A mathematical model of COVID-19 using fractional derivative: outbreak in India with dynamics of transmission and control. Adv. Differ. Eqs. 2020;2020:1–19. doi: 10.1186/S13662-020-02834-3/FIGURES/6. [DOI] [PMC free article] [PubMed] [Google Scholar]
- Sharomi O., Malik T. Optimal control in epidemiology. Ann. Oper. Res. 2017;251:55–71. doi: 10.1007/S10479-015-1834-4. [DOI] [Google Scholar]
- Shatanawi W., Abdo M.S., Abdulwasaa M.A., Shah K., Panchal S.K., Kawale S.V., Ghadle K.P. A fractional dynamics of tuberculosis (TB) model in the frame of generalized Atangana–Baleanu derivative. Results Phys. 2021;29 doi: 10.1016/J.RINP.2021.104739. [DOI] [Google Scholar]
- Sinan M., Shah K., Kumam P., Mahariq I., Ansari K.J., Ahmad Z., Shah Z. Fractional order mathematical modelling of typhoid fever disease. Results Phys. 2021;32 doi: 10.1016/j.rinp.2021.105044. [DOI] [Google Scholar]
- Sinan M., Ahmad H., Ahmad Z., Baili J., Murtaza S., Aiyashi M.A., Botmart T. Fractional mathematical modeling of malaria disease with treatment & insecticides. Results Phys. 2022;34 doi: 10.1016/J.RINP.2022.105220. [DOI] [Google Scholar]
- Singh H., Srivastava H.M., Hammouch Z., Sooppy Nisar K. Numerical simulation and stability analysis for the fractional-order dynamics of COVID-19. Results Phys. 2021;20 doi: 10.1016/J.RINP.2020.103722. [DOI] [PMC free article] [PubMed] [Google Scholar]
- Tiwari P.K., Rai R.K., Khajanchi S., Gupta R.K., Misra A.K. Dynamics of coronavirus pandemic: effects of community awareness and global information campaigns. Eur. Phys. J. 2021;2021(13610 136):1–23. doi: 10.1140/EPJP/S13360-021-01997-6. [DOI] [PMC free article] [PubMed] [Google Scholar]
- Toufik M., Atangana A. New numerical approximation of fractional derivative with non-local and non-singular kernel: application to chaotic models. Eur. Phys. J. 2017;2017(13210 132):1–16. doi: 10.1140/EPJP/I2017-11717-0. [DOI] [Google Scholar]
- United States Population (2021) - Worldometer [WWW Document], n.d. URL https://www.worldometers.info/world-population/us-population/ (Accessed 9 February 2021).
- Van Den Driessche P., Watmough J. Reproduction numbers and sub-threshold endemic equilibria for compartmental models of disease transmission. Math. Biosci. 2002;180:29–48. doi: 10.1016/S0025-5564(02)00108-6. [DOI] [PubMed] [Google Scholar]
- Van Den Driessche P., Watmough J. Reproduction numbers and sub-threshold endemic equilibria for compartmental models of disease transmission. Math. Biosci. 2002;180:29–48. doi: 10.1016/S0025-5564(02)00108-6. [DOI] [PubMed] [Google Scholar]
- Wu J.T., Leung K., Bushman M., Kishore N., Niehus R., de Salazar P.M., Cowling B.J., Lipsitch M., Leung G.M. Estimating clinical severity of COVID-19 from the transmission dynamics in Wuhan, China. Nat. Med. 2020;2020(264 26):506–510. doi: 10.1038/s41591-020-0822-7. [DOI] [PMC free article] [PubMed] [Google Scholar]
- Yadav R.P., Renu V. A numerical simulation of fractional order mathematical modeling of COVID-19 disease in case of Wuhan China. Chaos Solitons Fractals. 2020;140 doi: 10.1016/j.chaos.2020.110124. Epub 2020/08/25. PubMed PMID: 32834636; PubMed Central PMCID: PMCPMC7365131. [DOI] [PMC free article] [PubMed] [Google Scholar]
- Yavuz M., Özdemir N. Comparing the new fractional derivative operators involving exponential and Mittag-Leffler kernel. Discret. Contin. Dyn. Syst. - S. 2019;2020:995. doi: 10.3934/DCDSS.2020058. Vol. 13, Pages 995-1006 13. [DOI] [Google Scholar]
- Yusuf A., Qureshi S., Feroz Shah S. Mathematical analysis for an autonomous financial dynamical system via classical and modern fractional operators. Chaos, Solitons Fractals. 2020;132 doi: 10.1016/J.CHAOS.2019.109552. [DOI] [Google Scholar]
- Zamir M., Shah Z., Nadeem F., Memood A., Alrabaiah H., Kumam P. Non pharmaceutical interventions for optimal control of COVID-19. Comput. Methods Prog. Biomed. 2020;196 doi: 10.1016/J.CMPB.2020.105642. [DOI] [PMC free article] [PubMed] [Google Scholar]
- Zhao S., Chen H. Modeling the epidemic dynamics and control of COVID-19 outbreak in China. Quant. Biol. (Beijing, China) 2020;8:1. doi: 10.1007/S40484-020-0199-0. [DOI] [PMC free article] [PubMed] [Google Scholar]


