

Abstract
Concerns that infection with severe acute respiratory syndrome coronavirus 2 (SARS-CoV-2), the etiological agent of coronavirus disease 2019 (COVID-19), may cause new-onset diabetes persist in an evolving research landscape, and precise risk assessment is hampered by, at times, conflicting evidence. Here, leveraging comprehensive single-cell analyses of in vitro SARS-CoV-2-infected human pancreatic islets, we demonstrate that productive infection is strictly dependent on the SARS-CoV-2 entry receptor ACE2 and targets practically all pancreatic cell types. Importantly, the infection remains highly circumscribed and largely non-cytopathic and, despite a high viral burden in infected subsets, promotes only modest cellular perturbations and inflammatory responses. Similar experimental outcomes are also observed after islet infection with endemic coronaviruses. Thus, the limits of pancreatic SARS-CoV-2 infection, even under in vitro conditions of enhanced virus exposure, challenge the proposition that in vivo targeting of β cells by SARS-CoV-2 precipitates new-onset diabetes. Whether restricted pancreatic damage and immunological alterations accrued by COVID-19 increase cumulative diabetes risk, however, remains to be evaluated.
Keywords: SARS-CoV-2, COVID-19, human coronaviruses, type 1 diabetes, type 2 diabetes, viral infection, pancreas, human islets
Graphical abstract
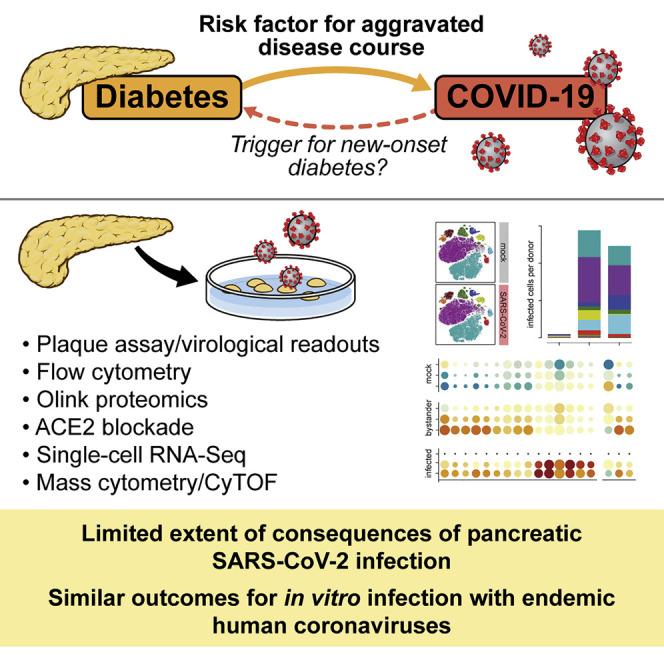
Assessing the risk of SARS-CoV-2-induced new-onset diabetes requires integration of multiple complementary lines of investigation. Here, van der Heide et al. demonstrate that the specific limits of in vitro pancreatic SARS-CoV-2 infection suggest at best a minor, if any, role of virus-induced β cell damage directly promoting new-onset diabetes.
Introduction
Ever since its prominent introduction in mid-2020, the concept of a “bidirectional relationship” between coronavirus disease 2019 (COVID-19) and diabetes (Rubino et al., 2020) has been widely embraced, quoted, and elaborated upon, conveying an impression of comparable evidentiary weight for both terms of the equation. However, this would not appear to be the case. Broad and compelling evidence now supports the notion of diabetes and hyperglycemia as risk factors for an aggravated COVID-19 course (Dennis et al., 2021; Lazarus et al., 2021; Sardu et al., 2020; Wu et al., 2020; Zhu et al., 2020). In contrast, the proposition of severe acute respiratory syndrome coronavirus 2 (SARS-CoV-2) infection as a trigger for new-onset diabetes has to contend with seemingly conflicting evidence regarding increased diabetes incidence rates during the COVID-19 pandemic as well as the considerable difficulties to distinguish an infectious diabetes origin from a multiplicity of pandemic-related but indirect potential causalities (Barrett et al., 2022; Drucker, 2021; Ibrahim et al., 2021; Kamrath et al., 2022; Khunti et al., 2021; Sathish et al., 2021). Although the aggregate epidemiological evidence ostensibly argues against a direct diabetogenic potential of SARS-CoV-2 infection, this assessment is certainly provisional in consideration of the manifold ramifications of pandemic containment measures, the evolving landscape of clinical studies, various diagnostic challenges (e.g., a precise clinical definition of diabetes, previously undiagnosed type 1 or 2 diabetes [T1D or T2D, respectively]), the different pathophysiological mechanisms promoting acute and/or prolonged glycometabolic perturbations (including hyperglycemia and insulin resistance typically associated with critical illness), and the possibility that a history of SARS-CoV-2 infection may alter diabetes incidence rates in the future (Al-Aly et al., 2021; Clarke et al., 2021; Drucker, 2021; Ibrahim et al., 2021; Jivanji et al., 2017; Kamrath et al., 2022; Li et al., 2020a; Misra et al., 2021; Montefusco et al., 2021; Reiterer et al., 2021). However, in the current context, a balanced evaluation of the available evidence also has to inform and delimit any speculation about the precise relevance of ex vivo and in vitro studies seeking to elucidate the potential for β cell infection, incapacitation, and/or destruction by SARS-CoV-2 (Accili, 2021; Atkinson and Powers, 2021).
Viral infections have long been hypothesized to play a role in T1D pathogenesis (Coppieters et al., 2012; Rodriguez-Calvo et al., 2016) and, to a lesser extent, may also contribute to development of T2D (Turk Wensveen et al., 2021). But more often than not, tantalizing speculations regarding the potential diabetogenicity of specific viruses have not stood the test of time. A balanced assessment of the risk for SARS-CoV-2-induced diabetes has to integrate emerging epidemiological observations with complementary evidence from studies interrogating expression patterns of viral entry factors in the human pancreas, the histopathology of COVID-19 pancreata, susceptibility of pancreatic tissue to in vitro SARS-CoV-2 infection, and novel animal models (Coate et al., 2020; Fignani et al., 2020; Hikmet et al., 2020; Kusmartseva et al., 2020; Muller et al., 2021; Qadir et al., 2021; Steenblock et al., 2021; Tang et al., 2021; Wu et al., 2021; Yang et al., 2020). Work performed to this extent has, at times, generated conflicting results that, in turn, prompted notably divergent predictions about the potential risk for new-onset diabetes (Drucker, 2021; Ibrahim et al., 2021; Qadir et al., 2021; Steenblock et al., 2021; Tang et al., 2021; Wu et al., 2021). In the present study, we conducted comprehensive transcriptomic and proteomic single-cell analyses of in vitro SARS-CoV-2-infected primary human islets. Our results confirm the principal susceptibility of the exocrine and endocrine pancreas, including β cells, to in vitro SARS-CoV-2 infection (Muller et al., 2021; Shaharuddin et al., 2021; Tang et al., 2021; Wu et al., 2021; Yang et al., 2020). However, the mechanistic constraints, circumscribed extent, and limited consequences of viral infection in this model, as well as its shared aspects with endemic coronavirus infections, challenge the notion that direct SARS-CoV-2 targeting of β cells can promote acute diabetes onset.
Results
Productive but limited SARS-CoV-2 infection of primary human pancreatic islets
To evaluate the permissiveness of human pancreatic islet cells to in vitro SARS-CoV-2 infection, we employed a protocol with low multiplicity of infection (MOI) that reliably infects 90% or more of susceptible Vero-E6 cells, as revealed by flow cytometry (FC) detection of the viral nucleoprotein (NP) (Figures S1A and S1B). We consider use of a low MOI to be of particular importance because a surfeit of viral particles (including defective viral genomes and structural components with disrupted stoichiometry in viral stock preparations) potentiate interactions via pathogen-associated molecular patterns (PAMPs) that may promote enhanced interferon (IFN) responses and cytopathic effects (CPEs) (Blanco-Melo et al., 2020; Daniloski et al., 2021; Miorin et al., 2020; Vignuzzi and Lopez, 2019). A pertinent case in point is the observation that treatment of islets with recombinant SARS-CoV-2 spike (S) protein (i.e., in the absence of infection), causes β cell death (Wu et al., 2021). In our experiments, SARS-CoV-2 infected ∼2.5% of islet cells, and despite considerable donor variability, β cells (insulin [INS]+) were preferentially targeted over α cells (glucagon [GCG]+), whereas INS−GCG− “other” cells displayed intermediate infection levels (Figure 1A). This pattern appears to segregate with the overall extent of infection because viral antigen was preferentially detected in β or “other” cells in donors with above- or below-average infection, respectively (Figure 1B).
Figure 1.

Productive but limited SARS-CoV-2 infection of human islet cell populations
(A) Left: gating strategy for identification of α (GCG+), β (INS+), and “other” (GCG−INS−) cells; adjacent plots depict SARS-CoV-2 NP staining of the indicated subsets in 48-h mock- and SARS-CoV-2-infected samples. Right: frequencies of SARS-CoV-2 NP+ islet cell subsets (n = 7 donors).
(B) SARS-CoV-2 infection of all islet cells and donor stratification according to higher (>2.5% of total cells) and lower (<2.5%) extent of infection.
(C) Infectious virus titers in TCS (initial inoculum, 4 × 10⁴ plaque-forming units (PFUs)/mL; 48-h culture; dotted line, limit of detection [LOD] = 67 PFU/mL; n = 6 donors).
(D) SARS-CoV-2 infection of islet cell subsets after 48-h and 120-h culture (n = 4 donors).
(E and F) Quantification of secreted proteins in UV-inactivated TCS of 48-h mock- or SARS-CoV-2-infected samples (NPX, normalized protein expression; n = 6 donors).
(G) Gating strategy for distinction of live and dead islet cells.
(H) Frequencies of live and dead SARS-CoV-2 NP+ islet cell subsets (48-h culture, n = 4 donors).
(I) Survival of islet cells distinguished according to infection condition and absence/presence of viral NP (n = 4 donors).
(J) INS expression levels (geometric mean of fluorescence intensity [GMFI]) by NP− and NP+ beta cells were normalized to respective INS GMFI values in donor-matched mock-infected cultures (n = 6 donors). All summary bar diagrams represent mean ± SD and scatter for indicated number of donors; statistical analyses were conducted by paired t test or repeated measures ANOVA with Tukey’s multiple comparisons (asterisks) or non-parametric Friedman test (hashtags) where applicable (∗ or #, p < 0.05; ∗∗ or ##, p < 0.01; ∗∗∗, p < 0.001).
All summary bar diagrams represent mean ± SD and scatter for the indicated number of donors; statistical analyses were conducted by paired t test or repeated-measures ANOVA with Tukey’s multiple comparisons where applicable (#, non-parametric Friedman test).
Islet infection proved productive, based on elevated infectious SARS-CoV-2 titers in the tissue culture supernatant (TCS) (Figure 1C) but without apparent infection enhancement after prolonged SARS-CoV-2 exposure (Figure 1D). The latter aspect is consistent with other reports (Muller et al., 2021; Tang et al., 2021; Wu et al., 2021) and provides a rationale to focus our subsequent analyses on the earlier 48-h time point. Here, a broad assessment of inflammation-associated TCS proteins (92 analytes) revealed a notably restrained inflammatory response involving the chemokines CXCL10 and CXCL11 (previously implicated in T1D pathogenesis; Christen and Kimmel, 2020; Homann, 2015) but only marginal levels of IFNγ (a potent inducer of CXCL10/11) and minor downregulation of multiple proteins associated positively and negatively with β cell survival and diabetes development (Bhandage et al., 2018; Hanson et al., 2014; Kondegowda et al., 2015; Liadis et al., 2007; Mellado-Gil et al., 2011; Vendrell and Chacon, 2013; Figures 1E and 1F).
SARS-CoV-2 infection of human islets is largely non-cytopathic
Human islet culture is inevitably associated with noticeable cellular death (Paraskevas et al., 2000) that needs to be distinguished from virus-induced CPEs. Accordingly, we determined the viral burden in live and dead islet cells after mock versus SARS-CoV-2 infection using amine-reactive dyes that label dead cells regardless of effector mechanisms operative in regulated cell death (Galluzzi et al., 2018; Perfetto et al., 2010). Although SARS-CoV-2 NP detection was comparatively reduced in dead β cells, no significant differences were observed for live and dead α or “other” cells (Figures 1G and 1H). Similarly, cell death among matched mock-infected and NP− “bystander” and NP+ infected cell subsets was equivalent in the respective α and “other” cell compartments and tentatively decreased for NP+ β cells (Figure 1I), arguing against pronounced CPEs in SARS-CoV-2-infected islet cells. Nevertheless, non-cytopathic viral infections may perturb cellular “luxury” functions (Oldstone et al., 1982), and we noted a small but significant reduction of INS content specifically in infected β cells that is driven in part by lower INS expression in the dead cell compartment (Figure 1J).
ACE2 expression by pancreatic islet cells: Challenges and caveats for FC-based detection
Productive SARS-CoV-2 infection is contingent on expression of multiple proviral host factors, including the obligate SARS-CoV-2 entry receptor ACE2 (Baggen et al., 2021; Beumer et al., 2021). To incorporate ACE2 detection into our assay platform, we employed a previously FC-validated antibody (polyclonal goat AF933; Rathnasinghe et al., 2020b) noteworthy for its excellent performance and specificity in immunohistochemistry assays and immunoblotting of pancreatic protein extracts (Kusmartseva et al., 2020). Here, ACE2 was detected, on average, on 4%–5% of live α, β, and “other” cells, but an important caveat pertains to the fact that AF933 binds to dead cells, an unexpected property also observed for another polyclonal goat ACE2 antibody (Poly5036) (Figures S1C and S1D). We therefore demarcated stages of islet cell apoptosis and observed a relative increase in AF933 binding to early apoptotic β but not α or “other” cells; in contrast, nearly all late apoptotic and necrotic cells reacted with AF933 (Figures S1E and S1F).
Productive SARS-CoV-2 infection of islet cells is strictly ACE2 dependent
The above caveats notwithstanding, AF933 has been shown previously to block entry of SARS-CoV-2-S-pseudotyped vesicular stomatitis virus (Hoffmann et al., 2020), providing an opportunity to functionally interrogate the role of ACE2 in SARS-CoV-2 infection of human islets. To this end, we defined the half-maximal inhibitory concentration (IC50) for AF933 on SARS-CoV-2-infected Vero-E6 cells (<10 μg/mL) (Figures S2A and S2B) and found that ACE2 blockade effectively prevents infection of α, β, and “other” cells (Figures 2A, 2B, and S2C). At the level of viral NP detection, we observed 96% infection inhibition for β and 94% inhibition for “other” cells (Figure 2C). ACE2 blockade also reduced infectious virus titers by 99.6% (Figure 2D), but the accompanying inflammatory response profile was surprising (Figure 2E). We first compared TCS protein expression levels from SARS-CoV-2 infections conducted in the absence (cf. Figures 1E and 1F) or presence of immunoglobulin G (IgG) control antibody and, predictably, recorded no differences. In contrast, ACE2 blockade potentiated secretion of chemokines (CXCL9/10 > CXCL11, CCL8 > CXCL5/6, CCL3/11/20), inflammatory cytokines (interleukin [IL]-1A, IL-17C, tumor necrosis factor alpha [TNF-α], and OSM [oncostatin M]) and 4E-BP1 without a concomitant reduction in other analytes (Figure 2E). This pattern may be explained by the robust induction of IFNγ (Figure 2E), likely in response to PAMP-mediated interactions that, in the context of ACE2 blockade, are no longer antagonized by the products of viral replication.
Figure 2.

Stringent ACE2 requirement for pancreatic islet cell infection with SARS-CoV-2
(A) Representative contour plots gated on live α, β, and “other” cells pre-treated with IgG (irrelevant polyclonal goat antibody AF7197) or the anti-ACE2 blocking antibody AF933 prior to SARS-CoV-2 infection (48 h).
(B) Summary of SARS-CoV-2 NP expression by live islet cell subsets as a function of IgG treatment or ACE2 blockade (n = 6 donors).
(C) Percent infection inhibition for β and “other” cells (inhibition for α cells is not shown because the very low extent of α cell infection in IgG-treated cultures for 2 of 6 donors substantially skews such calculations).
(D) Infectious SARS-CoV-2 titers and extent of infection inhibition following ACE2 blockade (n = 3 donors).
(E) Quantification of chemokines and cytokines in UV-inactivated TCS of SARS-CoV-2-infected islet cell cultures under conditions of IgG treatment or ACE2 blockade (48-h infection, n = 3 donors).
(F) Infectious SARS-CoV-2 titers in TCS as a function of glucose concentration in islet culture medium (n = 3 donors).
(G) Quantification of CXCL10 and CXCL11 in TCS as a function of glucose concentration. All summary bar diagrams represent mean ± SD and scatter for the indicated number of donors; statistical analyses were conducted by paired t test or repeated-measures ANOVA with Tukey’s multiple comparisons where applicable (∗, p < 0.05; ∗∗, p < 0.01; ∗∗∗, p < 0.001).
All summary bar diagrams represent mean ± SD and scatter for the indicated number of donors; statistical analyses were conducted by paired t test or repeated-measures ANOVA with Tukey’s multiple comparisons where applicable.
No effect of glucose concentration on SARS-CoV-2 islet cell infectivity
The possibility that hyperglycemia may facilitate SARS-CoV-2 infection was raised in a study using human monocytes cultured under conditions of escalating glucose concentration (Codo et al., 2020). In our experiments, however, glucose concentration was correlated inversely with ACE2 expression, particularly in β cells, and with SARS-CoV-2 infection of Vero-E6 cells (Figures S2D and S2E). For islets adapted to and maintained at varying glucose levels, however, no significant differences emerged at the level of cellular viral burden, infectious SARS-CoV-2 titers, or composition of inflammatory response parameters (Figures 2F, 2G, S2G, and S2H). We further considered living pancreas slices as a more “physiological” experimental platform (Marciniak et al., 2014; Panzer et al., 2020), but specific culture conditions, in particular low temperature (≤30°C) and need for supplementation with protease inhibitors to maintain tissue integrity, pose a significant challenge to such studies (Figure S2I). Successful implementation may require cold adaptation of the virus and judicious use of protease inhibitors to avoid interference with viral entry/replication.
Single-cell transcriptomics of SARS-CoV-2-infected islet cells
To delineate transcriptional changes imparted by in vitro SARS-CoV-2 infection, we performed single-cell RNA sequencing (scRNA-seq) of matched mock- and virus-infected islets from three donors. Cell types were annotated by label transfer from public scRNA-seq datasets (Baron et al., 2016; Grun et al., 2016; Lawlor et al., 2017; Muraro et al., 2016; Segerstolpe et al., 2016; Stuart et al., 2019), which readily demarcated pancreatic cell subsets consistent across samples from all donors (Figures 3A and S3A). Within SARS-CoV-2-infected samples, cells were classified as “infected,” “bystander,” or “not assigned,” based on unsupervised clustering of SARS-CoV-2 viral RNAs (Figures 3A and S3B). Infected cells had significantly fewer host-derived transcript unique molecular identifiers (UMIs) per cell, fewer host genes detected per cell, and up to 75% of total sampled transcripts derived from viral genes (Figure S3C). Accordingly, we observed a reduction in cell type label transfer prediction scores for infected cells, likely as a consequence of virus-induced suppression of host transcription; nevertheless, annotated cell types expressed canonical marker genes across samples (Figures S3D and S4A; Table S2).
Figure 3.

scRNA-seq analysis of pancreatic islets infected in vitro with SARS-CoV-2
(A) UMAP (Uniform Manifold Approximation and Projection) of 21,728 single cells integrated across samples from 3 donors, each infected or mock-infected with SARS-CoV-2. Points are colored by assigned cell type (left) or assigned infection state (right).
(B) Relative cell type composition of each sample, with total number of cells per sample indicated at the top.
(C) Number of infected cells per donor (SARS-CoV-2-infected samples only) by cell type.
(D) Differentially expressed genes in pairwise comparisons between infected, bystander, or mock-infected β cells; selected genes have an adjusted p value of less than 0.01 and absolute log2 fold change greater than log2(1.5) in any contrast within any donor. Dot size indicates the percentage of β cells in the indicated donor and infection state expressing the gene; dot color indicates the average expression of that gene in β cells scaled across infection state within each donor. Filled boxes (below) indicate gene membership in the indicated hallmark gene sets. For infected cells, additional annotation (right) indicates the percentage of β cells infected per donor, and the violin plot indicates percent of all detected transcripts identified as viral transcripts per cell. Because of insufficient numbers of infected β cells in donor 1, this sample was excluded from differential expression contrasts involving infected cells.
Despite variable cell subset distribution across donors, we found no significant differences in cell type proportions (as annotated by cell type transfer) between infection conditions per donor (Figure 3B), and, in agreement with our earlier observations, infection assessed at the transcriptional level varied among donors and, overall, was rather limited (donors 1–3: infection of 0.2%, 2.0%, and 3.4% of cells, respectively; Figure 3C). Differential expression testing between infected, bystander, and mock cells revealed broad downregulation of numerous transcripts in infected α cells (Table S3). In β cells, multiple IFN-stimulated genes (ISGs) were significantly induced in infected and bystander cells; we also observed significant induction of nuclear factor κB (NF-κB)-regulated genes associated with cellular stress in infected cells (Figure 3D; Table S4), consistent with a previous report (Nilsson-Payant et al., 2021). Module scores for “IFN alpha response,” “IFN gamma response,” and “TNF-⍺ signaling via NF-κB” Hallmark gene sets exhibited similar patterns (Figure S4B). Thus, in vitro SARS-CoV-2-infected β cells express ISGs and stress response genes, and the strength of the bystander ISG response appears to be directly related to the extent of SARS-CoV-2 infection.
Mass cytometry-based annotation and characterization of pancreatic cell subsets
To provide greater proteomic detail about pancreatic cell types targeted by SARS-CoV-2 infection, we built a novel mass cytometry (MC) staining panel and employed a combination of hierarchical manual gating and t-distributed stochastic neighbor embedding (tSNE) strategies for identification/characterization of pancreatic cell subsets. Figures 4A–4C and S5A–S5E summarize the pertinent aspects of our approach. After analytical exclusion of hematopoietic cells (∼40% of which are macrophages; Figure S5A), our analysis pipeline permits stepwise distinction of all endocrine cells according to respective hormone expression; emphasizes their shared and distinctive phenotypes at the level of CD9, CD26, CD141, and TM4SF4 expression; and demarcates CD34+CD31+ endothelial cells (ECs) and HPd3+ ductal cells co-expressing CD133, TSPAN8, and CD26 (Figure 4A; see below).
Figure 4.

MC-based pancreatic cell annotation and quantification of SARS-CoV-2 infection
(A) Hierarchical gating strategy for identification of major pancreatic cell subsets. Starting with a distinction of α (GCG+) and β (proinsulin [proINS]+) cells (top row, center), the panel represents a flow chart where demarcated regions and associated arrows connect successive plots to designate and characterize pancreatic cell populations (PPY, pancreatic polypeptide; SST, somatostatin; GHRL, ghrelin). Regions, arrows, and cell type names rendered in blue highlight final cell annotations. Red regions/arrows refer to subsets selected for further phenotypic stratification. The bottom left and right plots with a gray background feature comparative α and β cell properties.
(B) Left: tSNE visualization of pancreatic cell populations in 48-h mock- and SARS-CoV-2-infected samples. Right: relative abundance of non-hematopoietic pancreatic cell subsets in mock- and SARS-CoV-2-infected samples (n = 5 donors).
(C) Left: co-detection of SARS-CoV-2-S/NP in live non-hematopoietic cells. Center: distribution of viral burden visualized by projection onto tSNE plots. Right: α-like, β-like, and unannotated cell projections onto tSNE clusters and associated viral burden (viral infection of other cell types are excluded here).
(D) Representative SARS-CoV-2-S and -NP expression in mock- and SARS-CoV-2-infected pancreatic cell types (48-h culture).
(E) Extent of SARS-CoV-2 infection in all pancreatic cell types (dotted line, average infection extent for all non-hematopoietic cells; n = 5 donors; asterisks indicate statistical differences calculated between mock- and SARS-CoV-2-infected samples by paired t test; ∗, p < 0.05; ∗∗, p < 0.01).
(F) Relative distribution of the viral burden across pancreatic cell subsets.
Further stratification of non-endocrine/non-ductal cells proved more challenging because canonical subset markers could not always be robustly visualized. Nevertheless, CD61 expression captures CD34+ adventitial cells (ACs) and CD34− pericytes (Figures S5B and S5C), and acinar cells are distinguished by their CD13+CD44+CD49b+CD49f+ phenotype (Figure 4A). Projection of the non-acinar CD13− subset onto tSNE clusters (Figures 4A and 4C) and extended phenotypic and transcription factor (TF) analyses (Rahman and Homann, 2020; Figures S5D and S5E) identified two small endocrine subsets resembling α and β cells, respectively, despite low or absent GCG or proINS expression. Last, 3%–4% of non-hematopoietic cells remained unannotated but likely harbor so far unspecified endocrine cell types (Figures 4A, 4C, S5D, and S5E).
Identification and quantification of cellular targets of SARS-CoV-2 infection
Using an expanded MC panel that permits concurrent visualization of viral NP and S proteins (Figure S5F), we compared single-cell populations from donor-matched mock- and SARS-CoV-2-infected islet cultures. The relative abundance of all cell subsets was comparable across donors and remained unaltered by SARS-CoV-2 exposure, consistent with absence of gross infection-associated subset depletion (Figure 4B). In infected samples, 3.1% ± 0.6% (SEM) of non-hematopoietic cells contained detectable SARS-CoV-2 S and/or NP proteins (S/NP+) distributed across all pancreatic cell types (Figures 4C–4E). Specifically, less than 1% of α, γ (pancreatic polypeptide+), ε (ghrelin+), acinar, and ductal cells carried viral antigen; a low extent of infection was also observed for α-like cells (1.2% ± 0.4%), δ cells (1.4% ± 0.3%), and ECs (1.8% ± 0.6%), with the infected β cell fraction (3.1% ± 0.8%) comparable with overall infected cell frequencies. The major targets of SARS-CoV-2 infection, however, were ACs, pericytes, and β-like cells, of which ∼20%–25% were infected. In addition, ∼5% of unannotated cells also harbored viral antigens (Figures 4D and 4E). Considering relative abundance and differential infection extent for all pancreatic cell types, the viral burden is primarily distributed across β and β-like cells as well as ACs, pericytes, α cells, and unannotated cells (Figure 4F).
Two additional observations are noteworthy. First, many cell types featured subsets with absent S and intermediate NP expression (S−NPint). This likely reflects less efficient virus replication kinetics rather than suboptimal S protein staining because infected ACs and pericytes, similar to Vero-E6 cells, largely co-expressed S/NP proteins at higher levels (Figures 4D and S5F). Second, 2.4% ± 0.9% of hematopoietic cells carried viral antigen; found almost exclusively in macrophages, its acquisition through infection or phagocytosis cannot be distinguished here (Figures 4D and 4E). Our results arguably provide the most detailed stratification of human islet cells in suspension to date and precisely demarcate their differential permissiveness to in vitro SARS-CoV-2 infection.
SARS-CoV-2 infection of islet cells imparts modest phenotypic alterations
Leveraging the high dimensionality of MC, we proceeded to assess phenotypic alterations imparted by SARS-CoV-2 exposure. Infection of major endocrine cells modestly downregulated expression of respective signature hormones without causing a “bystander effect” (i.e., no difference in S/NP− versus mock-infected cells; Figure 5A). Further stratification into NPint and NPhi compartments allowed us to associate reduced hormone expression particularly with high NP content (Figures 5B and S6A), a likely corollary of host transcriptional suppression, as discussed above. This phenomenon is most prominently evidenced by a significant reduction in human leukocyte antigen (HLA)-ABC expression in virus-infected cells across all endocrine cell types, ACs, pericytes, and ductal cells (Figures 5B–5D and S6B). Interestingly, a trend toward increased HLA-ABC expression by S/NP− cells is a consistent feature for all cell types (Figures 5C and 5D) and constitutes the only example of a modest “bystander effect” at the protein level. In contrast, no differential regulation was observed for HLA-II expression by ductal cells, identified here as the major non-hematopoietic HLA-DR+ cell type in the pancreas (Figure 5D).
Figure 5.

Phenotypic alterations of SARS-CoV-2-infected islet cells
(A) Normalized hormone expression by α, β, γ, and δ cells, comparing respective GMSI (geometric mean of signal intensity) values in S/NP+ (red) and S/NP− (red/gray hatched) cell fractions of infected cultures with matched populations from mock-infected cultures (gray).
(B) MC contour plots are gated on S/NP+ α cells (top) or β cells (bottom) and depict expression of viral S protein (left), respective hormone content (center), and HLA-ABC expression levels (right) as a function of viral NP expression level (NPint versus NPhi).
(C) Modulation of HLA-ABC expression levels in major pancreatic cell subsets in response to SARS-CoV-2 infection.
(D) Identification of ductal cells as the major HLA-DR-expressing pancreatic cell subset, distribution of the viral burden in relation to HLA-ABC/HLA-DR expression (values indicate percentage HLA-DR+ cells), and summary of HLA expression regulation as a function of SARS-CoV-2 infection and viral S/NP expression.
(E) Phenotypic alteration of ACs and α cells by SARS-CoV-2 infection.
(F) β Cell TF expression across mock-infected and infected S/NP− and S/NP+ populations.
All bar diagrams represent mean ± SD and scatter of 4–7 donors (B–E) or 3–4 donors (F); statistics were calculated by repeated-measures ANOVA (∗, p<0.05; ∗∗, p < 0.01; ∗∗∗, p < 0.001).
A broad survey of major phenotypic markers illustrates a more general pattern: absence of a “bystander effect” at the protein level and maintenance or a trend toward downregulation in infected cell subsets, consistent with our speculation that viral transcription/translation interference is buffered by differential protein expression half-lives (Figures S6C and S6D). Such downregulation may also affect cellular “signature” markers (AC-expressed SUSD2, α cell-expressed CD26/TM4SF4) and TFs, including those preferentially restricted to β cells (PDX1/NKX6.1) (Figures 5E and 5F). A notable exception is the increase in CD9 expression by infected endocrine cells (Figure S6E). Despite its prominent description as a β cell subset marker (Dorrell et al., 2016), its role in pancreatic endocrine cell biology remains unclear, and neither CD9 overexpression nor knockout altered differentiation, maturation, or function of human pluripotent stem cell-derived β cells (Li et al., 2020b).
SARS-CoV-2 infection, “bihormonal” endocrine cells, and auxiliary receptor expression
Tang et al. (2021) recently advanced the intriguing possibility that SARS-CoV-2 infection of β cells may cause transdifferentiation, as suggested by reduced INS content and induction of α (e.g., GCG) and acinar cell markers in more than 30% of β cells. Our own results, however, do not support this conclusion. Quantification of α and acinar cell markers in all proINS+ cells showed no significant differences in infected, bystander, and mock-treated subsets (Figure S7A). Additional co-expression analyses indicated that ∼3% of proINS+ cells expressed GCG regardless of viral infection; the extent of viral infection in GCG− and GCG+ proINS+ cell subsets was commensurate, and virus-infected GCG+proINS+ cells presented with a significant reduction in GCG content and slightly diminished TM4SF4 and unaltered CD26 levels (Figures S7B and S7C). In the absence of “bystander effects,” these observations are consistent with overall disruption of host gene transcription/translation in infected cell subsets.
Three recent publications reported that several virus receptors (CD26, CD71, and NRP1) are preferentially expressed by β cells, providing a potential explanation for their increased SARS-CoV-2 permissiveness (Steenblock et al., 2021; Tang et al., 2021; Wu et al., 2021). However, in agreement with in situ immunostaining studies (Augstein et al., 2015), CD26 was detected on α and ductal but not β cells (Figures 4A, S7D, and S7E) and, despite initial speculation (Li et al., 2020c), is not a likely target for SARS-CoV-2 binding (Baggen et al., 2021; Beumer et al., 2021; Hoffmann et al., 2020; Schneider et al., 2021). We similarly could not confirm differential CD71 expression by α and β cells (Wu et al., 2021) because both cell types presented with the same low CD71 levels (Figures S7D and S7F). Regarding NRP1 (Cantuti-Castelvetri et al., 2020; Daly et al., 2020), our scRNA-seq- and MC-based analyses demonstrated little expression by α or β cells; rather, NRP1 was preferentially expressed by CD61+ cells that included ECs, ACs, and pericytes (Figures S7D and S7G). Thus, additional host factors likely contribute to preferential SARS-CoV-2 targeting of β and β-like cells but also ACs and pericytes, for which we did not observe enhanced infection in the respective NRP1+ compartments (Figure S7G).
Infection of pancreatic islet cells with endemic coronaviruses and other RNA viruses
To better evaluate the degree to which our results may reveal aspects sufficiently unique to warrant speculation regarding SARS-CoV-2 diabetogenicity, we conducted experiments with two endemic coronavirus strains not previously implicated in diabetes development. The betacoronavirus HCoV-OC43, which utilizes sialoglycan-based receptors and potentially CD26 (Hulswit et al., 2019; Owczarek et al., 2018) for cellular entry, exerted notable CPEs on Vero-E6 cells (Figures S8A and S8B); infected α, β, and “other” cells, albeit to a lesser degree than SARS-CoV-2; more prominently targeted α cells; caused enhanced cellular death; and significantly suppressed hormone expression in α and β cells (Figures 6A, 6B, and S8C). Additional MC analyses of live cells indicated slightly broader viral tropism (i.e., sparse targeting of β-like, δ, ductal, and unannotated cells but not α-like, γ, acinar, ACs, pericytes, or ECs); in dead cells, however, a higher viral burden was detectable, especially in α, β, δ, α-like, and acinar cells, while sparing ACs, pericytes, and ECs (Figure 6C).
Figure 6.

Permissiveness of human islet cells to endemic coronavirus and LCMV infection
(A) Left: contour plots are gated on live α, β, and “other” cell subsets from 96-h mock- or HCoV-OC43-infected islet cell cultures. Right: summary of HCoV-OC43 NP expression in live and dead islet cell subsets (n = 4 donors).
(B) GCG and INS expression levels across mock-infected, NP−, and NP+ α or β cells.
(C) MC analyses were conducted with 96-h mock- or HCoV-OC43-infected islet cells. HCoV-OC43 NP staining and tSNE visualization of live and dead mock-infected (left) and SARS-CoV-2-infected (right) non-hematopoietic cells; overlaid red dots (corresponding to the red demarcated regions in the respective left contour plots) indicate background HCoV-OC43 NP staining for mock cultures and HCoV-OC43 NP detection for infected cultures.
(D and E) 96-h mock or HCoV-NL63 infection of islets; data are displayed as in (A) and (B) (n = 4 donors).
(F and G) 72-h mock or LCMV infection of islets; contour plots gated on live cells show the viral burden in α, β, and “other” cells; dot plots indicate relative survival/death of β cells, and histograms compare GCG and INS levels in the respective uninfected, NP−, and NP+ fractions of α or β cells.
All summary diagrams represent mean ± SD and/or scatter for the indicated numbers of donors; statistics were calculated by paired t test or repeated-measures ANOVA with Tukey’s multiple comparisons where applicable (∗, p < 0.05; ∗∗, p < 0.01).
Similar experiments were performed with the alphacoronavirus HCoV-NL63, which, analogous to SARS-CoV-2, requires ACE2 for entry (Hofmann et al., 2005). Despite limited permissiveness of Vero-E6 cells, HCoV-NL63 infection was readily visualized by FC, revealing increased cellular death, especially in the virus-infected fraction (Figures S8D and S8E). Applied to human islets, HCoV-NL63 infection could only be detected in live α cells from 2 of 4 donors, and “other” cells exhibited only minimal infection (<0.1%). HCoV-NL63 preferentially targeted β cells (0.9% ± 0.2% of the live fraction), and, in the absence of a deleterious effect on cell survival, INS expression was decreased significantly in infected β cells (Figures 6D, 6E, and S8F). Finally, the prevalent and non-diabetogenic human pathogen lymphocytic choriomeningitis virus (LCMV) (Bonthius, 2012) caused a profound infection of islet cells and, in the absence of CPEs, reduced GCG and INS content, especially in the respective NP+ compartments (Figures S8G, 6F, and 6G).
Discussion
Concerns about the diabetogenic potential of SARS-CoV-2 infection inspired a series of recent ex vivo and in vitro investigations into key aspects of presumed viral pathogenesis that prompted notably divergent speculations about the risk for COVID-19-associated new-onset diabetes (Coate et al., 2020; Fignani et al., 2020; Hikmet et al., 2020; Kusmartseva et al., 2020; Muller et al., 2021; Qadir et al., 2021; Shaharuddin et al., 2021; Steenblock et al., 2021; Tang et al., 2021; Wu et al., 2021; Yang et al., 2020). In the present study, we demonstrate that, even under experimentally favorable in vitro conditions that enhance human islet exposure to the virus, SARS-CoV-2 promotes a productive but largely circumscribed non-cytopathic infection, a muted inflammatory response, and only a modest array of cellular perturbations that are predominantly restricted to infected cell subsets. These constraints, which are also applicable to in vitro islet infections with endemic coronaviruses, should temper any considerations of assigning a distinctive diabetogenic capacity to SARS-CoV-2.
Although SARS-CoV-2 infection is notably heterogeneous across different donors and islet preparations, its overall limited extent, which does not increase in the wake of prolonged in vitro virus exposure, is readily defined by transcriptional and proteomic single-cell analyses, where, on average, only 2%–3% of all annotated islet cells carry a viral antigen or are present with unequivocal viral RNA expression patterns. At the same time, despite the substantial degree of viral replication in infected subsets (up to 75% of total cellular transcripts are of viral origin) and induction of prototypical ISG and stress response signatures, differential host transcript expression is restricted to fewer than three dozen genes in betacells, and a corresponding transcriptional “bystander effect” appears to be delimited by the overall extent of infection. Using a novel MC-based cell annotation strategy, we demonstrate that the viral burden is differentially allocated to practically all pancreatic cell types, including ∼1% of α and 3%–4% of β cells. The major SARS-CoV-2 targets are ∼20% of pericytes and ACs, consistent with the robust in situ ACE2 expression in the pancreatic microvasculature (Coate et al., 2020; Fignani et al., 2020; Hikmet et al., 2020; Kusmartseva et al., 2020), as well as 25%–30% provisionally named β-like cells, a small population of endocrine cells that exhibit canonical β cell properties despite minimal proINS expression. β-like cells are a constituent population of all islet cell preparations regardless of infection and, thus, distinct from the recently described NKX6.1+ endocrine cells that present with severe INS depletion after SARS-CoV-2 infection (Muller et al., 2021).
Importantly, translational alterations are largely restricted to infected cell subsets and only pertain to a minority of evaluated proteins, including reduction of endocrine hormone expression and several α cell-, AC-, and pericyte-expressed antigens. A prominent downregulation of HLA-ABC across all infected cell types is noteworthy because it is accompanied by modestly elevated expression in non-infected cells, a “bystander effect” consistent with an ISG response and reminiscent of the histopathological T1D hallmark of HLA-ABC hyperexpression in INS-containing islets (Richardson et al., 2016). A reduction in endocrine hormone expression after islet infection with endemic coronaviruses and other RNA viruses not known to exhibit diabetogenic activity provides additional support for our caution to assign potential clinical significance to observations made with in vitro infection models for SARS-CoV-2.
Mechanistically, we show that in vitro infection of human islets is strictly dependent on ACE2. This is consistent with a recent formal demonstration that ACE2 operates as an obligate SARS-CoV-2 entry receptor (Beumer et al., 2021) and validates an earlier rationale to infer pancreatic susceptibility to SARS-CoV-2 infection from in situ ACE2 expression patterns (Coate et al., 2020; Fignani et al., 2020; Hikmet et al., 2020; Kusmartseva et al., 2020). Here, however, an apparent consensus about ACE2 expression in microvasculature, ductal structures, and pericytes contrasts with discordant results regarding its expression in endocrine cells (Drucker, 2021; Ibrahim et al., 2021), a controversy also reflected by the most recent additions to this canon (Qadir et al., 2021; Steenblock et al., 2021; Tang et al., 2021; Wu et al., 2021). Considering the nature of pancreatic tissue specimens under investigation may offer a partial resolution to this conundrum; although we maintain that the scope of our earlier analyses and those by Coate et al. (2020) make a compelling case for infrequent, low-level ACE2 expression by endocrine cells interrogated in situ (Kusmartseva et al., 2020), our FC-based demonstration of ACE2 expression by similar small fractions of live α, β, and “other” cells may indicate its dynamic regulation in response to mechanical, chemical, and metabolic stress associated with islet isolation, enrichment, transport, and precise culture conditions, including infection. Other proviral host factors, which may or may not involve auxiliary receptors (Baggen et al., 2021), likely shape differential susceptibility to SARS-CoV-2 infection, and the precise contribution of NRP1 and/or CD71 (Steenblock et al., 2021; Tang et al., 2021; Wu et al., 2021) in this context requires clarification, considering their sparse endocrine cell expression, as shown here.
Our main conclusions differ substantially from three recent reports where in vitro SARS-CoV-2 exposure promoted an ∼10-fold higher rate of islet cell infection, excess cellular death, and/or pronounced transcriptional, phenotypic, or functional alterations (Muller et al., 2021; Tang et al., 2021; Wu et al., 2021). An explanation for these differences, beyond specific donor and virus strain properties, may also come from an important caveat raised by our observation that prevention of infection by ACE2 blockade “paradoxically” potentiates the inflammatory response; namely, that PAMPs in the viral inoculum can elicit exaggerated cellular responses that do not reflect the specific consequences of viral infection. Accordingly, our choice of an ∼25- to 100-fold lower MOI than that reported by others (Muller et al., 2021; Tang et al., 2021; Wu et al., 2021) aims to better align in vitro experimentation with the comparatively low viral burden demonstrated in COVID-19 pancreata across several autopsy cohort studies (Bhatnagar et al., 2021; Chertow et al., 2021; Dorward et al., 2020; Schurink et al., 2020). Specifically, subgenomic viral RNA indicative of active replication was detected only infrequently, at low levels, and/or transiently (Chertow et al., 2021; Dorward et al., 2020; Tang et al., 2021), and SARS-CoV-2 protein co-localization with INS-expressing β cells appeared to be scarce but somewhat more pronounced for ductal cells and ECs (Bhatnagar et al., 2021; Kusmartseva et al., 2020; Muller et al., 2021; Qadir et al., 2021; Steenblock et al., 2021; Tang et al., 2021; Wu et al., 2021). The challenges to derive consistent insights into the ramifications of in vivo pancreatic SARS-CoV-2 infection are also illustrated by three non-human primate studies that failed to detect viral genomes in pancreata of 8 of 8 subjects (Munster et al., 2020), reported an absence of virus in pancreatic endocrine cells but correlated hyperglycemia in 2 of 8 subjects (∼175 and 350 mg/dL glucose, respectively) with thrombofibrotic lesions in the pancreas (Qadir et al., 2021), or documented β cell-associated viral particles in 4 of 4 subjects as well as concomitant “β cell atrophy” in the absence of enhanced cellular death (Millette et al., 2021). Ultimately, however, only examination of considerably more pancreatic autopsy tissues will permit detailed assessment of the nature and scope of pancreatic COVID-19 pathology.
In our view, the hypothesis that direct SARS-CoV-2 infection of β cells can precipitate new-onset diabetes is confounded by the fact that several key stages of presumed pathogenesis are relatively rare conditions or events (in situ ACE2 expression, susceptibility to in vitro infection, and viral traces in the COVID-19 pancreas). More subtle damage to the pancreatic microenvironment in the wake of SARS-CoV-2 infection, including microvascular thrombosis, may compound to enhance future diabetes incidence in at-risk individuals (von Herrath et al., 2003). Accordingly, careful integration of emerging epidemiological studies, expanded histopathological investigations, development of novel animal models, and resolution of current controversies over the coming years will be required to formulate a balanced risk assessment of diabetes onset as a consequence of prior SARS-CoV-2 infection.
Limitations of the study
Our study has several apparent limitations. For one, the comparatively low number of islet donors, in particular for our scRNA-seq work, does not permit a breakdown according to demographic or clinical parameters. We also refrained from conducting dynamic glucose-stimulated INS secretion assays because of logistical challenges associated with work under biosafety level 3 (BSL-3) conditions; we speculate, however, that significant impairment of SARS-CoV-2-infected islet function is not likely to occur because a substantially higher extent of infection reportedly resulted in contradictory, unaltered, or compromised INS secretion, respectively (Muller et al., 2021; Tang et al., 2021; Wu et al., 2021). Experimental outcomes are also delimited by the properties of specific SARS-CoV-2 variants and the details of in vitro infection protocols. Although a comprehensive investigation of the effect of these variables or combinations thereof is beyond the scope of the present study, we aim to strike a relevant balance by choice of a prominent SARS-CoV-2 isolate (USA-WA1/2020) as well as low-MOI protocols that focus experimental results on the consequences of productive viral infection and may better emulate in vivo scenarios of pancreatic SARS-CoV-2 infection. Under these conditions, the overall extent of infection as well as the degree of transcriptional and translational alterations in infected β cells remains surprisingly modest, especially in light of the high viral burden in infected single cells, but we cannot and do not rule out potential metabolic impairments of individual β cells that could conceivably be compounded in vivo by antiviral immune responses. Although it may be possible that SARS-CoV-2 infection could precipitate a clinically relevant reduction in functional β cell mass in some at-risk individuals, we would expect this to be a rather infrequent outcome. Perhaps most importantly, our conclusions are based on cautious interpretation of experimental observations in the larger current context of available basic research and epidemiological data; only time will tell whether a history of SARS-CoV-2 infection may predispose an individual to enhanced T1D- and/or T2D-like disease in still-to-be-defined at-risk populations.
STAR★Methods
Key resources table
| REAGENT or RESOURCE | SOURCE | IDENTIFIER |
|---|---|---|
| Antibodies | ||
| Anti-human CD13 (mouse IgG1, clone WM15) - 152Sm | Fluidigm | Cat# 3152003B; RRID: AB_2893060 |
| Anti-human CD9 (mouse IgG1, clone SN4 C3-3A2) - 171Yb | Fluidigm | Cat# 3171009B; RRID: AB_2877094 |
| Anti-human CD26 (mouse IgG2a, clone BA5b) - 144Nd (in-house conjugation) | Biolegend | Cat# 302702; RRID: AB_314286 |
| Anti-human CD31 (mouse IgG1, clone WM59) - 145Nd | Fluidigm | Cat# 3145004B; RRID: AB_2737262 |
| Anti-human CD34 (mouse IgG1, clone 581) - 167Er (in-house conjugation) | Biolegend | Cat# 343531; RRID: AB_2562837 |
| Anti-human CD44 (rat IgG2b, clone IM7) - 153Eu (in-house conjugation) | Biolegend | Cat#103051; RRID: AB_2562799 |
| Anti-human CD45 (mouse IgG1, clone HI30) - 89Y | Fluidigm | Cat# 3089003B; RRID: AB_2661851 |
| Anti-human CD49b (mouse IgG1, clone P1E6-C5) - 161Dy | Fluidigm | Cat# 3161012B; RRID: AB_2893062 |
| Anti-human CD49f (rat IgG2a, clone GoH3) - 142Nd (in-house conjugation) | Biolegend | Cat# 313602; RRID: AB_345296 |
| Anti-human CD54 (mouse IgG1, clone HCD54) - 176Yb (in-house conjugation) | Biolegend | Cat# 322704; RRID: AB_535976 |
| Anti-human CD61 (mouse IgG1, clone VI-PL2) - 209Bi | Fluidigm | Cat# 3209001B; RRID: AB_2864731 |
| Anti-human CD71 (mouse IgG2a, clone CY1G4) - 169Tm (in-house conjugation) | Biolegend | Cat# 334102; RRID: AB_1134247 |
| Anti-human CD81 (mouse IgG1, clone TAPA-1) - 163Dy (in-house conjugation) | Biolegend | Cat# 349502; RRID: AB_10643417 |
| Anti-human CD90 (mouse IgG1, clone 5E10) - 159Tb | Fluidigm | Cat# 3159007B; RRID: AB_2893063 |
| Anti-human CD99 (mouse, IgG2a, clone HCD99) - 170Er | Fludigm | Cat# 3170012B; RRID: AB_2893064 |
| Anti-human CD105 (mouse IgG1, clone 43A3) - 163Dy | Fluidigm | Cat# 3163005B; RRID: AB_2893065 |
| Anti-human CD133 (mouse IgG1, clone 7) - 113In (in-house conjugation) | Biolegend | Cat# 372802; RRID: AB_2728390 |
| Anti-human CD140b/PDGFRB (mouse IgG1, clone 18A2) - 156Gd | Fluidigm | Cat# 3156018A; RRID: AB_2893066 |
| Anti-human CD141 (mouse IgG1, clone M80) - 166Er | Fluidigm | Cat# 3166017B; RRID: AB_2892693 |
| Anti-human CD146 (mouse IgG1, clone P1H12) - 155Gd | Fluidigm | Cat# 3155006B; RRID: AB_2893068 |
| Anti-human CD200/HPi1 (mouse IgG1, clone HIC0-4F9) - 173Yb | Grompe/Streeter | N/A |
| Anti-human CD273/PD-L2 (mouse IgG2a, clone 24F.10C12) - 172Yb | Fludigm | Cat# 3172014B; RRID: AB_2877093 |
| Anti-human CD274/PD-L1 (mouse IgG2b, clone 29E.2A3) - 159Tb | Fluidigm | Cat# 3159029B; RRID: AB_2861413 |
| Anti-human CD304/NRP1 (mouse IgG2a, clone 12C2) - 169Tm | Fludigm | Cat# 3169018B; RRID: AB_2892697 |
| Anti-human CD326/EpCAM (mouse IgG2b, clone 9C4) – 141Pr | Fluidigm | Cat# 3141006B; RRID: AB_2687653 |
| Anti-human ACE2 (polyclonal goat IgG) - 154Sm (in-house conjugation) / AF647 (in-house conjugation) / purified (ACE2 block) | R&D Systems | Cat# AF933; RRID: AB_355722 |
| Anti-human CDH1/E-Cadherin (rabbit IgG, clone 24E10) - 158Gd | Fluidigm | Cat# 3158029D; RRID: AB_2893074 |
| Anti-human ENTPD3 (mouse IgG2b, clone B3S-C3) – 169Tm | ISMMS CTAD | N/A |
| Anti-human GP2/HPx1 (mouse IgG1, clone HIC0-3B3) - 175Lu | Grompe/Streeter | N/A |
| Anti-human HLA-ABC (mouse IgG2a, clone W6/32) - 141Pr,169Tm or 115In (in-house conjugation) | Fluidigm/Biolegend | Cat# 3141010B; RRID: AB_2687848/Cat#311402; RRID: AB_314871 |
| Anti-human HLA-DR (mouse IgG2a, clone L243) - 143Nd | Fluidigm | Cat# 3143013B; RRID: AB_2661810 |
| Anti-human HLA-DR (recombinant human IgG1, clone REA805) - 174Yb | Miltenyi Biotec | Cat# 130-122-299; RRID: AB_2801880 |
| Anti-human HPd3 (mouse IgM, clone DHIC5-4D9) - 174Yb | Grompe/Streeter | N/A |
| Anti-human NG2 (mouse IgG1, clone LHM-2) - 147Sm | R&D Systems | Cat# MAB2585; RRID: AB_2087614 |
| Anti-human SUS2D (mouse IgG1, clone W5C5) - 115In (in-house conjugation) | Biolegend | Cat # 327401; RRID: AB_940656 |
| Anti-human TM4SF4 (mouse IgG1, clone 832441) - 146Nd (in-house conjugation) | R&D Systems | Cat# MAB7998; RRID: AB_2893073 |
| Anti-human TSPAN8 (mouse IgG1, clone TAL69) - 155Gd (in-house conjugation) | Biolegend | Cat# 363702; RRID: AB_2564375 |
| Anti-human aSMA (mouse IgG2a, clone 1A4) - 141Pr | Fluidigm | Cat# 3141017D; RRID: AB_2890139 |
| Anti-human COL1A1 (mouse IgG1, clone 5D8-G9) - 143Nd (in-house conjugation) | Millipore | Cat# MAB3391; RRID: AB_11212250 |
| Anti-human GCG (mouse IgG1, clone U16-850) - 148Nd (in-house conjugation) | BD Biosciences | Cat# 565891; RRID: AB_2739381 |
| Anti-human GFAP (mouse IgG2b, clone 1B4) - 156Gd (in-house conjugation) | BD Biosciences | Cat# 556328; RRID: AB_396366 |
| Anti-human GHRL (rat IgG2a, clone 883622) - 168Er (in-house conjugation) | R&D Systems | Cat# MAB8200; RRID: AB_2637039 |
| Anti-human NKX2.2 (mouse IgG2a, clone 74.5A5) - 162Dy (in-house conjugation) | BD Biosciences | Cat# 564731; RRID: AB_2738924 |
| Anti-human NKX6.1 (mouse IgG1, clone R11-560) - 164Dy (in-house conjugation) | BD Biosciences | Cat# 563022; RRID: AB_2737958 |
| Anti-HCoV-OC43 Nucleoprotein (mouse IgG, clone 542-7D) - 165Ho (in-house conjugation) | Millipore | Cat# MAB9013; RRID: AB_95425 |
| Anti-human PAX6 (mouse IgG2a, clone O18-1330) - 160Gd (in-house conjugation) | BD Biosciences | Cat# 561462; RRID: AB_10715442 |
| Anti-human PDX1 (mouse IgG1, clone 658A5) - 156Gd (in-house conjugation) | BD Biosciences | Cat# 562160; RRID: AB_10898002 |
| Anti-human ProINS (mouse IgG1, clone GS-9A8) - 150Nd (in-house conjugation) | NovoNordisk | N/A |
| Anti-human PPY (mouse IgG1, clone 548416) - 151Eu (in-house conjugation) | R&D Systems | Cat# MAB62971; RRID: AB_11127208 |
| Anti-SARS-CoV-2 Nucleoprotein (mouse IgG2a, clone 1C7) - 165Ho (in-house conjugation) / AF647 (in-house conjugation) | ISMMS CTAD | N/A |
| Anti-SARS-CoV-2 Spike protein (mouse IgG2a, clone 2B3ES) - 159Tb (in-house conjugation) | ISMMS CTAD | N/A |
| Anti-human SST (mouse IgG1, clone 7G5) - 149Sm (in-house conjugation) | GeneTex | Cat# GTX60646; RRID: AB_2893072 |
| Human TruStain FcX | Biolegend | Cat# 422302; RRID: AB_2818986 |
| Anti-HCoV NL63 Nucleoprotein (mouse IgG1, clone 2D4) - AF647 (in-house conjugation) | Ingenasa | Cat# M.30.HCo.I2D4; RRID: AB_2893071 |
| Anti-human LCMV Nucleoprotein (rat IgG2A, clone VL-4) - AF647 (in-house conjugation) | BioXcell | Cat# BE0106; AB_10949017 |
| Goat Isotype control (polyclonal goat IgG) - AF647 (in-house conjugation) | R&D Systems | Cat# AB-108-C; RRID: AB_354267 |
| Anti-human Lipoprotein Lipase / LPL (polyclonal goat IgG; ACE2 block control) | R&D Systems | Cat# AF7197; RRID: AB_10972480 |
| Anti-human ACE2 (polyclonal goat IgG Poly5036) - AF647 (in-house conjugation) | Biolegend | Cat# 503602; RRID: AB_2892475 |
| INS - PE (rabbit IgG, clone C27C9) | CellSignaling | Cat# #8508; RRID: AB_11179076 |
| GCG - BV421 (mouse IgG1, clone U16-850) | BD Biosciences | Cat# 565891; RRID: AB_2739385 |
| Goat F(ab) Anti-Mouse IgG H&L - horseradish peroxidase | abcam | Cat# ab6823; RRID: AB_955395 |
| Bacterial and virus strains | ||
| SARS-CoV-2 isolate USA-WA1/2020 | BEI Resources | NR-52281 |
| HCoV-NL63 | BEI Resources | NR-470 |
| HCoV-OC43 | ATCC | ATCC VR-1558 |
| LCMV Armstrong clone 53b | Dr. M. Oldstone, The Scripps Research Institute | N/A |
| Biological samples | ||
| Human islets for research | Prodo Laboratories Inc. | https://prodolabs.com/ |
| Chemicals, peptides, and recombinant proteins | ||
| D-Glucose | Sigma | G8664; CAS: 50-99-7 |
| Penicillin/streptomycin | LifeTechnologies & Corning | 15140122 & 30-002—CI; CAS: 61-33-6/57-92-1 |
| HEPES (1M) | Life Technologies | 15630080; CAS: 7365-45-9 |
| GlutaMAX | Life Technologies | 35050061; CAS: 39537-23-0 |
| Tryptose phosphate broth | Sigma | T8159-100ML |
| Non-essential amino acids | Corning | 25-025-Cl |
| B27 supplement minus insulin | Life Technologies | A1895601 |
| Antibiotic Antimycotic Solution (100x), stabilized | Sigma | A5955 |
| L-Glutamic Acid | Sigma | 49449; CAS: 56-86-0 |
| Aprotinin | Sigma | A6106; CAS: 9087-70-1 |
| Trypsin inhibitor from Glycine max | Sigma | T6522; CAS: 9035-81-8 |
| Chymostatin | Sigma | 11004638001; CAS: 9076-44-2 |
| DPBS without calcium, magnesium | HyClone | SH30028.02 |
| BSA | Sigma | A9418 |
| Low melting agar | Oxoid | LP0011B; CAS: 9002-18-0 |
| Tris Buffered Saline | CellSignaling | 12498 |
| Tween 20 | Sigma | P1379 |
| Sodium Azide | Alfa Aesar | J2161022; CAS: 26628-22-8 |
| EDTA 0.5 M, pH 8 | LifeTechnologies | AM9260G; CAS: 60-00-4 |
| Accutase | Innovative Cell Technologies, Inc. | AT104 |
| Prodo Islet Media (Transport)/PMI(T) | Prodo Laboratories Inc | https://prodolabs.com/ |
| FBS | Life Technologies & PEAK serum | 10438-026 & PS-FB2 |
| BrainPhys Medium | Stem Cell Technologies | 5790 |
| RPMI 1640 medium (with HEPES, GlutaMAX) | Life Technologies | 72400047 |
| RPMI 1640 medium, no glucose | Life Technologies | 11879020 |
| Dulbecco's Modified Eagle's Medium | ATCC & Corning | 30-2002 & 10-027-CV |
| Eagle's Minimum Essential Medium | ATCC | 30-2003 |
| Minimum Essential Medium | Life Technologies | 12492013 |
| Critical commercial assays | ||
| UltraComp eBeads Plus Compensation Beads | Life Technologies | 01-3333-42 |
| Fixation buffer | Biolegend | 420801 |
| FoxP3/Transcription Factor Staining Buffer Set | Life Technologies | 00-5523-00 |
| Maxpar Cell Staining Buffer | Fluidigm | 201068 |
| Maxpar Cell Acquisition Solution | Fluidigm | 201240 |
| EQ Four Element Calibration Beads | Fludigim | 201078 |
| Chromium NextGem Single Cell 5'v1.1 Kit | 10X Genomics | 1000166 |
| Chromium Next GEM Single Cell 5' Library and Gel Bead Kit v1.1 | 10X Genomics | 1000165 |
| Nova Seq 6000 SP Reagent Kit (100 cycles) | Illumina | 20027464 |
| KAPA library quantification kit | Roche | 796014001 |
| Agilent High Sensitivity DNA kit | Agilent | 5067-4626 |
| KPL TrueBlue peroxidase substrate | SeraCare | 5510-0030 |
| Target 96 Inflammation | Olink | 95302 |
| Maxpar X8 Antibody Labeling Kit | Fluidigm | various; https://www.fluidigm.com/binaries/content/documents/fluidigm/search/hippo%3Aresultset/maxpar-x8-antibody-labeling-kits-40rxn-tds-fldm-00029-rev01/fluidigm%3Afile |
| Cell-ID Intercalator-103Rh | Fluidigm | 201103A |
| Cell-ID Intercalator-Ir | Fluidigm | 201192B |
| Alexa Fluor 647 Antibody Labeling Kit | Life Technologies | A20186 |
| Zombie Green Fixable Viability Dye | Biolegend | 423111 |
| Zombie NIR Fixable Viability Dye | Biolegend | 423105 |
| Zombie Aqua Fixable Viability Dye | Biolegend | 423101 |
| Vybrant FAM Poly Caspases Assay Kit, for flow cytometry | Life Technologies | V35117 |
| Deposited data | ||
| scRNAseq | GEO Repository (https://www.ncbi.nlm.nih.gov/geo/) accession number GEO: GSE194061 | N/A |
| Experimental models: Cell lines | ||
| African Green monkey: Vero-E6 | ATCC | ATCC CRL-1586 |
| Human: HCT-8 (HRT-18) | ATCC | ATCC CCL-244 |
| Rhesus monkey: LLC-MK2 Original | ATCC | ATCC CCL-7 |
| Hamster: BHK-21 | ATCC | ATCC CCL-10 |
| Software and algorithms | ||
| GraphPad Prism (version 6.0 and version 8.0) | GraphPad | https://www.graphpad.com/ |
| Adobe Illustrator | Adobe | https://www.adobe.com/products/illustrator.html |
| FlowJo version 10.7.1 | BD Biosciences | https://www.flowjo.com/ |
| Cytobank | Beckman Coulter | https://cytobank.org/ |
| UCSC Genome Browser Table Browser | Fernandes et al. PMID: 32908258 | https://genome.ucsc.edu/cgi-bin/hgTables |
| cellranger/3.1.0 | 10x Genomics | https://support.10xgenomics.com/single-cell-gene-expression/software/overview/welcome |
| R/4.0.4 | R Core Team (2020). R: A language and environment for statistical computing. R Foundation for Statistical Computing, Vienna, Austria. | https://www.r-project.org/ |
| Seurat/4.0.4 | Stuart et al., PMID: 31178118 |
https://satijalab.org/seurat/ |
| msigdbr/7.4.1 | Subramanian et al., PMID: 16199517 | https://cran.r-project.org/web/packages/msigdbr/vignettes/msigdbr-intro.html |
| tidyverse/1.3.1 | Wickham et al., JOSS 2019 |
https://tidyverse.tidyverse.org/articles/paper.html |
| scRNAseq analysis code | https://doi.org/10.5281/zenodo.5912184 | https://github.com/BradRosenbergLab/pancreaticsarscov2infection |
| Other | ||
| Attune NxT Flow Cytometer (3-laser configuration: blue, red, violet) | LifeTechnologies | N/A |
| Helios Mass Cytometer | Fluidigm | N/A |
| UV light bulb GCL-36 | American Ultraviolet | 05-0844 |
| Germicidal UVC device (254 nm) for virus inactivation | in-house, PMID: 33052360 |
N/A |
| Agilent 2100 Bioanalyzer | Agilent | N/A |
| NovaSeq 6000 sequencing system | Illumina | N/A |
Resource availability
Lead contact
Further information and requests for resources and reagents should be directed to and will be fulfilled by the lead contact, Dirk Homann (dirk.homann@mssm.edu).
Materials availability
This study did not generate new unique reagents.
Experimental model and subject details
Human pancreatic islets
Human pancreatic islets for research purposes from non-diabetic cadaveric donors were obtained through Prodo Laboratories Inc. (Aliso Viejo, CA). Deidentified donor demographics as well as islet preparation characteristics are summarized in Table S1. Upon receipt, islets were rested overnight in proprietary Prodo Islet Media (Transport)/PMI(T) (5.8 mM D-glucose) at 37°C in a humidified 5% CO2 atmosphere before transfer to standard culture medium (complete RPMI 1640 [11.1 mM D-glucose] with 10% fetal bovine serum [FBS], 1% penicillin-streptomycin, 25 mM HEPES and GlutaMAX supplement [Gibco ThermoFisher]) for subsequent culture under specified experimental conditions. To assess the impact of glucose concentrations in the context of ACE2 expression regulation and SARS-CoV-2 infection, islets were incubated in complete RPMI 1640 supplemented with 5.5, 11.1 or 22.2 mM D-glucose (Sigma), respectively. Single cell suspensions were generated after 48 to 120 hours (h) of experimental cultures as indicated by gentle dissociation in 500 μL Accutase (Innovative Cell Technologies) for up to 10 minutes at 37°C and further processed for flow or mass cytometry as well as for scRNAseq analysis.
Cell lines
Vero-E6 cells (Vero C1008, ATCC CRL-1586™) were cultured in Dulbecco’s modified Eagle’s Medium (DMEM, ATCC) supplemented with 10% FBS, 1% penicillin-streptomycin, and 1% non-essential amino acids (Gibco). HCT-8 (HRT-18, ATCC CCL-244™) and LLC-MK2 cells (LLC-MK2 Original, ATCC CCL-7™) were grown in Dulbecco's Modified Eagle Medium (DMEM, ATCC) supplemented with 10% FBS and 1% penicillin-streptomycin. BHK-21 cells (BHK-21 C-13, ATCC CCL-10™) were passaged in DMEM supplemented with 10% FBS, 1% penicillin-streptomycin, GlutaMAX supplement, 25 mM HEPES and 5% tryptose phosphate broth (Sigma). All cell lines were maintained at 37°C, 5% CO2 and >90% relative humidity.
Method details
Viruses
The SARS-CoV-2 isolate USA-WA1/2020 was obtained from BEI Resources (NR-52281), propagated on Vero-E6 cells, and viral stocks were sequenced to confirm genomic integrity according to the ARTIC protocol (https://artic.network/ncov-2019) (Rathnasinghe et al., 2021). Virus titers for subsequent in vitro infection of Vero-E6 and primary human islets were determined by plaque assay as detailed below. Human coronavirus OC43 (HCoV-OC43) was purchased from ATCC (Betacoronavirus 1, ATCC VR-1558™) and grown on HCT-8 cells cultured in DMEM with 2% FBS. Stocks of HCoV-NL63 (BEI Resources, NR-470 Human Coronavirus, NL63) were amplified on LLC-MK2 cells in DMEM supplemented with 2% FBS. HCoVs were titered by TCID50 on HCT-8 or LLC-MK2 cells, respectively, using cytopathic effect (CPE) as a readout as well as by subsequent development of a plaque assay for HCoV-OC43. Lymphocytic choriomeningitis virus (LCMV) strain Armstrong 53b (a gift from Michael B. A. Oldstone, The Scripps Research Institute, La Jolla) was grown in BHK-21 cells in DMEM with 2% FBS, and infectious viral titers were quantified by plaque assay on Vero-E6 monolayers as described (Ahmed et al., 1984). All experiments and assays involving direct handling of SARS-CoV-2 as well as of potentially infectious samples prior to cellular fixation/viral inactivation were performed in a biosafety level (BSL)-3 setting; experiments/assays using other viruses were conducted under BSL-2+ conditions.
Virus infections
Vero-E6 cells were seeded at ∼2x10⁵ cells in 500 μl complete DMEM in tissue culture (TC)-treated 24-well plates and cultured overnight. The medium was replaced with infection medium (DMEM [Corning], 2% FBS [Peak], 1% penicillin/streptomycin [Corning], 1% non-essential amino acids [Corning]) prior to 48h-mock or virus infection with 2x10⁴ pfu/well SARS-CoV-2 corresponding to a multiplicity of infection (MOI) of ∼0.08 at cell confluency. Infections with other human coronaviruses were performed in an analogous fashion using 4.5x10³ pfu/well HCoV-OC43 or 4.5x10³ pfu/well HCoV-NL63. Infection with 2x10⁴ pfu/well LCMV Armstrong clone 53b was performed as described (Korns Johnson and Homann, 2012). Infections were allowed to proceed for 48-96h as indicated. To assess SARS-CoV-2 infection under conditions of escalating glucose concentrations, Vero-E6 cells were incubated in complete RPMI 1640 containing 5.5, 11.1, or 22.2 mM D-glucose, respectively. To determine SARS-CoV-2 infectivity in an experimental setting emulating pancreatic slice culture, Vero-E6 cells were additionally maintained in “slice medium” (Panzer et al., 2020) for 48h at 30°C in a humidified 5% CO2 incubator.
In vitro infections of primary human islets were performed in non-TC-treated 24-well plates at 3,000-4,000 islet equivalents (IEQs; due to compact islet size, one IEQ is estimated to consist of ∼1,000 cells) per 500 μl complete RPMI 1640 (5.5-22.2 mM D-glucose as indicated) in the absence (mock infection) or presence of 2x10⁴ pfu/well SARS-CoV-2 (MOI ∼0.005-0.01), 4.5x10³ pfu/well HCoV-OC43 (MOI ∼0.001-0.002), 4.5x10³ pfu/well HCoV-NL63 (MOI ∼0.001-0.002), or 2x10⁴ pfu/well LCMV Arm 53b (MOI ∼0.005-0.01). Cells were subsequently cultured for 48-120h as specified. In some cases, tissue culture supernatant (TCS) was collected prior to islet harvesting and stored at -80°C for subsequent determination of infectious SARS-CoV-2 titers and for quantification of soluble inflammatory factors by proximity extension assay following virus inactivation.
SARS-CoV-2 plaque assay
Confluent monolayers of Vero-E6 cells were infected in 12-well plates with 150 μL of 10-fold serially diluted TCS samples, starting at 1:10, in 1X phosphate-buffered saline (PBS, HyClone) supplemented with 0.2% bovine serum albumin (BSA, Sigma) and 1% penicillin/streptomycin. Plates were incubated for 45 min at 37°C/5% CO2 with gentle shaking every 5 minutes to prevent drying. After removal of inoculum, cells were overlayed with 1 mL Minimum Essential Medium (MEM; Gibco) with 2% FBS and 0.64% Oxoid agar, and plates were incubated for an additional 72h at 37°C/5% CO2 followed by fixation with 4% methanol-free formaldehyde at 4°C overnight. After careful removal of formaldehyde and gel plug overlays, cells were blocked in 5% milk in Tris-buffered saline (TBS, Cell Signaling Technology) with 0.1% Tween-20 (Sigma, TBS-T) for 1h at room temperature (RT) with gentle shaking. Next, Vero-E6 cells were immunostained for the SARS-CoV-2 nucleoprotein (NP) using a mouse monoclonal antibody (clone 1C7, Center for Therapeutic Antibody Development, ISMMS) at a dilution of 1:1,000 in TBS-T, prior to incubation with horseradish peroxidase (HRP)-conjugated anti-mouse IgG (1:5,000; abcam ab6823) for 45min at RT. Plaques were visualized by exposure to KPL TrueBlue peroxidase substrate (SeraCare) for 20min at RT with gentle shaking, and viral titers were calculated as plaque forming units (pfu)/mL (limit of detection [LOD]: 66.7 pfu/mL).
UV-C inactivation of SARS-CoV-2
To process virus-infected TCS under BSL-2+ conditions, a previously validated, germicidal ultraviolet C (UV-C; 254nm) device which irradiates at a median dose of 5.43 mWcm-2 was used to inactivate potentially infectious samples (Rathnasinghe et al., 2020a). Briefly, to achieve stable UV-C output, the lamp was allowed to warm up for 4min prior to UV illumination of 50 μl aliquots of TCS in 96-well round-bottom plates on ice for 4min as described (Rathnasinghe et al., 2020a); UV-C-treated supernatants were immediately stored at -80°C for follow-up assays.
Olink proteomic assay
Highly multiplexed quantification of secreted proteins in UV-inactivated TCS of 48h mock- or SARS-CoV-2-infected islet cell cultures was performed by Olink Proteomics Inc. (Watertown, MA) using their proximity extension assay-based “Olink Target 96 Inflammation panel”; this panel permits the simultaneous interrogation of 92 distinct proteins associated with inflammatory diseases and related biological processes in <5 μl of sample. After completion of QC and normalization processes developed and provided by Olink, protein levels were specified in normalized protein expression (NPX) units with a high NPX value corresponding to high protein concentration.
Flow cytometry (FC)
Flow cytometry was performed to analyze ACE2 surface expression in single cell suspensions of primary human islets cultured in PMI(T) for up to 48h after receipt. Briefly, dispersed islet cells were washed in FACS buffer (PBS with 1% FBS, 0.5% 3 mM sodium azide, and 0.5 mM EDTA; Sigma), stained for 40min at 4°C in the dark with goat anti-human ACE2 polyclonal goat antibody (AF933, R&D Systems) or normal goat IgG isotype control (AB-108-C, R&D Systems) conjugated to Alexa Fluor 647 (AF647; AF647 Antibody Labeling Kit, Life Technologies) followed by live/dead cell staining with Zombie NIR (Biolegend) in PBS for 10min at RT. Note that cumulative impact of human islet isolation, transport, culture and dissociation required for FC analyses is associated with considerable cell death (Maachi et al., 2021; Paraskevas et al., 2000). Cells were subsequently fixed and permeabilized using the FoxP3 transcription buffer kit (Life Technologies), and intracellularly stained for insulin (PE-anti-human insulin, Cell Signaling Technology) and glucagon (BV421-anti-human glucagon, BD Biosciences) for 40min at RT in the dark. A fluorescence minus one (FMO) control was included to define gating boundaries of ACE2-expressing cells, and staining patterns were independently validated in a side-by-side comparison employing a second polyclonal goat anti-human ACE2 antibody (Poly5036, Biolegend; in-house conjugated to AF647). Antibody target specificity was further confirmed by FC staining of ACE2-expressing Vero-E6 cells.
To further assess ACE2 expression levels on live, dying and dead endocrine cell subsets in the context of escalating glucose concentrations, human islets were incubated for 12 or 48h in complete RPMI 1640 with 5.5, 11.1, or 22.2 mM D-glucose in the presence of FAM-labeled VAD-FMK fluorescent inhibitor of caspases (FLICA) reagent, a probe for detection of activated caspases including caspase-1, 3, 4, 5, 6, 7, 8 and 9, as per the manufacturer’s suggestion (Vybrant FAM Polycaspases Assay Kit, Invitrogen/Life Technologies). Islet single cell suspensions were surface-stained with AF647-anti human ACE2 (AF933) and Zombie Aqua fixable viability dye (Biolegend) prior to fixation/permeabilization and subsequent detection of insulin and glucagon as described above.
Viral NP of SARS-CoV-2, HCoV-OC43, HCoV-NL63, and LCMV Arm 53b was quantified by intracellular FC of single cell suspensions prepared from infected and mock-infected human islet cell cultures in combination with intracellular detection of insulin and glucagon using the following mAbs after in-house conjugation to AF647: mouse anti-SARS NP (clone 1C7, Center for Therapeutic Antibody Development, ISMMS), mouse anti-HCoV-OC43 NP (clone 542-7D, Millipore), mouse anti-HCoV-NL63 NP (clone 2D4, Ingenasa), and rat anti-LCMV NP (clone VL-4, BioXCell). Dead cells were identified using Zombie Green fixable viability dye (Biolegend). Antibody specificity was independently verified by FC using both infected and non-infected Vero-E6, HCT-8 and/or LLC-MK2 cells as positive and negative controls, respectively. All flow cytometry samples were acquired on a 3-laser Attune NxT Flow Cytometer (ThermoFisher Scientific). Further details about antibodies and reagents are found in key resources table.
ACE2 blockade
Vero-E6 cell monolayers in TC-treated 24-well plates were preincubated for 2h at 37°C/5% CO2 with increasing concentrations of purified goat anti-human ACE2 (AF933, R&D systems) or irrelevant goat anti-human lipoprotein lipase polyclonal antibody (AF7917, R&D Systems) before 48h-infection with SARS-CoV-2 as detailed above. The half-maximal inhibitory concentration (IC50) was calculated based on quantification of infectious TCS virus by plaque assay and detection of SARS-CoV-2 NP by FC. Primary human islets (∼4,000 IEQs/well in 500 μL complete RPMI 1640, 11.1 mM glucose) were pretreated with 10 μg/mL AF933 (targeting ACE2) or AF7917 (irrelevant goat IgG), infected with SARS-CoV-2 and both TCS and islets were harvested for subsequent analyses as specified.
Mass cytometry (MC)
Mass cytometry analyses were conducted with matched mock- and SARS-CoV-2-infected islet cell preparations from seven individual donors. In the case of two donors, limited cell yields restricted analyses to more abundant cell subsets and/or cell subsets with higher extent of infection. For one donor, a mock- and HCoV-OC43-infected islet sample pair was additionally analyzed. Multiple uninfected donor islet single-cell preparations served for MC antibody validation and titration as well as for improved subset identification and characterization. All MC antibodies were purchased as rare earth metal conjugates from Fluidigm or were custom conjugated in-house using MaxPar X8 conjugation kits (Fluidigm) according to the manufacturer’s specification; further details are provided in key resources table. Single cell suspensions of mock- and SARS-CoV-2-infected human islets were washed with cell staining buffer (CSB, Fluidigm) and incubated for 5min with Fc blocking (Human TruStain FcX, Biolegend) and viability reagents (Cell-ID Intercalator-103Rh, Fluidigm) prior to addition of cell surface antibody staining cocktails for 30min at RT. After washes with CSB and overnight fixation with 4% PFA at 4°C to inactivate infectious virus, samples were permeabilized using the FoxP3 transcription buffer kit, and stained for intracellular antigens. Immediately prior to acquisition, samples were washed with CSB and Cell Acquisition Solution (CAS, Fluidigm) and resuspended in CAS at a concentration of 106 cells/mL containing a 1:20 dilution of EQ normalization beads (Fluidigm). Samples were acquired on a Fluidigm Helios mass cytometer using the wide bore injector configuration at an acquisition speed of <400 cells per second. Resulting FCS files were then normalized and concatenated using Fluidigm's CyTOF software (v6.7.1016) and analyzed with FlowJo version 10.7 (BD Biosciences) and/or Cytobank (Beckman Coulter) software.
Single-cell RNA sequencing (scRNAseq)
Cell processing, library preparation and sequencing
Matched mock- and SARS-CoV-2-infected islets from three donors (48h culture) were harvested and dispersed as described above, washed with PBS, passed through a 70μm strainer and resuspended in a final volume of 200μl; viability and cell number were determined using Trypan Blue staining and a Countess Automated Cell Counter (ThermoFisher). The number of input cells was adjusted to achieve a target cell concentration of 8,000 cells per sample according to the 10X Genomics single-cell protocol. Samples were processed using the Chromium NextGem Single Cell 5'v1.1 Kit (10X Genomics) and cDNA was prepared based on the 10X reverse transcriptase protocol as per manufacturer’s instructions resulting in complete virus inactivation. Samples were then transported out of the BSL-3 facility and stored at -80°C for concurrent library preparation and sequencing. Briefly, gene expression libraries were prepared following the 10x Genomics Chromium NextGem Single Cell 5’v1.1 protocol; libraries were quantified via Agilent 2100 hsDNA Bioanalyzer and KAPA library quantification kit (Roche); and sequenced at a targeted depth of 25,000 reads per cell. Libraries were pooled in equimolar concentration and sequenced on the Illumina NovaSeq 6000 SP 100 cycle kit with run parameters set to 28x8x0x60 (R1xi7xi5xR2).
scRNAseq preprocessing
For combined human-virus transcriptome reference, annotations for previously reported SARS-CoV-2 (BetaCoV/Korea/KCDC03/2020) RNAs (Kim et al., 2020) were downloaded from the UCSC Genome Browser Table Browser (Fernandes et al., 2020) after filtering for TRS-dependent transcripts and score >900 and exported to gtf format. Transcripts for previously unknown ORFs were excluded, and an additional annotation for “viral genome RNA” covering the full length of the SARS-CoV-2 genome was manually added. Aligning the BetaCoV/Korea/KCDC03/2020 genome with USA/WA-CDC-WA1/2020 genome showed that the USA/WA-CDC-WA1/2020 reference contained an additional 21 3′ adenosine nucleotides. To account for this in our annotations, we extended any annotations from BetaCoV/Korea/KCDC03/2020 that ended at the 3′ end of the genome an additional 21 bases. To minimize redundancy in the SARS-CoV-2 annotation of subgenomic RNAs (sgmRNAs) and thereby mitigate the exclusion of “ambiguous” sequence reads from scRNAseq quantification (i.e. reads derived from viral sgmRNAs mapping to redundant 3′ transcription regions), the 3′ region of each sgmRNA was truncated at the most distal 5′ start of the subsequent ORF immediately downstream. This SARS-CoV-2 reference transcriptome annotation was concatenated to human reference (GrCh38) and was then converted to a cellranger-compatible reference using cellranger/3.1.0 mkref (10X Genomics, Inc), and reads were aligned and quantified using cellranger/3.1.0 count.
scRNAseq analysis
Unfiltered cellranger-generated gene by cell matrices were analyzed in R/4.0.4 using Seurat/4.0.4 (Butler et al., 2018; Hafemeister and Satija, 2019; Macosko et al., 2015; Stuart et al., 2019). Because each donor sample was prepared independently, we assessed each dataset separately and set quality filters accordingly to exclude putative empty droplets, dead cells, and cell multiplets. Barcodes meeting the following filtering parameters were used for each sample: mock 1: 3,000 < total UMIs/cell < 15,000, 100 < total genes/cell < 4000, and percent mitochondrial gene expression < 15%; mock 2: 2,000 < total UMIs/cell < 15,000, 100 total genes/cell < 3,500, and percent mitochondrial gene expression < 10%; mock 3: 3,000 < total UMIs/cell < 15,000, 100 < total genes/cell < 4,000, and percent mitochondrial gene expression < 15%; infected 1: 3,000 < total UMIs/cell < 25,000, 10 < total genes/cell < 5,000, and percent mitochondrial gene expression < 10%; infected 2: 2,000 < total UMIs/cell < 15,000, 100 < total genes/cell < 3,500, and percent mitochondrial gene expression < 10%; infected 3: 3,000 < total UMIs/cell < 40,000, 10 < total genes/cell < 6,000, and percent mitochondrial gene expression < 15%. After filtering, data were scaled and normalized using SCTransform with regression for percent mitochondrial gene expression (Hafemeister and Satija, 2019). Cells were annotated per sample by comparing to an integrated reference dataset of five pancreas scRNAseq datasets (Baron et al., 2016; Grun et al., 2016; Lawlor et al., 2017; Muraro et al., 2016; Segerstolpe et al., 2016; Stuart et al., 2019) and performing a label transfer of the cell type annotations from the reference dataset to each sample with parameters as suggested by the Seurat developers (Stuart et al., 2019). Cells from infected samples were annotated for infection status by performing k-medoids clustering (k = 3) implemented with the pam algorithm on Euclidean distance of z-scaled log normalized viral subgenomic RNA gene expression per cell. For each sample, viral gene expression was evaluated per cluster, and cells within clusters with the most viral gene expression and expressing at least 5 viral genes were classified as infected. Cells in clusters with the least viral gene expression were classified as bystander. All remaining cells were not assigned to an infection state to minimize incorrect assignments in downstream comparisons. Cells from mock samples were classified as “mock” for their infection state. Cells from all samples were then integrated using the reciprocal PCA method (default settings as specified in the developer’s tutorial) with all mock samples set as reference datasets. Differential expression testing was performed using Seurat’s FindConservedMarkers function comparing host gene expression between infected and mock, infected and bystander, and bystander and mock cells within each donor. Donor 1 was excluded from infected cell contrasts due to insufficient numbers of infected cells. For gene set assessments, module scores were calculated using the Seurat function AddModuleScore for select Hallmark gene sets (“interferon alpha response,” “interferon gamma response”, “inflammatory response”, and “TNF⍺ signaling via NFκB”) using msigdbr/7.4.1 (Subramanian et al., 2005).
Quantification and statistical analysis
Data handling, analysis, inter-/intra-experimental normalization and graphic representation were performed in Prism 6 and 8 (GraphPad). Data were tested for normal distribution using the Shapiro Wilk test and statistical significance was assessed by t-test, paired t-test and Mann Whitney U test for comparison between two groups as well as by repeated measures ANOVA with Tukey’s multiple comparisons, or non-parametric Friedman test for analysis of more than two groups as specified. Data are displayed as mean ± SD unless indicated otherwise adopting the following convention: ∗ (or #) p<0.05, ∗∗ (or ##) p<0.01, and ∗∗∗ (or ###) p<0.001.
Acknowledgments
We thank the families of the organ donors for the gift of tissues. We would like to acknowledge the expertise and assistance of the Dean’s Flow Cytometry CORE at Mount Sinai as well as Jill Gregory, who designed the graphical abstract, printed here with permission from Mount Sinai Health System. These efforts were supported by JDRF 3-PDF-2018-575-A-N (to V.v.d.H.); NIH/NIDDK R01DK12392, NIH/NIAID P01AI042288, and NIH/NIAID U54AI142766-S1 (to M.A.A.); NIH/NIAID Center of Excellence for Influenza Research and Response/Center for Research for Influenza Pathogenesis and Transmission contract 75N93019R00028, NIH/NIAID U19AI135972 (supplement), Defense Advanced Research Projects Agency HR0011-19-2-0020, the JPB Foundation, and Open Philanthropy Project 2020-215611 (5384), Anonymous (to A.G.-S.); NIH/NIAID R01AI151029 and NIH/NIAID U01AI150748 (to B.R.R.); NIH/NIDDK R01DK130425 (to M.S.); and NIH/NIAID R01AI134971, NIH/NIDDK U01DK123716, NIH/NIDDK U01DK104162, NIH/NIDDK P30DK020541, and NIH/NIDDK R01DK130425 (to D. Homann). The funders had no role in study design, data collection, and interpretation, nor the decision to submit the work for publication.
Author contributions
Conceptualization and project administration, V.v.d.H., M.S., and D. Homann.; methodology, V.v.d.H. (viruses/infections and flow cytometry), S.J. (viruses/infections), R.R. (viruses/infections), T.A. (viruses/infections), R.A.A. (viruses/infections), M.S. (viruses/infections), A.R. (mass cytometry), I.K. (pancreas slices), J.K.P. (pancreas slices), A.C. (pancreas slices), A.G.-S. (viruses/infections), and D. Homann (mass cytometry and flow cytometry); investigation, V.v.d.H. (viruses/infections, flow cytometry, and pancreas slices), S.J. (viruses/infections and pancreas slices), R.R. (viruses/infections), S.A. (viruses/infections), T.A. (viruses/infections), R.A.A. (viruses/infections), M.S. (viruses/infections), T.D. (scRNA-seq), J.Q. (scRNA-seq), D.D. (scRNA-seq), D. Handler (mass cytometry), G.K. (mass cytometry), B.L. (mass cytometry), and D. Homann (flow cytometry); software, P.C. (scRNA-seq analysis) and B.R.R. (scRNA-seq analysis); data curation and formal analysis, V.v.d.H., S.J., P.C., B.R.R., M.S., and D. Homann; resources, B.R.R., M.S., A.G.-S., M.A.A., R.A.A., S.K.-S., and D. Homann; writing – original draft, V.v.d.H. and D. Homann; writing – review & editing, all authors; visualization, V.v.d.H., A.L.P., and D. Homann; supervision, M.S. and D. Homann; funding acquisition, V.v.d.H., M.A.A., A.G.-S., B.R.R., M.S., and D. Homann.
Declaration of interests
The A.G.-S. laboratory has received research support from Pfizer, Senhwa Biosciences, Kenall Manufacturing, Avimex, Johnson & Johnson, Dynavax, 7Hills Pharma, Pharmamar, ImmunityBio, Accurius, Nanocomposix, Hexamer, N-fold LLC, Model Medicines, and Merck outside of the reported work. A.G.-S. has consulting agreements outside of the reported work for the following companies, involving cash and/or stock: Vivaldi Biosciences, Contrafect, 7Hills Pharma, Avimex, Vaxalto, Pagoda, Accurius, Esperovax, Farmak, Applied Biological Laboratories, and Pfizer. A.G.-S. is an inventor on patents and patent applications on the use of antivirals and vaccines for the treatment and prevention of virus infections and cancer, owned by the Icahn School of Medicine at Mount Sinai, New York, outside of the reported work.
Inclusion and diversity
One or more of the authors of this paper received support from a program designed to increase minority representation in science. The author list of this paper includes contributors from the location where the research was conducted who participated in the data collection, design, analysis, and/or interpretation of the work.
Published: February 21, 2022
Footnotes
Supplemental information can be found online at https://doi.org/10.1016/j.celrep.2022.110508.
Supplemental information
Selected genes had a maximum p value within any infected or mock donor sample of 0.05.
Selected genes had adjusted p values of less than 0.01 and absolute log2 fold changes values greater than log2(1.5).
Selected genes had adjusted p values of less than 0.01 and absolute log2 fold changes values greater than log2(1.5).
Data and code availability
scRNAseq data is available from the GEO repository database with accession number GEO: GSE194061. Analysis code for sc RNA-Seq data is available on GitHub (https://github.com/BradRosenbergLab/pancreaticsarscov2infection) and is archived at Zenodo.org (https://zenodo.org/record/5912184 [https://doi.org/10.5281/zenodo.5912184]). Any additional information required to reanalyze the data reported in this paper is available from the lead contact upon request.
References
- Accili D. Can COVID-19 cause diabetes? Nat. Metab. 2021;3:123–125. doi: 10.1038/s42255-020-00339-7. [DOI] [PMC free article] [PubMed] [Google Scholar]
- Ahmed R., Salmi A., Butler L.D., Chiller J.M., Oldstone M.B. Selection of genetic variants of lymphocytic choriomeningitis virus in spleens of persistently infected mice. Role in suppression of cytotoxic T lymphocyte response and viral persistence. J. Exp. Med. 1984;160:521–540. doi: 10.1084/jem.160.2.521. [DOI] [PMC free article] [PubMed] [Google Scholar]
- Al-Aly Z., Xie Y., Bowe B. High-dimensional characterization of post-acute sequelae of COVID-19. Nature. 2021;594:259–264. doi: 10.1038/s41586-021-03553-9. [DOI] [PubMed] [Google Scholar]
- Atkinson M.A., Powers A.C. Distinguishing the real from the hyperglycaemia: does COVID-19 induce diabetes? Lancet Diabetes Endocrinol. 2021;9:328–329. doi: 10.1016/S2213-8587(21)00087-5. [DOI] [PMC free article] [PubMed] [Google Scholar]
- Augstein P., Naselli G., Loudovaris T., Hawthorne W.J., Campbell P., Bandala-Sanchez E., Rogers K., Heinke P., Thomas H.E., Kay T.W., et al. Localization of dipeptidyl peptidase-4 (CD26) to human pancreatic ducts and islet alpha cells. Diabetes Res. Clin. Pract. 2015;110:291–300. doi: 10.1016/j.diabres.2015.10.010. [DOI] [PubMed] [Google Scholar]
- Baggen J., Vanstreels E., Jansen S., Daelemans D. Cellular host factors for SARS-CoV-2 infection. Nat. Microbiol. 2021;6:1219–1232. doi: 10.1038/s41564-021-00958-0. [DOI] [PubMed] [Google Scholar]
- Baron M., Veres A., Wolock S.L., Faust A.L., Gaujoux R., Vetere A., Ryu J.H., Wagner B.K., Shen-Orr S.S., Klein A.M., et al. A single-cell transcriptomic map of the human and mouse pancreas reveals inter- and intra-cell population structure. Cell Syst. 2016;3:346–360 e344. doi: 10.1016/j.cels.2016.08.011. [DOI] [PMC free article] [PubMed] [Google Scholar]
- Barrett C.E., Koyama A.K., Alvarez P., Chow W., Lundeen E.A., Perrine C.G., Pavkov M.E., Rolka D.B., Wiltz J.L., Bull-Otterson L., et al. Risk for newly diagnosed diabetes >30 Days after SARS-CoV-2 infection among persons aged <18 Years - United States, march 1, 2020-june 28, 2021. MMWR Morb. Mortal. Wkly. Rep. 2022;71:59–65. doi: 10.15585/mmwr.mm7102e2. [DOI] [PMC free article] [PubMed] [Google Scholar]
- Beumer J., Geurts M.H., Lamers M.M., Puschhof J., Zhang J., van der Vaart J., Mykytyn A.Z., Breugem T.I., Riesebosch S., Schipper D., et al. A CRISPR/Cas9 genetically engineered organoid biobank reveals essential host factors for coronaviruses. Nat. Commun. 2021;12:5498. doi: 10.1038/s41467-021-25729-7. [DOI] [PMC free article] [PubMed] [Google Scholar]
- Bhandage A.K., Jin Z., Korol S.V., Shen Q., Pei Y., Deng Q., Espes D., Carlsson P.O., Kamali-Moghaddam M., Birnir B. GABA regulates release of inflammatory cytokines from peripheral blood mononuclear cells and CD4(+) T cells and is immunosuppressive in type 1 diabetes. EBioMedicine. 2018;30:283–294. doi: 10.1016/j.ebiom.2018.03.019. [DOI] [PMC free article] [PubMed] [Google Scholar]
- Bhatnagar J., Gary J., Reagan-Steiner S., Estetter L.B., Tong S., Tao Y., Denison A.M., Lee E., DeLeon-Carnes M., Li Y., et al. Evidence of severe acute respiratory syndrome coronavirus 2 replication and tropism in the lungs, airways, and vascular endothelium of patients with fatal coronavirus disease 2019: an autopsy case series. J. Infect. Dis. 2021;223:752–764. doi: 10.1093/infdis/jiab039. [DOI] [PMC free article] [PubMed] [Google Scholar]
- Blanco-Melo D., Nilsson-Payant B.E., Liu W.C., Uhl S., Hoagland D., Moller R., Jordan T.X., Oishi K., Panis M., Sachs D., et al. Imbalanced host response to SARS-CoV-2 drives development of COVID-19. Cell. 2020;181:1036–1045 e1039. doi: 10.1016/j.cell.2020.04.026. [DOI] [PMC free article] [PubMed] [Google Scholar]
- Bonthius D.J. Lymphocytic choriomeningitis virus: an underrecognized cause of neurologic disease in the fetus, child, and adult. Semin. Pediatr. Neurol. 2012;19:89–95. doi: 10.1016/j.spen.2012.02.002. [DOI] [PMC free article] [PubMed] [Google Scholar]
- Butler A., Hoffman P., Smibert P., Papalexi E., Satija R. Integrating single-cell transcriptomic data across different conditions, technologies, and species. Nat. Biotechnol. 2018;36:411–420. doi: 10.1038/nbt.4096. [DOI] [PMC free article] [PubMed] [Google Scholar]
- Cantuti-Castelvetri L., Ojha R., Pedro L.D., Djannatian M., Franz J., Kuivanen S., van der Meer F., Kallio K., Kaya T., Anastasina M., et al. Neuropilin-1 facilitates SARS-CoV-2 cell entry and infectivity. Science. 2020;370:856–860. doi: 10.1126/science.abd2985. [DOI] [PMC free article] [PubMed] [Google Scholar]
- Chertow D., Stein S., Ramelli S., Grazioli A., Chung J.-Y., Singh M., Yinda C.K., Winkler C., Dickey J., Kris Ylaya K., et al. SARS-CoV-2 infection and persistence throughout the human body and brain. Res. Sq. 2021 doi: 10.21203/rs.3.rs-1139035/v1. [DOI] [Google Scholar]
- Christen U., Kimmel R. Chemokines as drivers of the autoimmune destruction in type 1 diabetes: opportunity for therapeutic intervention in consideration of an optimal treatment schedule. Front. Endocrinol. 2020;11:591083. doi: 10.3389/fendo.2020.591083. [DOI] [PMC free article] [PubMed] [Google Scholar]
- Clarke S.A., Phylactou M., Patel B., Mills E.G., Muzi B., Izzi-Engbeaya C., Khoo B., Meeran K., Comninos A.N., Abbara A., et al. Preserved C-peptide in survivors of COVID-19: post-hoc analysis. Diabetes Obes. Metab. 2021;24:570–574. doi: 10.1111/dom.14608. [DOI] [PubMed] [Google Scholar]
- Coate K.C., Cha J., Shrestha S., Wang W., Goncalves L.M., Almaca J., Kapp M.E., Fasolino M., Morgan A., Dai C., et al. SARS-CoV-2 cell entry factors ACE2 and TMPRSS2 are expressed in the microvasculature and ducts of human pancreas but are not enriched in beta cells. Cell Metab. 2020;32:1028–1040 e1024. doi: 10.1016/j.cmet.2020.11.006. [DOI] [PMC free article] [PubMed] [Google Scholar]
- Codo A.C., Davanzo G.G., Monteiro L.B., de Souza G.F., Muraro S.P., Virgilio-da-Silva J.V., Prodonoff J.S., Carregari V.C., de Biagi Junior C.A.O., Crunfli F., et al. Elevated glucose levels favor SARS-CoV-2 infection and monocyte response through a HIF-1alpha/Glycolysis-Dependent Axis. Cell Metab. 2020;32:498–499. doi: 10.1016/j.cmet.2020.07.015. [DOI] [PMC free article] [PubMed] [Google Scholar]
- Coppieters K.T., Wiberg A., Tracy S.M., von Herrath M.G. Immunology in the clinic review series: focus on type 1 diabetes and viruses: the role of viruses in type 1 diabetes: a difficult dilemma. Clin. Exp. Immunol. 2012;168:5–11. doi: 10.1111/j.1365-2249.2011.04554.x. [DOI] [PMC free article] [PubMed] [Google Scholar]
- Daly J.L., Simonetti B., Klein K., Chen K.E., Williamson M.K., Anton-Plagaro C., Shoemark D.K., Simon-Gracia L., Bauer M., Hollandi R., et al. Neuropilin-1 is a host factor for SARS-CoV-2 infection. Science. 2020;370:861–865. doi: 10.1126/science.abd3072. [DOI] [PMC free article] [PubMed] [Google Scholar]
- Daniloski Z., Jordan T.X., Wessels H.H., Hoagland D.A., Kasela S., Legut M., Maniatis S., Mimitou E.P., Lu L., Geller E., et al. Identification of required host factors for SARS-CoV-2 infection in human cells. Cell. 2021;184:92–105 e116. doi: 10.1016/j.cell.2020.10.030. [DOI] [PMC free article] [PubMed] [Google Scholar]
- Dennis J.M., Mateen B.A., Sonabend R., Thomas N.J., Patel K.A., Hattersley A.T., Denaxas S., McGovern A.P., Vollmer S.J. Type 2 diabetes and COVID-19-related mortality in the critical care setting: a national cohort study in England, march-july 2020. Diabetes Care. 2021;44:50–57. doi: 10.2337/dc20-1444. [DOI] [PMC free article] [PubMed] [Google Scholar]
- Dorrell C., Schug J., Canaday P.S., Russ H.A., Tarlow B.D., Grompe M.T., Horton T., Hebrok M., Streeter P.R., Kaestner K.H., et al. Human islets contain four distinct subtypes of β cells. Nat. Commun. 2016;7:11756. doi: 10.1038/ncomms11756. [DOI] [PMC free article] [PubMed] [Google Scholar]
- Dorward D.A., Russell C.D., Um I.H., Elshani M., Armstrong S.D., Penrice-Randal R., Millar T., Lerpiniere C.E.B., Tagliavini G., Hartley C.S., et al. Tissue-specific immunopathology in fatal COVID-19. Am. J. Respir. Crit. Care Med. 2020;203:192–201. doi: 10.1164/rccm.202008-3265OC. [DOI] [PMC free article] [PubMed] [Google Scholar]
- Drucker D.J. Diabetes, obesity, metabolism, and SARS-CoV-2 infection: the end of the beginning. Cell Metab. 2021;33:479–498. doi: 10.1016/j.cmet.2021.01.016. [DOI] [PMC free article] [PubMed] [Google Scholar]
- Fernandes J.D., Hinrichs A.S., Clawson H., Gonzalez J.N., Lee B.T., Nassar L.R., Raney B.J., Rosenbloom K.R., Nerli S., Rao A.A., et al. The UCSC SARS-CoV-2 genome browser. Nat. Genet. 2020;52:991–998. doi: 10.1038/s41588-020-0700-8. [DOI] [PMC free article] [PubMed] [Google Scholar]
- Fignani D., Licata G., Brusco N., Nigi L., Grieco G.E., Marselli L., Overbergh L., Gysemans C., Colli M.L., Marchetti P., et al. SARS-CoV-2 receptor angiotensin I-converting enzyme type 2 (ACE2) is expressed in human pancreatic beta-cells and in the human pancreas microvasculature. Front. Endocrinol. 2020;11:596898. doi: 10.3389/fendo.2020.596898. [DOI] [PMC free article] [PubMed] [Google Scholar]
- Galluzzi L., Vitale I., Aaronson S.A., Abrams J.M., Adam D., Agostinis P., Alnemri E.S., Altucci L., Amelio I., Andrews D.W., et al. Molecular mechanisms of cell death: recommendations of the nomenclature committee on cell death 2018. Cell Death Differ. 2018;25:486–541. doi: 10.1038/s41418-017-0012-4. [DOI] [PMC free article] [PubMed] [Google Scholar]
- Grun D., Muraro M.J., Boisset J.C., Wiebrands K., Lyubimova A., Dharmadhikari G., van den Born M., van Es J., Jansen E., Clevers H., et al. De novo prediction of stem cell identity using single-cell transcriptome data. Cell Stem Cell. 2016;19:266–277. doi: 10.1016/j.stem.2016.05.010. [DOI] [PMC free article] [PubMed] [Google Scholar]
- Hafemeister C., Satija R. Normalization and variance stabilization of single-cell RNA-seq data using regularized negative binomial regression. Genome Biol. 2019;20:296. doi: 10.1186/s13059-019-1874-1. [DOI] [PMC free article] [PubMed] [Google Scholar]
- Hanson R.L., Muller Y.L., Kobes S., Guo T., Bian L., Ossowski V., Wiedrich K., Sutherland J., Wiedrich C., Mahkee D., et al. A genome-wide association study in American Indians implicates DNER as a susceptibility locus for type 2 diabetes. Diabetes. 2014;63:369–376. doi: 10.2337/db13-0416. [DOI] [PMC free article] [PubMed] [Google Scholar]
- Hikmet F., Mear L., Edvinsson A., Micke P., Uhlen M., Lindskog C. The protein expression profile of ACE2 in human tissues. Mol. Syst. Biol. 2020;16:e9610. doi: 10.15252/msb.20209610. [DOI] [PMC free article] [PubMed] [Google Scholar]
- Hoffmann M., Kleine-Weber H., Schroeder S., Kruger N., Herrler T., Erichsen S., Schiergens T.S., Herrler G., Wu N.H., Nitsche A., et al. SARS-CoV-2 cell entry depends on ACE2 and TMPRSS2 and is blocked by a clinically proven protease inhibitor. Cell. 2020;181:271–280.e278. doi: 10.1016/j.cell.2020.02.052. [DOI] [PMC free article] [PubMed] [Google Scholar]
- Hofmann H., Pyrc K., van der Hoek L., Geier M., Berkhout B., Pohlmann S. Human coronavirus NL63 employs the severe acute respiratory syndrome coronavirus receptor for cellular entry. Proc. Natl. Acad. Sci. U S A. 2005;102:7988–7993. doi: 10.1073/pnas.0409465102. [DOI] [PMC free article] [PubMed] [Google Scholar]
- Homann D. Back from the brink: the uses of targeting the CXCL10:CXCR3 Axis in type 1 diabetes. Diabetes. 2015;64:3990–3992. doi: 10.2337/dbi15-0019. [DOI] [PMC free article] [PubMed] [Google Scholar]
- Hulswit R.J.G., Lang Y., Bakkers M.J.G., Li W., Li Z., Schouten A., Ophorst B., van Kuppeveld F.J.M., Boons G.J., Bosch B.J., et al. Human coronaviruses OC43 and HKU1 bind to 9-O-acetylated sialic acids via a conserved receptor-binding site in spike protein domain A. Proc. Natl. Acad. Sci. U S A. 2019;116:2681–2690. doi: 10.1073/pnas.1809667116. [DOI] [PMC free article] [PubMed] [Google Scholar]
- Ibrahim S., Monaco G.S.F., Sims E.K. Not so sweet and simple: impacts of SARS-CoV-2 on the beta cell. Islets. 2021;13:66–79. doi: 10.1080/19382014.2021.1909970. [DOI] [PMC free article] [PubMed] [Google Scholar]
- Jivanji C.J., Asrani V.M., Windsor J.A., Petrov M.S. New-onset diabetes after acute and critical illness: a systematic review. Mayo Clin. Proc. 2017;92:762–773. doi: 10.1016/j.mayocp.2016.12.020. [DOI] [PubMed] [Google Scholar]
- Kamrath C., Rosenbauer J., Eckert A.J., Siedler K., Bartelt H., Klose D., Sindichakis M., Herrlinger S., Lahn V., Holl R.W. Incidence of type 1 diabetes in children and adolescents during the COVID-19 pandemic in Germany: results from the DPV registry. Diabetes Care. 2022:dc210969. doi: 10.2337/dc21-0969. [DOI] [PubMed] [Google Scholar]
- Khunti K., Del Prato S., Mathieu C., Kahn S.E., Gabbay R.A., Buse J.B. COVID-19, hyperglycemia, and new-onset diabetes. Diabetes Care. 2021;44:2645–2655. doi: 10.2337/dc21-1318. [DOI] [PMC free article] [PubMed] [Google Scholar]
- Kim D., Lee J.Y., Yang J.S., Kim J.W., Kim V.N., Chang H. The architecture of SARS-CoV-2 transcriptome. Cell. 2020;181:914–921 e910. doi: 10.1016/j.cell.2020.04.011. [DOI] [PMC free article] [PubMed] [Google Scholar]
- Kondegowda N.G., Fenutria R., Pollack I.R., Orthofer M., Garcia-Ocana A., Penninger J.M., Vasavada R.C. Osteoprotegerin and denosumab stimulate human beta cell proliferation through inhibition of the receptor activator of NF-kappaB ligand pathway. Cell Metab. 2015;22:77–85. doi: 10.1016/j.cmet.2015.05.021. [DOI] [PMC free article] [PubMed] [Google Scholar]
- Korns Johnson D., Homann D. Accelerated and improved quantification of lymphocytic choriomeningitis virus (LCMV) titers by flow cytometry. PLoS One. 2012;7:e37337. doi: 10.1371/journal.pone.0037337. [DOI] [PMC free article] [PubMed] [Google Scholar]
- Kusmartseva I., Wu W., Syed F., Van Der Heide V., Jorgensen M., Joseph P., Tang X., Candelario-Jalil E., Yang C., Nick H., et al. Expression of SARS-CoV-2 entry factors in the pancreas of normal organ donors and individuals with COVID-19. Cell Metab. 2020;32:1041–1051.e1046. doi: 10.1016/j.cmet.2020.11.005. [DOI] [PMC free article] [PubMed] [Google Scholar]
- Lawlor N., George J., Bolisetty M., Kursawe R., Sun L., Sivakamasundari V., Kycia I., Robson P., Stitzel M.L. Single-cell transcriptomes identify human islet cell signatures and reveal cell-type-specific expression changes in type 2 diabetes. Genome Res. 2017;27:208–222. doi: 10.1101/gr.212720.116. [DOI] [PMC free article] [PubMed] [Google Scholar]
- Lazarus G., Audrey J., Wangsaputra V.K., Tamara A., Tahapary D.L. High admission blood glucose independently predicts poor prognosis in COVID-19 patients: a systematic review and dose-response meta-analysis. Diabetes Res. Clin. Pract. 2021;171:108561. doi: 10.1016/j.diabres.2020.108561. [DOI] [PMC free article] [PubMed] [Google Scholar]
- Li J., Wang X., Chen J., Zuo X., Zhang H., Deng A. COVID-19 infection may cause ketosis and ketoacidosis. Diabetes Obes. Metab. 2020;22:1935–1941. doi: 10.1111/dom.14057. [DOI] [PMC free article] [PubMed] [Google Scholar]
- Li X., Yang K.Y., Chan V.W., Leung K.T., Zhang X.B., Wong A.S., Chong C.C.N., Wang C.C., Ku M., Lui K.O. Single-cell RNA-seq reveals that CD9 is a negative marker of glucose-responsive pancreatic beta-like cells derived from human pluripotent stem cells. Stem Cell Rep. 2020;15:1111–1126. doi: 10.1016/j.stemcr.2020.09.009. [DOI] [PMC free article] [PubMed] [Google Scholar]
- Li Y., Zhang Z., Yang L., Lian X., Xie Y., Li S., Xin S., Cao P., Lu J. The MERS-CoV receptor DPP4 as a candidate binding target of the SARS-CoV-2 spike. iScience. 2020;23:101400. doi: 10.1016/j.isci.2020.101400. [DOI] [PMC free article] [PubMed] [Google Scholar]
- Liadis N., Salmena L., Kwan E., Tajmir P., Schroer S.A., Radziszewska A., Li X., Sheu L., Eweida M., Xu S., et al. Distinct in vivo roles of caspase-8 in beta-cells in physiological and diabetes models. Diabetes. 2007;56:2302–2311. doi: 10.2337/db06-1771. [DOI] [PubMed] [Google Scholar]
- Maachi H., Ghislain J., Tremblay C., Poitout V. Pronounced proliferation of non-beta cells in response to beta-cell mitogens in isolated human islets of Langerhans. Sci. Rep. 2021;11:11283. doi: 10.1038/s41598-021-90643-3. [DOI] [PMC free article] [PubMed] [Google Scholar]
- Macosko E.Z., Basu A., Satija R., Nemesh J., Shekhar K., Goldman M., Tirosh I., Bialas A.R., Kamitaki N., Martersteck E.M., et al. Highly parallel genome-wide expression profiling of individual cells using nanoliter droplets. Cell. 2015;161:1202–1214. doi: 10.1016/j.cell.2015.05.002. [DOI] [PMC free article] [PubMed] [Google Scholar]
- Marciniak A., Cohrs C.M., Tsata V., Chouinard J.A., Selck C., Stertmann J., Reichelt S., Rose T., Ehehalt F., Weitz J., et al. Using pancreas tissue slices for in situ studies of islet of Langerhans and acinar cell biology. Nat. Protoc. 2014;9:2809–2822. doi: 10.1038/nprot.2014.195. [DOI] [PubMed] [Google Scholar]
- Mellado-Gil J., Rosa T.C., Demirci C., Gonzalez-Pertusa J.A., Velazquez-Garcia S., Ernst S., Valle S., Vasavada R.C., Stewart A.F., Alonso L.C., et al. Disruption of hepatocyte growth factor/c-Met signaling enhances pancreatic beta-cell death and accelerates the onset of diabetes. Diabetes. 2011;60:525–536. doi: 10.2337/db09-1305. [DOI] [PMC free article] [PubMed] [Google Scholar]
- Millette K., Cuala J., Wang P., Marks C., Woo V., Hayun M., Kang H., Martin M., Dhawan S., Chao L., et al. SARS-CoV2 infects pancreatic beta cells in vivo and induces cellular and subcellular disruptions that reflect beta cell dysfunction. Res. Sq. 2021 doi: 10.21203/rs.3.rs-592374/v1. [DOI] [Google Scholar]
- Miorin L., Kehrer T., Sanchez-Aparicio M.T., Zhang K., Cohen P., Patel R.S., Cupic A., Makio T., Mei M., Moreno E., et al. SARS-CoV-2 Orf6 hijacks Nup98 to block STAT nuclear import and antagonize interferon signaling. Proc. Natl. Acad. Sci. U S A. 2020;117:28344–28354. doi: 10.1073/pnas.2016650117. [DOI] [PMC free article] [PubMed] [Google Scholar]
- Misra S., Barron E., Vamos E., Thomas S., Dhatariya K., Kar P., Young B., Khunti K., Valabhji J. Temporal trends in emergency admissions for diabetic ketoacidosis in people with diabetes in England before and during the COVID-19 pandemic: a population-based study. Lancet Diabetes Endocrinol. 2021;9:671–680. doi: 10.1016/S2213-8587(21)00208-4. [DOI] [PMC free article] [PubMed] [Google Scholar]
- Montefusco L., Ben Nasr M., D'Addio F., Loretelli C., Rossi A., Pastore I., Daniele G., Abdelsalam A., Maestroni A., Dell'Acqua M., et al. Acute and long-term disruption of glycometabolic control after SARS-CoV-2 infection. Nat. Metab. 2021;3:774–785. doi: 10.1038/s42255-021-00407-6. [DOI] [PMC free article] [PubMed] [Google Scholar]
- Muller J.A., Gross R., Conzelmann C., Kruger J., Merle U., Steinhart J., Weil T., Koepke L., Bozzo C.P., Read C., et al. SARS-CoV-2 infects and replicates in cells of the human endocrine and exocrine pancreas. Nat. Metab. 2021;3:149–165. doi: 10.1038/s42255-021-00347-1. [DOI] [PubMed] [Google Scholar]
- Munster V.J., Feldmann F., Williamson B.N., van Doremalen N., Perez-Perez L., Schulz J., Meade-White K., Okumura A., Callison J., Brumbaugh B., et al. Respiratory disease in rhesus macaques inoculated with SARS-CoV-2. Nature. 2020;585:268–272. doi: 10.1038/s41586-020-2324-7. [DOI] [PMC free article] [PubMed] [Google Scholar]
- Muraro M.J., Dharmadhikari G., Grun D., Groen N., Dielen T., Jansen E., van Gurp L., Engelse M.A., Carlotti F., de Koning E.J., et al. A single-cell transcriptome atlas of the human pancreas. Cell Syst. 2016;3:385–394.e383. doi: 10.1016/j.cels.2016.09.002. [DOI] [PMC free article] [PubMed] [Google Scholar]
- Nilsson-Payant B.E., Uhl S., Grimont A., Doane A.S., Cohen P., Patel R.S., Higgins C.A., Acklin J.A., Bram Y., Chandar V., et al. The NF-kappaB transcriptional footprint is essential for SARS-CoV-2 replication. J. Virol. 2021;95:e0125721. doi: 10.1128/JVI.01257-21. [DOI] [PMC free article] [PubMed] [Google Scholar]
- Oldstone M.B., Sinha Y.N., Blount P., Tishon A., Rodriguez M., von Wedel R., Lampert P.W. Virus-induced alterations in homeostasis: alteration in differentiated functions of infected cells in vivo. Science. 1982;218:1125–1127. doi: 10.1126/science.7146898. [DOI] [PubMed] [Google Scholar]
- Owczarek K., Szczepanski A., Milewska A., Baster Z., Rajfur Z., Sarna M., Pyrc K. Early events during human coronavirus OC43 entry to the cell. Sci. Rep. 2018;8:7124. doi: 10.1038/s41598-018-25640-0. [DOI] [PMC free article] [PubMed] [Google Scholar]
- Panzer J.K., Hiller H., Cohrs C.M., Almaca J., Enos S.J., Beery M., Cechin S., Drotar D.M., Weitz J.R., Santini J., et al. Pancreas tissue slices from organ donors enable in situ analysis of type 1 diabetes pathogenesis. JCI Insight. 2020;5:e134525. doi: 10.1172/jci.insight.134525. [DOI] [PMC free article] [PubMed] [Google Scholar]
- Paraskevas S., Maysinger D., Wang R., Duguid T.P., Rosenberg L. Cell loss in isolated human islets occurs by apoptosis. Pancreas. 2000;20:270–276. doi: 10.1097/00006676-200004000-00008. [DOI] [PubMed] [Google Scholar]
- Perfetto S.P., Chattopadhyay P.K., Lamoreaux L., Nguyen R., Ambrozak D., Koup R.A., Roederer M. Amine-reactive dyes for dead cell discrimination in fixed samples. Curr. Protoc. Cytometry. 2010;9:Unit 9 34. doi: 10.1002/0471142956.cy0934s53. [DOI] [PMC free article] [PubMed] [Google Scholar]
- Qadir M.M.F., Bhondeley M., Beatty W., Gaupp D.D., Doyle-Meyers L.A., Fischer T., Bandyopadhyay I., Blair R.V., Bohm R., Rappaport J., et al. SARS-CoV-2 infection of the pancreas promotes thrombofibrosis and is associated with new-onset diabetes. JCI Insight. 2021;6:e151551. doi: 10.1172/jci.insight.151551. [DOI] [PMC free article] [PubMed] [Google Scholar]
- Rahman A.H., Homann D. Mass cytometry and type 1 diabetes research in the age of single-cell data science. Curr. Opin. Endocrinol. Diabetes Obes. 2020;27:231–239. doi: 10.1097/MED.0000000000000549. [DOI] [PMC free article] [PubMed] [Google Scholar]
- Rathnasinghe R., Jangra S., Cupic A., Martinez-Romero C., Mulder L.C.F., Kehrer T., Yildiz S., Choi A., Mena I., De Vrieze J., et al. The N501Y mutation in SARS-CoV-2 spike leads to morbidity in obese and aged mice and is neutralized by convalescent and post-vaccination human sera. Preprint at medRxiv. 2021 [Google Scholar]
- Rathnasinghe R., Karlicek R.F., Schotsaert M., Koffas M.A., Arduini B., Jangra S., Wang B., Davis J.L., Alnaggar M., Costa A., et al. Scalable, effective, and rapid decontamination of SARS-CoV-2 contaminated N95 respirators using germicidal ultra-violet C (UVC) irradiation device. Preprint at medRxiv. 2020 doi: 10.1038/s41598-021-99431-5. [DOI] [PMC free article] [PubMed] [Google Scholar]
- Rathnasinghe R., Strohmeier S., Amanat F., Gillespie V.L., Krammer F., Garcia-Sastre A., Coughlan L., Schotsaert M., Uccellini M.B. Comparison of transgenic and adenovirus hACE2 mouse models for SARS-CoV-2 infection. Emerg. Microbes Infect. 2020;9:2433–2445. doi: 10.1080/22221751.2020.1838955. [DOI] [PMC free article] [PubMed] [Google Scholar]
- Reiterer M., Rajan M., Gomez-Banoy N., Lau J.D., Gomez-Escobar L.G., Gilani A., Alvarez-Mulett S., Sholle E.T., Chandar V., Bram Y., et al. Hyperglycemia in acute COVID-19 is characterized by adipose tissue dysfunction and insulin resistance. Preprint at medRxiv. 2021 doi: 10.1016/j.cmet.2021.10.014. [DOI] [PMC free article] [PubMed] [Google Scholar]
- Richardson S.J., Rodriguez-Calvo T., Gerling I.C., Mathews C.E., Kaddis J.S., Russell M.A., Zeissler M., Leete P., Krogvold L., Dahl-Jorgensen K., et al. Islet cell hyperexpression of HLA class I antigens: a defining feature in type 1 diabetes. Diabetologia. 2016;59:2448–2458. doi: 10.1007/s00125-016-4067-4. [DOI] [PMC free article] [PubMed] [Google Scholar]
- Rodriguez-Calvo T., Sabouri S., Anquetil F., von Herrath M.G. The viral paradigm in type 1 diabetes: who are the main suspects? Autoimmun. Rev. 2016;15:964–969. doi: 10.1016/j.autrev.2016.07.019. [DOI] [PubMed] [Google Scholar]
- Rubino F., Amiel S.A., Zimmet P., Alberti G., Bornstein S., Eckel R.H., Mingrone G., Boehm B., Cooper M.E., Chai Z., et al. New-onset diabetes in covid-19. N. Engl. J. Med. 2020;383:789–790. doi: 10.1056/NEJMc2018688. [DOI] [PMC free article] [PubMed] [Google Scholar]
- Sardu C., D'Onofrio N., Balestrieri M.L., Barbieri M., Rizzo M.R., Messina V., Maggi P., Coppola N., Paolisso G., Marfella R. Outcomes in patients with hyperglycemia affected by COVID-19: can we do more on glycemic control? Diabetes Care. 2020;43:1408–1415. doi: 10.2337/dc20-0723. [DOI] [PMC free article] [PubMed] [Google Scholar]
- Sathish T., Kapoor N., Cao Y., Tapp R.J., Zimmet P. Proportion of newly diagnosed diabetes in COVID-19 patients: a systematic review and meta-analysis. Diabetes Obes. Metab. 2021;23:870–874. doi: 10.1111/dom.14269. [DOI] [PMC free article] [PubMed] [Google Scholar]
- Schneider W.M., Luna J.M., Hoffmann H.H., Sanchez-Rivera F.J., Leal A.A., Ashbrook A.W., Le Pen J., Ricardo-Lax I., Michailidis E., Peace A., et al. Genome-scale identification of SARS-CoV-2 and pan-coronavirus host factor networks. Cell. 2021;184:120–132.e114. doi: 10.1016/j.cell.2020.12.006. [DOI] [PMC free article] [PubMed] [Google Scholar]
- Schurink B., Roos E., Radonic T., Barbe E., Bouman C.S.C., de Boer H.H., de Bree G.J., Bulle E.B., Aronica E.M., Florquin S., et al. Viral presence and immunopathology in patients with lethal COVID-19: a prospective autopsy cohort study. Lancet Microbe. 2020;1:e290–e299. doi: 10.1016/S2666-5247(20)30144-0. [DOI] [PMC free article] [PubMed] [Google Scholar]
- Segerstolpe A., Palasantza A., Eliasson P., Andersson E.M., Andreasson A.C., Sun X., Picelli S., Sabirsh A., Clausen M., Bjursell M.K., et al. Single-cell transcriptome profiling of human pancreatic islets in Health and type 2 diabetes. Cell Metab. 2016;24:593–607. doi: 10.1016/j.cmet.2016.08.020. [DOI] [PMC free article] [PubMed] [Google Scholar]
- Shaharuddin S.H., Wang V., Santos R.S., Gross A., Wang Y., Jawanda H., Zhang Y., Hasan W., Garcia G., Jr., Arumugaswami V., et al. Deleterious effects of SARS-CoV-2 infection on human pancreatic cells. Front. Cell Infect. Microbiol. 2021;11:678482. doi: 10.3389/fcimb.2021.678482. [DOI] [PMC free article] [PubMed] [Google Scholar]
- Steenblock C., Richter S., Berger I., Barovic M., Schmid J., Schubert U., Jarzebska N., von Massenhausen A., Linkermann A., Schurmann A., et al. Viral infiltration of pancreatic islets in patients with COVID-19. Nat. Commun. 2021;12:3534. doi: 10.1038/s41467-021-23886-3. [DOI] [PMC free article] [PubMed] [Google Scholar]
- Stuart T., Butler A., Hoffman P., Hafemeister C., Papalexi E., Mauck W.M., 3rd, Hao Y., Stoeckius M., Smibert P., Satija R. Comprehensive integration of single-cell data. Cell. 2019;177:1888–1902.e1821. doi: 10.1016/j.cell.2019.05.031. [DOI] [PMC free article] [PubMed] [Google Scholar]
- Subramanian A., Tamayo P., Mootha V.K., Mukherjee S., Ebert B.L., Gillette M.A., Paulovich A., Pomeroy S.L., Golub T.R., Lander E.S., et al. Gene set enrichment analysis: a knowledge-based approach for interpreting genome-wide expression profiles. Proc. Natl. Acad. Sci. U S A. 2005;102:15545–15550. doi: 10.1073/pnas.0506580102. [DOI] [PMC free article] [PubMed] [Google Scholar]
- Tang X., Uhl S., Zhang T., Xue D., Li B., Vandana J.J., Acklin J.A., Bonnycastle L.L., Narisu N., Erdos M.R., et al. SARS-CoV-2 infection induces beta cell transdifferentiation. Cell Metab. 2021;33:1577–1591.e7. doi: 10.1016/j.cmet.2021.05.015. [DOI] [PMC free article] [PubMed] [Google Scholar]
- Turk Wensveen T., Gasparini D., Rahelic D., Wensveen F.M. Type 2 diabetes and viral infection; cause and effect of disease. Diabetes Res. Clin. Pract. 2021;172:108637. doi: 10.1016/j.diabres.2020.108637. [DOI] [PMC free article] [PubMed] [Google Scholar]
- Vendrell J., Chacon M.R. TWEAK: a new player in obesity and diabetes. Front. Immunol. 2013;4:488. doi: 10.3389/fimmu.2013.00488. [DOI] [PMC free article] [PubMed] [Google Scholar]
- Vignuzzi M., Lopez C.B. Defective viral genomes are key drivers of the virus-host interaction. Nat. Microbiol. 2019;4:1075–1087. doi: 10.1038/s41564-019-0465-y. [DOI] [PMC free article] [PubMed] [Google Scholar]
- von Herrath M.G., Fujinami R.S., Whitton J.L. Microorganisms and autoimmunity: making the barren field fertile? Nat. Rev. Microbiol. 2003;1:151–157. doi: 10.1038/nrmicro754. [DOI] [PubMed] [Google Scholar]
- Wu C.T., Lidsky P.V., Xiao Y., Lee I.T., Cheng R., Nakayama T., Jiang S., Demeter J., Bevacqua R.J., Chang C.A., et al. SARS-CoV-2 infects human pancreatic beta cells and elicits beta cell impairment. Cell Metab. 2021;33:1565–1576.e5. doi: 10.1016/j.cmet.2021.05.013. [DOI] [PMC free article] [PubMed] [Google Scholar]
- Wu J., Huang J., Zhu G., Wang Q., Lv Q., Huang Y., Yu Y., Si X., Yi H., Wang C., et al. Elevation of blood glucose level predicts worse outcomes in hospitalized patients with COVID-19: a retrospective cohort study. BMJ Open Diabetes Res. Care. 2020;8:e001476. doi: 10.1136/bmjdrc-2020-001476. [DOI] [PMC free article] [PubMed] [Google Scholar]
- Yang L., Han Y., Nilsson-Payant B.E., Gupta V., Wang P., Duan X., Tang X., Zhu J., Zhao Z., Jaffre F., et al. A human pluripotent stem cell-based platform to study SARS-CoV-2 tropism and model virus infection in human cells and organoids. Cell Stem Cell. 2020;27:125–136.e127. doi: 10.1016/j.stem.2020.06.015. [DOI] [PMC free article] [PubMed] [Google Scholar]
- Zhu L., She Z.G., Cheng X., Qin J.J., Zhang X.J., Cai J., Lei F., Wang H., Xie J., Wang W., et al. Association of blood glucose control and outcomes in patients with COVID-19 and pre-existing type 2 diabetes. Cell Metab. 2020;31:1068–1077.e1063. doi: 10.1016/j.cmet.2020.04.021. [DOI] [PMC free article] [PubMed] [Google Scholar]
Associated Data
This section collects any data citations, data availability statements, or supplementary materials included in this article.
Supplementary Materials
Selected genes had a maximum p value within any infected or mock donor sample of 0.05.
Selected genes had adjusted p values of less than 0.01 and absolute log2 fold changes values greater than log2(1.5).
Selected genes had adjusted p values of less than 0.01 and absolute log2 fold changes values greater than log2(1.5).
Data Availability Statement
scRNAseq data is available from the GEO repository database with accession number GEO: GSE194061. Analysis code for sc RNA-Seq data is available on GitHub (https://github.com/BradRosenbergLab/pancreaticsarscov2infection) and is archived at Zenodo.org (https://zenodo.org/record/5912184 [https://doi.org/10.5281/zenodo.5912184]). Any additional information required to reanalyze the data reported in this paper is available from the lead contact upon request.