

Summary
Despite the importance of dopamine for striatal circuit function, mechanistic understanding of dopamine transmission remains incomplete. We recently showed that dopamine secretion relies on the presynaptic scaffolding protein RIM, indicating that it occurs at active zone-like sites similar to classical synaptic vesicle exocytosis. Here, we establish using a systematic gene knockout approach that Munc13 and Liprin-α, active zone proteins for vesicle priming and release site organization, are important for dopamine secretion. Furthermore, RIM zinc finger and C2B domains, which bind to Munc13 and Liprin-α, respectively, are needed to restore dopamine release after RIM ablation. In contrast, and different from typical synapses, the active zone scaffolds RIM-BP and ELKS, and RIM domains that bind to them, are expendable. Hence, dopamine release necessitates priming and release site scaffolding by RIM, Munc13, and Liprin-α, but other active zone proteins are dispensable. Our work establishes that efficient release site architecture mediates fast dopamine exocytosis.
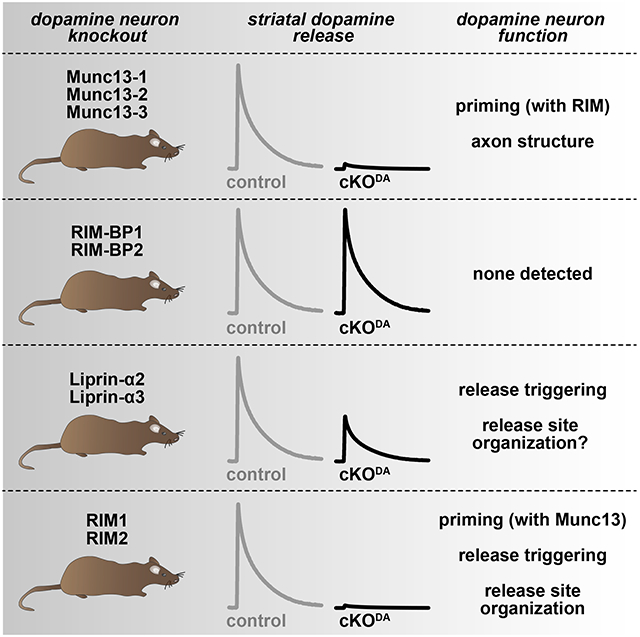
Graphical Abstract
eTOC blurb
Dopamine is a key neuromodulator for the control of striatal circuit function. Banerjee, Imig et al. show that evoked dopamine secretion occurs at release hotspots that contain multiple active zone proteins. Munc13, Liprin-α, and RIM cooperate to mediate vesicle priming and release, while other known active zone proteins are dispensable.
Introduction
Dopamine is a crucial neuromodulator for the control of locomotion, motivation and reward. While there is rich literature on dopamine action, dopamine signaling mechanisms remain incompletely understood. An important dopamine pathway in the vertebrate brain arises from cell bodies in the ventral midbrain, whose axons prominently project to the striatum. In the striatum, dopamine axons are extensively branched. A single axon covers a large area, and ascending action potentials as well as local regulatory mechanisms are important for dopamine release (Liu and Kaeser, 2019; Matsuda et al., 2009; Sulzer et al., 2016).
Dopamine is often considered a volume transmitter with slow and imprecise signaling: the majority of striatal dopamine varicosities lack synaptic specializations, dopamine receptors on target cells are localized away from release sites, and time-scales of the G-protein coupled receptor (GPCR) signaling are orders of magnitude slower than those of ionotropic receptors (Agnati et al., 1995; Descarries et al., 1996; Missale et al., 1998; Uchigashima et al., 2016). Recent studies, however, showed that dopamine influences synapses and behavior with subsecond precision (Howe and Dombeck, 2016; Menegas et al., 2018; Yagishita et al., 2014) and dopamine receptor activation can occur rapidly and requires a high dopamine concentration (Beckstead et al., 2004; Courtney and Ford, 2014; Gantz et al., 2018; Marcott et al., 2018), challenging the model of volume transmission. How signaling structures between dopamine releasing and receiving cells are organized to support such precise functions remains largely unknown (Liu et al., 2021). We recently showed that action potential-triggered dopamine release is executed with millisecond precision and requires the presynaptic scaffolding protein RIM (Banerjee et al., 2020; Liu et al., 2018; Robinson et al., 2019). This led to the working model that dopamine release is mediated at specialized secretory sites, but organizers of release site structure beyond RIM are not known. As an alternative to a scaffolded release site, it is possible that tethering functions of RIM are not important in dopamine varicosities. RIM could instead mediate dopamine secretion as a soluble protein or through association with vesicles.
At conventional synapses, exocytosis is ultrafast, triggered by Ca2+, and only occurs within the active zone (Kaeser and Regehr, 2014; Südhof, 2012). In addition to RIM, the active zone contains members of five protein families: Munc13, ELKS, Liprin-α, RIM-BP and Bassoon/Piccolo (Betz et al., 1998; Emperador-Melero and Kaeser, 2020; Wang et al., 2016; Wong et al., 2018). Together, these proteins form a molecular machine for the spatiotemporal control of secretion via three main mechanisms. First, docking and priming, mediated by RIM and Munc13, render vesicles ready for fast release (Augustin et al., 1999; Betz et al., 2001; Deng et al., 2011; Koushika et al., 2001; Richmond et al., 1999; Siksou et al., 2009; Varoqueaux et al., 2002). Second, the coupling of Ca2+ entry to these release-ready vesicles through close-by positioning of Ca2+ channels is orchestrated by a complex between RIM-BP, RIM and channels of the CaV2 family (Han et al., 2011; Held et al., 2020; Hibino et al., 2002; Kaeser et al., 2011; Liu et al., 2011; Müller et al., 2012). Third, the active zone coordinates the organization and function of essential release machinery components including SNARE proteins and lipids, for example phosphatidylinositol 4,5-bisphosphate (PIP2) (van den Bogaart et al., 2011; Honigmann et al., 2013; de Jong et al., 2018; Ma et al., 2011; Milosevic et al., 2005; Di Paolo and De Camilli, 2006).
Striatal dopamine release is fast and has a high release probability (Banerjee et al., 2020; Liu et al., 2018), indicating the presence of active zone scaffolds to organize release. Indeed, dopamine axons contain at least some active zone proteins, e.g. RIM, ELKS, Munc13 and Bassoon (Daniel et al., 2009; Liu et al., 2018; Silm et al., 2019; Uchigashima et al., 2016). Moreover, removal of RIM specifically from dopamine neurons abolishes evoked dopamine release, while action potential-independent release persists (Liu et al., 2018; Robinson et al., 2019). In contrast, ELKS is dispensable, and roles of other active zone proteins are unknown (Liu and Kaeser, 2019; Liu et al., 2018). Altogether, it has remained uncertain whether dopamine axons employ priming and scaffolding mechanisms similar to conventional synapses. Instead, dopamine release may not require the typical complement of active zone proteins, as has been proposed for the release of peptides, catecholamines and other non-synaptic transmitters (Berwin et al., 1998; van de Bospoort et al., 2012; Farina et al., 2015; Held and Kaeser, 2018; van Keimpema et al., 2017; Liu et al., 2010; Renden et al., 2001). Likewise, dopamine release only partially depends on Ca2+ entry through CaV2 channels (Brimblecombe et al., 2015), indicating that mechanisms other than those mediating the specific tethering of CaV2s are important.
Here, we determined functions of key active zone proteins in dopamine secretion and complemented this analysis with assessing roles of RIM domains that interact with these proteins. We show that Munc13 is essential for dopamine release and establish that interplay between RIM and Munc13 is important for priming of dopamine-laden vesicles. We find that scaffolding requirements of dopamine release sites are different from those at classical active zones: ELKS and RIM-BP are dispensable, and the RIM domains that bind to them do not contribute to release. Liprin-α2/3 knockout leads to a ~50% impairment in dopamine release, and dopamine release is restored in RIM knockouts by re-expressing a fusion construct of the RIM zinc finger (which binds to Munc13) with the RIM C2B domain (which binds to Liprin-α). We conclude that dopamine release sites contain molecular scaffolds of relatively low complexity compared to classical active zones. They employ Munc13-mediated vesicle priming for fast release and rely on RIM, Munc13 and Liprin-α for release site scaffolding.
Results
RIM domains cooperate in dopamine release
Molecular mechanisms of RIM function in dopamine release are unknown. At conventional synapses, RIM initiates vesicle priming via recruiting and activating Munc13, to which it binds with its N-terminal zinc finger domain (Fig. 1A) (Andrews-Zwilling et al., 2006; Betz et al., 2001; Deng et al., 2011; Kaeser and Regehr, 2017). The RIM PDZ domain directly binds to CaV2 channels and tethers them in concert with RIM-BP, which binds to a short proline-rich region of RIM between the C-terminal C2 domains (Hibino et al., 2002; Kaeser et al., 2011). The RIM C2A and C2B domains bind to PIP2, and C2B also interacts with Liprin-α and is essential for RIM function (de Jong et al., 2018; Koushika et al., 2001; Schoch et al., 2002).
Figure 1. RIM N- and C-terminal domains are necessary for evoked dopamine release.

(A) Schematic of RIM1α domain structure and protein interactions.
(B) Strategy for ablation of RIM1αβ and RIM2αβγ in dopamine neurons (RIM cKODA) and schematic of slice recordings.
(C, D) Sample traces (C, single sweeps) and quantification (D) of dopamine release in the dorsolateral striatum evoked by a 90-μA electrical stimulus and measured by carbon fiber amperometry in acute brain slices, 17 slices/3 mice each.
(E, F) Sample traces (E) and quantification (F) of dopamine release evoked by a 100 mM KCl puff, 20/3 each.
(G) Schematic of AAV5 rescue viruses injected either alone or together into the midbrain. For all AAVs, a double-floxed inverted strategy restricts expression to cre-expressing neurons.
(H-M) Sample traces (H, J and L, single sweeps) and quantification (I, K and M) of dopamine release as in C and D, I: 12/4 each; K: RIM cKODA 9/3, RIM cKODA + RIM1-ΔZn 10/3; M: 15/4 each.
(N-S) Same as H-L, but for a local 100 mM KCl puff, O: 11/4 each; Q: 10/3 each; S: RIM cKODA 16/4, RIM cKODA + RIM1-Zn + RIM1-ΔZn 17/4.
Data are mean ± SEM, *** p < 0.001 as assessed by Mann-Whitney test. For means and errors, p-values and the number of observations used for statistics for this and all following figures, see corresponding Tables S1-S8. For rescue expression and additional recordings, see Fig. S1.
We started assessing dopamine release mechanisms by rescue of RIM knockout phenotypes in striatal slices using amperometric recordings. We confirmed that conditional knockout of RIM in dopamine neurons (RIM cKODA), generated by crossing floxed alleles for both RIM genes to DATIRES-cre mice (Backman et al., 2006; Kaeser et al., 2008, 2011; Liu et al., 2018), abolishes dopamine release evoked by electrical stimulation and KCl puffs (Figs. 1B-1F). Electrical stimulation induces release through both the activation of dopamine axons and of cholinergic interneurons (Fig. S1A), which trigger dopamine release via nicotinic acetylcholine receptors (nAChRs) on dopamine axons (Cachope et al., 2012; Giorguieff et al., 1976; Liu et al., 2018; Threlfell et al., 2012; Zhou et al., 2001). Adeno-associated viruses (AAVs) do not allow expression of full-length RIM for rescue as the RIM coding sequence exceeds the packaging limit. We instead re-expressed either the RIM zinc finger domain (RIM1-Zn) or the C-terminal scaffolding sequences (RIM1-ΔZn), which together account for the known RIM domains (Fig. 1G). Expression was restricted to midbrain dopamine neurons through the use of cre-dependent AAVs delivered by stereotaxic injection at postnatal days 33 (P33) to P54, and was confirmed via Western blotting of striatal brain homogenates 7-10 weeks after injection (Fig. S1B). We measured dopamine release in RIM cKODA mice injected either with a control virus, or after re-expression of RIM1-Zn, RIM1-ΔZn, or both. Each experiment was performed on two RIM cKODA mice (one with and one without rescue) on the same day (Figs. 1H-1S), and an unrelated control mouse was recorded first on each day to establish stable dopamine detection (Figs. S1C-S1H, all three mice were analyzed with the same carbon fiber electrode).
Expression of RIM1-Zn or RIM1-ΔZn alone showed no rescue of dopamine release evoked by electrical stimulation when compared to RIM cKODA (Figs. 1H-1K). This is surprising because these constructs are sufficient to partially restore exocytosis of synaptic and peptidergic vesicles (Kaeser et al., 2011; Persoon et al., 2019). When RIM1-Zn and RIM1-ΔZn were coexpressed, we observed some but incomplete rescue of dopamine release (Figs. 1L, 1M). We next assessed dopamine release in response to depolarization triggered by local puff-application of KCl. KCl-induced dopamine release depends on extracellular Ca2+ (Figs. S1I, S1J) but not on nAChR or sodium channel activation (Figs. S1K, S1L), and is absent in RIM cKODA mice (Figs. 1E, 1F) (Liu et al., 2018). RIM1-Zn mediated a small amount of KCl-triggered release, RIM1-ΔZn was inactive, and combined expression led to more robust rescue (Figs. 1N-1S). These data establish that the RIM cKODA phenotype is partially reversible, and that co-expression of RIM zinc finger and scaffolding domains are needed for action potential-triggered release.
Munc13-1 forms small clusters in striatal dopamine axons
We next aimed to systematically assess loss-of-function phenotypes of RIM-interacting active zone proteins. The RIM zinc finger may enhance dopamine release through vesicle priming. At neuronal synapses, vesicle priming is executed by Munc13, which is recruited and activated by RIM zinc finger domains (Andrews-Zwilling et al., 2006; Augustin et al., 1999; Betz et al., 1998; Deng et al., 2011). Given the prominent role of RIM in dopamine release, we hypothesized that dopamine vesicles are primed by Munc13.
Of the three major brain Munc13 isoforms (Munc13-1, -2 and -3), Munc13-1 is strongly expressed in midbrain dopamine neurons, while the other Munc13s may be present at low levels (Lein et al., 2007; Saunders et al., 2018). Previous experiments in striatal synaptosomes suggested that Munc13-1 is present in dopamine varicosities and colocalizes with the release site marker Bassoon (Liu et al., 2018). However, a lack of suitable antibodies prevented the assessment of Munc13 distribution in intact striatum using superresolution microscopy. To circumvent this caveat, we used mice in which endogenous Munc13-1 is tagged with EYFP (Fig. 2A) (Kalla et al., 2006). We stained striatal brain sections with anti-GFP antibodies and assessed signal distribution in tyrosine hydroxylase (TH)-labeled dopamine axons with three dimensional structured illumination microscopy (3D-SIM) (Gustafsson et al., 2008; Liu et al., 2018) followed by an analysis pipeline detailed in the STAR methods. As expected for a prominent synaptic protein, Munc13-1 is abundant in the striatum and present in small clusters (Figs. 2B-2D). TH labeling was similar between Munc13-1-EYFP and controls (Figs. 2E, 2F), and we used a 40% volume overlap criterion as established before (Liu et al., 2018) to identify Munc13-1 clusters localized in TH axons. On average, there was one Munc13-1 cluster per ~2.5 μm of TH axon, and the average cluster volume was ~0.01 μm3 (Figs. 2G-2I). We used local shuffling of Munc13 clusters to further assess the signal. Munc13-1 cluster density within dopamine axons dropped after shuffling, establishing that Munc13-1 clusters were more frequently present within TH axons than in their immediate environment. Furthermore, Munc13-1 clusters within TH axons were larger than the clusters detected after shuffling (which likely represent Munc13-1 clusters of close-by conventional synapses). These findings establish that Munc13-1 is present in clusters within dopamine axons and thus agree with our earlier findings made in synaptosomes (Liu et al., 2018).
Figure 2. Munc13-1 is present in sparse clusters in dopamine axons.

(A) Schematic of the Munc13-1-EYFP knock-in mice.
(B) Sample 3D-SIM images of dorsolateral striatum stained with GFP antibodies (to detect Munc13-1) and TH antibodies (to visualize dopamine axons). Volume rendered images (10 x 10 x 2 μm3) showing Munc13-1 and TH (left), surface-rendered images of the same volumes (middle) and magnified view (right, 5 x 3 x 2 μm3 from dotted rectangle in middle, frontal and 90° rotated views of only Munc13-1 clusters with > 40% volume overlap with TH).
(C-I) Quantification of B. For (H) and (I), each Munc13-1 object was locally (within 1 x 1 x 1 μm3) and randomly shuffled 1000 times, and the actual Munc13-1 densities and volumes were compared to the averaged result after shuffling, Munc13-1-EYFP 88 images/3 mice; wild type 86/3.
Data are mean ± SEM, *** p < 0.001 as assessed by unpaired (C, D, E, F, G) and paired (H, I) t-tests.
Munc13 is essential for evoked striatal dopamine release
To assess roles of Munc13 in dopamine release, we developed mouse mutants for deletion of Munc13-1, -2 and -3. We circumvented lethality of constitutive Munc13-1 deletion through the generation of Munc13-1 conditional knockout mice (exon 21 was flanked with loxp sites) by homologous recombination in embryonic stem cells (Figs. S2A, S2B). The Munc13-1 floxed mice had normal Munc13-1 levels (Figs. S2C, S2D) germline cre-recombination removed full-length Munc13-1 (Figs. S2E, S2F). A very small amount of Munc13-1 (< 5%) at a slightly lower molecular weight persisted, likely representing a protein that lacks exons 21 and 22 (Fig. S2E). In cultured autaptic neurons of these mice, excitatory synaptic transmission was strongly impaired but not abolished (Fig. S3), with a dramatic reduction in the readily releasable pool (Figs. S3F, S3G), but a larger evoked EPSC (Figs. S3D, S3E) than expected from previous constitutive Munc13-1 knockout mice (Augustin et al., 1999). This difference may be due to the persistence of a small amount of the shorter and possibly partially active Munc13-1 variant in the new mutant (Figs. S2E, S2F).
To test whether Munc13 is needed for dopamine release, we crossed the Munc13-1 conditional (floxed) allele to constitutive Munc13-2 and Munc13-3 knockout mice (Augustin et al., 2001; Varoqueaux et al., 2002) and to DATIRES-cre mice (Backman et al., 2006, Fig. 3A). Munc13 cKODA mice (Munc13-1f/f x Munc13-2−/− x Munc13-3−/− x DATIRES-cre +/cre) and Munc13 control mice (Munc13-1+/f x Munc13-2+/− x Munc13-3−/− x DATIRES-cre +/cre) were generated from the same crossings. To selectively activate dopamine axons, we expressed a fast version of channelrhodopsin (oChIEF, Lin et al., 2009) specifically in dopamine neurons using cre-dependent AAVs delivered by stereotaxic injections (Fig. 3B) at P29-P36 (Banerjee et al., 2020; Liu et al., 2018). Three or more weeks after injection, we prepared acute brain slices and measured dopamine release triggered by optogenetic activation. In Munc13 control mice, dopamine release appeared normal and very similar in extent to other control mice (Liu et al., 2018, Figs. 6, 7). Peak amplitudes strongly depressed during brief stimulus trains, indicative of a high initial release probability as described (Liu et al., 2018). Release was abolished by the sodium channel blocker tetrodotoxin (TTX, Figs. 3C, 3D), establishing that optogenetic stimulation triggers release through inducing action potentials. Strikingly, dopamine release was almost completely absent in Munc13 cKODA mice, and there was no build-up of release during short stimulus trains (Figs. 3C-3E). Action potentials were readily elicited by light stimulation in Munc13 cKODA mice (Fig. S4). In Munc13 control mice, KCl puffs triggered dopamine release with a ~3.5-fold larger amplitude than release evoked by optogenetic stimulation (Figs. 3F-3H). In Munc13 cKODA mice, KCl application did not induce detectable release. Finally, electrical stimulation also failed to induce robust release in these mutants (Figs. 4A-4D). We conclude that Munc13 is essential for depolarization-induced dopamine secretion and even strong stimuli fail to elicit significant release after removing Munc13.
Figure 3. Munc13 is essential for evoked dopamine release.

(A) Targeting strategy for deletion of Munc13-1, -2 and -3 (Munc13 cKODA).
(B) Schematic of cre-dependent expression of oChIEF and slice recording.
(C-E) Sample traces (C, average of 4 sweeps) of dopamine release evoked by ten 1-ms light pulses at 10 Hz before and after TTX, quantification of the 1st stimulus amplitudes (D) and peak amplitudes normalized to the average 1st peak of Munc13 control (E), D: 5 slices/3 mice each, E: 6/3 each.
(F-H) Sample traces (F), and quantification of KCl-triggered peak dopamine release (G) and area under the curve (H, start of puff to 50 s), 7/3 each.
Data are mean ± SEM, ** p < 0.01, *** p < 0.001 as assessed by repeated measures one-way ANOVA followed by Sidak’s multiple comparisons tests in D; two-way ANOVA (*** p < 0.001 for genotype, stimulus number and interaction) followed by Sidak’s multiple comparisons tests in E (*** p < 0.001 for stimulus 1-4, ** p < 0.01 for stimulus 5), and Mann-Whitney test in G and H. For generation and analyses of Munc13-1 cKO mice, see Figs. S2 and S3; for extracellular recordings, see Fig. S4.
Figure 6. RIM-BP is dispensable for dopamine release.

(A) Strategy for ablation of RIM-BP1 and RIM-BP2 in dopamine neurons (RIM-BP cKODA).
(B-D) Sample traces of dopamine release (B, average of four sweeps) evoked by ten 1 ms-light pulses at 10 Hz, quantification of amplitudes (C) normalized to average of the first peak amplitude of RIM-BP control, peak amplitude evoked by the first stimulus and paired pulse ratios (PPR) of the 2nd to the 1st stimulus (C, inset), and 20-80% rise times (D), 8 slices/5 mice each.
(E-G) Sample traces (E), quantification of peak amplitudes (F) and area under the curve (G) in response to a KCl puff, 8/3 each.
Data are mean ± SEM, *** p < 0.001 as assessed by two-way ANOVA (*** for stimulus number, not significant (n.s.), for genotype, interaction) followed by Sidak’s multiple comparisons tests in C, and Mann-Whitney test in C (insets), F, and G. For electrical stimulation experiments, see Fig. S6.
Figure 7. Liprin-α is important for dopamine release.

(A) Strategy for ablation of Liprin-α2 and Liprin-α3 (Liprin-α cKODA).
(B) Sample 3D-SIM images (dimensions and overlap criteria as in Fig. 2B) of dorsolateral striatum stained for Bassoon and TH.
(C-G) Quantification of B as in Fig. 5G-5L, Liprin control 84 images/4 mice; Liprin cKODA 85/4.
(H-J) Sample traces of dopamine release (H, average of four sweeps) evoked by ten 1-ms light pulses at 10 Hz and quantification of amplitudes (I) normalized to the average of the first peak amplitude of RIM-BP control, 1st stimulus peak amplitude and PPR (I, inset), and 20-80% rise times (J), 11 slices/4 mice each.
(K-M) Sample traces (K), quantification of peak amplitudes (L) and area under the curve (M) in response to a KCl puff, 12/8 each.
Data are mean ± SEM, except for E (mean ± SD), ** p < 0.01, *** p < 0.001 as assessed by unpaired t-test in C, D, F, G; two-way ANOVA (*** p < 0.001 for distance and interaction, n.s. for genotype) in E; two-way ANOVA (*** p < 0.001 for genotype, stimulus number and interaction) followed by Sidak’s multiple comparisons tests in I (*** p < 0.001 for first and second stimuli), Mann-Whitney test in I (insets), J, L, M. For additional Liprin-α cKODA analyses, see Fig. S7.
Figure 4. Roles for Munc13 in other modes of dopamine release.

(A, B) Sample traces (A, single sweeps) and quantification of peak amplitudes (B) of dopamine release evoked by electrical stimulation (10-90 μA single electrical pulses), 10 slices/5 mice each.
(C, D) Sample traces (C, average of 4 sweeps) and quantification of peak dopamine amplitudes normalized to the 1st peak amplitude of Munc13 control (D) in response to ten electrical pulses at 10 Hz, inset in D shows peak amplitude for the 1st stimulus, 8/4 each.
(E) Quantification of extracellular dopamine levels within dorsal striatum measured by in vivo microdialysis. Values were normalized to average dopamine values of the 76th-120th min of Munc13 control. 10 μM TTX was reverse dialyzed starting at 121 min, 7 mice each.
Data are mean ± SEM, ** p < 0.01, *** p < 0.001, as assessed by two-way ANOVA (p < 0.001 for genotype, stimulus intensity/stimulus number/time and interaction) in B, D and E followed by Sidak’s multiple comparisons tests (B: ** p < 0.01 for 20 μA, *** p < 0.001 for 30-90 μA; D: *** p < 0.001 for 1st stimulus; E: *** p < 0.001 for 90-150th min, ** p < 0.01 for 165-195th min), and Mann-Whitney test for inset in D.
To determine whether Munc13 is important for dopamine release in vivo, we performed microdialysis in anesthetized mice (Fig. 4E). In control mice, extracellular dopamine was reduced to ~25% of its initial levels by reverse dialysis of TTX (to block firing). In Munc13 cKODA mice, dopamine levels were strongly decreased at baseline. Reverse dialysis of TTX only mildly reduced extracellular dopamine, and after TTX the dopamine levels between Munc13 control and cKODA mice were indistinguishable. We conclude that Munc13 is essential for action potential-triggered dopamine release in vivo. Notably, some extracellular dopamine persists after Munc13 knockout, and this could be due to release that is independent of Munc13 and action potentials similar to RIM-independent release (Liu et al., 2018; Robinson et al., 2019), release mediated by residual Munc13-1 (Fig. S2), or - trivially - tissue damage during microdialysis.
Roles for Munc13 in dopamine axon structure
While Munc13 is essential for synaptic vesicle release, removal of Munc13 and the resulting block of glutamate release in cultured hippocampal neurons or slices did not detectably impair neuronal or synapse structure (Sigler et al., 2017; Varoqueaux et al., 2002). To assess whether Munc13 is important for axonal and release site structure in dopamine neurons, we first prepared synaptosomes from striatal homogenates of Munc13 control and Munc13 cKODA mice (Figs. 5A-5E) as described (Liu et al., 2018). This circumvents limitations of quantifying fluorescent signals in tissue densely packed with synapses. We stained synaptosomes with antibodies against the active zone marker Bassoon, the synaptic vesicle protein synaptophysin, and the dopamine neuron marker tyrosine hydroxylase (TH). We generated regions of interest (ROIs) containing TH (TH+) and synaptophysin (syp+), and quantified intensities within these ROIs as described in the STAR methods. In Munc13 cKODA TH+ ROIs, TH intensities were moderately increased (Fig. 5B) and those of synaptophysin were somewhat decreased (Fig. 5C), suggesting structural alterations. Bassoon intensities, used as a proxy for release site structure, were increased in dopaminergic synaptosomes (TH+/syp+ ROIs) after Munc13 ablation (Figs. 5D, 5E). The same was true for TH+ only ROIs for Bassoon (Figs. S5A-S5C) and RIM (Figs. S5D-S5F). Munc13 cKODA did not affect Bassoon intensities in non-dopamine synapses (TH−/syp+ ROIs, Fig. 5D).
Figure 5. Munc13 cKODA affects dopamine axon structure and Bassoon clustering.

(A) Sample confocal images of striatal synaptosomes stained with the active zone marker Bassoon, the vesicle marker synaptophysin, and TH; synaptosomes co-expressing all three proteins (solid arrowhead) or non-dopaminergic synaptosomes (hollow arrows, no TH signal) are highlighted.
(B-E) Quantification of A, E shows the frequency histogram for Bassoon intensity in syp+TH+ ROIs (E), B, C: 30 images/3 mice each; D: syp+TH− 30/3 each; syp+TH+ 29/3 each; E: Munc13 control 221 ROIs/29 images/3 mice, Munc13 cKODA 168/29/3.
(F) Sample 3D-SIM images (dimensions and overlap criteria as in Fig. 2B) of dorsolateral striatum stained for Bassoon and TH.
(G-L) Quantification of F as in Fig. 2. In I, J, TH axon shape was assessed by determining the proportion of the axon surface at a specific distance from the medial axis of the TH-labelled axon, Munc13 control 163 images/4 mice; Munc13 cKODA 165/4 (G, H, K, L), 160/4 each (J).
Data are mean ± SEM except for J (mean ± SD), * p < 0.05, ** p < 0.01, *** p < 0.001 as assessed by unpaired t-test in B, C, G, H, K and L; one-way ANOVA followed by Sidak’s multiple comparisons tests in D; Kolmogorov-Smirnov test in E and two-way ANOVA (*** p < 0.001 for genotype, distance and interaction) in J. For additional morphological analyses, see Fig. S5.
To assess whether similar changes were present in intact striatum, we used 3D-SIM (Figs. 5F-5L). In slices of the dorsolateral striatum, TH axons appeared less dense and irregular in shape in Munc13 cKODA compared to control, the volume occupied by TH was somewhat reduced, and the length of the skeletonized TH axon network was decreased (Figs. 5F-5H). When we plotted binned histograms of the radii of TH axons, a right shift was detected, indicating that there were more axonal segments with larger radii (Figs. 5I, 5J). This likely explains the increased TH intensities in synaptosomes (Fig. 5B). We further found that the density and volume of Bassoon clusters were higher after Munc13 ablation (Figs. 5K, 5L), again matching with the synaptosomes data (Figs. 5D, 5E). Similar results were obtained for ELKS2 (Figs. S5G-S5K), another active zone scaffold in dopamine axons. We conclude that Munc13 is necessary for normal dopamine axon structure. This role is likely independent of dopamine release impairments because ablation of RIM or synaptotagmin-1 induce similarly strong dopamine secretory defects, but TH signals are unaffected in these mutants (Banerjee et al., 2020; Liu et al., 2018).
RIM-BP1 and RIM-BP2 are dispensable for dopamine release
RIM and Munc13 control dopamine release likely via vesicle priming. Restoring their interaction by expressing the RIM zinc finger in RIM cKODA mice, however, is not sufficient to rescue dopamine release; C-terminal sequences are also needed (Fig. 1). At conventional synapses, the C-terminal RIM domains mediate scaffolding, including the tethering of Ca2+ channels (Han et al., 2011; Kaeser et al., 2011). RIM contributes to this function in a tripartite complex with CaV2s and RIM-BP (Acuna et al., 2016; Hibino et al., 2002; Kaeser et al., 2011; Liu et al., 2011). It is noteworthy that striatal dopamine release is partially resistant to blockade of CaV2.1 (P/Q-type) and 2.2 (N-type) channels (Brimblecombe et al., 2015), establishing the contribution of other Ca2+ sources. RIM-BP expression is detected in dopamine neurons (Lein et al., 2007; Saunders et al., 2018), and RIM-BPs would be suited to couple to both CaV2s and other CaVs, for example CaV1s, because RIM-BP SH3 domains bind to proline-rich regions of CaV1 and CaV2 C-termini (Hibino et al., 2002).
We ablated RIM-BP1 and RIM-BP2 from dopamine neurons (RIM-BP cKODA, Fig. 6A) by crossing “floxed” alleles for these genes (Acuna et al., 2015) to DATIRES-cre mice (Backman et al., 2006). Surprisingly, dopamine release evoked by optogenetic activation (Figs. 6B, 6C, 6D), electrical stimulation (Fig. S6), or KCl depolarization (Figs. 6E-6G) was not affected by RIM-BP ablation. While it is possible that RIM-BP1/2 cKODA has subtle effects on dopamine secretion that cannot be detected with the approaches used here, our results establish that RIM-BPs are mostly dispensable for striatal dopamine release, different from mouse hippocampal mossy fiber synapses, the mouse calyx of Held and the fly neuromuscular junction, where RIM-BP has robust roles (Acuna et al., 2015; Brockmann et al., 2019; Liu et al., 2011).
Roles for Liprin-α2 and Liprin-α3 in dopamine release
Given that RIM-BP (Fig. 6) and ELKS (Liu et al., 2018) are dispensable for dopamine release, other C-terminal interactions of RIM are likely important. RIM binds to Liprin-α with its C2B domain (Schoch et al., 2002). Liprin-α proteins are organizers of invertebrate active zones (Böhme et al., 2016; Patel and Shen, 2009; Zhen and Jin, 1999). Vertebrates express four Liprin-α genes (Ppfia1-4) to produce Liprin-α1 through −α4. Liprin-α2 and −α3 are strongly expressed in brain and localized to synapses, and brain Liprin-α1 and −α4 expression is generally low (Emperador-Melero et al., 2021a; Wong et al., 2018; Zürner et al., 2011).
We generated dopamine-neuron double knockout mice for Liprin-α2 and −α3 (Liprin-α cKODA, Fig. 7A) by crossing floxed Liprin-α2 mice to constitutive Liprin-α3 knockouts and DATIRES-cre mice (Backman et al., 2006; Emperador-Melero et al., 2021a; Wong et al., 2018). We first probed for changes in dopamine axon structure. Apart from slightly increased Bassoon cluster densities, no morphological defects were detected (Figs. 7B-7G).
Dopamine release induced by optogenetic activation was reduced by ~50% in Liprin-α cKODA mice (Figs. 7H-7J), while dopamine axon action potential firing was unaffected (Figs. S7E-S7G). Release triggered by KCl was reduced similarly (Figs. 7K-7M). In contrast, release triggered by electrical stimulation, which strongly depends on nAChR receptor activation (Liu et al., 2018; Threlfell et al., 2012), appeared unimpaired (Fig. S7A-S7D). This could be because cholinergic interneuron function may be affected by constitutive Liprin-α3 knockout, for example by enhancement of release probability as we recently described for excitatory hippocampal synapses after Liprin-α2/3 ablation (Emperador-Melero et al., 2021a), or due to technical differences in the stimulation paradigm. Altogether, our data indicate important, albeit not essential, roles for Liprin-α in striatal dopamine release.
Attaching the RIM C2B domain to the RIM zinc finger restores dopamine release
Our analyses suggest that RIM zinc finger domains prime dopamine vesicles through Munc13 (Figs. 1-5). C-terminal RIM C2B domain interactions with Liprin-α may mediate scaffolding (Fig. 7). Binding of the central RIM domains, e.g. to ELKS and RIM-BP, appear less important (Fig. 6, Liu et al., 2018). If true, dopamine release should be restored by the presence of the zinc finger domain to boost vesicle priming via Munc13 and the RIM C2B domain, which may support scaffolding via Liprin-α and PIP2 (de Jong et al., 2018; Schoch et al., 2002). To test this, we compared three RIM rescue constructs (Fig. 8A):
Figure 8. RIM C2B domains are important for evoked dopamine release.

(A) Schematic of AAV5 viruses injected into the midbrain for cre-dependent expression of rescue proteins.
(B-G) Sample traces (B, D and F, single sweeps) and quantification (C, E and G) of dopamine release evoked by a 90 μA electrical stimulus, C: 16 slices/4 mice each; E: RIM cKODA + RIM1-ZnC2B 22/5, RIM cKODA + RIM1-ZnC2BKE 20/5; G: 19/4 each.
(H-M) Same as B-G, but for a local 100 mM puff of KCl, I: 18/4 each; K: RIM cKODA + RIM1-ZnC2B 23/5, RIM cKODA + RIM1-ZnC2BKE 21/5; M: 18/4 each.
(N) Model of an active zone-like site in dorsal striatum. RIM, Munc13, Liprin-α form release sites in dopamine varicosities, with Munc13 and RIM mediating dopamine vesicle priming and all three proteins contributing to scaffolding.
Data are mean ± SEM, * p < 0.05, *** p < 0.001 as assessed by Mann-Whitney test in C, E, G, I, K and M. For wild type control recordings, additional rescue, and comparisons of all rescue experiments, see Fig. S8.
(1) a RIM1-ZnC2B protein in which the zinc finger and C2B domains are connected with endogenous linker sequences that follow the RIM zinc finger,
(2) a RIM1-ZnC2BKE protein, which is identical to RIM1-ZnC2B except for two point mutations (K1513E, K1515E) that disrupt the activity of C2B in release (de Jong et al., 2018), and
(3) a RIM1-ZnPCP protein in which all RIM sequences (PDZ-C2A-PxxP) that are not present in RIM1-ZnC2B are fused to the zinc finger.
These rescue constructs were expressed in RIM cKODA mice using cre-dependent AAVs, and expression was confirmed using Western blotting (Fig. S8A). For each construct, we performed a comparison of its rescue activity to RIM cKODA (RIM1-ZnC2B: Figs. 8B, 8C, 8H, 8I; RIM1-ZnC2BKE: Figs. S8J-S8M; RIM1-ZnPCP: Figs. 8F, 8G, 8L, 8M), and we also directly compared RIM1-ZnC2B and RIM1-ZnC2BKE to one another (Figs. 8D, 8E, 8J, 8K).
Strikingly, RIM1-ZnC2B enhanced dopamine release evoked by electrical stimuli and KCl puffs over RIM cKODA (Figs. 8B, 8C, 8H, 8I) as effectively as co-expression of RIM1-Zn and RIM1-ΔZn (Figs. 1L, 1M, 1R, 1S, S8N, S8O). Inactivation of the C2B domain in this construct (RIM1-ZnC2BKE) or fusion of the other RIM domains to RIM1-Zn (RIM1-ZnPCP) disrupted the ability to restore release evoked by electrical stimulation. All three constructs partially restored KCl-triggered release (Fig. 8D-8G, 8J-8M, S8J-S8M), similar to co-expression of RIM1-Zn and RIM1-ΔZn (Fig. 1L-1M, 1R-1S). We compared rescue activity of all experiments through normalization against the average of all control recordings (Figs. S8N, S8O). This comparison revealed that RIM1-ZnC2B or RIM1-Zn + RIM1-ΔZn restore action potential evoked release, while co-expression or fusion of any other domain to RIM1-Zn supports KCl-triggered release. It is noteworthy that altogether, rescue is incomplete, with a maximum rescue of ~30-40% compared to unrelated wild type mice (Figs. S8N, S8O). This could be due to a combination of factors, including that rescue constructs may not be expressed in all dopamine neurons, that full-length RIM may be required, or that the RIM cKODA phenotype may not be fully reversible. Currently, AAV capacity limits prevent expression of full-length RIM and co-expression of optogenetic actuators in the same neurons. Hence, our conclusions should rely on comparing the various rescue conditions with one another in their activity over RIM cKODA.
We propose that RIM-C2B domains enable scaffolding of the RIM zinc finger to release sites to restore action potential-triggered dopamine release (Fig. 8N). The zinc finger and C2B domains appear sufficient to mediate the minimally needed release site functions, suggesting strikingly limited molecular requirements for dopamine release. Release triggered by KCl may represent a measure of vesicle fusogenicity. The strong stimulus may partially override the need for vesicle tethering close to Ca2+ entry and does not require the C2B domain.
Discussion
Despite central roles for striatal dopamine in circuit regulation and behavior, there remain major gaps in the understanding of the molecular and functional organization of its release. Dopamine release requires the active zone protein RIM (Liu et al., 2018; Robinson et al., 2019), but components or mechanisms of active zone-like release sites beyond this requirement were essentially unknown. Here, we found that Munc13 is essential for dopamine release and that RIM and Munc13 co-operate to promote dopamine vesicle priming (Figs. 1-5). The scaffolding mechanisms that organize dopamine release sites appear quite simple compared to classical synapses (Figs. 1, 6-8). The active zone scaffolds RIM-BP (Fig. 6) and ELKS (Liu et al., 2018) are dispensable for dopamine release, while Liprin-α2 and −α3 knockout has more pronounced effects on dopamine release (Fig. 7) than at hippocampal synapses (Emperador-Melero et al., 2021a). The C-terminal RIM C2B domain is important for dopamine release, and may contribute through binding of Liprin-α and/or PIP2 (Figs. 1, 7, 8). Our data lead to a model (Fig. 8N) in which RIM and Munc13 mediate vesicle priming and operate together with Liprin-α for rapid and precise release.
Does Munc13 prime dopamine vesicles for fast release?
Fast neurotransmitter release relies on vesicle priming, which prepares vesicles and plasma membranes for exocytosis and involves vesicle attachment to the target membrane (Imig et al., 2014; Kaeser and Regehr, 2017). At fast synapses, RIM recruits Munc13 to active zones and activates it, and Munc13 controls the assembly of SNARE complexes (Andrews-Zwilling et al., 2006; Betz et al., 2001; Camacho et al., 2017; Deng et al., 2011; Imig et al., 2014; Ma et al., 2013; Varoqueaux et al., 2002). For the release of modulatory transmitters, the priming mechanisms are less well understood. In some cases, they rely less on Munc13 and instead may employ alternate or additional priming pathways (Berwin et al., 1998; van de Bospoort et al., 2012; van Keimpema et al., 2017; Man et al., 2015; Renden et al., 2001). The observations that action potential-triggered dopamine release requires RIM and Munc13 and is mediated by RIM zinc finger domains indicate that striatal dopamine axons employ priming mechanisms similar to conventional synapses. These findings support the overall model of fast and efficient dopamine secretion (Liu et al., 2018, 2021).
Munc13 cKODA mice have altered dopamine axon and release site structure. This is unanticipated because previous studies found normal synapse assembly in the absence of Munc13 (Augustin et al., 1999; Sigler et al., 2017; Varoqueaux et al., 2002), synaptic vesicle exocytosis (Verhage et al., 2000), or presynaptic Ca2+ entry (Held et al., 2020). Furthermore, strong impairments in action potential-triggered dopamine secretion by ablation of synaptotagmin-1 (Banerjee et al., 2020) or RIM (Liu et al., 2018) do not lead to similar phenotypes. Hence, dopamine axon alterations are not caused by loss of dopamine secretion, but Munc13 may have independent roles in dopamine axon structure. These effects may be similar to a previously described role of Munc13 in the delay of growth rates of neurites in dissociated and organotypic slice cultures (Broeke et al., 2010). In our experiments, these roles could arise from cell autonomous Munc13 functions, or could be mediated by knockout of Munc13-2 and Munc13-3 in surrounding cells, for example through loss of secretion of modulatory substances important for growth. Roles in release site assembly, observed here as altered Bassoon clustering, have also been described in the fly neuromuscular junction and in cultured hippocampal neurons, where Munc13 controls the clustering of Brp or syntaxin, respectively (Böhme et al., 2016; Sakamoto et al., 2018). Hence, release site scaffolding may be a Munc13 function that is shared across several secretory systems.
Functional organization of active zone-like dopamine release sites
Initial observations suggested that RIM organizes active zone-like release sites (Liu et al., 2018). However, it remained unclear whether RIM operates as a release site scaffold or as a soluble or vesicle associated release factor. We found that RIM C2B domains are important, supporting the model of a scaffolded site. At classical synapses, active zone scaffolding mechanisms support three fundamental requirements: (1) they tether Ca2+ channels to release sites, (2) they dock vesicles to exocytotic sites, and (3) they mediate the attachment and positioning of release machinery at the correct place in the target membrane. How are these functions executed to support striatal dopamine release?
For synaptic secretion, Ca2+ channel tethering (1) is mediated by RIMs and RIM-BPs (Hibino et al., 2002; Kaeser et al., 2011; Wu et al., 2019). Several observations suggest that Ca2+ secretion-coupling in the dopamine system does not strongly rely on this synaptic protein complex. First, dopamine release is dependent on multiple CaVs including CaV1, CaV2 and CaV3 (Brimblecombe et al., 2015; Liu and Kaeser, 2019), and mechanisms that rely on RIM-CaV interactions unlikely explain the localization of channels other than CaV2s (Kaeser et al., 2011). Second, while RIM-BP may organize channels other than CaV2s (Hibino et al., 2002), RIM-BP1 and −2 are dispensable for dopamine release. Third, at synapses where RIM organizes CaV2s, the presence of high extracellular Ca2+ overrides the need for RIM (Kaeser et al., 2011, 2012), but this is not the case for striatal dopamine release (Liu et al., 2018). Finally, RIM-containing dopamine release sites are sparse, but Ca2+ entry appears to be present in all varicosities (Liu et al., 2018; Pereira et al., 2016). Together, these observations suggest that the RIM/RIM-BP complex is not the major or only organizer of Ca2+ channel complexes in dopamine axons. What other mechanisms could contribute? One possibility is that CaVs are organized through transmembrane proteins rather than active zone complexes, for example by neurexins, which organize CaVs and may drive synapse formation in cultured dopamine neurons (Ducrot et al., 2021; Luo et al., 2020). Another possibility is that α2δ proteins or β subunits drive positioning of various CaVs in dopamine neurons, which could explain why subtype-specific positioning mechanism are dispensable (Held et al., 2020; Hoppa et al., 2012). While our data indicate that dopamine release does not build upon the classical Ca2+ secretion-coupling mechanisms, future studies should address how Ca2+ entry and its coupling to release-ready vesicles are organized in the dopamine system.
Tethering and docking of vesicles (2) is likely important given the rapidity of dopamine release. At classical synapses, RIM and Munc13 mediate vesicle docking (Han et al., 2011; Imig et al., 2014; Kaeser et al., 2011; Wang et al., 2016; Wong et al., 2018). Technical limitations have prevented tests of vesicle docking in the dopamine system. Assessment of docking requires high pressure freezing rather than chemical fixation, which is difficult to adapt and optimize for acute brain slices from different brain regions, and, more importantly, dopamine-releasing varicosities are very sparse and difficult to identify. However, fast kinetics, high release probability, and Munc13- and RIM-dependence support that dopamine vesicle docking is mediated by classical, synaptic mechanisms. Alternative or complementary attachment could be mediated by phospholipid interactions, for example between PIP2 and synaptotagmin-1 (Chang et al., 2018; Jahn and Fasshauer, 2012). One interesting possibility is that both Ca2+ entry and vesicle-target membrane tethering, for example via synaptotagmin-1, are present in all dopamine varicosities (Banerjee et al., 2020; Pereira et al., 2016), but that priming for release only occurs in active zone-containing varicosities (Liu et al., 2018; Pereira et al., 2016). This may explain why some varicosities remain silent upon stimulation despite the presence of vesicles.
Target membrane attachment and positioning of release machinery (3) is poorly understood (Emperador-Melero and Kaeser, 2020). Proposed mechanisms at synapses include interactions with transmembrane proteins or target membrane phospholipids. However, strong active zone assembly phenotypes have not been reported upon disruption of any specific mechanism, for example abolishing binding to PIP2, or knocking out of CaV2s, LAR-PTPs or neurexins (Chen et al., 2017; Emperador-Melero et al., 2021b; Held et al., 2020; de Jong et al., 2018; Sclip and Südhof, 2020). Given the dopamine secretory deficits in Liprin-α cKODA mice (Fig. 6), Liprin-α binding to LAR-PTPs (Serra-Pages et al., 1998; Serra-Pagès et al., 1995) and the dependence of dopamine release on RIM C2B domains (which bind to Liprin-α and PIP2), the most parsimonious working model is that RIM C2B domains provide a key tethering mechanism at dopamine release sites. For glutamatergic transmission, secretory hotspots are strategically assembled opposed to postsynaptic receptor nanodomains (Biederer et al., 2017; Tang et al., 2016). This model is interesting to assess for the dopamine system, in which most varicosities are not associated with target cells through a synaptic organization (Descarries et al., 1996). One possibility is that release site localization is independent of dopamine receptor domains. An alternative model is that the small fraction of dopamine varicosities that is associated with postsynaptic cells (Descarries et al., 1996; Uchigashima et al., 2016) relies on transsynaptic organization, and only varicosities with this synaptic organization contain active zones for dopamine release. Recent work favors the former model, because both synaptic and non-synaptic varicosities have release capacity (Ducrot et al., 2021; Liu et al., 2021). Future work should address the relationship between dopamine receptors and the active zone-like release sites that we describe here.
Overall, our findings establish that dopamine release sites have evolved to be fast and efficient. Scaffolding is less complex than at classical synapses based on three lines of evidence. First, functional effects of RIM deletion are stronger than at regular synapses (de Jong et al., 2018; Kaeser et al., 2011; Liu et al., 2018). Second, the scaffolds ELKS (Liu et al., 2018) and RIM-BP (Fig. 6) are dispensable for dopamine release. Third, the RIM C-terminal domains are essential scaffolds of dopamine release machinery (Figs. 1, 8), and Munc13 has scaffolding roles as well (Fig. 5), but at conventional synapses these structural roles are largely dispensable (Augustin et al., 1999; Deng et al., 2011; Han et al., 2011; Kaeser et al., 2011; Sigler et al., 2017; Varoqueaux et al., 2002), indicating more redundancy. Hence, dopamine release site architecture appears different from prototypical synapses, and relies on simple, streamlined scaffolding mechanisms. Finally, our work supports a growing body of literature on release site diversity across transmitter systems and neuron subtypes (Brockmann et al., 2019; Emperador-Melero et al., 2021a; Held et al., 2016). Our findings on RIM, Munc13 and Liprin-α may be relevant for the organization of release machinery at specific classical synapses or in other neuromodulatory systems as well.
STAR Methods
Resource Availability
Lead Contact.
Further information and requests for resources and reagents should be directed to and will be fulfilled by the Lead Contact, Pascal S. Kaeser (kaeser@hms.harvard.edu).
Materials Availability.
Plasmids generated for this study will be shared without restrictions. Antibodies and recombinant viruses generated for this study are exhaustible and will be shared as long as they are available. Mouse lines will be shared upon request within the limits of the respective material transfer agreements.
Data and Code Availability.
The original code has been deposited to GitHub and is publicly available as listed in the key resources table. Data reported in this paper are available from the lead contact upon reasonable request. Any additional information required to reanalyze the data reported in this paper is available from the lead contact upon request.
Key resources table
| REAGENT or RESOURCE | SOURCE | IDENTIFIER |
|---|---|---|
| Antibodies | ||
| Mouse monoclonal anti-ß-Tubulin | Sigma-Aldrich | Cat#T4026; RRID:AB_477577 |
| Rabbit polyclonal anti-Munc13-1 | Synaptic Systems | Cat# 126 103; RRID:AB_887733 |
| Rabbit polyclonal anti-Munc13-1 (C-terminal #N395) | (Betz et al., 1997) | N/A |
| Rabbit polyclonal anti-Munc13-1 (N-terminal #40) | (Cooper et al., 2012; Varoqueaux et al., 2005) | N/A |
| Mouse monoclonal IgG1 anti-synaptophysin-1 (A100) | Synaptic Systems | Cat# 101 011; RRID:AB_887824 |
| Guinea pig polyclonal anti-Tyrosine hydroxylase (A111) | Synaptic Systems | Cat# 213 104, RRID:AB_2619897 |
| Rabbit polyclonal anti-Tyrosine hydroxylase (A66) | Millipore | Cat# AB152; RRID:AB_390204 |
| Rabbit monoclonal anti-GFP (A195) | Thermo Fisher Scientific | Cat# G10362; RRID:AB_2536526 |
| Mouse monoclonal IgG2a anti-Bassoon SAP7F407 (A85) | Enzo Life Sciences | Cat# ADI-VAM-PS003-F; RRID:AB_11181058 |
| Rabbit polyclonal antibody anti-RIM1 (A58) | Synaptic Systems | Cat# 140 003 RRID:AB_887774 |
| Rabbit polyclonal anti-ELKS2α (1029, A136) | (Held et al., 2016) | E3-1029 |
| Mouse monoclonal anti-HA-tag 6E2 (A250) | Cell Signaling Technology | Cat# 2367; RRID:AB_10691311 |
| Chemicals, Peptides, and Recombinant Proteins | ||
| Tetrodotoxin | Tocris | Cat. No. 1078 |
| Dihydro-β-erythroidine hydrobromide | Tocris | Cat. No. 2349 |
| Mammalian Protease Inhibitor Cocktail | Sigma | Cat# P8340 |
| Image-iT™ FX Signal Enhancer | Thermo Fisher Scientific | Cat# I36933 |
| Experimental Models: Cell Lines | ||
| Derivate of 129/Ola mouse embryonic stem cell line E14 | (Hooper et al., 1987) | RRID:CVCL_9108 |
| Mouse embryonic fibroblasts (MEF feeder cells) | Xenogen, Alameda, CA, USA | N/A |
| HEK293T | ATCC | Cat#: CRL-3216, RRID:CVCL_0063 |
| Experimental Models: Organisms/Strains | ||
| Mouse: Munc13-1fl/fl | This study | N/A |
| Mouse: Munc13-1 cKOgl | This study | N/A |
| Mouse: Munc13-1−/−; unc13atm1Bros | (Augustin et al., 1999) | MGI:2449468 |
| Mouse: Munc13-1mNeo/mNeo | (Rhee et al., 2002) | N/A; mutated Unc13a gene containing a neomycin cassette |
| Mouse: Munc13-2−/−; unc13btm1Rmnd | (Varoqueaux et al., 2002) | MGI:2449706 |
| Mouse: Munc13-3−/−; unc13ctm1Bros | (Augustin et al., 2001) | MGI:2449467 |
| Mouse: FLP deleter; Gt(ROSA)26Sortm1(FLP1)Dym | (Farley et al., 2000) | MGI:2429412 |
| Mouse: Ella-Cre; Tg(EIIa-cre)C5379Lmgd | (Lakso et al., 1996) | MGI:2137691 |
| Mouse: DATIRES-cre; B6.SJL-Slc6a3tm1.1(cre)Bkmm/J | (Backman et al., 2006) | JAX 006660, |
| Mouse: Munc13-1-EYFP; Unc13atm3Bros | (Kalla et al., 2006) | MGI:3695486 |
| Mouse: Liprin-α3−/− | (Wong et al., 2018) | N/A |
| Mouse: Liprin-α2fl/fl | (Emperador-Melero et al., 2021a) | MGI:2443834 |
| Mouse: RIM-BP1fl/fl; Tspoap1tm1Sud/J | (Acuna et al., 2015) | JAX: 023643 |
| Mouse: RIM-BP2fl/fl; Rimbp2tm1Sud/J | (Acuna et al., 2015) | JAX: 023644 |
| Mouse: RIM1fl/fl; Rims1tm3Sud/J | (Kaeser et al., 2008) | JAX:015832 |
| Mouse: RIM2fl/fl; Rims2tm1.1Sud/J | (Kaeser et al., 2011) | JAX:015833 |
| Recombinant DNA | ||
| BAC: BMQ-441L13 (pBACe3.6 backbone) | (Adams et al., 2005) | N/A |
| Targeting vector: PL253-M13-1loxP-e21-FRT-Neo-FRT-loxP-HSV-TK | This study | N/A |
| pAAV-hSyn-flex-RIM1-Zn-HA (p866) | This study | N/A |
| pAAV-hSyn-flex-RIM1-ΔZn-HA (p865) | This study | N/A |
| pAAV-hSyn-flex-RIM1-Zn-HA-C2B (p902) | This study | N/A |
| pAAV-hSyn-flex-RIM1-Zn-HA- Zn-C2BKE (p903) | This study | N/A |
| pAAV-hSyn-flex-RIM1-Zn-HA-PCP (p968) | This study | N/A |
| pAAV-hSyn-flex-oChIEF-citrine (p901) | Addgene, (Lin et al., 2009) | Plasmid# 50973, RRID:Addgene_50973 |
| pAAV-hSyn-flex-citrine (p906) | This study | N/A |
| Oligonucleotides | ||
| Munc13-1 genotyping: 5'-CTCTATGGCTTCTGAGGCGGAAA-3' |
This study | LabID:27121 |
| Munc13-1 genotyping: 5'-AGTTTTCATCTTGTAGCCCGAT-3' |
This study | LabID:27122 |
| Munc13-1 genotyping: 5'-CAACTGGCCAAGAACTAGAGGA-3' |
This study | LabID:27123 |
| Munc13-1 genotyping: 5'-GCACGGAATGTTGAATGGTCTT -3' |
This study | LabID:27124 |
| Munc13-1 splice variants, exon 20; sense: 5’-CCATCCGGCTTCACATCAGT-3’ | This study | LabID:24609 |
| Munc13-1 splice variants, exon 23; antisense: 5’-CGATCCGCAGAGAATTGTGTAGC-3’ | This study | LabID:34504 |
| Munc13-1 splice variants, exon 25; antisense: 5’-TACTCCCGGCCATAGAGCTCA-3’ | This study | LabID:34505 |
| Software and Algorithms | ||
| Custom machine learning code for TH morphology | This study | DOI: 10.5281/zenodo.5576622 |
| Custom MATLAB code | (Liu et al., 2018) | DOI: 10.5281/zenodo.5576635 |
| DNASTAR Lasergene 13 | DNASTAR | RRID:SCR_011854; https://www.dnastar.com/software/lasergene/ |
| GraphPad Prism | GraphPad | RRID:SCR_002798; http://www.graphpad.com/ |
| Fiji | Schindelin et al., 2012 | RRID:SCR_002285, https://imagej.net/Fiji/Downloads |
| DeltaVision OMX imaging system | GE Healthcare | RRID: SCR_019956; https://scicrunch.org/resources/Tools/record/nlx_144509-1/SCR_019956/resolver?q=SCR_019956&l=SCR_019956 |
| Olympus Fluoview FV10-ASW | Olympus Fluoview | RRID:SCR_014215, http://www.photonics.com/Product.aspx?PRID=47380 |
| pClamp | Molecular Devices | RRID:SCR_011323, http://www.moleculardevices.com/products/software/pclamp.html |
| Imaris 9.0.2 | Oxford Instruments | RRID:SCR_007370 http://www.bitplane.com/imaris/imaris |
Experimental Model and Subject Details
All animal experiments were done in accordance with approved protocols of either the Harvard University Animal Care and Use Committee, or the Niedersächsisches Landesamt für Verbraucherschutz und Lebensmittelsicherheit (LAVES; 33.19.42502-04-15/1817) and according to the European Union Directive 63/2010/EU and ETS 123. Conditional deletion of active zone proteins in dopamine neurons was performed using DATIRES-cre mice (JAX: 006660, B6.SJL-Slc6a3tm1.1(cre)Bkmm/J, Backman et al., 2006). Unless noted otherwise, cKODA mice are mice that have two floxed alleles for active zone genes and one DATIRES-cre allele, and corresponding control mice are either siblings or age-matched mice from the same breeding colony with one floxed allele per gene and one DATIRES-cre allele. Given that dopamine release in control mice across experiments in various mutants is similar, we conclude that heterozygosity in any of these alleles has no strong effects on dopamine release.
RIM cKODA mice were generated previously (Liu et al., 2018) by breeding DATIRES-cre mice to RIM1αβ (JAX:015832, Rims1tm3Sud/J, Kaeser et al., 2008) and RIM2αβγ (JAX:015833, Rims2tm1.1Sud/J, Kaeser et al., 2011) floxed mice. RIM cKODA were born in numbers following approximately Mendelian ratios (assessed in breeding pairs with 12.5% expected RIM cKODA mice: 38 of 407 pups, 9.3%), did not display any obvious developmental phenotypes, and their body weight was normal at the time of stereotaxic surgery (18 RIM cKODA mice, 19.0 ± 0.6 g; 18 unrelated control mice = 19.5 ± 1.0 g, p = 0.6, Mann-Whitney test).
Munc13 cKODA mice were produced with newly generated floxed Munc13-1 mice (after crossing to flp deleter mice, Farley et al., 2000) that were crossed to constitutive knockout mice for Munc13-2 (Unc13btm1Rmnd, RRID_MGI:2449706, Varoqueaux et al., 2002) and Munc13-3 (Unc13ctm1Bros, RRID_MGI:2449467, Augustin et al., 2001) and DATIRES-cre mice. Munc13 cKODA were Munc13-1f/f x Munc13-2−/− x Munc13-3−/− x DATIRES-cre +/cre. Munc13 control mice were littermate mice with Munc13-1+/f x Munc13-2+/− x Munc13-3−/− x DATIRES-cre +/cre. The Munc13-3 allele was maintained at homozygosity in breeding pairs to enable the generation of Munc13 control and Munc13 cKODA siblings from the same litters/breedings. Munc13 cKODA mice were born in numbers following approximately expected numbers from Mendelian ratios (assessed in breeding pairs with 12.5% expected Munc13 cKODA mice: 26 of 179 pups, 14.5%), but were smaller than Munc13 control mice at the time of stereotaxic surgery (21 Munc13 cKODA mice, 14.0 ± 1.0 g, p < 0.001; 21 Munc13 control mice, 22.1 ± 1.4 g; Mann-Whitney test), likely due to constitutive double knockout of Munc13-2 and Munc13-3. For assessment of protein content and autaptic phenotypes, Munc13-1 floxed mice were cre-recombined in the germline using EIIa-cre mice (Lakso et al., 1996), and protein content was compared to two previously established Munc13-1 knockout mouse lines (Augustin et al., 1999; Rhee et al., 2002).
RIM-BP cKODA mice were generated by crossing RIM-BP1f/f x RIM-BP2f/f mice (RIM-BP1: JAX: 023643; Tspoap1tm1Sud, RIM-BP2: JAX: 023644; Rimbp2tm1Sud/J, Acuna et al., 2015), obtained from Dr. T. C. Südhof, to DATIRES-cre mice. RIM-BP cKODA mice were born in numbers following approximately expected numbers from Mendelian ratios (assessed in breeding pairs with 12.5% expected RIM-BP cKODA mice: 36 of 257 pups, 14.0%), did not display any obvious developmental phenotypes and their body weight was normal at the time of stereotaxic surgery (15 RIM-BP cKODA mice, 19.6 ± 1.0 g; 15 RIM-BP control mice, 20.1 ± 0.9 g, p = 0.7, Mann-Whitney test).
Liprin-α cKODA mice were produced by crossing recently generated Liprin-α2f/f mice (Emperador-Melero et al., 2021a) to constitutive Liprin-α3 knockout mice (Wong et al., 2018) and DATIRES-cre mice. Liprin-α cKODA were Liprin-α2f/f x Liprin-α3−/− x DATIRES-cre +/cre, and Liprin-α control mice were littermates with Liprin-α2+/f x Liprin-α3+/− x DATIRES-cre +/cre. Liprin-α cKODA mice were born in numbers following approximately expected numbers from Mendelian ratios (assessed in breeding pairs with 12.5% expected Liprin-α cKODA mice: 15 of 168 pups, 8.9%), did not display any obvious developmental phenotypes and their body weight was normal at the time of stereotaxic surgery (25 Liprin-α cKODA mice, 20.5 ± 1.0 g; 25 Liprin-α control mice, 22.0 ± 1.1 g, p = 0.2, Mann-Whitney test).
Munc13-1-EYFP mice were previously described (RRID_MGI:3695486; Unc13atm3Bros, Kalla et al., 2006), and homozygote Munc13-1-EYFP mice and unrelated age-matched control mice were used for all experiments.
All mice were group housed in a 12 h light-dark cycle with free access to water and food. All experiments with genotype comparisons were done in male and female mice, and the experimenter was blind to genotype throughout data acquisition and analysis.
Method Details
Rescue constructs and production of AAV viruses.
AAVs were used to either deliver domains of active zone proteins to dopamine neurons or to stimulate dopamine neurons by inducing expression of the fast channelrhodopsin oChIEF. The RIM rescue AAVs contained the following residues (residue numbering according to Uniprot ID Q9JIR4, all clones missing splice inserts 83NI…DW105, 1084HS…TR1169, 1207AS…QT1378, identical to previous RIM expression and rescue experiments (Deng et al., 2011; de Jong et al., 2018; Kaeser et al., 2011; Tang et al., 2016): AAV5-hSyn-FLEX-RIM1-Zn-HA/p866 1MS….QD213 (HA-tag inserted at C-terminus), AAV5-hSyn-flex-RIM1-ΔZn-HA/p865 MSSAVAG-597HP….RS1615 (HA-tag inserted between residues 1379E-S1380), and AAV5-hSyn-flex-RIM1-Zn-HA-C2B/p902 1MS….SS596-AAAGYPYDVPDYAAGAP-1379SG….RS1615 (HA-tag inserted in the linker between SS596 and 1379SG as indicated in italic), AAV5-hSyn-flex-RIM1-Zn-HA-C2BKE/p903 (identical to AAV5-hSyn-flex-RIM1-Zn-HA-C2B/p902 except for E1513K and E1515K point mutations), AAV5-hSyn-flex-RIM1-Zn-HA-PCP/p968 1MS….QD213- AAAGYPYDVPDYAAGAP597HP….EQ1256 (HA-tag inserted in the linker between QD213 and 597HP as indicated in italic). AAV5-hSyn-flex-citrine/p906 was used as a control. For optogenetic activation of striatal dopamine fibers, AAV5-hSyn-flex-oChIEF-citrine/p901 was used to drive cre-dependent expression of oChIEF-citrine (RRID:Addgene_50973, Lin et al., 2009). All AAVs were generated using Ca2+-phosphate transfection in HEK293T cells (mycoplasma free cell line from ATCC, Cat#: CRL-3216, RRID:CVCL_0063) as AAV2/5 serotypes. 72 h after transfection, cells were collected, lysed, and viral particles were extracted and purified from the 40% layer after iodixanol gradient ultracentrifugation. Quantitative rtPCR was used to estimate the viral genomic titers (1012 to 1014 viral genome copies/ml).
Stereotaxic surgery.
Mice (P24-P54) were anesthetized using 5% isoflurane and mounted on a stereotaxic frame. Stable anesthesia was maintained during surgery with 1.5–2% isoflurane. 1 μl of AAV viral solution was injected unilaterally into the right substantia nigra pars compacta (SNc – 0.6 mm anterior, 1.3 mm lateral of Lambda and 4.2 mm below pia) using a microinjector (PHD ULTRA syringe pump, Harvard Apparatus) at 100 nl/min. Mice were treated with post-surgical analgesia and were allowed to recover for at least 21 days prior to electrophysiology. Stereotaxic procedures were performed according to protocols approved by the Harvard University Animal Care and Use Committee.
Electrophysiology in brain slices.
Recordings in acute brain slices were performed in the dorsolateral striatum as described before (Banerjee et al., 2020; Liu et al., 2018). Male and female mice at 42-191 days of age were anesthetized with isoflurane and decapitated. 250 μm thick sagittal brain sections containing dorsal striatum were cut on a vibratome (Leica, VT1200s) using ice-cold sucrose-based cutting solution with (in mM): 75 sucrose, 75 NaCl, 26.2 NaHCO3, 1 NaH2PO4, 1 sodium ascorbate, 2.5 KCl, 7.5 MgSO4, 12 glucose, 1 myoinositol, 3 sodium pyruvate, pH 7.4, 300–310 mOsm. Slices were incubated in incubation solution bubbled with 95% O2 and 5% CO2 containing (in mM): 126 NaCl, 26.2 NaHCO3, 1 NaH2PO4, 2.5 KCl, 1 sodium ascorbate, 3 sodium pyruvate, 1.3 MgSO4, 2 CaCl2, 12 glucose, 1 myo-inositol (pH 7.4, 305–310 mOsm) at room temperature for 1 h. All recordings were done at 34–36°C, and slices were continuously perfused with artificial cerebrospinal fluid (ACSF) at 3–4 ml/min bubbled with 95% O2 and 5% CO2. ACSF contained (in mM): 126 NaCl, 26.2 NaHCO3, 2.5 KCl, 2 CaCl2 (unless noted otherwise), 1.3 MgSO4, 1 NaH2PO4, 12 glucose, pH 7.4, 300–310 mOsm. Recordings were completed within 5 h of slicing. The experimenter was blind to genotype throughout recording and data analyses. All data acquisition and analyses for electrophysiology were done using pClamp10 (Clampex, Axon Instruments). For carbon fiber amperometry, carbon fiber microelectrodes (CFEs, 7 μm diameter, 200–350 μm long) were custom-made by inserting carbon fiber filaments (Goodfellow) into glass capillaries. On the day of recording, each new CFE was calibrated before use by puffing freshly made dopamine solutions of increasing concentrations (0, 1, 5, 10, 20 μM) in ACSF for 10 s. The currents for each concentration of dopamine were plotted against the dopamine concentration and only CFEs with a linear relationship were used. For all genotype comparisons, each control and cKODA littermate pair was recorded in an interleafed manner on the same day using the same carbon fiber. For RIM cKODA rescue experiments, an uninjected, unrelated control mouse was first recorded to establish stable carbon fiber recordings followed by inter-leafed recordings from two injected littermate RIM cKODA mice. CFEs were slowly inserted 20–60 μm below the slice at dorsolateral striatum and were held at 600 mV to record dopamine release. Signals were sampled at 10 kHz and low-pass filtered at 400 Hz. Dopamine release was evoked by electrical or optogenetic stimulation every 2 min. Dopamine release phenotypes in Munc13 cKODA, Liprin-α cKODA and RIM-BP cKODA mice were performed with electrical stimulation, optogenetic stimulation after expression of oChIEF, or KCl stimulation. All rescue experiments were performed with electrical or KCl stimulation only because co-expression of optogenetic actuators and rescue cDNAs was not possible due to packaging limits of the AAV system.
Electrical stimulation was applied through an ACSF-filled glass pipette (tip diameter 3–5 μm) connected to a linear stimulus isolator (A395, World Precision Instruments) and was used to deliver a monopolar electrical stimulus (10–90 μA) to striatal slices. The stimulation pipette was kept at 20–30 μm below the slice surface in dorsolateral striatum and 100–120 μm away from the tip of CFE. A biphasic wave (0.25 μs in each phase) was applied to evoke dopamine release. Electrical stimulation was delivered either as a single stimulus or 10 Hz trains of 90 μA or single stimuli of increasing intensities (10-90 μA). To assess the magnitude of cholinergically triggered dopamine release, the response to a single electrical pulse at 90 μA before and after application of 1 μM DHβE (Tocris, Catalogue No.# 2349) to block β2-containing nAChRs was measured.
Optogenetic stimulation was used to evoke dopamine release in areas in the dorsolateral striatum with uniform citrine fluorescence. Optogenetic stimulation was applied as ten pulses of 470 nm light (each of 1 ms duration) as a 10 Hz train at the recording site through a 60 x objective by a light-emitting diode (Cool LED pE4000). PPRs (peak amplitude evoked by 2nd stimulus/peak amplitude evoked by 1st stimulus) were calculated from an average of 4 sweeps and only for dopamine responses > 25 pA. Optogenetic stimulation was applied every 2 min for all dopamine release measurements or every 10 seconds for extracellular field recordings. The 1st peak of the 1st response evoked by a 10 Hz train of optogenetic stimulation was used to calculate 20-80% rise times, and only amplitudes > 25 pA were used for rise time measurements. For extracellular field recordings, optogenetic stimulation was either applied as 10 pulses of 470 nm light at 10 Hz or as 40 pulses at 40 Hz. 1 μM TTX (Tocris, Catalogue No.# 1078) was used to inhibit sodium channels and action potential firing.
KCl stimulation was done using a solution containing (in mM) 100 KCl, 1.3 MgSO4, 50 NaCl, 2 CaCl2 (unless mentioned otherwise), 12 glucose, 10 HEPES (pH 7.3, 300–310 mOsm). KCl was puffed onto the dorsolateral striatum for 10 seconds at 9 μl/s using a syringe pump (World Precision Instruments) and recordings were done in ACSF (unless mentioned otherwise). The peak amplitude of the dopamine response was quantified, and the area under the curve was measured from the start of the KCl puff for 50 s. Only one KCl puff was applied per slice except for Figs. S1G, S1H. For assessing the Ca2+-dependence of KCl-evoked dopamine release (Figs. S1G, S1H), the 0 mM Ca2+ KCl puff solution contained (in mM): 100 KCl, 3.3 MgSO4, 50 NaCl, 1 mM EGTA, 12 glucose, 10 HEPES (pH 7.3, 300–310 mOsm), and was puffed onto the recording site. Slices were perfused with 0 mM Ca2+ ACSF containing (in mM): 126 NaCl, 3.3 MgSO4, 26.2 NaHCO3, 2.5 KCl, 1 EGTA, 1 NaH2PO4, 12 glucose, (pH 7.4, 300–310 mOsm) during recording. Slices were either incubated in 2 mM Ca2+ (regular) ACSF or 0 mM Ca2+ ACSF for at least 1 h prior to the start of the recordings. Slices incubated in 2 mM Ca2+ containing ACSF received two 2 KCl puffs separated by an interval of 15 min, and both KCl puff solutions contained 2 mM Ca2+ and no EGTA. Slices incubated in 0 mM Ca2+ ACSF, the first KCl puff was done with 0 mM Ca2+ KCl puff and recording was done in 0 mM Ca2+ ACSF. Slices were then perfused for 15 min with 2 mM Ca2+ ACSF and a second KCl puff with 2 mM Ca2+ followed. To assess whether cholinergic triggering contributes to KCl-induced release, the response to a single puff of 100 mM KCl in slices incubated in ACSF, slices incubated with 1 μM DHβE, or slices incubated with 1 μM DHβE + 1 μM TTX (Tocris, Catalogue No.# 1078) for at least 15 min was measured.
Extracellular field potential recordings were used to record dopamine axon action potential firing as described before (Banerjee et al., 2020; Liu et al., 2018) and were performed with ACSF filled glass pipettes (2–3 μm tip diameter) placed 20–60 μm below the slice surface in areas of dorsolateral striatum with uniform citrine fluorescence. Optogenetic stimulation was applied as a 10 Hz train or a 40 Hz train every 10 s and 100 sweeps were averaged for quantification. Sodium channels were blocked using 1 μM TTX (Tocris, Catalogue No.# 1078) and extracellular potentials evoked by 10 Hz trains were recorded before and after TTX. To quantify the reduction by TTX, the amplitude evoked by the first stimulus of the 10 Hz train before and after TTX was analyzed.
Immunostaining of brain sections.
Male and female mice (104–205 days old) were deeply anesthetized with 5% isoflurane. Transcardial perfusion was performed with ice-cold 30–50 ml phosphate buffer saline (PBS) and brains were fixed by perfusion with 50 ml of 4% paraformaldehyde in PBS (4% PFA) at 4°C. Brains were dissected out and incubated in 4% PFA for 12–16 h followed by dehydration in 30% sucrose + 0.1% sodium azide in PBS overnight or until they sank to the bottom of the tube. 20 μm thick coronal striatal sections were cut using a vibratome (Leica, VT1000s) in ice-cold PBS. Next, antigen retrieval was performed by incubating slices overnight at 60°C in 150 mM NaCl, 0.05% Tween 20, 1 mM EDTA, 10 mM Tris Base, pH 9.0. Slices were washed in PBS for 10 min and incubated in PBS containing 10% goat serum and 0.25% Triton X-100 (PBST) for 1 h at room temperature. For ELKS2 staining only, coronal striatal sections were incubated in Image-iT™ FX Signal Enhancer (Thermo Fisher Scientific, Catalogue No. I36933) for 30 min at room temperature, followed by washing twice with PBST (each for 10 min) before blocking. Slices were incubated with primary antibodies for 8-12 h at 4°C, and the following primary antibodies were used in PBST: mouse monoclonal IgG2a anti-Bassoon (1:500, A85, RRID:AB_11181058), guinea pig polyclonal anti-TH (1:1000, A111, RRID:AB_2619897), rabbit polyclonal anti-TH (1:1,000, A66, RRID:AB_390204), rabbit polyclonal anti-ELKS2α (1:50, A136, custom made, bleed 5 of serum E3-1029, Held et al., 2016) and rabbit monoclonal anti-GFP (1:2,000, A195, RRID:AB_2536526). Slices were washed thrice in PBST each for 10 min and incubated in secondary antibodies for 2 h at room temperature in PBST. Secondary antibodies used were goat anti-mouse IgG2a Alexa 488 (1:500, S8, RRID:AB_2535771), goat-anti guinea pig Alexa 568 (1:500, S27, RRID:AB_2534119) and goat anti-rabbit Alexa 488 (1:500, S5, RRID:AB_2576217). Sections were washed thrice in PBST each for 10 min to wash off excess secondary antibodies and mounted on Poly-D-lysine coated #1.5 cover glasses (GG-18–1.5-pdl, neuVitro) with H-1000 mounting medium (Vectashield). At all times during perfusion, staining and mounting, the experimenter was blind to the genotype of the mice.
3D-SIM image acquisition and analysis.
Image acquisition and analyses were done essentially as described before (Banerjee et al., 2020; Liu et al., 2018) using a DeltaVision OMX V4 Blaze structured illumination microscope (GE Healthcare) with a 60X oil immersion objective (PLAN APO, NA 1.42) and Edge 5.5 sCMOS cameras (PCO) for each channel. 488 nm and 568 nm lasers were used for sequential imaging where each laser was controlled with high-speed galvo shutters (200 μs switching time). The filter sets used were: 477 ± 2 nm excitation (bandwidth 32 ± 2 nm)/528 ± 2 nm emission (bandwidth 48 ± 2 nm); 571 ± 2 nm excitation (bandwidth 19 ± 2 nm)/609 ± 2 nm emission (bandwidth 37 ± 2 nm) filters. The DeltaVision OMX software was used for image acquisition. Z stacks were acquired in the dorsolateral striatum with a 125 nm step size and 15 raw images were obtained per plane (five phases, three angles). Immersion oil matching was used to minimize spherical aberration. A control slide with TH axonal staining in red and green fluorophores was used to measure lateral shift between green and red channels. A calibration image was generated from this control slide and all images were reconstructed using this calibration to reduce lateral shifts between fluorophores. All 3D-SIM raw images were aligned and reconstructed to obtain superresolved images. Image volumes (40 x 40 x 6 μm3) were acquired from 7 to 8 regions within the dorsolateral striatum in 4-5 coronal sections for each animal. For detection of Munc13-1 within TH axons, anti-GFP antibodies were used to visualize Munc13-1 in homozygote mice in which Munc13-1 is endogenously tagged with EYFP mice (Kalla et al., 2006), and age-matched wild type mice were used as negative controls. The intensity range for Munc13-1 puncta was determined from reconstructed images, and multiple intensity thresholds within this range were used to generate masks of Munc13-1 puncta, and settings in which Munc13-1 masks best matched original images irrespective of their relationship to TH were chosen for quantification by an investigator blind to the genotype of the mice, and the same thresholds were then used for the full dataset. For image analyses, regions of interest (ROIs) ranging from 20 x 20 x 2.5 μm3 to 36 x 36 x 3.6 μm3 were selected manually in each z-stack of Munc13-1-EYFP and wild type images. To characterize TH and Munc13-1 signals, size thresholds (0.04–20 μm3 for TH axons, 0.003–0.04 μm3 for Munc13-1) were applied. For detection of Bassoon and ELKS2 within TH axons in Munc13 control and Munc13 cKODA mice and detection of Bassoon within TH axons in Liprin-α control and Liprin-α cKODA mice, ROIs were generated using Otsu intensity and size thresholding parameters (0.04–20 μm3 for TH axons, 0.003–0.04 μm3 for Bassoon and ELKS2). The overlap of Munc13-1, Bassoon and ELKS2 with TH axon was quantified using a custom written MATLAB code (Liu et al., 2018), available at https://doi.org/10.5281/zenodo.5576635. The volume occupied by TH for each image was quantified and divided by the total image volume. This was followed by skeletonization of TH signals using 3D Gaussian filtering and a homotypic thinning algorithm to calculate TH axon length. Munc13-1, Bassoon and ELKS2 objects were considered to be within TH when there was > 40% overlap, as established before (Liu et al., 2018). For quantification of Munc13-1 clusters, density and volume occupied by Munc13-1 objects per image volume were calculated. Density and volume of Munc13-1 objects within TH was quantified, and compared to the average of the same parameters after shuffling each object within 1 x 1 x 1 μm3 for 1000 times. For quantitative assessment of TH axon shape, a custom code was generated (available at https://doi.org/10.5281/zenodo.5576622). A machine learning model was trained with annotation of 15 images per genotype for detection of TH positive objects vs. background. All images were next processed in a 3D-smoothing operation followed by thresholding on blurred probability maps. The central axis, the radius and total surface area for each axonal segment was computed. The proportion of surface area at a specific distance from the central axis, in 0.04 μm increments, were compared between Munc13 control and Munc13 cKODA, and Liprin-α control and Liprin-α cKODA mice. Sample images were generated using Imaris 9.0.2 (Oxford Instruments) from masked images obtained from the custom analysis code. Adjustments of contrast, intensity and surface rendering were done identically for each condition for illustration, but after quantification. For all 3D-SIM data acquisition and analyses, the experimenter was blind to the genotype of the mice.
Generation of conditional Munc13-1 knockout mice.
Mice with a floxed exon 21 of the Munc13-1 gene were generated by homologous recombination in 129/Ola embryonic stem (ES) cells according to standard protocols. The targeting vector was generated by recombineering and subcloning from a bacterial artificial chromosome (BAC; BMQ-441L13) of a 129SV ES cell DNA BAC library, and a Herpes Simplex Virus Thymidine kinase (HSV-TK) and neomycin resistance cassette were used as positive and negative selection markers, respectively. ES cell clones were analyzed by Southern blotting of HindIII-digested genomic DNA, and positive ES cell clones were injected into blastocysts to obtain chimeric mice. Flp deleter-mice (Farley et al., 2000) were used to generate the Munc13-1 floxed mice. Genotyping was performed by PCR using the following reactions: Munc13-1 wild type allele with 27123 + 27122 yielding a 149 bp band; Munc13-1 knock-in allele (ki) after homologous recombination with 27121 + 27122 yielding a 196 bp band; Munc13-1 floxed allele after flp-mediated excision of the neomycin resistance cassette with 27123 + 27122 yielding a 253 bp band; Munc13-1 cKO allele after cre-mediated recombination with 27124 + 27122 yielding a 209 bp band. For whole brain Western blotting and electrophysiological assessment of synaptic transmission in autaptic neurons, Munc13-1 floxed mice were crossed to Ella-cre mice for germline recombination (Lakso et al., 1996) to produce constitutive Munc13-1 cKOgl mice. For rtPCR, total RNA was isolated from wild type and Munc13-1 cKOgl P0 mouse brains using the Direct-zol RNA Miniprep Kit and reverse transcribed into double-stranded-cDNA by the SuperScript™ Double-Stranded cDNA Synthesis Kit. PCR reactions were performed using the proofreading VELOCITY DNA polymerase and the primer pairs 24609/34504 (exon 20-23: wt: 450 bp; Δe21: 286 bp; Δe21+22: 135 bp) and 24609/34505 (exon 20-25: wt: 679 bp; Δe21: 515 bp; Δe21+22: 364 bp). The sequences of the PCR products obtained from the different splice variants were verified by directly sequencing the purified PCR products and after cloning them into a TOPO TA cloning vector.
Immunoblotting.
To estimate Munc13-1 levels after gene targeting of Munc13-1, Western blots were performed from whole brain homogenates of P0 Munc13-1 wild type Munc13-1f/f littermates, and 5 μg from each sample were loaded onto a 3-8% Tris-acetate gradient gel. To compare Munc13 expression in whole brain homogenates of different Munc13 mouse mutants, 20 μg protein per sample was separated on a 7.5 % gel. Residual Munc13-1 expression was estimated in whole brain homogenates from Munc13-1 cKOgl animals and Munc13-1 wild type littermates. 20 μg from Munc13-1 cKOgl and varying concentrations (0.7 μg, 1.3 μg, 2 μg) from Munc13-1 wild type homogenates were loaded into separate lanes of a 3-8% Tris-acetate gel. After the transfer, protein bound to nitrocellulose membranes was visualized with MemCode. Membranes were destained and then washed with TBS buffer (10 mM Tris-HCl, 150 mM NaCl, pH 7.5), incubated with blocking buffer (TBS, 5% (w/v) milk powder, 5% (v/v) goat serum, 0.1% (v/v) Tween-20) for 30 min, incubated with primary antibodies for 1 h at room temperature, washed in TBST buffer (Tris-Buffered Saline with 0.1% v/v Tween 20), and incubated with secondary antibodies conjugated to horseradish peroxidase (goat anti-Mouse IgG (H+L), Jackson ImmunoResearch, Cat#115-035-146, RRID:AB_2307392; goat anti-Rabbit IgG (H+L), Jackson ImmunoResearch, Cat#111-035-144, RRID: AB_2307391). After several washing steps in TBST and TBS, immunoreactive bands were visualized with an enhanced chemiluminescence (ECL) detection system on film. The following primary antibodies were used: rabbit polyclonal anti-Munc13-1 (1:1000, N-terminal #40, Cooper et al., 2012; Varoqueaux et al., 2005); rabbit polyclonal anti-Munc13-1 (1:250, C-terminal #N395, Betz et al., 1997); rabbit polyclonal anti-Munc13-1 (1:1,000, SySy #126103, N-terminal RRID:AB_887733), mouse monoclonal anti-ß-Tubulin (1:5,000, Sigma-Aldrich #T4026, RRID:AB_477577). For estimation of protein amounts, films and stained nitrocellulose membranes were scanned and analyzed using ImageJ (Schindelin et al., 2012). Protein levels were normalized to the total protein amount in the sample as measured by the MemCode stain using the tracing tool. Protein bands from films were manually outlined and the signal intensity was measured. The signal intensity of the band was normalized to the total protein in the respective lane. For experiments estimating residual Munc13-1 expression, the normalized averages of the 0.7 μg/lane and 1.3 μg/lane Munc13-1 wild type samples were compared to 20 μg/lane Munc13-1 cKOgl samples.
For assessment of expression of RIM1 rescue constructs, a separate cohort of 18 RIM cKODA mice (postnatal days 33-54) were bilaterally injected with AAV5 expressing RIM1-Zn, RIM1-ΔZn, RIM1-Zn + RIM1-ΔZn, RIM1-ZnC2B, RIM1-ZnC2BKE or RIM1-ZnPCP in the SNc midbrain. 3 RIM cKODA mice were bilaterally injected for each RIM1 rescue condition and 3 uninjected littermate RIM cKODA were used as controls. 35-66 days after surgery, mice were deeply anesthetized with isoflurane, decapitated, and both striata of each mouse were dissected in ice cold phosphate-buffered saline (PBS). After dissection, the striata were flash-frozen in dry ice and ethanol and stored in −80°C. For each condition, the 6 dissected striata were pooled and homogenized with a glass-Teflon homogenizer in 1 ml of homogenizing buffer (50 mM HEPES, 150 mM NaCl, 1 mM EDTA + mammalian protease inhibitor cocktail (Sigma CAT# P8340) with 30 slow strokes on ice. The homogenized tissue was incubated in lysis buffer (0.2% SDS, 1% Triton X-100, 1% deoxycholate) at 4°C for 1 h and then sonicated twice at 4°C (each for 10 s). Next, sonicated samples were centrifuged at 15,000 x g for 15 min at 4°C and afterwards the clear supernatant was collected into open-top polycarbonate tubes (Beckman Catalogue# 343778). Each supernatant was further ultracentrifuged at 55,000 rpm for 1 h (Beckman rotor), followed by addition of SDS to a final concentration of 1% and a final volume of 1.5 ml. The lysate was then boiled at 95°C for 5 min, allowed to cool to room temperature and later run on 10% SDS-PAGE gels using standard protocols. Equal volumes of each sample were loaded (65 μl) for HA staining. For synaptophysin, a separate gel was run with 6.5 times less material (10 μl). Proteins were transferred to nitrocellulose membranes at 80 V for 6.5 h and checked for transfer efficiency using Ponceau. Membranes were blocked for 1 h at room temperature in filtered blocking solution containing 10% non-fat milk/5% goat serum in TBST. Primary antibodies were dissolved in TBST containing 5% nonfat milk/2.5% goat serum. Membranes were incubated with primary antibody overnight at 4°C. The following primary antibodies were used: mouse monoclonal anti-HA (1:500, AB_1069131, A250) to visualize HA-tag within RIM1 rescue constructs and mouse anti-synaptophysin 1 (1:5,000, A100, RRID: AB_887824) as a loading control. Next, membranes were washed with TBST (5 washes, each wash for 5 min) and then incubated for 2 h at room temperature with anti-mouse HRP-conjugated secondary antibodies (1:10,000 in TBST containing 5% nonfat milk/2.5% goat serum). After secondary antibody incubation, membranes were washed with TBST (5 washes, each wash for 5 min), then proteins bands were visualized using a standard chemiluminescent reagent and exposure to film. Scans of films were adjusted for brightness and contrast with the same settings applied to the entire scan.
Generation of autaptic mouse hippocampal neuron cultures.
Astroglial feeder monolayer cell cultures were generated from wild type (C57/N) postnatal day (P0) mouse cortices according to a previously published protocol (Burgalossi et al., 2012). Primary neuron cultures were prepared from neonatal mouse brains that were dissected at P0 in ice-cold Hank’s Balanced Salt Solution (HBSS). Both hippocampi were removed and transferred into 500 μl of prewarmed Papain solution (DMEM supplemented with 20 units/ml papain; 0.2 mg/ml cysteine; 1 mM CaCl2; 0.5 mM EDTA) and incubated for 60 min at 37°C. The digestion of the hippocampi was terminated by incubating the tissue for 15 min in inactivation solution (DMEM supplemented with 2.5 mg/ml BSA; 2.5 mg/ml trypsin inhibitor; and 10% (v/v) FBS). After two medium washes, neurons were dissociated and seeded onto microdot astrocyte feeder islands on glass coverslips (4,000 cells/6 well for electrophysiology, S2E-M). Neurons were maintained in culture medium (Neurobasal-A medium supplemented with 1x B27, 2 mM Glutamax, and 100 units/ml penicillin/streptomycin) at 37°C and 5% CO2.
Electrophysiology on neurons in autaptic hippocampal cultures.
Autaptic hippocampal neurons from Munc13-1 wild type and Munc13-1 cKOgl littermate mice were whole-cell voltage clamped at days in vitro (DIV) 13-16. Neurons were recorded at room temperature in an external bath solution containing (in mM): 140 mM NaCl, 2.4 mM KCl, 10 mM HEPES, 10 mM glucose, 4 mM CaCl2, and 4 mM MgCl2 (320 mOsm/l) pH 7.4. Patch pipettes (2.5-3.8 MΩ) were filled with internal solution containing (in mM): 136 mM KCl, 17.8 mM HEPES, 1 mM EGTA, 4.6 mM MgCl2, 4 mM NaATP, 0.3 mM Na2GTP, 15 mM creatine phosphate, and 5 U/ml phosphocreatine kinase, pH 7.4, 315–320 mOsm. Excitatory postsynaptic currents (EPSCs) were evoked in patched neurons by a 2 ms depolarization to 0 mV. The peak amplitudes for all responses recorded in 10 Hz train across both genotypes was normalized to the mean initial EPSC amplitude of Munc13-1 control. Miniature EPSCs (mEPSCs) were recorded in presence of 300 nM TTX to inhibit action potential firing. 500 mM sucrose was puffed for 7 seconds to estimate the readily-releasable pool of synaptic vesicles.
Microdialysis.
Microdialysis was performed as described before (Banerjee et al., 2020; Liu et al., 2018). The microdialysis probes (6 kDa MW cut-off, CMA 11, Harvard Apparatus, Catalogue# CMA8309581) were calibrated with freshly made dopamine solutions (0, 100 and 200 nM) dissolved in ACSF before each experiment. After probe calibration, male and female Munc13 control and cKODA mice (55–96 days old) were anesthetized using 1.5% isoflurane and the probe was inserted into dorsal striatum (coordinates: 1.0 mm anterior, 2.0 mm lateral of bregma, and 3.3 mm below pia) using stereotaxy. A fresh probe was used for each Munc13 control and cKODA mouse. The microdialysis probe was continuously perfused with ACSF containing (in mM): 155 NaCl, 1.2 CaCl2 1.2 MgCl2, 2.5 KCl and 5 glucose at a speed of 1 μl/min. Dialysates from dorsal striatum were collected every 15 min and the extracellular dopamine concentration was measured using HPLC (HTEC-510, Amuza Inc) connected to an electrochemical detector (Eicom). Data during the first 75 min were not plotted because during this time window dopamine levels stabilize after surgery. Average dopamine levels from the 76th - 120th min of Munc13 control mice were used to normalize all dopamine values for both genotypes. 10 μM TTX dissolved in ACSF was applied using reverse dialysis starting at 121 min to inhibit firing of dopamine axons as described before (Banerjee et al., 2020; Liu et al., 2018). For all microdialysis data acquisition and analyses, the experimenter was blind to the genotype of the mice, and experiments were performed according to approved protocols of the Harvard University Animal Care and Use Committee.
Striatal synaptosome preparation and immunostaining.
Striatal synaptosome preparations were performed as previously described (Banerjee et al., 2020; Liu et al., 2018). Munc13 control and cKODA mice (P42-73) were deeply anesthetized using isoflurane, decapitated, and the brains were harvested into ice-cold PBS. Dorsal striata were dissected out and placed into a pre-cooled, detergent-free glass-Teflon homogenizer filled with 1 ml of ice-cold homogenizing buffer containing (in mM): 4 4-(2-hydroxyethyl)-1-piperazineethanesulfonic acid (HEPES), 320 sucrose, pH 7.4, and 1x of a mammalian protease inhibitor cocktail. The tissue was homogenized with 12 strokes with a detergent-free ice-cold glass-teflon homogenizer. Next, 1 ml of homogenizing buffer was added to the striatal homogenate and it was centrifuged at 1,000 x g for 10 min at 4°C. The supernatant (S1) was collected and centrifuged at 12,500 x g for 15 min at 4°C. The supernatant (S2) was removed and the pellet (P2) was re-homogenized in 1 ml homogenizing buffer with 6 strokes. A sucrose density gradient was prepared with 5 ml of 0.8 M and 1.2 M sucrose in thin wall ultracentrifugation tubes (Beckman Coulter, Cat # 344059). The P2 homogenate was mixed with 1 ml of homogenizing buffer, and 1.5 ml of this was added to the top of the sucrose gradient and was centrifuged at 69,150 x g for 70 min at 4°C (SW 41 Ti Swinging-Bucket Rotor, Beckman Coulter, Cat. # 331362). 1–1.5 ml of the synaptosome layer was collected from the interface of the two sucrose layers. Synaptosomes were diluted 20–30 times in homogenizing buffer and spun (4,000 x g, 10 min) onto Poly-D-lysine coated #1.5 coverslips at 4°C. Excess homogenizing buffer was pipetted out and synaptosomes were fixed using 4% PFA in PBS for 20 min at 4°C. Coverslips were incubated in 3% bovine serum albumin + 0.1% Triton X-100 in PBS at room temperature for 45 min to block non-specific binding and allow for permeabilization. Primary antibody staining was done for 12 h at 4°C, followed by three washes for 15 min each. The primary antibodies used were: mouse monoclonal IgG2a anti-Bassoon (1:1,000, A85, RRID:AB_11181058), mouse monoclonal IgG1 anti-synaptophysin-1 (1:500, A100, RRID:AB_887824), rabbit polyclonal anti-RIM1 (1:500, A58, RRID:AB_887774) and guinea pig polyclonal anti-TH (1:1,000, A111, RRID:AB_2619897). Secondary antibody staining was done for 2 h at room temperature in blocking solution followed by three washes each for 15 min. The secondary antibodies were: goat anti-mouse IgG2a Alexa 488 (1:500, S8, RRID:AB_2535771), goat anti-rabbit Alexa 555 (1:500, S22, RRID:AB_2535849), and goat anti-guinea pig Alexa 633 (1:500, S34, RRID:AB_2535757).
Confocal microscopy and image analysis of striatal synaptosomes.
Single optical sections of striatal synaptosomes plated on coverslips (105 x 105 μm2) stained for Bassoon (detected via Alexa 488), RIM1 (detected via Alexa 488 secondaries), synaptophysin-1 (detected via Alexa-555 secondaries) and TH (detected via Alexa 633 secondaries) were imaged with an oil immersion 60X objective and 1.5X optical zoom using an Olympus FV1000 confocal microscope equipped with 488 nm, 559 nm and 635 nm lasers. The filter sets used for confocal imaging were: 488 nm excitation/500-525 nm emission, 561 nm excitation/560-620 nm emission and 635 nm long pass excitation/650 nm emission. Signals were acquired using PMT detectors and Olympus FV-ASW software. For quantification, raw confocal images were analyzed in a custom MATLAB program (Liu et al., 2018) available at https://github.com/hmslcl/3D_SIM_analysis_HMS_Kaeser-lab_CL. A total of 300-700 synaptosomes were detected per image using Otsu intensity thresholds and size thresholds (0.2 - 1 μm2 for TH and 0.15 - 2 μm2 for synaptic markers). These threshold settings were identical for each image across Munc13 control and cKODA for detection of synaptophysin-positive (Syp+) and TH-positive (TH+) ROIs in each image, which was used to generate single and double positive ROIs (Syp+TH+). For synaptophysin-positive TH-negative ROIs (Syp+TH−), synaptophysin+ ROIs which had a TH signal less than the average intensity of all pixels in the image were designated as TH-negative (TH−) and were marked as (Syp+TH−) ROIs. Bassoon intensities within Syp+TH−, Syp+TH+ ROIs or within all TH+ ROIs, and RIM1 intensities within all TH+ ROIs were quantified and frequency distribution histograms were plotted, and synaptophysin intensity within all TH+ ROIs was quantified. Sample images were generated in Fiji with identical adjustments of brightness and contrast for Munc13 control and cKODA, but image quantification was performed before these adjustments. Image acquisition and quantification were performed by an experimenter blind to the genotype.
Quantification and Statistical Analysis
Data are shown as mean ± SEM (except for mean ± SD in Figs. 5J and 7E) and all statistics were performed in Graphpad Prism 9. Sample sizes, numerical values of means, medians (where appropriate) and errors, statistical tests, F-ratios of ANOVAs, and exact p-values are provided for each experiment in Tables S1-S8, and key information is also included in the figure legends. The number of recorded slices was used as sample size for all slice amperometry data. For electrophysiology in autaptic hippocampal cultures, sample size was number of recorded cells. For all image data, sample size was the number of images except for frequency histograms in Figs. 5E, S5C and S5F, where sample size was the number of analyzed ROIs. Image data are presented as violin plots with superimposed mean ± SEM throughout, except for data sets with ≤ 40 images. Wild type controls in Figs. 2C, 2D and 2G (in which all values are close to 0) are shown as scatter plots because violin plots would be non-informative. For microdialysis data, sample size was the number of mice. Data sets with sample size ≥ 30 were analyzed using parametric statistical tests. For data sets with sample size < 30, normality was determined with Anderson-Darling, D’Agostino-Pearson, Shapiro-Wilk, or one sample Kolmogorov-Smirnov tests and statistics were performed using non-parametric tests for data sets that did not follow a normal distribution. In all figures, statistical significance is presented as * p < 0.05, ** p < 0.01, *** p < 0.001.
Supplementary Material
Highlights.
Evoked striatal dopamine release necessitates the active zone proteins Munc13 and RIM
Ablating Munc13 from dopamine neurons leads to defects in their axon structure
Dopamine release depends on Liprin-α2 and Liprin-α3, but not on RIM-BP1 and RIM-BP2
RIM domains that bind to Munc13 and Liprin-α restore some release after RIM ablation
Acknowledgements
This work was supported by the National Institutes of Health (R01NS103484 and R01MH113349, PSK; F31NS105159, LK), the Dean’s Initiative Award for Innovation (PSK), a Harvard-MIT Joint Research Grant (P.S.K.), a William Randolph Hearst fellowship (AB), an Alice Joseph Brooks fellowship (AB), a Mahoney fellowship (AB), a Gordon family fellowship (CL), the European Commission (ERC Advanced Grant SynPrime, NB), and Germany’s Excellence Strategy (EXC 2067/1-390729940, NB). XC is a visiting graduate student and was in part supported by a PhD Mobility National Grants fellowship from the China Scholarship Council/Xi’an Jiaotong University. We thank C. Qiao, M. Han, A. Zeuch, A. Günther, and S. Beuermann for technical assistance and T.C. Südhof for the floxed RIM-BP mice. We acknowledge the HMS Neurobiology Imaging Facility (supported by P30NS072030) and the HMS Cell Biology Microscopy Facility for availability of microscopes and advice, T. Lambert for help with 3D-SIM, M. Cicconet and the HMS Image and Data Analysis Core for help with developing TH axon analyses, the MPI-EM DNA Core Facility for mouse genotyping, the MPI-EM and HMS animal facilities for mouse husbandry, and U. Fünfschilling and M. Schindler for blastocyst injections.
Footnotes
Declaration of interests
The authors have no competing interests to declare. LK is currently an employee of Prescient Healthcare Group, Jersey City, USA. RU is currently an employee of Medaffcon Oy, Espoo, Finland. XC is a visiting graduate student from Xi’an Jiaotong University, China. NB is a member of the Neuron Advisory Board.
Publisher's Disclaimer: This is a PDF file of an unedited manuscript that has been accepted for publication. As a service to our customers we are providing this early version of the manuscript. The manuscript will undergo copyediting, typesetting, and review of the resulting proof before it is published in its final form. Please note that during the production process errors may be discovered which could affect the content, and all legal disclaimers that apply to the journal pertain.
References
- Acuna C, Liu X, Gonzalez A, and Südhof TC (2015). RIM-BPs Mediate Tight Coupling of Action Potentials to Ca(2+)-Triggered Neurotransmitter Release. Neuron 87, 1234–1247. [DOI] [PubMed] [Google Scholar]
- Acuna C, Liu X, and Südhof TC (2016). How to Make an Active Zone: Unexpected Universal Functional Redundancy between RIMs and RIM-BPs. Neuron 91, 792–807. [DOI] [PubMed] [Google Scholar]
- Adams DJ, Quail MA, Cox T, van der Weyden L, Gorick BD, Su Q, Chan W, Davies R, Bonfield JK, Law F, et al. (2005). A genome-wide, end-sequenced 129Sv BAC library resource for targeting vector construction. Genomics 86, 753–758. [DOI] [PubMed] [Google Scholar]
- Agnati LF, Zoli M, Strömberg I, and Fuxe K (1995). Intercellular communication in the brain: Wiring versus volume transmission. Neuroscience 69, 711–726. [DOI] [PubMed] [Google Scholar]
- Andrews-Zwilling YS, Kawabe H, Reim K, Varoqueaux F, and Brose N (2006). Binding to Rab3A-interacting molecule RIM regulates the presynaptic recruitment of Munc13-1 and ubMunc13-2. J. Biol. Chem 281, 19720–19731. [DOI] [PubMed] [Google Scholar]
- Augustin I, Rosenmund C, Sudhof TC, and Brose N (1999). Munc13-1 is essential for fusion competence of glutamatergic synaptic vesicles. Nature 400, 457–461. [DOI] [PubMed] [Google Scholar]
- Augustin I, Korte S, Rickmann M, Kretzschmar HA, Sudhof TC, Herms JW, and Brose N (2001). The cerebellum-specific Munc13 isoform Munc13-3 regulates cerebellar synaptic transmission and motor learning in mice. J. Neurosci 21, 10–17. [DOI] [PMC free article] [PubMed] [Google Scholar]
- Backman CM, Malik N, Zhang Y, Shan L, Grinberg A, Hoffer BJ, Westphal H, and Tomac AC (2006). Characterization of a mouse strain expressing Cre recombinase from the 3’ untranslated region of the dopamine transporter locus. Genesis 44, 383–390. [DOI] [PubMed] [Google Scholar]
- Banerjee A, Lee J, Nemcova P, Liu C, and Kaeser PS (2020). Synaptotagmin-1 is the Ca2+ sensor for fast striatal dopamine release. Elife 9. [DOI] [PMC free article] [PubMed] [Google Scholar]
- Beckstead MJ, Grandy DK, Wickman K, and Williams JT (2004). Vesicular Dopamine Release Elicits an Inhibitory Postsynaptic Current in Midbrain Dopamine Neurons. Neuron 42, 939–946. [DOI] [PubMed] [Google Scholar]
- Berwin B, Floor E, and Martin TF. (1998). CAPS (Mammalian UNC-31) Protein Localizes to Membranes Involved in Dense-Core Vesicle Exocytosis. Neuron 21, 137–145. [DOI] [PubMed] [Google Scholar]
- Betz A, Okamoto M, Benseler F, and Brose N (1997). Direct interaction of the rat unc-13 homologue Munc13-1 with the N terminus of syntaxin. J. Biol. Chem 272, 2520–2526. [DOI] [PubMed] [Google Scholar]
- Betz A, Ashery U, Rickmann M, Augustin I, Neher E, Sudhof TC, Rettig J, and Brose N (1998). Munc13-1 is a presynaptic phorbol ester receptor that enhances neurotransmitter release. Neuron 21, 123–136. [DOI] [PubMed] [Google Scholar]
- Betz A, Thakur P, Junge HJ, Ashery U, Rhee JS, Scheuss V, Rosenmund C, Rettig J, and Brose N (2001). Functional interaction of the active zone proteins Munc13-1 and RIM1 in synaptic vesicle priming. Neuron 30, 183–196. [DOI] [PubMed] [Google Scholar]
- Biederer T, Kaeser PS, and Blanpied TA (2017). Transcellular Nanoalignment of Synaptic Function. Neuron 96, 680–696. [DOI] [PMC free article] [PubMed] [Google Scholar]
- van den Bogaart G, Meyenberg K, Risselada HJ, Amin H, Willig KI, Hubrich BE, Dier M, Hell SW, Grubmüller H, Diederichsen U, et al. (2011). Membrane protein sequestering by ionic protein–lipid interactions. Nature 479, 552–555. [DOI] [PMC free article] [PubMed] [Google Scholar]
- Böhme MA, Beis C, Reddy-Alla S, Reynolds E, Mampell MM, Grasskamp AT, Lützkendorf J, Bergeron DD, Driller JH, Babikir H, et al. (2016). Active zone scaffolds differentially accumulate Unc13 isoforms to tune Ca2+ channel–vesicle coupling. Nat. Neurosci 19, 1311–1320. [DOI] [PubMed] [Google Scholar]
- van de Bospoort R, Farina M, Schmitz SK, de Jong A, de Wit H, Verhage M, and Toonen RF (2012). Munc13 controls the location and efficiency of dense-core vesicle release in neurons. J. Cell Biol 199, 883–891. [DOI] [PMC free article] [PubMed] [Google Scholar]
- Brimblecombe KR, Gracie CJ, Platt NJ, and Cragg SJ (2015). Gating of dopamine transmission by calcium and axonal N-, Q-, T- and L-type voltage-gated calcium channels differs between striatal domains. J. Physiol 593, 929–946. [DOI] [PMC free article] [PubMed] [Google Scholar]
- Brockmann MM, Maglione M, Willmes CG, Stumpf A, Bouazza BA, Velasquez LM, Grauel MK, Beed P, Lehmann M, Gimber N, et al. (2019). RIM-BP2 primes synaptic vesicles via recruitment of Munc13-1 at hippocampal mossy fiber synapses. Elife 8. [DOI] [PMC free article] [PubMed] [Google Scholar]
- Broeke JHP, Roelandse M, Luteijn MJ, Boiko T, Matus A, Toonen RF, and Verhage M (2010). Munc18 and Munc13 regulate early neurite outgrowth. Biol. Cell 102, 479–488. [DOI] [PMC free article] [PubMed] [Google Scholar]
- Burgalossi A, Jung S, Man KM, Nair R, Jockusch WJ, Wojcik SM, Brose N, and Rhee J-S (2012). Analysis of neurotransmitter release mechanisms by photolysis of caged Ca2+ in an autaptic neuron culture system. Nat. Protoc 7, 1351–1365. [DOI] [PubMed] [Google Scholar]
- Cachope R, Mateo Y, Mathur BN, Irving J, Wang H-L, Morales M, Lovinger DM, and Cheer JF (2012). Selective Activation of Cholinergic Interneurons Enhances Accumbal Phasic Dopamine Release: Setting the Tone for Reward Processing. Cell Rep 2, 33–41. [DOI] [PMC free article] [PubMed] [Google Scholar]
- Camacho M, Basu J, Trimbuch T, Chang S, Pulido-Lozano C, Chang S-S, Duluvova I, Abo-Rady M, Rizo J, and Rosenmund C (2017). Heterodimerization of Munc13 C2A domain with RIM regulates synaptic vesicle docking and priming. Nat. Commun 8, 15293. [DOI] [PMC free article] [PubMed] [Google Scholar]
- Chang S, Trimbuch T, and Rosenmund C (2018). Synaptotagmin-1 drives synchronous Ca2+-triggered fusion by C2B-domain-mediated synaptic-vesicle-membrane attachment. Nat. Neurosci 21, 33–40. [DOI] [PMC free article] [PubMed] [Google Scholar]
- Chen LY, Jiang M, Zhang B, Gokce O, and Südhof TC (2017). Conditional Deletion of All Neurexins Defines Diversity of Essential Synaptic Organizer Functions for Neurexins. Neuron 94, 611–625.e4. [DOI] [PMC free article] [PubMed] [Google Scholar] [Retracted]
- Cooper B, Hemmerlein M, Ammermuller J, Imig C, Reim K, Lipstein N, Kalla S, Kawabe H, Brose N, Brandstatter JH, et al. (2012). Munc13-Independent Vesicle Priming at Mouse Photoreceptor Ribbon Synapses. J. Neurosci 32, 8040–8052. [DOI] [PMC free article] [PubMed] [Google Scholar]
- Courtney NA, and Ford CP (2014). The Timing of Dopamine- and Noradrenaline-Mediated Transmission Reflects Underlying Differences in the Extent of Spillover and Pooling. J. Neurosci 34, 7645–7656. [DOI] [PMC free article] [PubMed] [Google Scholar]
- Daniel JA, Galbraith S, Iacovitti L, Abdipranoto A, and Vissel B (2009). Functional Heterogeneity at Dopamine Release Sites. J. Neurosci 29, 14670–14680. [DOI] [PMC free article] [PubMed] [Google Scholar]
- Deng L, Kaeser PS, Xu W, and Südhof TC (2011). RIM proteins activate vesicle priming by reversing autoinhibitory homodimerization of Munc13. Neuron 69, 317–331. [DOI] [PMC free article] [PubMed] [Google Scholar]
- Descarries L, Watkins KC, Garcia S, Bosler O, and Doucet G (1996). Dual character, asynaptic and synaptic, of the dopamine innervation in adult rat neostriatum: A quantitative autoradiographic and immunocytochemical analysis. J. Comp. Neurol 375, 167–186. [DOI] [PubMed] [Google Scholar]
- Ducrot C, Bourque M-J, Delmas CVL, Racine A-S, Guadarrama Bello D, Delignat-Lavaud B, Domenic Lycas M, Fallon A, Michaud-Tardif C, Burke Nanni S, et al. (2021). Dopaminergic neurons establish a distinctive axonal arbor with a majority of non-synaptic terminals. FASEB J 35, e21791. [DOI] [PubMed] [Google Scholar]
- Emperador-Melero J, and Kaeser PS (2020). Assembly of the presynaptic active zone. Curr. Opin. Neurobiol 63, 95–103. [DOI] [PMC free article] [PubMed] [Google Scholar]
- Emperador-Melero J, Wong MY, Wang SSH, de Nola G, Nyitrai H, Kirchhausen T, and Kaeser PS (2021a). PKC-phosphorylation of Liprin-α3 triggers phase separation and controls presynaptic active zone structure. Nat. Commun 12, 3057. [DOI] [PMC free article] [PubMed] [Google Scholar]
- Emperador-Melero J, de Nola G, and Kaeser PS (2021b). Intact synapse structure and function after combined knockout of PTPδ, PTPσ and LAR. Elife 2021.01.17.427005. [DOI] [PMC free article] [PubMed] [Google Scholar]
- Farina M, van de Bospoort R, He E, Persoon CM, van Weering JRT, Broeke JH, Verhage M, and Toonen RF (2015). CAPS-1 promotes fusion competence of stationary dense-core vesicles in presynaptic terminals of mammalian neurons. Elife 4, 1–22. [DOI] [PMC free article] [PubMed] [Google Scholar]
- Farley FW, Soriano P, Steffen LS, and Dymecki SM (2000). Widespread recombinase expression using FLPeR (flipper) mice. Genesis 28, 106–110. [PubMed] [Google Scholar]
- Gantz SC, Ford CP, Morikawa H, and Williams JT (2018). The Evolving Understanding of Dopamine Neurons in the Substantia Nigra and Ventral Tegmental Area. Annu. Rev. Physiol 80, 219–241. [DOI] [PubMed] [Google Scholar]
- Giorguieff MF, Le Floc’h ML, Westfall TC, Glowinski J, and Besson MJ (1976). Nicotinic effect of acetylcholine on the release of newly synthesized [3H]dopamine in rat striatal slices and cat caudate nucleus. Brain Res 106, 117–131. [DOI] [PubMed] [Google Scholar]
- Gustafsson MGL, Shao L, Carlton PM, Wang CJR, Golubovskaya IN, Cande WZ, Agard DA, and Sedat JW (2008). Three-dimensional resolution doubling in wide-field fluorescence microscopy by structured illumination. Biophys. J 94, 4957–4970. [DOI] [PMC free article] [PubMed] [Google Scholar]
- Han Y, Kaeser PS, Südhof TC, and Schneggenburger R (2011). RIM determines Ca2+ channel density and vesicle docking at the presynaptic active zone. Neuron 69, 304–316. [DOI] [PMC free article] [PubMed] [Google Scholar]
- Held RG, and Kaeser PS (2018). ELKS active zone proteins as multitasking scaffolds for secretion. Open Biol 8, 170258. [DOI] [PMC free article] [PubMed] [Google Scholar]
- Held RG, Liu C, and Kaeser PS (2016). ELKS controls the pool of readily releasable vesicles at excitatory synapses through its N-terminal coiled-coil domains. Elife 5. [DOI] [PMC free article] [PubMed] [Google Scholar]
- Held RG, Liu C, Ma K, Ramsey AM, Tarr TB, De Nola G, Wang SSH, Wang J, van den Maagdenberg AMJM, Schneider T, et al. (2020). Synapse and Active Zone Assembly in the Absence of Presynaptic Ca2+ Channels and Ca2+ Entry. Neuron 107, 667–683.e9. [DOI] [PMC free article] [PubMed] [Google Scholar]
- Hibino H, Pironkova R, Onwumere O, Vologodskaia M, Hudspeth AJ, and Lesage F (2002). RIM binding proteins (RBPs) couple Rab3-interacting molecules (RIMs) to voltage-gated Ca(2+) channels. Neuron 34, 411–423. [DOI] [PMC free article] [PubMed] [Google Scholar]
- Honigmann A, van den Bogaart G, Iraheta E, Risselada HJ, Milovanovic D, Mueller V, Müllar S, Diederichsen U, Fasshauer D, Grubmüller H, et al. (2013). Phosphatidylinositol 4,5-bisphosphate clusters act as molecular beacons for vesicle recruitment. Nat. Struct. Mol. Biol 20, 679–686. [DOI] [PMC free article] [PubMed] [Google Scholar]
- Hooper M, Hardy K, Handyside A, Hunter S, and Monk M (1987). HPRT-deficient (Lesch–Nyhan) mouse embryos derived from germline colonization by cultured cells. Nature 326, 292–295. [DOI] [PubMed] [Google Scholar]
- Hoppa MB, Lana B, Margas W, Dolphin AC, and Ryan TA (2012). Alpha2delta Expression Sets Presynaptic Calcium Channel Abundance and Release Probability. Nature 486, 1–5. [DOI] [PMC free article] [PubMed] [Google Scholar]
- Howe MW, and Dombeck DA (2016). Rapid signalling in distinct dopaminergic axons during locomotion and reward. Nature 535, 505–510. [DOI] [PMC free article] [PubMed] [Google Scholar]
- Imig C, Min SW, Krinner S, Arancillo M, Rosenmund C, Südhof TC, Rhee JS, Brose N, and Cooper BH (2014). The Morphological and Molecular Nature of Synaptic Vesicle Priming at Presynaptic Active Zones. Neuron 84, 416–431. [DOI] [PubMed] [Google Scholar]
- Jahn R, and Fasshauer D (2012). Molecular machines governing exocytosis of synaptic vesicles. Nature 490, 201–207. [DOI] [PMC free article] [PubMed] [Google Scholar]
- de Jong APH, Roggero CM, Ho M-R, Wong MY, Brautigam CA, Rizo J, and Kaeser PS (2018). RIM C2B Domains Target Presynaptic Active Zone Functions to PIP2-Containing Membranes. Neuron 98, 335–349.e7. [DOI] [PMC free article] [PubMed] [Google Scholar]
- Kaeser PS, and Regehr WG (2014). Molecular Mechanisms for Synchronous, Asynchronous, and Spontaneous Neurotransmitter Release. Annu. Rev. Physiol 76, 333–363. [DOI] [PMC free article] [PubMed] [Google Scholar]
- Kaeser PS, and Regehr WG (2017). The readily releasable pool of synaptic vesicles. Curr. Opin. Neurobiol 43, 63–70. [DOI] [PMC free article] [PubMed] [Google Scholar]
- Kaeser PS, Kwon HB, Chiu CQ, Deng L, Castillo PE, and Südhof TC (2008). RIM1alpha and RIM1beta are synthesized from distinct promoters of the RIM1 gene to mediate differential but overlapping synaptic functions. J. Neurosci 28, 13435–13447. [DOI] [PMC free article] [PubMed] [Google Scholar]
- Kaeser PS, Deng L, Wang Y, Dulubova I, Liu X, Rizo J, and Südhof TC (2011). RIM proteins tether Ca2+ channels to presynaptic active zones via a direct PDZ-domain interaction. Cell 144, 282–295. [DOI] [PMC free article] [PubMed] [Google Scholar]
- Kaeser PS, Deng L, Fan M, and Sudhof TC (2012). RIM genes differentially contribute to organizing presynaptic release sites. Proc. Natl. Acad. Sci 109, 11830–11835. [DOI] [PMC free article] [PubMed] [Google Scholar]
- Kalla S, Stern M, Basu J, Varoqueaux F, Reim K, Rosenmund C, Ziv NE, and Brose N (2006). Molecular dynamics of a presynaptic active zone protein studied in Munc13-1-enhanced yellow fluorescent protein knock-in mutant mice. J. Neurosci 26, 13054–13066. [DOI] [PMC free article] [PubMed] [Google Scholar]
- van Keimpema L, Kooistra R, Toonen RF, and Verhage M (2017). CAPS-1 requires its C2, PH, MHD1 and DCV domains for dense core vesicle exocytosis in mammalian CNS neurons. Sci. Rep 7, 10817. [DOI] [PMC free article] [PubMed] [Google Scholar]
- Koushika SP, Richmond JE, Hadwiger G, Weimer RM, Jorgensen EM, and Nonet ML (2001). A post-docking role for active zone protein Rim. Nat. Neurosci 4, 997–1005. [DOI] [PMC free article] [PubMed] [Google Scholar]
- Lakso M, Pichel JG, Gorman JR, Sauer B, Okamoto Y, Lee E, Alt FW, and Westphal H (1996). Efficient in vivo manipulation of mouse genomic sequences at the zygote stage. Proc. Natl. Acad. Sci. U. S. A 93, 5860–5865. [DOI] [PMC free article] [PubMed] [Google Scholar]
- Lein ES, Hawrylycz MJ, Ao N, Ayres M, Bensinger A, Bernard A, Boe AF, Boguski MS, Brockway KS, Byrnes EJ, et al. (2007). Genome-wide atlas of gene expression in the adult mouse brain. Nature 445, 168–176. [DOI] [PubMed] [Google Scholar]
- Lin JY, Lin MZ, Steinbach P, and Tsien RY (2009). Characterization of engineered channelrhodopsin variants with improved properties and kinetics. Biophys. J 96, 1803–1814. [DOI] [PMC free article] [PubMed] [Google Scholar]
- Liu C, and Kaeser PS (2019). Mechanisms and regulation of dopamine release. Curr. Opin. Neurobiol 57, 46–53. [DOI] [PMC free article] [PubMed] [Google Scholar]
- Liu C, Kershberg L, Wang J, Schneeberger S, and Kaeser PS (2018). Dopamine Secretion Is Mediated by Sparse Active Zone-like Release Sites. Cell 172, 706–718.e15. [DOI] [PMC free article] [PubMed] [Google Scholar]
- Liu C, Goel P, and Kaeser PS (2021). Spatial and temporal scales of dopamine transmission. Nat. Rev. Neurosci 22, 345–358. [DOI] [PMC free article] [PubMed] [Google Scholar]
- Liu KSY, Siebert M, Mertel S, Knoche E, Wegener S, Wichmann C, Matkovic T, Muhammad K, Depner H, Mettke C, et al. (2011). RIM-Binding Protein, a Central Part of the Active Zone, Is Essential for Neurotransmitter Release. Science 334, 1565–1569. [DOI] [PubMed] [Google Scholar]
- Liu Y, Schirra C, Edelmann L, Matti U, Rhee J, Hof D, Bruns D, Brose N, Rieger H, Stevens DR, et al. (2010). Two distinct secretory vesicle-priming steps in adrenal chromaffin cells. J. Cell Biol 190, 1067–1077. [DOI] [PMC free article] [PubMed] [Google Scholar]
- Luo F, Sclip A, Jiang M, and Südhof TC (2020). Neurexins cluster Ca2+ channels within the presynaptic active zone. EMBO J 39, e103208. [DOI] [PMC free article] [PubMed] [Google Scholar]
- Ma C, Li W, Xu Y, and Rizo J (2011). Munc13 mediates the transition from the closed syntaxin-Munc18 complex to the SNARE complex. Nat Struct Mol Biol 18, 542–549. [DOI] [PMC free article] [PubMed] [Google Scholar]
- Ma C, Su L, Seven AB, Xu Y, and Rizo J (2013). Reconstitution of the Vital Functions of Munc18 and Munc13 in Neurotransmitter Release. Science 339, 421–425. [DOI] [PMC free article] [PubMed] [Google Scholar]
- Man KNM, Imig C, Walter AM, Pinheiro PS, Stevens DR, Rettig J, Sørensen JB, Cooper BH, Brose N, and Wojcik SM (2015). Identification of a Munc13-sensitive step in chromaffin cell large dense-core vesicle exocytosis. Elife 4. [DOI] [PMC free article] [PubMed] [Google Scholar]
- Marcott PF, Gong S, Donthamsetti P, Grinnell SG, Nelson MN, Newman AH, Birnbaumer L, Martemyanov KA, Javitch JA, and Ford CP (2018). Regional Heterogeneity of D2-Receptor Signaling in the Dorsal Striatum and Nucleus Accumbens. Neuron 98, 575–587.e4. [DOI] [PMC free article] [PubMed] [Google Scholar]
- Matsuda W, Furuta T, Nakamura KC, Hioki H, Fujiyama F, Arai R, and Kaneko T (2009). Single nigrostriatal dopaminergic neurons form widely spread and highly dense axonal arborizations in the neostriatum. J. Neurosci 29, 444–453. [DOI] [PMC free article] [PubMed] [Google Scholar]
- Menegas W, Akiti K, Amo R, Uchida N, and Watabe-Uchida M (2018). Dopamine neurons projecting to the posterior striatum reinforce avoidance of threatening stimuli. Nat. Neurosci 21, 1421–1430. [DOI] [PMC free article] [PubMed] [Google Scholar]
- Milosevic I, Sørensen JB, Lang T, Krauss M, Nagy G, Haucke V, Jahn R, and Neher E (2005). Plasmalemmal phosphatidylinositol-4,5-bisphosphate level regulates the releasable vesicle pool size in chromaffin cells. J. Neurosci 25, 2557–2565. [DOI] [PMC free article] [PubMed] [Google Scholar]
- Missale C, Nash SRS, Robinson SW, Jaber M, and Caron MG (1998). Dopamine receptors: from structure to function. Physiol. Rev 78, 189–225. [DOI] [PubMed] [Google Scholar]
- Müller M, Liu KSY, Sigrist SJ, and Davis GW (2012). RIM controls homeostatic plasticity through modulation of the readily-releasable vesicle pool. J. Neurosci 32, 16574–16585. [DOI] [PMC free article] [PubMed] [Google Scholar]
- Di Paolo G, and De Camilli P (2006). Phosphoinositides in cell regulation and membrane dynamics. Nature 443, 651–657. [DOI] [PubMed] [Google Scholar]
- Patel MR, and Shen K (2009). RSY-1 is a local inhibitor of presynaptic assembly in C. elegans. Science 323, 1500–1503. [DOI] [PMC free article] [PubMed] [Google Scholar]
- Pereira DB, Schmitz Y, Mészáros J, Merchant P, Hu G, Li S, Henke A, Lizardi-Ortiz JE, Karpowicz RJ, Morgenstern TJ, et al. (2016). Fluorescent false neurotransmitter reveals functionally silent dopamine vesicle clusters in the striatum. Nat. Neurosci 19, 578–586. [DOI] [PMC free article] [PubMed] [Google Scholar]
- Persoon CM, Hoogstraaten RI, Nassal JP, van Weering JRT, Kaeser PS, Toonen RF, and Verhage M (2019). The RAB3-RIM Pathway Is Essential for the Release of Neuromodulators. Neuron 104, 1065–1080.e12. [DOI] [PMC free article] [PubMed] [Google Scholar]
- Renden R, Berwin B, Davis W, Ann K, Chin C-T, Kreber R, Ganetzky B, Martin TFJ, and Broadie K (2001). Drosophila CAPS Is an Essential Gene that Regulates Dense-Core Vesicle Release and Synaptic Vesicle Fusion. Neuron 31, 421–437. [DOI] [PubMed] [Google Scholar]
- Rhee JS, Betz A, Pyott S, Reim K, Varoqueaux F, Augustin I, Hesse D, Sudhof TC, Takahashi M, Rosenmund C, et al. (2002). Beta phorbol ester- and diacylglycerol-induced augmentation of transmitter release is mediated by Munc13s and not by PKCs. Cell 108, 121–133. [DOI] [PubMed] [Google Scholar]
- Richmond JE, Davis WS, and Jorgensen EM (1999). UNC-13 is required for synaptic vesicle fusion in C. elegans. Nat. Neurosci 2, 959–964. [DOI] [PMC free article] [PubMed] [Google Scholar]
- Robinson BG, Cai X, Wang J, Bunzow JR, Williams JT, and Kaeser PS (2019). RIM is essential for stimulated but not spontaneous somatodendritic dopamine release in the midbrain. Elife 8. [DOI] [PMC free article] [PubMed] [Google Scholar]
- Sakamoto H, Ariyoshi T, Kimpara N, Sugao K, Taiko I, Takikawa K, Asanuma D, Namiki S, and Hirose K (2018). Synaptic weight set by Munc13-1 supramolecular assemblies. Nat. Neurosci 21, 41–49. [DOI] [PubMed] [Google Scholar]
- Saunders A, Macosko EZ, Wysoker A, Goldman M, Krienen FM, de Rivera H, Bien E, Baum M, Bortolin L, Wang S, et al. (2018). Molecular Diversity and Specializations among the Cells of the Adult Mouse Brain. Cell 174, 1015–1030.e16. [DOI] [PMC free article] [PubMed] [Google Scholar]
- Schindelin J, Arganda-Carreras I, Frise E, Kaynig V, Longair M, Pietzsch T, Preibisch S, Rueden C, Saalfeld S, Schmid B, et al. (2012). Fiji: an open-source platform for biological-image analysis. Nat. Methods 9, 676–682. [DOI] [PMC free article] [PubMed] [Google Scholar]
- Schoch S, Castillo PE, Jo T, Mukherjee K, Geppert M, Wang Y, Schmitz F, Malenka RC, and Südhof TC (2002). RIM1alpha forms a protein scaffold for regulating neurotransmitter release at the active zone. Nature 415, 321–326. [DOI] [PubMed] [Google Scholar]
- Sclip A, and Südhof TC (2020). LAR receptor phospho-tyrosine phosphatases regulate NMDA-receptor responses. Elife 9. [DOI] [PMC free article] [PubMed] [Google Scholar]
- Serra-Pages C, Medley QG, Tang M, Hart A, and Streuli M (1998). Liprins, a family of LAR transmembrane protein-tyrosine phosphatase-interacting proteins. J. Biol. Chem 273, 15611–15620. [DOI] [PubMed] [Google Scholar]
- Serra-Pagès C, Kedersha NL, Fazikas L, Medley Q, Debant a, and Streuli M (1995). The LAR transmembrane protein tyrosine phosphatase and a coiled-coil LAR-interacting protein co-localize at focal adhesions. EMBO J 14, 2827–2838. [DOI] [PMC free article] [PubMed] [Google Scholar]
- Sigler A, Oh WC, Imig C, Altas B, Kawabe H, Cooper BH, Kwon H-B, Rhee J-S, and Brose N (2017). Formation and Maintenance of Functional Spines in the Absence of Presynaptic Glutamate Release. Neuron 94, 304–311.e4. [DOI] [PMC free article] [PubMed] [Google Scholar]
- Siksou L, Varoqueaux F, Pascual O, Triller A, Brose N, and Marty S (2009). A common molecular basis for membrane docking and functional priming of synaptic vesicles. Eur. J. Neurosci 30, 49–56. [DOI] [PubMed] [Google Scholar]
- Silm K, Yang J, Marcott PF, Asensio CS, Eriksen J, Guthrie DA, Newman AH, Ford CP, and Edwards RH (2019). Synaptic Vesicle Recycling Pathway Determines Neurotransmitter Content and Release Properties. Neuron 102, 786–800.e5. [DOI] [PMC free article] [PubMed] [Google Scholar]
- Südhof TC (2012). The Presynaptic Active Zone. Neuron 75, 11–25. [DOI] [PMC free article] [PubMed] [Google Scholar]
- Sulzer D, Cragg SJ, and Rice ME (2016). Striatal dopamine neurotransmission: regulation of release and uptake. Basal Ganglia 6, 123–148. [DOI] [PMC free article] [PubMed] [Google Scholar]
- Tang A-H, Chen H, Li TP, Metzbower SR, MacGillavry HD, and Blanpied TA (2016). A trans-synaptic nanocolumn aligns neurotransmitter release to receptors. Nature 536, 210–214. [DOI] [PMC free article] [PubMed] [Google Scholar]
- Threlfell S, Lalic T, Platt NJ, Jennings K. a., Deisseroth K, and Cragg SJ (2012). Striatal dopamine release is triggered by synchronized activity in cholinergic interneurons. Neuron 75, 58–64. [DOI] [PubMed] [Google Scholar]
- Uchigashima M, Ohtsuka T, Kobayashi K, and Watanabe M (2016). Dopamine synapse is a neuroligin-2-mediated contact between dopaminergic presynaptic and GABAergic postsynaptic structures. Proc. Natl. Acad. Sci. U. S. A 113, 201514074. [DOI] [PMC free article] [PubMed] [Google Scholar]
- Varoqueaux F, Sigler A, Rhee JS, Brose N, Enk C, Reim K, and Rosenmund C (2002). Total arrest of spontaneous and evoked synaptic transmission but normal synaptogenesis in the absence of Munc13-mediated vesicle priming. Proc. Natl. Acad. Sci. U. S. A 99, 9037–9042. [DOI] [PMC free article] [PubMed] [Google Scholar]
- Varoqueaux F, Sons MS, Plomp JJ, and Brose N (2005). Aberrant morphology and residual transmitter release at the Munc13-deficient mouse neuromuscular synapse. Mol. Cell. Biol 25, 5973–5984. [DOI] [PMC free article] [PubMed] [Google Scholar]
- Verhage M, Maia AS, Plomp JJ, Brussaard a B., Heeroma JH, Vermeer H, Toonen RF, Hammer RE, van den Berg TK, Missler M, et al. (2000). Synaptic assembly of the brain in the absence of neurotransmitter secretion. Science 287, 864–869. [DOI] [PubMed] [Google Scholar]
- Wang SSH, Held RG, Wong MY, Liu C, Karakhanyan A, and Kaeser PS (2016). Fusion Competent Synaptic Vesicles Persist upon Active Zone Disruption and Loss of Vesicle Docking. Neuron 91, 777–791. [DOI] [PMC free article] [PubMed] [Google Scholar]
- Wong MY, Liu C, Wang SSH, Roquas ACF, Fowler SC, and Kaeser PS (2018). Liprin-α3 controls vesicle docking and exocytosis at the active zone of hippocampal synapses. Proc. Natl. Acad. Sci 115, 2234–2239. [DOI] [PMC free article] [PubMed] [Google Scholar]
- Wu X, Cai Q, Shen Z, Chen X, Zeng M, Du S, and Zhang M (2019). RIM and RIM-BP Form Presynaptic Active-Zone-like Condensates via Phase Separation. Mol. Cell 73, 971–984.e5. [DOI] [PubMed] [Google Scholar]
- Yagishita S, Hayashi-Takagi A, Ellis-Davies GCR, Urakubo H, Ishii S, and Kasai H (2014). A critical time window for dopamine actions on the structural plasticity of dendritic spines. Science 345, 1616–1620. [DOI] [PMC free article] [PubMed] [Google Scholar]
- Zhen M, and Jin Y (1999). The liprin protein SYD-2 regulates the differentiation of presynaptic termini in C. elegans. Nature 401, 371–375. [DOI] [PubMed] [Google Scholar]
- Zhou F-M, Liang Y, and Dani J. a (2001). Endogenous nicotinic cholinergic activity regulates dopamine release in the striatum. Nat. Neurosci 4, 1224–1229. [DOI] [PubMed] [Google Scholar]
- Zürner M, Mittelstaedt T, tom Dieck S, Becker A, and Schoch S (2011). Analyses of the spatiotemporal expression and subcellular localization of liprin-α proteins. J. Comp. Neurol 519, 3019–3039. [DOI] [PubMed] [Google Scholar]
Associated Data
This section collects any data citations, data availability statements, or supplementary materials included in this article.
Supplementary Materials
Data Availability Statement
The original code has been deposited to GitHub and is publicly available as listed in the key resources table. Data reported in this paper are available from the lead contact upon reasonable request. Any additional information required to reanalyze the data reported in this paper is available from the lead contact upon request.
Key resources table
| REAGENT or RESOURCE | SOURCE | IDENTIFIER |
|---|---|---|
| Antibodies | ||
| Mouse monoclonal anti-ß-Tubulin | Sigma-Aldrich | Cat#T4026; RRID:AB_477577 |
| Rabbit polyclonal anti-Munc13-1 | Synaptic Systems | Cat# 126 103; RRID:AB_887733 |
| Rabbit polyclonal anti-Munc13-1 (C-terminal #N395) | (Betz et al., 1997) | N/A |
| Rabbit polyclonal anti-Munc13-1 (N-terminal #40) | (Cooper et al., 2012; Varoqueaux et al., 2005) | N/A |
| Mouse monoclonal IgG1 anti-synaptophysin-1 (A100) | Synaptic Systems | Cat# 101 011; RRID:AB_887824 |
| Guinea pig polyclonal anti-Tyrosine hydroxylase (A111) | Synaptic Systems | Cat# 213 104, RRID:AB_2619897 |
| Rabbit polyclonal anti-Tyrosine hydroxylase (A66) | Millipore | Cat# AB152; RRID:AB_390204 |
| Rabbit monoclonal anti-GFP (A195) | Thermo Fisher Scientific | Cat# G10362; RRID:AB_2536526 |
| Mouse monoclonal IgG2a anti-Bassoon SAP7F407 (A85) | Enzo Life Sciences | Cat# ADI-VAM-PS003-F; RRID:AB_11181058 |
| Rabbit polyclonal antibody anti-RIM1 (A58) | Synaptic Systems | Cat# 140 003 RRID:AB_887774 |
| Rabbit polyclonal anti-ELKS2α (1029, A136) | (Held et al., 2016) | E3-1029 |
| Mouse monoclonal anti-HA-tag 6E2 (A250) | Cell Signaling Technology | Cat# 2367; RRID:AB_10691311 |
| Chemicals, Peptides, and Recombinant Proteins | ||
| Tetrodotoxin | Tocris | Cat. No. 1078 |
| Dihydro-β-erythroidine hydrobromide | Tocris | Cat. No. 2349 |
| Mammalian Protease Inhibitor Cocktail | Sigma | Cat# P8340 |
| Image-iT™ FX Signal Enhancer | Thermo Fisher Scientific | Cat# I36933 |
| Experimental Models: Cell Lines | ||
| Derivate of 129/Ola mouse embryonic stem cell line E14 | (Hooper et al., 1987) | RRID:CVCL_9108 |
| Mouse embryonic fibroblasts (MEF feeder cells) | Xenogen, Alameda, CA, USA | N/A |
| HEK293T | ATCC | Cat#: CRL-3216, RRID:CVCL_0063 |
| Experimental Models: Organisms/Strains | ||
| Mouse: Munc13-1fl/fl | This study | N/A |
| Mouse: Munc13-1 cKOgl | This study | N/A |
| Mouse: Munc13-1−/−; unc13atm1Bros | (Augustin et al., 1999) | MGI:2449468 |
| Mouse: Munc13-1mNeo/mNeo | (Rhee et al., 2002) | N/A; mutated Unc13a gene containing a neomycin cassette |
| Mouse: Munc13-2−/−; unc13btm1Rmnd | (Varoqueaux et al., 2002) | MGI:2449706 |
| Mouse: Munc13-3−/−; unc13ctm1Bros | (Augustin et al., 2001) | MGI:2449467 |
| Mouse: FLP deleter; Gt(ROSA)26Sortm1(FLP1)Dym | (Farley et al., 2000) | MGI:2429412 |
| Mouse: Ella-Cre; Tg(EIIa-cre)C5379Lmgd | (Lakso et al., 1996) | MGI:2137691 |
| Mouse: DATIRES-cre; B6.SJL-Slc6a3tm1.1(cre)Bkmm/J | (Backman et al., 2006) | JAX 006660, |
| Mouse: Munc13-1-EYFP; Unc13atm3Bros | (Kalla et al., 2006) | MGI:3695486 |
| Mouse: Liprin-α3−/− | (Wong et al., 2018) | N/A |
| Mouse: Liprin-α2fl/fl | (Emperador-Melero et al., 2021a) | MGI:2443834 |
| Mouse: RIM-BP1fl/fl; Tspoap1tm1Sud/J | (Acuna et al., 2015) | JAX: 023643 |
| Mouse: RIM-BP2fl/fl; Rimbp2tm1Sud/J | (Acuna et al., 2015) | JAX: 023644 |
| Mouse: RIM1fl/fl; Rims1tm3Sud/J | (Kaeser et al., 2008) | JAX:015832 |
| Mouse: RIM2fl/fl; Rims2tm1.1Sud/J | (Kaeser et al., 2011) | JAX:015833 |
| Recombinant DNA | ||
| BAC: BMQ-441L13 (pBACe3.6 backbone) | (Adams et al., 2005) | N/A |
| Targeting vector: PL253-M13-1loxP-e21-FRT-Neo-FRT-loxP-HSV-TK | This study | N/A |
| pAAV-hSyn-flex-RIM1-Zn-HA (p866) | This study | N/A |
| pAAV-hSyn-flex-RIM1-ΔZn-HA (p865) | This study | N/A |
| pAAV-hSyn-flex-RIM1-Zn-HA-C2B (p902) | This study | N/A |
| pAAV-hSyn-flex-RIM1-Zn-HA- Zn-C2BKE (p903) | This study | N/A |
| pAAV-hSyn-flex-RIM1-Zn-HA-PCP (p968) | This study | N/A |
| pAAV-hSyn-flex-oChIEF-citrine (p901) | Addgene, (Lin et al., 2009) | Plasmid# 50973, RRID:Addgene_50973 |
| pAAV-hSyn-flex-citrine (p906) | This study | N/A |
| Oligonucleotides | ||
| Munc13-1 genotyping: 5'-CTCTATGGCTTCTGAGGCGGAAA-3' |
This study | LabID:27121 |
| Munc13-1 genotyping: 5'-AGTTTTCATCTTGTAGCCCGAT-3' |
This study | LabID:27122 |
| Munc13-1 genotyping: 5'-CAACTGGCCAAGAACTAGAGGA-3' |
This study | LabID:27123 |
| Munc13-1 genotyping: 5'-GCACGGAATGTTGAATGGTCTT -3' |
This study | LabID:27124 |
| Munc13-1 splice variants, exon 20; sense: 5’-CCATCCGGCTTCACATCAGT-3’ | This study | LabID:24609 |
| Munc13-1 splice variants, exon 23; antisense: 5’-CGATCCGCAGAGAATTGTGTAGC-3’ | This study | LabID:34504 |
| Munc13-1 splice variants, exon 25; antisense: 5’-TACTCCCGGCCATAGAGCTCA-3’ | This study | LabID:34505 |
| Software and Algorithms | ||
| Custom machine learning code for TH morphology | This study | DOI: 10.5281/zenodo.5576622 |
| Custom MATLAB code | (Liu et al., 2018) | DOI: 10.5281/zenodo.5576635 |
| DNASTAR Lasergene 13 | DNASTAR | RRID:SCR_011854; https://www.dnastar.com/software/lasergene/ |
| GraphPad Prism | GraphPad | RRID:SCR_002798; http://www.graphpad.com/ |
| Fiji | Schindelin et al., 2012 | RRID:SCR_002285, https://imagej.net/Fiji/Downloads |
| DeltaVision OMX imaging system | GE Healthcare | RRID: SCR_019956; https://scicrunch.org/resources/Tools/record/nlx_144509-1/SCR_019956/resolver?q=SCR_019956&l=SCR_019956 |
| Olympus Fluoview FV10-ASW | Olympus Fluoview | RRID:SCR_014215, http://www.photonics.com/Product.aspx?PRID=47380 |
| pClamp | Molecular Devices | RRID:SCR_011323, http://www.moleculardevices.com/products/software/pclamp.html |
| Imaris 9.0.2 | Oxford Instruments | RRID:SCR_007370 http://www.bitplane.com/imaris/imaris |