Figure 1.

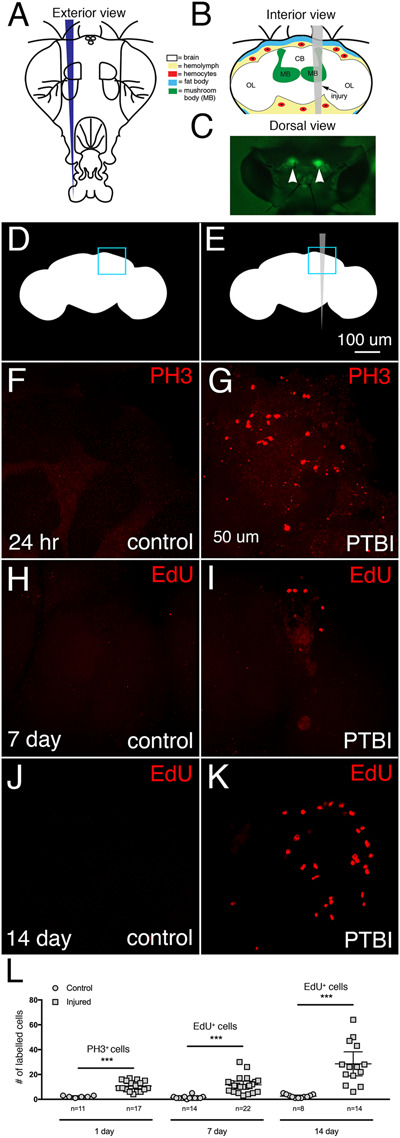
PTBI stimulates cell proliferation. (A) Schematic of the exterior of an adult fly head. This is a frontal view. Thus, the right side of the animal is to the viewer’s left. (B) Schematic of the interior of an adult Drosophila head with the injury trajectory indicated in grey. This is a posterior view. Thus, in this image and subsequent figures, the right side of the brain is to the right. Central brain PTBI impacts multiple brain structures including the mushroom body (MB, green), and tissues outside the brain including the fat body (blue) and hemocytes (red). CB, central brain region; OL, optic lobe region. (C) Dorsal view of a live adult head in which mushroom bodies (arrowheads) are labeled with GFP. This is our “standard genotype” (see text for details). The PTBI protocol reproducibly results in injury to the mushroom bodies. Uninjured, control (D), and PTBI (E) schematics. The blue boxes in the upper right corners indicate the brain regions shown at higher magnification in panels (F–K). (F,G). PH3 antibody (red) was used to assay for cell proliferation 24 hours after injury. In control brains (F) there are few PH3+ cells, and none near the MB. However, in PTBI brains (G), there are PH3+ cells near the MB. (H,I) To test whether newly created cells are surviving or being eliminated, we conducted a pulse-chase EdU experiment. Flies were fed EdU (red) for 4 days post-injury (a pulse) then chased for 3 days without feeding EdU. In the control brain (H), there is little EdU incorporation. In the PTBI brain (I), there are EdU+ cells near the MB. (J) In 14-day control brains, there are few EdU+ cells. (K) However, in 14-day PTBI brains, there is an increase in EdU+ cells near the MB. All brains are from males of our standard genotype. (L) Quantification of proliferating cells. The numbers reflect proliferating cells throughout entire brains, not only in the vicinity of the mushroom body. At 24 hours, uninjured control brains had an average of 3 PH3+ cells/brain (n = 11 brains, 28 cells), while 24-hour post-PTBI brains had an average of 11 PH3+ cells/brain (n = 17 brains, 181 cells). At 7 days, uninjured controls have few EdU+ cells, with an average of 2 EdU+ cells/brain (n = 15 brains, 24 cells), while 7-day post-PTBI brains had an average of 11 EdU+ cells/brain (n = 22 brains, 238 cells). At 14 days, uninjured controls have an average of 1 EdU+ cell/brain (n = 8 brains, 11 cells), while 14-day post-PTBI brains have an average of 29 EdU+ cells/brain (n = 14 brains, 400 cells). Unpaired t tests of control and PTBI samples at the 3 time points yield values of P < 0.0001, P < 0.0001, and P < 0.0002, respectively. Error bars reflect the standard deviation (SD).
