Figure 3.
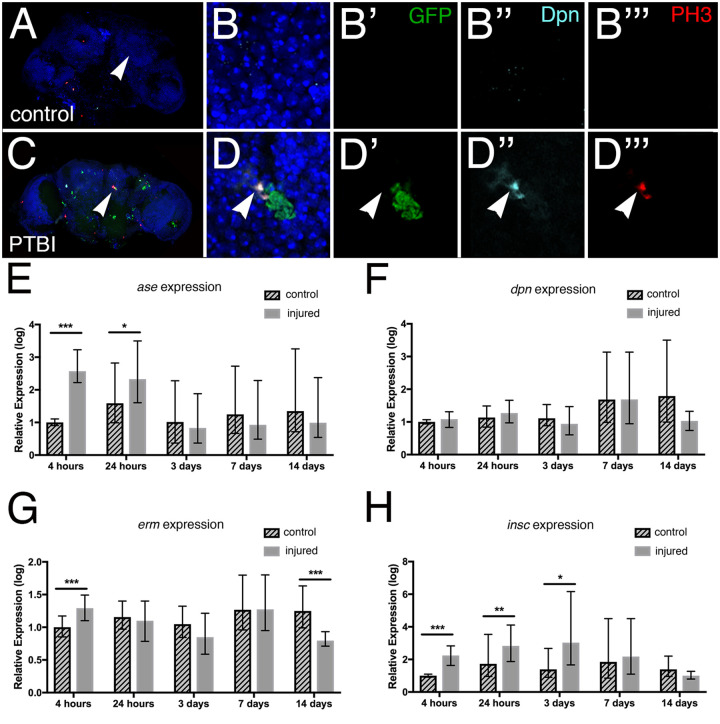
Neuroblast gene expression is activated by PTBI. (A) and (C) are low magnification views of the control and PTBI brains shown at higher resolution in B–B’’’ and D–D’’’, respectively. (A–B’’’) Images from an uninjured ase-GAL4, UAS-Stinger; UAS-GAL80ts probed with anti-PH3 (red) and anti-Dpn (cyan). GFP (green) from the UAS-Stinger construct is expressed under control of ase regulatory sequences. The nuclear dye DAPI is in blue. Arrowheads in (A) and (C) indicate the regions where higher magnification images were collected. Animals were reared at 18°C where the temperature-sensitive Gal80 repressor is active and shifted to 29°C after eclosion to permit expression of GFP in cells expressing ase. At 24 hours post-PTBI (C–D’’’), but not in control (A–B’’’) brains, there are GFP+ cells, indicating the expression of ase, which is a neural progenitor gene. (D,D’). Cells that were Dpn+ (cyan) and PH3+ (red) also were observed in injured brains (D’’,D’’’), but not in controls (B’’,B’’’). dpn is a neuroblast and neural progenitor gene. In this example, PH3+Dpn+ cells were in close proximity to GFP+ cells (D), consistent with a lineal relationship. (E–H) qRT-PCR reveals increases in neural progenitor gene expression following PTBI. The mRNA levels of four different neural progenitor genes were assayed at 4 hours, 24 hours, 3 days, 7 days, and 14 days. (E) The level of ase mRNA is increased more than fivefold by 4 hours and remains elevated at 24 hours. However, at 3, 7, and 14 days, ase mRNA levels are no longer higher than in controls. (F) The level of dpn mRNA was not detectably increased at any timepoints. (G) mRNA levels of erm are increased almost threefold at 4 hours post-injury. However, by 24 hours, 3 days, and 7 days, erm mRNA levels have returned to baseline. (H) insc mRNA levels are increased sixfold at 4 hours, 24 hours, and 3 days post-injury. At later timepoints, 7 and 14 days, insc mRNA levels return to near baseline. The qRT-PCR results reflect triplicate biological samples, represented relative to the levels of Rp49, and then normalized to the corresponding levels in time-matched controls. Error bars calculated by Relative Expression Software Tool analysis and reflect the standard error of the mean (SEM). Note that scales on Y axes differ among the graphs.

