. 2022 Feb 21;11:e66761. doi: 10.7554/eLife.66761

Figure 3. Interindividual variability, slow oscillation (SO)–spindle coupling development, and neural correlates of gross-motor learning dynamics.

(A) Left: topographical distribution of the 1/f corrected SO and spindle amplitude as extracted from the oscillatory residual (Figure 3—figure supplement 1A, right). Note that adolescents and adults both display the expected topographical distribution of more pronounced frontal SO and centroparietal spindles. Right: single subject data of the oscillatory residual for all subjects with sleep data color coded by age (darker colors indicate older subjects). SO and spindle frequency ranges are indicated by the dashed boxes. Importantly, subjects displayed high interindividual variability in the sleep spindle range and a gradual spindle frequency increase by age that is critically underestimated by the group average of the oscillatory residuals (Figure 3—figure supplement 1A, right). (B) Spindle peak locked epoch (NREM3, co-occurrence corrected) grand averages (mean ± standard error of the mean [SEM]) for adolescents (red) and adults (black). Inset depicts the corresponding SO-filtered (2 Hz lowpass) signal. Gray-shaded areas indicate significant clusters. Note, we found no difference in amplitude after normalization. Significant differences are due to more precise SO–spindle coupling in adults. (C) Top: comparison of SO–spindle coupling strength between adolescents and adults. Adults displayed more precise coupling than adolescents in a centroparietal cluster. T-Scores are transformed to z-scores. Asterisks denote cluster-corrected two-sided p < 0.05. Bottom: Exemplary depiction of coupling strength (mean ± SEM) for adolescents (red) and adults (black) with single subject data points. Exemplary single electrode data (bottom) is shown for C4 instead of Cz to visualize the difference. (D) Cluster-corrected correlations between individual coupling strength and overnight task proficiency change (post–preretention) for adolescents (red, circle) and adults (black, diamond) of the sleep-first group (left, data at C4). Asterisks indicate cluster-corrected two-sided p < 0.05. Gray-shaded area indicates 95% confidence intervals of the trend line. Participants with a more precise SO–spindle coordination show improved task proficiency after sleep. Note that the change in task proficiency was inversely related to the change in learning curve (Figure 2F), indicating that a stronger improvement in task proficiency related to a flattening of the learning curve. Further note that the significant cluster formed over electrodes close to motor areas. (E) Cluster-corrected correlations between individual coupling strength and overnight learning curve change. Same conventions as in (D). Participants with more precise SO–spindle coupling over C4 showed attenuated learning curves after sleep.

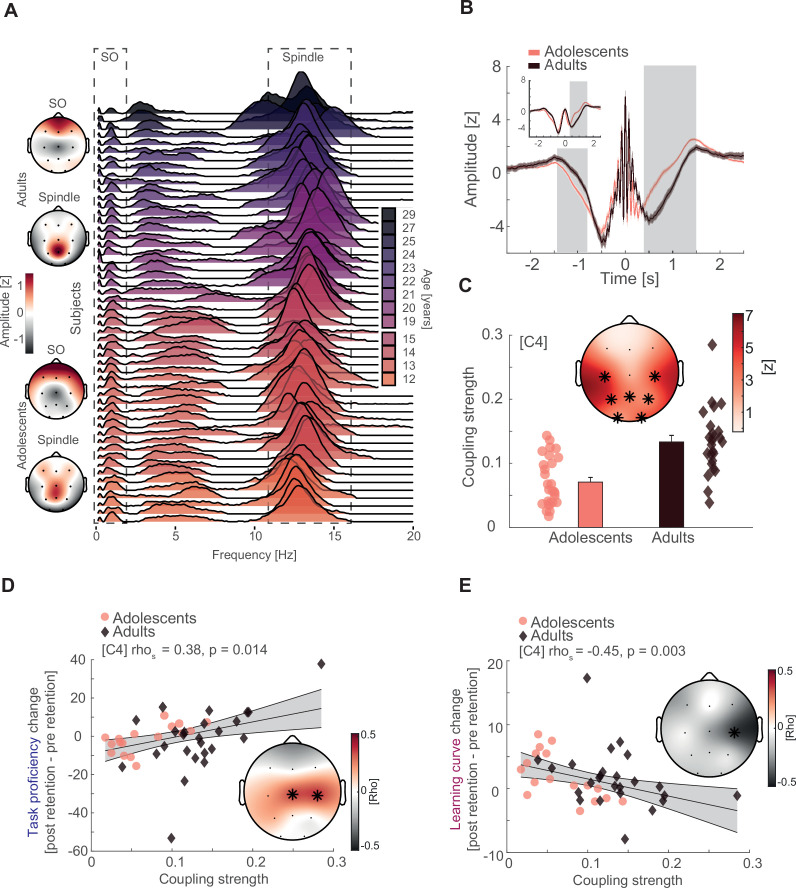
Figure 3.

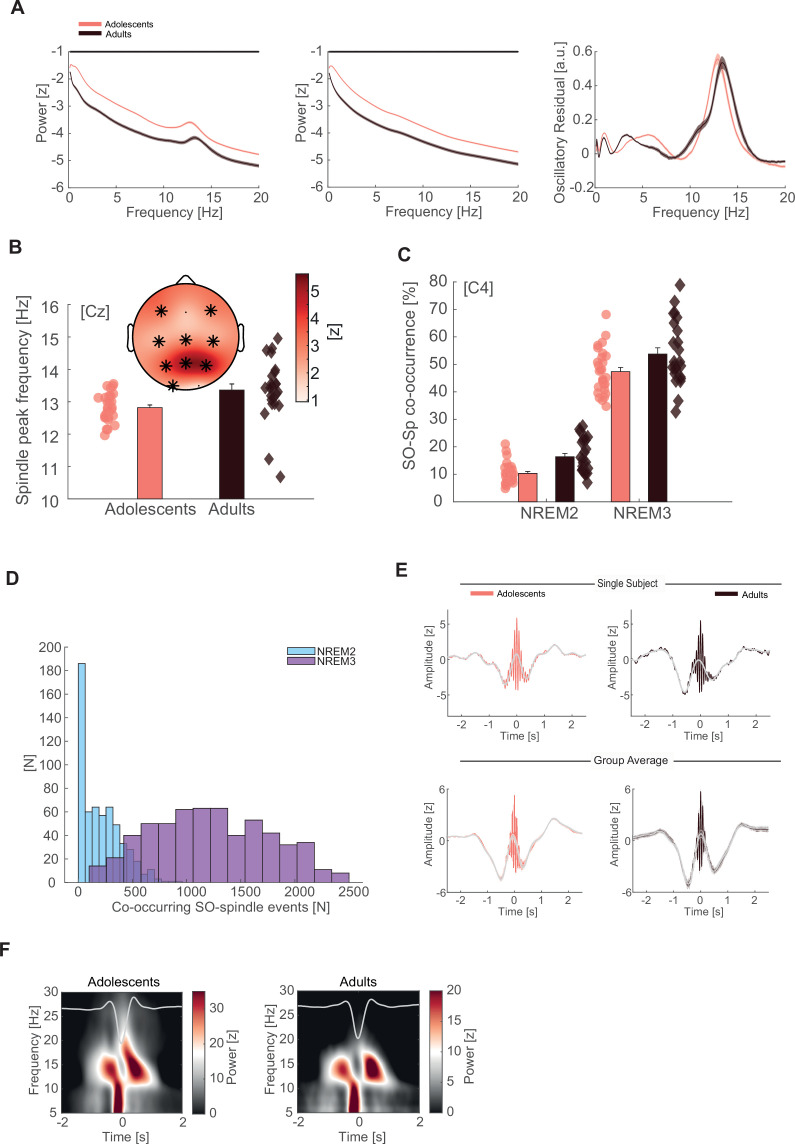
Figure 3—figure supplement 1. Sleep oscillation features and additional SO-spindle coupling analyses.

Figure 3—figure supplement 1.

(A) Left: z-normalized EEG power spectra (mean ± standard error of the mean [SEM]) for adolescents (red) and adults (black) during NREM sleep in semi-log space. Data are displayed for the representative electrode Cz unless specified otherwise. Note the overall power difference between adolescents and adults due to a broadband shift on the y-axis. Straight black line denotes cluster-corrected significant differences. Middle: 1/f fractal component that underlies the broadband shift. Right: oscillatory residual after subtracting the fractal component (A, middle) from the power spectrum (A, left). Both groups show clear delineated peaks in the slow oscillation (SO; <2 Hz) and spindle range (11–16 Hz) establishing the presence of the cardinal sleep oscillations in the signal. (B) Top: spindle frequency peak development based on the oscillatory residuals. Spindle frequency is faster at all but occipital electrodes in adults than in adolescents. T-Scores are transformed to z-scores. Asterisks denote cluster-corrected two-sided p < 0.05. Bottom: exemplary depiction of the spindle frequency (mean ± SEM) for adolescents (red) and adults (black) with single subject data points at Cz. (C) SO–spindle co-occurrence rate (mean ± SEM) for adolescents (red) and adults (black) during NREM2 and NREM3 sleep. Event co-occurrence is higher in NREM3 (F(1, 51) = 1209.09, p < 0.001, partial eta² = 0.96) as well as in adults (F(1, 51) = 11.35, p = 0.001, partial eta² = 0.18). (D) Histogram of co-occurring SO–spindle events in NREM2 (blue) and NREM3 (purple) collapsed across all subjects and electrodes. Note the low co-occurring event count in NREM2 sleep. (E) Single subject (top) and group averages (bottom, mean ± SEM) for adolescents (red) and adults (black) of individually detected, for SO co-occurrence-corrected sleep spindles in NREM3. Spindles were detected based on the information of the oscillatory residual. Note the underlying SO component (gray) in the spindle detection for single subject data and group averages indicating a spindle amplitude modulation depending on SO phase. (F) Grand average time–frequency plots (−2 to −1.5 s baseline corrected) of SO-trough-locked segments (corrected for spindle co-occurrence) in NREM3 for adolescents (left) and adults (right). Schematic SO is plotted superimposed in gray. Note the alternating power pattern in the spindle frequency range, showing that SO phase modulates spindle activity in both age groups.
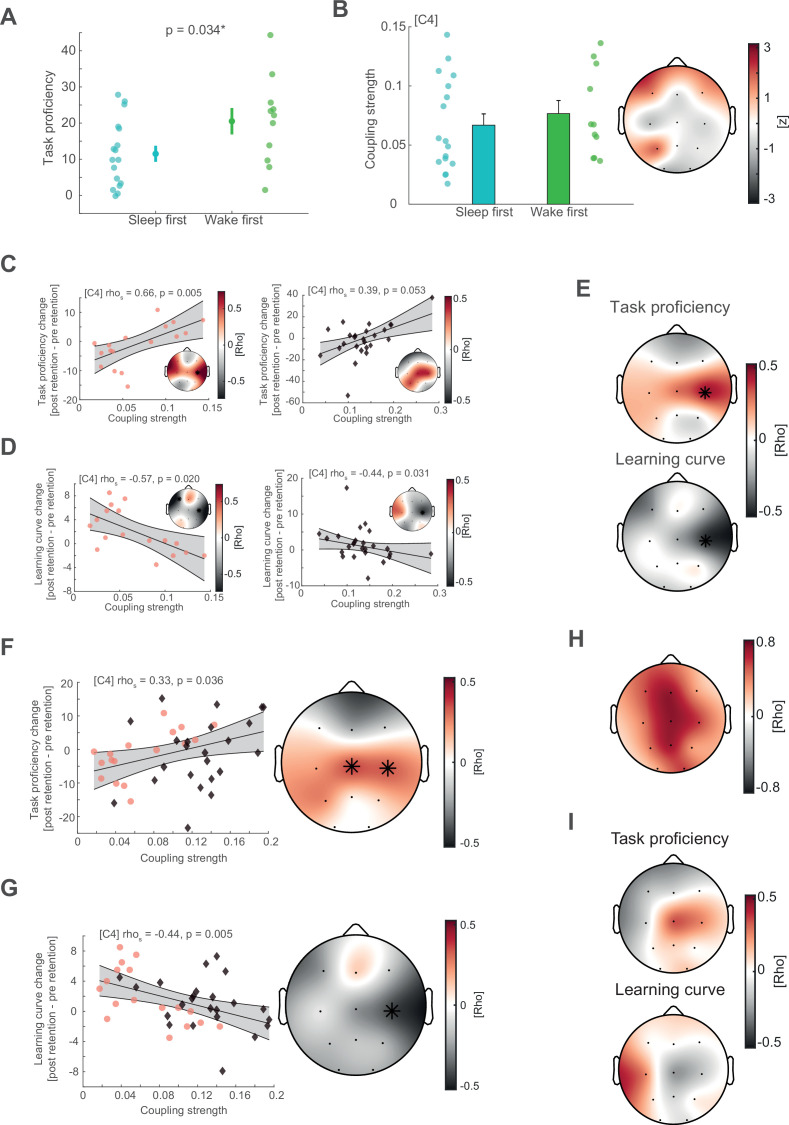
Figure 3—figure supplement 2. Supplemental behavioral analyses of the adolescent group, additional coupling strength with behavior correlations, and control analyses.

Figure 3—figure supplement 2.

(A) Comparison of task proficiency between sleep-first and wake-first groups after the sleep retention interval (mean ± standard error of the mean [SEM]). Adolescents in the wake-first group had higher task proficiency given the additional juggling performance test, which also reflects additional training (t(23) = −2.24, p = 0.034). (B) Comparison of slow oscillation (SO)–spindle coupling strength in the adolescent sleep-first (blue) and wake-first (green) groups using cluster-based random permutation testing (Monte-Carlo method, cluster alpha 0.05, max size criterion, 1000 iterations, critical alpha level 0.05, two-sided). Left: exemplary depiction of coupling strength at electrode C4 (mean ± SEM). Right: z-transformed t-values plotted for all electrodes obtained from the cluster test. No significant clusters emerged. (C) Left: cluster-corrected correlations between individual coupling strength and overnight task proficiency change (post–preretention) for adolescents of the sleep-first group with Spearman correlation at C4, uncorrected. Asterisks indicate cluster-corrected two-sided p < 0.05. Gray-shaded area indicates 95% confidence intervals of the robust trend line. Participants with a more precise SO–spindle coordination show improved task proficiency after sleep. Right: cluster-corrected correlation of coupling strength and overnight task proficiency change for adults. Independently, adolescents and adults with higher coupling strength have better task proficiency after sleep. (D) Left: cluster-corrected correlation of coupling strength and overnight learning curve change for adolescents. Same conventions as in (C). Higher coupling strength related to a flatter learning curve after sleep. Right: cluster-corrected correlation of coupling strength and overnight learning curve change for adults. Higher coupling strength related to a flatter learning curve after sleep in both age groups. (E) Cluster-corrected correlations for coupling strength of co-occurrence corrected events in NREM2 and NREM3 sleep with overnight task proficiency change (top) and overnight learning curve change (bottom). Asterisks indicate cluster-corrected two-sided p < 0.05. Similar to our original analyses (Figure 3D, E) we found significant cluster-corrected correlations at C4. (F) Cluster-corrected correlations between individual coupling strength and overnight task proficiency change (post–preretention) after outlier removal with Spearman correlation at C4, uncorrected. Similar to our original analyses we found a significant central cluster (mean rho = 0.35, p = 0.029, cluster-corrected) after outlier removal. (G) Same conventions as in (F) but for overnight learning curve change. Similar to our original analyses we found a significant correlation at C4 (rho = −0.44, p = 0.047, cluster-corrected). (H) Topographical plot of Spearman rank correlations of coupling strength in the adaptation night and learning night across all subjects. Overall coupling strength was highly correlated between the two measurements (mean rho across all channels = 0.55), supporting the notion that coupling strength remains rather stable within the individual (i.e., trait). (I) To investigate a possible state effect for coupling strength and motor learning, we calculated the difference in coupling strength between the two nights (learning night–adaptation night) and correlated these values with the overnight change in task proficiency and learning curve. We identified no significant correlations with a learning-induced coupling strength change. Neither for task proficiency (top) nor learning curve change (bottom).
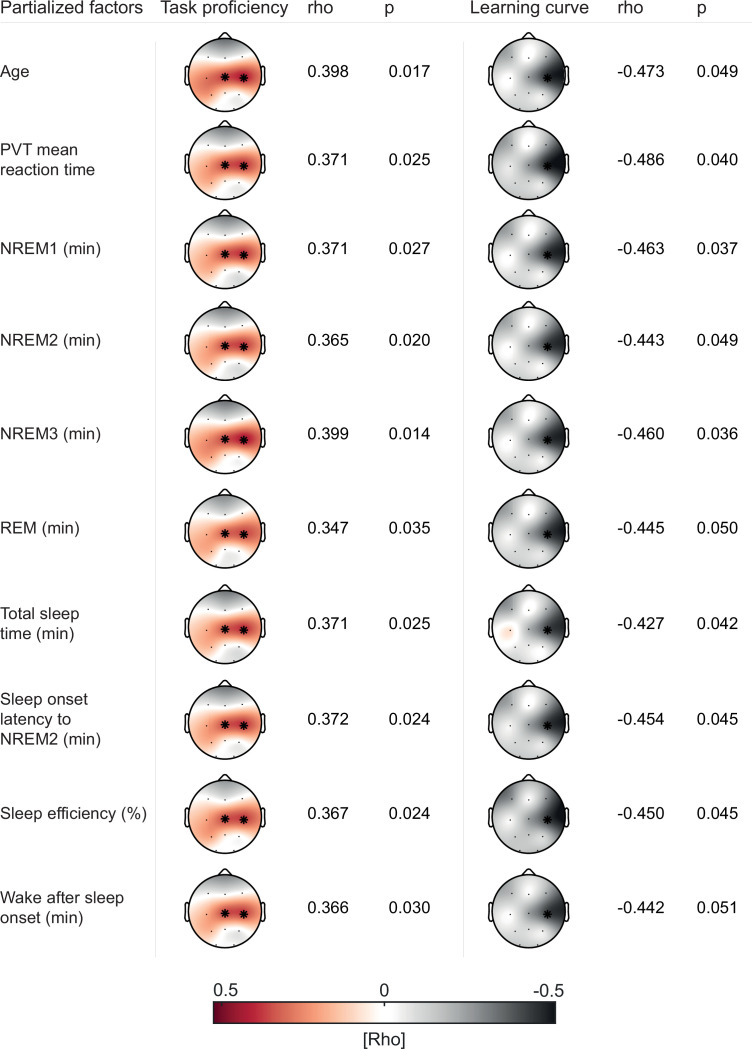
Figure 3—figure supplement 3. Partial correlations controlling for age, PVT reaction time, and sleep architecture.

Figure 3—figure supplement 3.

Summary of cluster-corrected partial correlations (Monte-Carlo method, cluster alpha 0.05, max size criterion, 1000 iterations, critical alpha level 0.05, two-sided) of coupling strength with task proficiency (left) and learning curve (right) controlling for possible confounding factors.Asterisks indicate location of the detected cluster. The pattern of initial results remained highly stable.
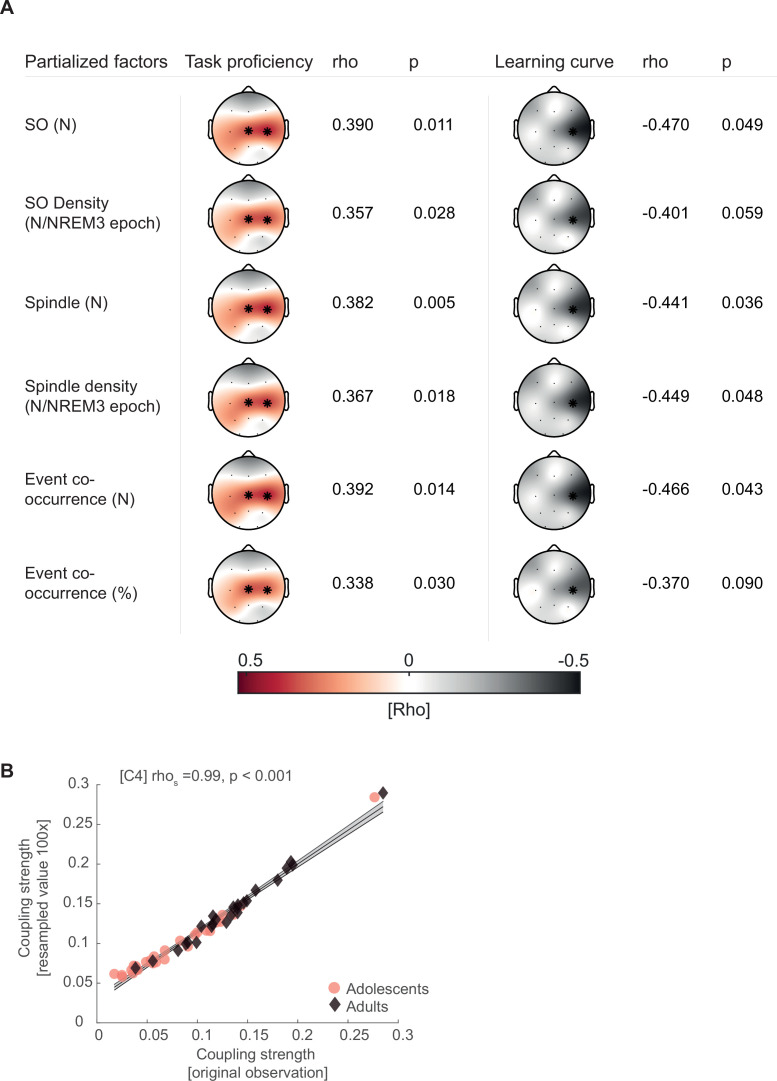
Figure 3—figure supplement 4. Partial correlations controlling for sleep oscillation event features.

Figure 3—figure supplement 4.

(A) Summary of cluster-corrected partial correlations of coupling strength with task proficiency (left) and learning curve (right) controlling slow oscillation (SO)/spindle descriptive measures at critical electrode C4. Asterisks indicate location of the detected cluster. The pattern of initial results remained highly stable. (B) Spearman correlation between resampled coupling strength (N = 200, 100 iterations) and original observation of coupling strength for adolescents (red circles) and adults (black diamonds), indicating that coupling strength is not influenced by spindle event number if at least 200 events are present. Gray-shaded area indicates 95% confidence intervals of the robust trend line.