Abstract
Objective:
Retinal vein cannulation is a technically demanding surgical procedure and its feasibility may rely on using advanced surgical robots equipped with force-sensing microneedles. Reliable detection of the moment of venous puncture is important, to either alert or prevent the clinician from double puncturing the vessel and damaging the retinal surface beneath. This paper reports the first in-vivo retinal vein cannulation trial on rabbit eyes, using sensorized metal needles, and investigates puncture detection.
Methods:
We utilized total of four indices including two previously demonstrated ones and two new indices, based on the velocity and force of the needle tip and the correlation between the needle-tissue and tool-sclera interaction forces. We also studied the effect of detection timespan on the performance of detecting actual punctures.
Results:
The new indices, when used in conjunction with the previous algorithm, improved the detection rate form 75% to 92%, but slightly increased the number of false detections from 37 to 43. Increasing the detection window improved the detection performance, at the cost of adding to the delay.
Conclusion:
The current algorithm can supplement the surgeons’ visual feedback and surgical judgment. To achieve automatic puncture detection, more measurements and further analysis are required. Subsequent in-vivo studies in other animals, such as pigs with their more human like eye anatomy, are required, before clinical trials.
Significance:
The study provides promising results and the criteria developed may serve as guidelines for further investigation into puncture detection in in-vivo retinal vein cannulation.
Keywords: Force sensing tool, Retinal vein cannulation, Robot-assisted surgery
I. INTRODUCTION
Retinal Vein Occlusion (RVO) is the second most common retinal vascular disorder, affecting about 16.4 million people worldwide in 2008 [1]. RVO happens when the central or branch retinal veins become occluded, causing blurred or distorted vision and, in severe cases, blindness [2]. The presently available treatments for RVO tend to limit the damage induced by occlusion, rather than resolving it [3], [4]. Retinal Vein Cannulation (RVC) procedures, on the other hand, aim to remove the clot by directly injecting a therapeutic agent into the occluded retinal vein [5].
RVC is a very challenging microsurgical task. Human physiological hand tremor is on the order of 180μm [6] while the diameter of the retinal target vessels is 50 to 150μm [7]. To counter the surgeon’s hand tremor, various tele-operated [8]–[11], cooperatively controlled [12], [13], and hand-held [14], [15] robotic systems for eye surgery have been proposed and developed. The first in-human intraocular robotic surgery, performed in 2018, demonstrated the feasibility of sub-retinal injection in three patients with subretinal haemorrhage [16].
A second challenge of RVC is that the interaction forces between the needle and the retinal vessels are below the human perception threshold [17], [18]. Therefore, to identify needle-tissue interaction, the surgeon must rely on visual feedback from the binocular operating microscope, with associated limits on micronscale depth perception [19]. To provide force feedback to the surgeon, sensorized tools with micro needles have been developed [20], [21], that utilize Fiber Bragg Gratings (FBG) sensors to measure the needle-tissue and tool-sclera interaction forces, with sensitivity that is on the milli-Newton (mN) scale.
A final challenge associated with RVC is that the surgeon must stop the needle in the lumen, immediately after the vein is punctured. This intraluminal position must then be maintained over the period of therapeutic agent infusion. To achieve this, the robot should detect the moment of puncture, and immediately switch to a position holding state. This function is very important to avoid double puncture of the vessel and entry into the retinal and sub-retinal tissues.
Early studies on rabbit ear veins [22] and chorioallantoic membrane (CAM) of fertilized chicken eggs [17] (an accepted in-vivo model for RVC studies [23]) show that the moment of puncture can be identified by a gradual rise in needle-tissue interaction forces (due to elastic deformation of the vessel), followed by a sharp drop. However, in both experiments, the needle was inserted at a constant speed, which is not typical of manual, handheld device or robotic system use in real world application. Gonenc et al. [24] showed that, during actual vein cannulation attempts, a similar force peak, as reported by [22] and [23], can be observed with slowing the tool’s velocity or retracting the needle just prior to puncture. To discriminate such false detection events, various solutions have been presented. Schoevaerdts et al. [25] proposed a proof of concept of a bio-impedance sensor for venous puncture detection. The sensorized tool detected the moment that the needle contacts blood. They attempted 35 venous punctures in ex-vivo pig eyes and achieved a success rate of 80%. Ourak et al. [26] recorded both force and position information of the needle tip in in-vivo porcine experiments, in order to acquire insight into the unique characteristics present at the instant of puncture. They devised a tool, incorporating FBG and Optical Coherence Tomography (OCT) A-scan fibers, and used it to measure the needle-tissue interaction forces, and the distance between the tool and the tissue, respectively.
In prior work in our group, Gonenc et al. [24] introduced another potentially useful criteria by considering the dot product of force variation and velocity of the needle. During a multi user dry phantom study, they verified that their approach is capable of detecting the moment of puncture in real-time and with minimal delay. However, a number of differences between eye phantoms and real eyes exist that may make this approach less effective in-vivo. For instance, in eye phantoms, there is no vascular and scleral motion, the veins are not as miniature as real retinal veins, and the attachment between the vein and retina cannot be replicated. Similarly, studies on chicken embryo or ex-vivo eyes cannot replicate the real eye. For the former, there is no support or fixation under the tissue and the visualization is open sky; and for the latter, there is no blood pressure in the vein and it collapses easily. Consequently, in-vivo studies are required, to better evaluate the approach proposed in [24] for the targeted clinical application.
The present paper advances the prior work and examines the validity of the criterion developed in Gonenc et al. [24] during in-vivo retinal vein cannulation in rabbit eyes. It also provides insight into the moment of puncture during in-vivo trials, by capturing the tool tip pose and velocity and the needle-tissue, tool-sclera and handle-surgeon interaction forces. To the best of our knowledge, this is the first paper that captures and analyzes the interaction forces at the needle tip, sclerotomy incision point, and surgeon’s hand, as well as their correlations, during in-vivo vein cannulation trials.
II. MATERIALS AND METHODS
According to Gonenc et al. [24], the moment of puncture can be characterized by a drop in the magnitude of needle-tissue interaction force, and a simultaneous change in sign of and sharp increase in the force-velocity index, i.e. the dot product of the derivative of the needle-tissue interaction force and tool tip velocity (V.dF/dt). Although this method was previously demonstrated in an eye phantom and chicken embryo model [24], based on our observations in in-vivo study, the model did not detect some of the successful punctures (missed 3 out of 12). It was also associated with cases of false puncture detection. To account for these misclassified cases, we introduced a new index, in addition to the previous indices, to better characterize the moment of puncture. We also examined the correlation between needle-tissue, tool-sclera, and handle-surgeon interaction forces, before and after the moment of puncture.
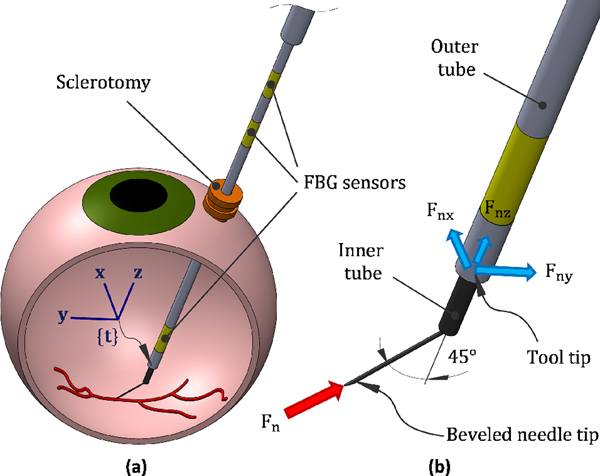
Fig. 1 shows the schematic of the force-sensing tool. It consists of an outer tube (or tool shaft), an inner tube and a microneedle, with outer diameters of 860 μm, 640 μm, and 70 μm, respectively. Three optical fibers, with diameter of 80 μm and at 120 degree spacing, are attached to the outer tube. Each fiber contains three FBG sensing areas, one close to the needle tip, measuring the needle-tissue interaction forces, and the other two at the proximal end of the tool, measuring the tool-sclera interaction forces. The inner tube delivers the injection fluid and is attached to the bent (45°) and beveled (15°) microneedle, by a medical grade adhesive.
Fig. 1.
(a) Schematics of retinal vein cannulation attempt using sensorized tool, and (b) different segments of the tool and the force measurement scenario
By using three FBG sensors, in each area, we can eliminate the effect of thermal drift and measure the lateral forces exerted on the tool shaft, i.e. forces in the x and y direction with respect to the tool tip frame (frame {t} in Fig. 1(a)).
A. Detection indices
1). Force index:
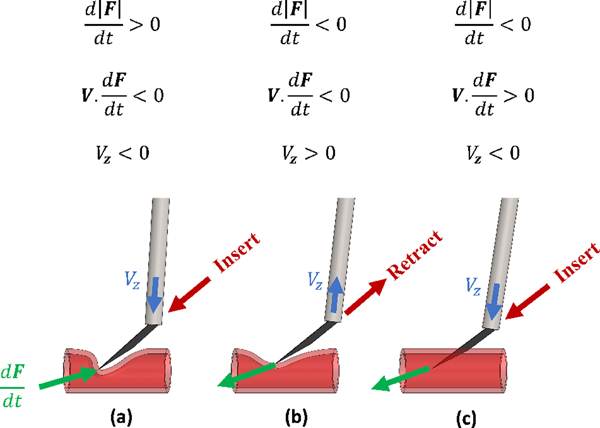
Based on previous studies, it is expected to see a rise in force before puncturing the vessel (Fig. 2(a)), due to elastic deformation, followed by a sharp drop in force (Fig. 2(c)), immediately after the puncture. So a clear sign of venous puncture is a peak in the needle-tissue interaction force. Considering only this pattern, though, results in a large number of false detections. For this purpose, it is also typical to consider a force threshold, bellow which the data would be discarded from further analysis.
Fig. 2.
The characteristic of the force and velocity, (a) before puncture, pushing the needle, (b) before puncture, retracting the needle and (c) at the moment of puncture
2). Force-velocity index:
Another occasion where a force peak is observed is when the surgeon pushes the needle onto the vein, and before puncture occurs, retract the needle (Fig. 2(b)). To distinguish between these cases, the force-velocity index was introduced in [24]. The force-velocity index is negative before the moment of puncture, independent of whether the needle is being inserted or retracted (Fig. 2(a) and (b)). But it changes sign sharply at the moment of puncture (Fig. 2(c)), because the needle continues to advance into the vein, while the force exerted on the needle tip decreases.
3). Velocity index:
By analyzing the force and position data during in-vivo retinal vein cannulation attempts on rabbit eyes, we observed the criteria defined in [24] in situations where there was no evidence of puncture in the recorded video or the surgeon’s comments. One such example of this situation is when the needle is engaged in tissue and the surgeon tries to withdraw it. Similar observation were reported by [17] and [26]. In order to more reliably identify the actual moment of puncture, we introduced a new index that considers the direction of the tool’s motion. The new index is the sign of the z component of the tool tip velocity in the tool tip frame {t} (Vz in Fig. 2), and determines whether the tool is moving towards the retina or away from it. Before, after, and at the moment of puncture, we expect the tool to be moving into the eye and towards the surgical target. So the value of Vz should be negative immediately before and after the puncture.
4). Correlation index:
We also looked at the correlation between the needle and sclera, sclera and handle, and needle and handle forces to see if we could observe a common behavior for these correlations at the moment of puncture. For this purpose, we checked the correlation value over different timespans, before and after vein puncture, in cases that achieved successful cannulation.
B. Detection algorithm
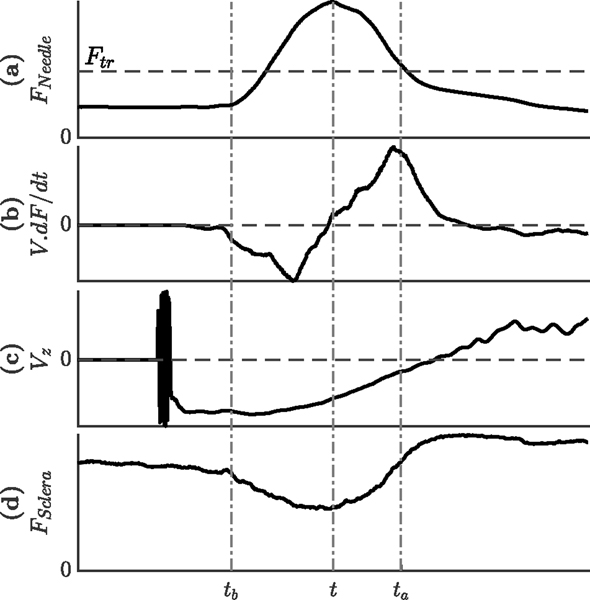
After defining the detection indices, we looked at the data in the whole period of vein cannulation attempt, and recorded all the occasions where an individual index or a combination of indices became valid. For each time step t, we studied the behavior of different indices in the time window of [t−tb, t+ta] as follows: (Fig 3)
Fig. 3.
Likely behavior of the different indices during a given time windows around the moment of puncture (a) needle tip force (b) dot product of velocity and derivative of force (c) velocity of the tool tip along the tool axis and (d) tool-sclera interaction force
Force index is valid if the needle-tissue interaction force at time t is larger than all the force values at timespan t : t + ta and also larger than the force threshold Fth (Fig 3).(a));
Force-velocity index is valid if the mean value for (V.dF/dt) is negative for the timespan t − tb : t and positive for the timespan t : t + ta (Fig 3).(b));
Velocity index is valid if Vz is always negative for the timespan t − tb : t + ta (Fig 3).(c));
Correlation index is valid if the absolute value of the correlation between needle-tissue and tool-sclera interaction forces is greater than cb for the timespan t − tb : t and greater than ca for the timespan t : t + ta (Fig 3).(a and d);
Based on the above procedure, if a data point shows all the indices, it is highly expected that the neighboring points would also. This will result in a high number of detections in the vicinity. Since we mostly care about the first sign of puncture, we grouped data points with detected indices in clusters that are 0.1 s apart, and reported the data point with the earliest occurrence in each cluster.
We considered the force index as the necessary condition for puncture and then counted the number of occasions where each of the other three indices became valid. The values for ca, cb, ta, and tb was optimized based on the following criteria:
Detect the true punctures: A primary consideration for the puncture detection algorithm is to ensure that it will detect, in real-time, the moment that the puncture occurs.
Reduce the number of false detections: When we use different indices, we increase the probability of detecting the actual puncture. This, however, comes at the cost of adding to the number of false detections.
III. EXPERIMENTAL SETUP
Ten rabbits of white New Zealand breed with weight 7 − 7.5 lb and the eye size around 16−17 mm were prepared for the in-vivo experiments, in a clinical operating room in Wilmer Eye Institute at the Johns Hopkins Hospital. We obtained the approval for the study from the Johns Hopkins Animal Care and Use Committee (Protocol Number: RB16M416, Date of approval: 01–18-2017). Fig. 4 shows the experimental setup, including the surgeon, the animal, the surgical microscope, the camera, the light pipe, the robot, and the force-sensing tool. The microscope (Lumera 700, Carl Zeiss Meditec Inc., Dublin, CA, USA) provided intraocular visualization for the surgeon. A Point Grey camera was attached to the microscope and recorded the surgical scene throughout the trials. These videos were later used as the ground truth to detect the moment of puncture, by looking for bleeding of the retinal vein.
Fig. 4.
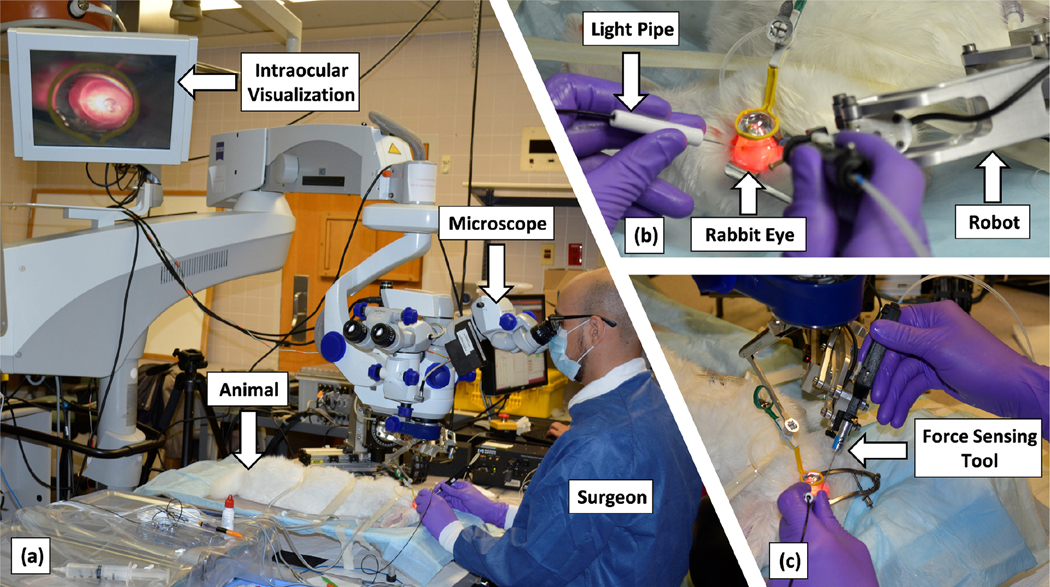
Experimental setup including the surgeon, the animal, the microscope, the camera, the light pipe, the robot, and the force-sensing tool
Animals were kept under anesthesia during the procedure and euthanized afterward. To prepare the eyes, first a mix of eye-drops were used to create iris mydriasis (Cyclopentolate 2% and phenylephryne 10%), and the animal was anesthesized by intramuscular injection of Xylazine and Ketamine. After placing and preparing the animal under the surgical microscope (Fig. 4(a)), three standard sclerotomies, one for the light-pipe, one for the force-sensing tool, and one for fluid infusion, were created. The lens and vitreous humor were removed, respectively, through phacofragmentation and vitrectomy procedures, by means of the vitrectomy machine (EVA, D.O.R.C. Dutch Ophthalmic Research Centre (International) B.V., the Netherlands). The lens removal helped enhancing the visualization of the retina and maneuverability of the tool inside the eye. After a final inspection of the retina, the surgeon started the RVC attempt by inserting the light pipe and the force-sensing tool into the intraocular space (Fig. 4(b) and (c)). When the tool reached close to the retina, and before contacting it, the force sensors were re-biased.
The force-sensing tool was attached to the end-effector of the robot and was used for cooperative RVC attempts. In the previous work [24], the tool was calibrated for lateral forces ranging up to 20 mN with accuracy of 0.31 mN in Fx and 0.24 mN in Fy. The robot provided stabilization, tremor canceling, and some measurements. The tool tip position and velocity were recorded using the software program developed to control the robot. Also, the interaction forces between the tool’s handle and the surgeon were measured by means of the 6 axis force/torque sensor (ATI Nano 17, ATI Industrial Automation, NC), installed between the robot’s arm and the tool holder. An FBG interrogator (SI 115, Micron Optics Inc., GA USA) was utilized to collect the signals of FBG sensors, which was then translated into the needle-tissue and tool-sclera interaction forces. The force and position data were measured and logged in real-time, at 200 Hz. To remove noise from force data, we used moving average filter for the length of 10 samples (0.05 s). We also smoothed the derivation of velocity and filtered force data with the same filter. The two level filtering on the force measurement is expected to cause a delay around 0.1 s.
Fig. 5 shows screenshots of a successful cannulation attempt. The surgeon is using the visual feedback, from microscope, to manipulate the needle into the retinal vein. A cannulation attempt was considered successful if a hemorrhage was observed by the surgeon and in the recorded videos, as shown in Fig. 5(c).
Fig. 5.
Recorded view from the microscope (a) showing the surgical scene, (b) at the moment of puncture (vein is mildly dilated), and (c) after the puncture (blood is observed)
IV. RESULTS AND DISCUSSION
A. Overall force characteristics
Table I provides an overview for the force characteristic of all cannulation attempts. From 32 RVC attempts on 10 rabbits, 16 trials were performed using hollow 110 μm metal needle (with inner diameter of approximately 60 μm), 16 using hollow 70 μm metal needle (with inner diameter of approximately 30 μm), 20 on the left eye, and 12 on the right eye. We observed that the average and maximum of needle-tissue, tool-sclera, and handle-surgeon interaction forces were variable from one rabbit to another. The large variation in the interaction forces can be attributed to the different tissue properties of the individual rabbits, the size and sharpness of the needle, the eye position (left or right eye), the approach angle, i.e., the angle between the needle and the vein, the location where the needle contacts the vein, the insertion speed, and the needle deflection.
TABLE I.
MEAN AND MAX FOR HANDLE, NEEDLE AND SCLERA FORCES FOR LEFT VS RIGHT EYE AND 70 μm VS 110 μm NEEDLE SIZE
| Rabbit # | Needle size | # of Trials | Mean (Max) of interaction forces at | # of Success | Needle force at puncture (mN) | ||||
|---|---|---|---|---|---|---|---|---|---|
|
| |||||||||
| Left eye | Right eye | Needle (mN) | Sclera (mN) | Handle (N) | Left eye | Right eye | |||
| 1 | 110 μm | 1 | 0 | 12.5 (42.9) | 32.1 (87.8) | 1.13 (6.91) | - | - | - |
| 2 | 1 | 1 | 12.3 (75.1) | 96.5 (362) | 0.657 (6.42) | - | 1 | (7.66) | |
| 3 | 2 | 1 | 14.2 (70.3) | 201 (386) | 0.931 (6.79) | - | - | - | |
|
| |||||||||
| 4 | 70 μm | 0 | 3 | 7.06 (40.9) | 36.1 (93.3) | 0.327 (1.43) | - | 1 | (19.4) |
| 5 | 1 | 0 | 8.39 (43.0) | 63.1 (261) | 0.901 (6.21) | - | - | - | |
| 6 | 0 | 5 | 4.77 (47.3) | 71.1 (156) | 0.713 (3.01) | - | 3 | (7.78), (28.7), (33.5) | |
| 7 | 7 | 0 | 2.43 (13.48) | 49.5 (217) | 0.737 (2.76) | 2 | - | (9.80), (14.5) | |
|
| |||||||||
| 8 | 110 μm | 0 | 1 | 5.72 (14.2) | 34.2 (173) | 0.676 (2.43) | - | - | - |
| 9 | 4 | 1 | 9.44 (58.7) | 40.0 (235) | 0.436 (5.43) | 2 | - | (13.7), (14.5) | |
| 10 | 4 | 0 | 9.49 (40.9) | 34.2 (222) | 0.346 (1.89) | 3 | - | (21.9), (30.4), (38.3) | |
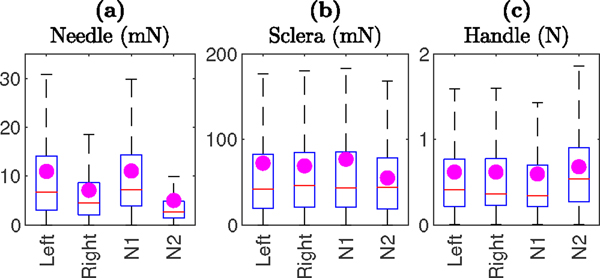
Fig. 6 compares the needle-tissue, tool-sclera, and handle-surgeon interaction forces, based on the eye (left vs right) and the needle size. The magenta dots represent the mean of the interaction forces. Based on the t-test statistical analysis, results show statistically significant (p-value less than 0.001) lower needle-tissue interaction forces for the right eye (mean 7.10 mN) compared with the left eye (mean 10.96 mN). This observation can be attributed to the different position of the sclerotomy, and perhaps different ergonomics required for cooperative manipulation, between left and right eye. Similarly, lower needle-tissue interaction forces for the 70 μm needle (mean 5.01 mN) as compared to the 110 μm needle (mean 11.04 mN) was observed and was statistically significant. This is expected as the thinner needle requires less pressure to puncture the vein. For tool-sclera and handle-surgeon interaction forces, there were no significant differences measured between left and right eyes and similarly there were no significant differences measured between the 70 μm and 110 μm needles.
Fig. 6.
Comparison of (a) needle-tissue, (b) tool-sclera, and (c) handle-surgeon interaction forces in left and right eye and for 110 μm (N1) and 70 μm (N2) needles.
B. Puncture detection indices
Based on the live feedback from the surgeon and the recorded videos, a total of 12 successful cannulations out of 32 cannulation attempts were achieved, 6 with 110 μm needle, 6 with 70 μm needle, 7 on the left eye, and 5 on the right eye.
The last columns of Table I show the corresponding rabbit number, eye, and needle-tissue interaction forces at the moment of puncture, for each successful cannulation. Again, we observed that needle-tissue interaction forces, at the moment of puncture, vary from rabbit-to-rabbit and vary during different trials on the same rabbit, and in same eye. As concluded in [24], it is not practical to rely only on force data for puncture detection. Table I also shows a learning curve: The number of cannulation attempts and the percentile of successful cannulations increases in the late rabbit trials. For instance, for rabbit number 10, 3 out of 4 trails led to successful cannulation. Three out of 12 successful cannulations did not show the expected behavior for force-velocity index (sign change and sharp increase) in the data. Therefore, we now understand that by relying only on the previously reported puncture detection algorithm in [24], we will miss 25% of the true punctures.
1). Velocity index:
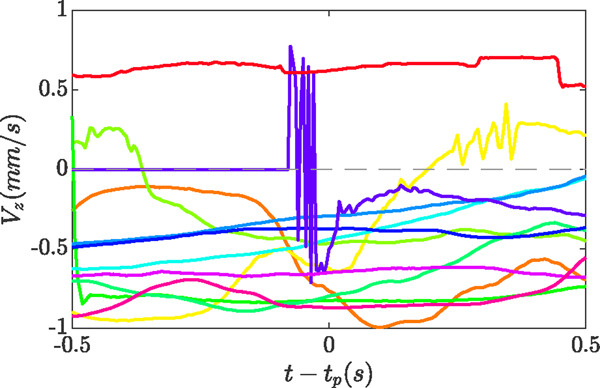
The velocity index demonstrated slightly better performance, as compared to the force-velocity index, when used to detect true punctures in-vivo. Fig. 7 shows the value for the velocity index (Vz in Fig. 2), 0.5 s before and after the puncture event, for all 12 trials that achieved successful cannulation. ten cases showed a negative value, confirming insertion of the tool into the eye, immediately before and after the puncture.
Fig. 7.
The velocity index (Vz) 0.5 s before and after the puncture, for all 12 successful cannulations
2). Correlation index:
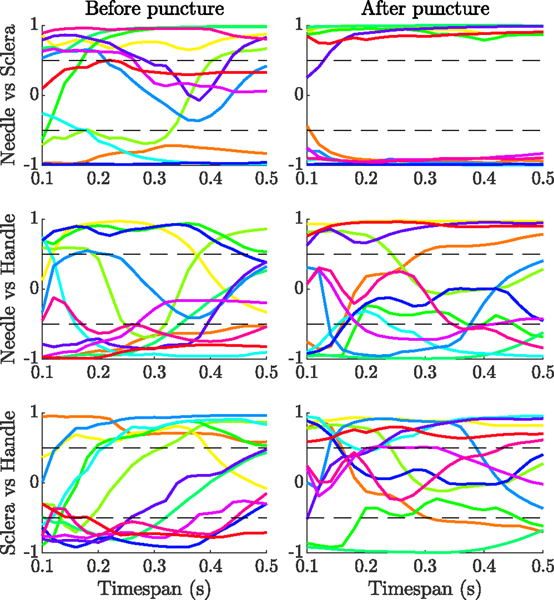
We also studied the correlation between the needle-tissue, tool-sclera, and handle-surgeon interaction forces, for the 12 trials with successful cannulation before and after puncture. Fig. 8 shows the correlation between each pair for different timespans, ranging from 0.1 s to 0.5 s, before and after the moment of puncture. We observed no trend in the correlations between needle-tissue and handle-surgeon forces, or tool-sclera and handle-surgeon forces. The correlation between the needle-tissue and tool-sclera forces, however, showed a clear trend, particularly for timespans after the puncture.
Fig. 8.
Correlation between needle-tissue and tool-sclera (top row), needle-tissue and handle-surgeon (middle row), and tool-sclera and handle-surgeon (bottom row) interaction forces, for different timespans before and after the puncture
For timespans between 0.1 s and 0.2 s before the puncture, 4 cases showed negative correlation (−0.73 ± 0.14 at 0.2 s), and 8 cases showed positive correlation (0.84±0.17 at 0.2 s). For timespans between 0.1 s and 0.5 s after the puncture, 6 cases showed negative correlation (−0.93 ± 0.03 at 0.15 s), and 6 cases showed positive correlation (0.92±0.07 at 0.15 s). We considered a correlation significant if its absolute value was higher than 0.5. So it can be seen that the measured correlation remains above the threshold for almost 2σ (95%) confidence interval before the puncture, and 3σ (99.7%) confidence interval after the puncture. The result shows that the correlation between tool-sclera and needle-tissue interaction forces can also be used as an indicator for detecting the moment of puncture. Based on the results, we defined the correlation index as follows: It is valid if the absolute value of the correlation between the needle-tissue and tool-sclera forces, at 0.2 s timespan before and 0.15 s after puncture, is bigger than 0.6 and 0.8, respectively.
At present these thresholds are based on a small data set. We had 12 successful cannulations that are considered here. More experiments are needed, to better understand the behavior of correlation between interaction forces, such as the origin of positive vs negative, to verify the consistency of the defined thresholds in various situations and to build robustness into the model. A negative aspect of using the correlation after the puncture is that it introduces delay into the puncture detection algorithm. However, it should be noted that the force-velocity index also causes delay, since it uses the derivatives of force and position, both requiring averaging to remove the noise.
C. Moment of puncture
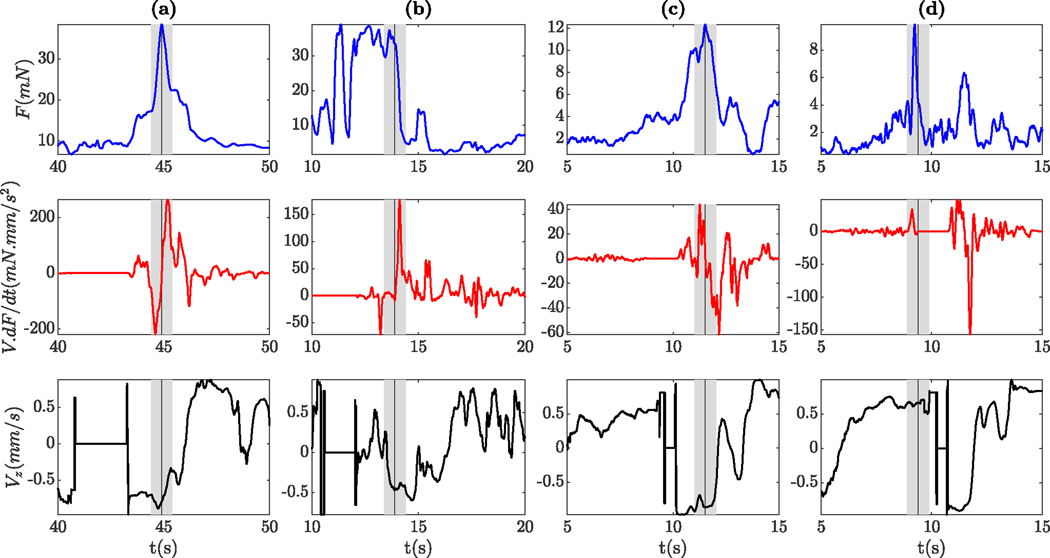
Fig. 9 shows the needle tip force (top row), force-velocity index (middle row), and velocity index (bottom row) before and after the puncture for some of the successful trials. The grey patch shows 0.5 s before and after puncture, and the vertical grey line indicates the moment of puncture. Four out of 12 cases with successful cannulation (1 for rabbit number 9 and 3 for rabbit number 10, also indicating the learning curve) showed a very clear venous puncture in the data. One of the cases is illustrated in Fig. 9(a). At first (between 40 s and 43 s), the needle is immobile and both force-velocity and velocity indices are zero, indicating that the surgeon is preparing to perform the cannulation. Then the needle tip force increases until the moment of puncture (near 45 s), and sharply drops afterward. Also, force-velocity, velocity, and correlation indices show the expected behavior: The force-velocity index sharply increased from negative to positive, the velocity index remained negative immediately before and after the puncture, and the correlation was larger than the defined threshold.
Fig. 9.
Needle tip force (top row), force-velocity index (middle row), and velocity index (bottom row) 5 seconds before and after the moment of puncture for four successful trials
In four other cases, the indices also showed the expected behavior, but the peak in force was less clear. For instance, as depicted in Fig. 9(b), the force is oscillating at peak for a few seconds, then starts to drop and then puncture occurs. Around 14 s, the force-velocity index sharply drops from zero and the velocity index becomes positive, indicating a small retraction of the tip. Based on the surgeon’s feedback, this behavior is mostly related to correcting the approach angle of the needle by withdrawal, redirecting and then performing the cannulation. Another scenario that may lead to a peak prior to actual puncture is that, following first contact with the vessel, the needle may slide along the vein prior to penetration. Either way, we observed that the behavior of the needle tip force in in-vivo experiments is much more complicated than in dry phantom or ex-vivo models.
In the remaining 4 cases, 3 didn’t show the force-velocity index, 2 didn’t show the velocity index, and 1 didn’t show the correlation index. Both cases illustrated in Fig. 9(c) and Fig. 9(d) depict a clear peak in force, at the moment of puncture. However, in the former, the force-velocity index, and in the latter, both force-velocity and velocity indices failed to detect the puncture.
D. Detection performance
In section IV-B the performance of each individual index was studied, for the timespan of 0.2 s before and 0.15 s after the puncture, which was derived from the correlation study. In this section, we expanded on that by studying the effect of timespan parameters ta and tb on the performance of different indices in detection of true puncture as well as reducing the number of false detections. We also investigated different combinations of the indices in both detecting the true and rejecting the false punctures. Finally, we studied the distribution of false detections throughout the trials.
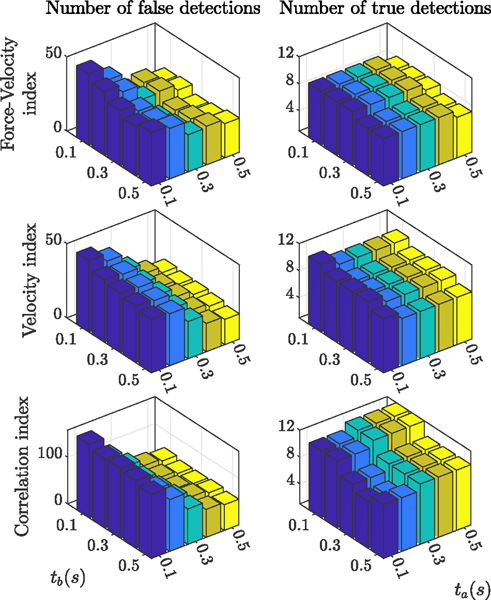
Fig. 11 shows the effect of the timespan on performance of different indices. The graphs on the left show the number of false detections for the 12 trials with successful cannulation and the graphs on the right depict the number of true detentions out of 12 true punctures. Each bar in each graph corresponds to specific ta and tb values in the range of 0.1 s to 0.5 s, with steps of 0.1s. Results indicate that increasing tb and ta reduces the number of false detections, with ta having better performance. In terms of detecting true punctures, tb negatively affects the performance of the indices. ta shows slightly negative effects for the force-velocity and velocity indices, but positively affect the performance of the correlation index.
Fig. 11.
Effect of timespan on the performance of different indices in reducing the number of false detections (graphs on the left) and detecting the true punctures (graphs on the right)
From Fig. 11, by changing the timespan, the force-velocity index still fails to capture 3 out of 12 true punctures. Although we cannot give any clear explanation why the force-velocity index fails in these cases, there are some similarities between them. One common trend is that all three cases belong to the trials with the thin (70 μm) microneedle (both trials from rabbit number 7 and one of the three trials from rabbit number 6, see Table I). In another word, all 6 successful trials using thick 110 μm needle show the force-velocity index, but only 3 out of 6 successful trials using thin 70 μm needle do. Smaller needle diameter might be resulting in smaller needle forces, making it difficult to observe a sharp change at the moment of puncture. Also, using a new sharp 70 μm needle might be contributing: Blunt needles will generate more force and a clear signature while sharp needles will only slightly change the force. Also, from kinematics point of view, when computing the dot product of force variation and velocity, we are assuming that the tool is rigid. However, since the tool is very thin and flexible, it easily deflects due to the sclera force, which causes uncertainties in the calculation of the force-velocity index. The collected force data for these three cases shows a large difference between the sclera force and needle force at the moment of puncture, which supports this speculation. Two of these cases are demonstrated in Fig. 10(c) and (d), in which sclera force is approximately ten times the needle force for one case and six times for the other.
Fig. 10.
Needle tip (blue solid line) vs Sclera force (magenta dashed line) one second before and after the moment of puncture for similar trials as Fig. 9
Although larger ta value shows an overall positive effect on the performance of puncture detection, it induces more delay to the algorithm and renders it ineffective in real-time. The maximum allowable delay for the puncture detection algorithm depends on the speed of the needle insertion, thickness of the vessel, elastic deformation of the vessel before getting punctured, and angle of approach. The insertion speed around the moment of puncture for the 12 successful cases is 2.35 ± 1.54 mm/s. Considering a typical retinal vein with a diameter of 150 μm, if the angle between the needle and the vein is 30 deg (which is a typical approach angle for vein cannulation), the needle can travel 300 μm inside the vein before engaging the other side and causing double puncture. So, the maximum allowable delay would be 0.15 s, if we want to ensure that the detection algorithm is fast enough in informing the clinician or stopping the robot. It should also be noted that the vein will deform a little before getting punctured, which makes the actual allowable delay even less that 0.15 s.
Also, since tb negatively affects the true detection performance, we chose tb = 0.2 s and ta = 0.1 s as the best timespan for the current study. In future studies, we might be able to increase the value for ta, if we reduce the insertion speed near the vein. The slower needle movement will allow for more detection and decision time. This is achievable by having the robot cooperatively guide the needle toward the vein, i.e. the surgeon still maintains control over inserting or withdrawing the needle, but the robot can control the speed of insertion or withdrawal by means of a virtual wall. By reducing the speed, we might be able to tolerate more detection delay and so increase ta, which would positively affect the detection performance
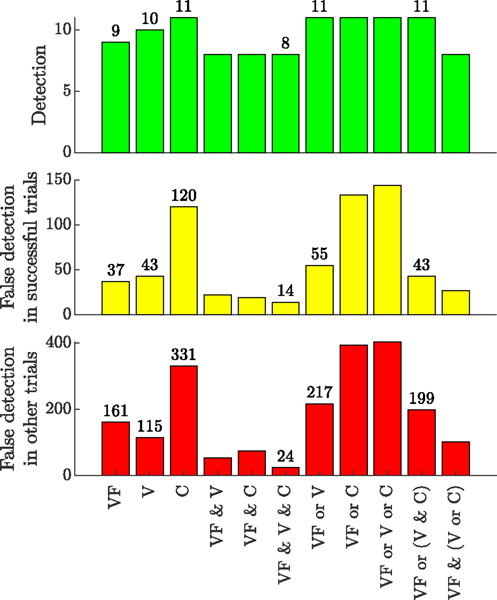
Fig. 12 summarizes the efficiency of different indices and their various combinations in accurate puncture detection and avoiding false detections. VF, V, and C stand for force-velocity, velocity, and correlation indices, respectively. The top plot shows the number of successful detections out of 12 trials with observed hemorrhage. The middle plot depicts the number of false detections, in the 12 trials with successful cannulation, before the actual puncture. Finally, the bottom plot shows the number of false detection for the rest of the trials (20 remaining trials) throughout the duration of the trial.
Fig. 12.
Statistics for the number of true and false detection, based on each index and the combination of different indices
Individual use of force-velocity index, velocity index, or correlation index yields 9, 10, or 11 out of 12 correct detection events, but results in a large number of false detections. The number of false detections is specifically higher for the correlation index, which is expected since this is still an immature index with no physical explanation yet. Using “VF & V & C” criterion detects 8 out of 12 punctures, which is only 1 case less than when using VF alone, but on the other hand, it greatly reduces the number of false detections. The best combination of indices for this study is “VF or (V & C)”, which, when compared with using the force-velocity index alone, increases the success rate in true detection from 75% (9/12) to 92% (11/12), while only slightly adding to the number of false detections (from 37 to 43).
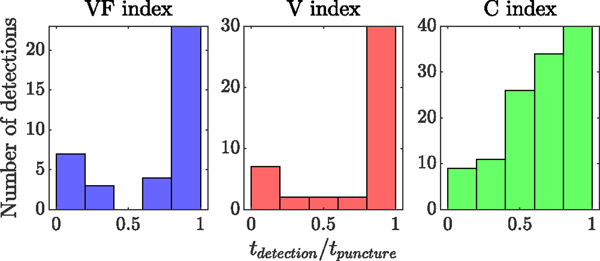
Finally, Fig. 13 shows the distribution of falsely detected punctures throughout the duration of the 12 trials with successful cannulation. The horizontal axis shows the ratio between the time of detection and the time of actual puncture. It is evident that the majority of false detections are close to the actual puncture (except for the correlation index), where the surgeon was trying to attempt puncture, relocate the needle, change the approach angle, and attempt again.
Fig. 13.
Distribution of the false detection throughout the 12 trials with successful cannulations and before the actual puncture
E. Future direction
There is a trade-off between increasing the number of correct and reducing the number of false detections. But it is safe to say that adding the new indices significantly improves the performance of the puncture detection algorithm. More data on in-vivo successful cannulation and more information from the experiments is required to provide a better comparison between the performance of these indices and to identify further indices. Additional work on the algorithm to reduce the number of false detections is warranted. For instance, to better capture the relative position of the needle tip with respect to the target vein, OCT can be integrated into the force-sensing instrument, as in [26]. The problem with OCT is that it is not yet fast enough for real-time puncture detection, but the OCT feedback can be used in conjunction with force and velocity data. Moreover, to capture the tool’s deflection and to better estimate the position of the needle tip, more research on needle shape sensing may be beneficial.
The criteria defined here can be helpful for the clinicians to combine it with their judgment as well as their visual feedback while interacting with the tissue/vein. However, to achieve automatic puncture detection and in turn to implement it into the robot’s control software, we require a safer algorithm, able to reliably detect true puncture events and avoid false detection events. To better analyze the effectiveness of the various potentially relevant criteria, more measurements, analysis and further investigation on the constellation of characteristics occurring at the moment of puncture is required. For instance, by incorporating OCT measurements and/or needle shape sensing methods, we can achieve a much better estimation of the needle tip position and velocity.
Another future direction of this work is to investigate the double puncture as well. In this study, we mainly focused on the common behaviors at the moment of puncture, to better detect the puncture in-vivo. In prior work, we showed [24] that by implementing a virtual wall right after the puncture is detected, the surgeon’s hand motions decrease, which helps reduce the risk of a double puncture. However, to validate the results, it would be beneficial to explore the possibility of detecting the second puncture in future work. Using OCT feedback will help better identify the puncture and keep the needle inside the vein. It would also help us better understand the characteristics of the double puncture. The current model, which is based on velocity and force feedback, has a faster response than OCT or any other imaging modality, but additional data from OCT would help construct a more accurate and reliable model of the puncture.
V. CONCLUSION
In this paper, we investigated the force and velocity behavior during in-vivo retinal vein cannulation (RVC) attempts on rabbit eyes. This is, to the best of our knowledge, the first in-vivo study on RVC, using sensorized metal needles. It was observed that the previously developed puncture detection algorithm [24] is not as reliable in-vivo as it was in the phantom studies. So, by closely looking at the common trends in the data at the moment of venous puncture, we introduced velocity and correlation indices, in addition to the previously defined force-velocity index. The combination of the indices improved the true detection rate (from 75% to 92%), with only small increase in the false detection rates (from 37 to 43). In terms of reliability, increasing the success rate is much more important than reducing the number of false detections. However, the latter should be kept minimal, as it may hinder the clinician’s performance. Increasing the detection window will improve overall detection performance even more. This is achievable by having the robot help the clinician reduce the insertion speed when trying to cannulate the vein.
The novel criteria introduced and evaluated in this work may significantly enhance a surgeon’s ability to determine the moment of venous puncture during retina microsurgery. These criteria are intended to supplement the surgeons’ visual feedback as provided by the operating microscope, as well as their own surgical judgment. We believe that the analytical workflow presented in this work can be used as a baseline in future studies and can result in an even more reliable puncture detection algorithm, when more data are available. The resulting algorithms should be subsequently verified in other animals, such as pigs with their more human like eye anatomy. Clinical trials would follow.
Acknowledgments
* This work was supported by U.S. National Institutes of Health under grant numbers 1R01 EB023943, 1R01 EB025883, and 2R01 EB000526. The work of M. Urias was also supported by Instituto da Visao (IPEPO)˜ and Lemann Foundation. The work of PLG was supported in part by Research to Prevent Blindness, New York, USA, and gifts by the J. Willard and Alice S. Marriott Foundation, the Gale Trust, Mr. Herb Ehlers, Mr. Bill Wilbur, Mr. and Mrs. Rajandre Shaw, Ms. Helen Nassif, Ms Mary Ellen Keck, and Mr. Ronald Stiff.
Contributor Information
Alireza Alamdar, Laboratory for Computational Sensing and Robotics, Johns Hopkins University, 3400 N. Charles Street, Baltimore, MD USA-21218.
Niravkumar Patel, Laboratory for Computational Sensing and Robotics, Johns Hopkins University, 3400 N. Charles Street, Baltimore, MD USA-21218.
Muller Urias, Wilmer Eye Institute, Johns Hopkins Hospital, Baltimore, MD 21287 USA..
Ali Ebrahimi, Laboratory for Computational Sensing and Robotics, Johns Hopkins University, 3400 N. Charles Street, Baltimore, MD USA-21218.
Peter Gehlbach, Wilmer Eye Institute, Johns Hopkins Hospital, Baltimore, MD 21287 USA..
Iulian Iordachita, Laboratory for Computational Sensing and Robotics, Johns Hopkins University, 3400 N. Charles Street, Baltimore, MD USA-21218.
REFERENCES
- [1].Klein R, et al. , “The 15-year cumulative incidence of retinal vein occlusion: the beaver dam eye study,” Archives of ophthalmology, vol. 126, no. 4, pp. 513–518, 2008. [DOI] [PubMed] [Google Scholar]
- [2].Rehak J. and Rehak M, “Branch retinal vein occlusion: pathogenesis, visual prognosis, and treatment modalities,” Current eye research, vol. 33, no. 2, pp. 111–131, 2008. [DOI] [PMC free article] [PubMed] [Google Scholar]
- [3].Glacet-Bernard A, et al. , “Hemodilution therapy using automated erythrocytapheresis in central retinal vein occlusion: results of a multicenter randomized controlled study,” Graefe’s Archive for Clinical and Experimental Ophthalmology, vol. 249, no. 4, pp. 505–512, 2011. [DOI] [PubMed] [Google Scholar]
- [4].Inagaki K, et al. , “Subthreshold micropulse photocoagulation for persistent macular edema secondary to branch retinal vein occlusion including best-corrected visual acuity greater than 20/40,” Journal of Ophthalmology, vol. 2014, 2014. [DOI] [PMC free article] [PubMed] [Google Scholar]
- [5].Weiss JN, “Retinal surgery for treatment of central retinal vein occlusion,” Ophthalmic Surgery, Lasers and Imaging Retina, vol. 31, no. 2, pp. 162–165, 2000. [PubMed] [Google Scholar]
- [6].Riviere CN and Jensen PS, “A study of instrument motion in retinal microsurgery,” in Proceedings of the 22nd Annual International Conference of the IEEE Engineering in Medicine and Biology Society (Cat. No. 00CH37143), vol. 1. IEEE, 2000, pp. 59–60. [Google Scholar]
- [7].Skovborg F, et al. , “Diameters of the retinal vessels in diabetic and normal subjects,” Diabetes, vol. 18, no. 5, pp. 292–298, 1969. [DOI] [PubMed] [Google Scholar]
- [8].Meenink T, et al. , “Robot assistance for micrometer precision in vitreoretinal surgery,” Investigative ophthalmology & visual science, vol. 54, no. 15, pp. 5808–5808, 2013. [Google Scholar]
- [9].de Smet MD, et al. , “Robotic assisted cannulation of occluded retinal veins,” PloS one, vol. 11, no. 9, p. e0162037, 2016. [DOI] [PMC free article] [PubMed] [Google Scholar]
- [10].Zhou M, et al. , “Towards robotic eye surgery: Marker-free, online hand-eye calibration using optical coherence tomography images,” IEEE Robotics and Automation Letters, vol. 3, no. 4, pp. 3944–3951, 2018. [Google Scholar]
- [11].Charreyron SL, et al. , “A magnetically navigated microcannula for subretinal injections,” IEEE Transactions on Biomedical Engineering, vol. 68, no. 1, pp. 119–129, 2020. [DOI] [PubMed] [Google Scholar]
- [12].Fleming I, et al. , “Cooperative robot assistant for retinal microsurgery,” in International conference on medical image computing and computer-assisted intervention. Springer, 2008, pp. 543–550. [DOI] [PubMed] [Google Scholar]
- [13].Willekens K, et al. , “Robot-assisted retinal vein cannulation in an in vivo porcine retinal vein occlusion model,” Acta ophthalmologica, vol. 95, no. 3, pp. 270–275, 2017. [DOI] [PubMed] [Google Scholar]
- [14].Song C, Gehlbach PL, and Kang JU, “Active tremor cancellation by a “smart” handheld vitreoretinal microsurgical tool using swept source optical coherence tomography,” Optics express, vol. 20, no. 21, pp. 23414–23421, 2012. [DOI] [PMC free article] [PubMed] [Google Scholar]
- [15].Yang S, MacLachlan RA, and Riviere CN, “Manipulator design and operation of a six-degree-of-freedom handheld tremor-canceling microsurgical instrument,” IEEE/ASME transactions on mechatronics, vol. 20, no. 2, pp. 761–772, 2014. [DOI] [PMC free article] [PubMed] [Google Scholar]
- [16].Edwards T, et al. , “First-in-human study of the safety and viability of intraocular robotic surgery,” Nature biomedical engineering, vol. 2, no. 9, pp. 649–656, 2018. [DOI] [PMC free article] [PubMed] [Google Scholar]
- [17].Ergeneman O, et al. , “Characterization of puncture forces for retinal vein cannulation,” Journal of Medical Devices, vol. 5, no. 4, 2011. [Google Scholar]
- [18].Gonenc B, et al. , “3-dof force-sensing motorized micro-forceps for robot-assisted vitreoretinal surgery,” IEEE sensors journal, vol. 17, no. 11, pp. 3526–3541, 2017. [DOI] [PMC free article] [PubMed] [Google Scholar]
- [19].Ehlers JP, et al. , “Integrative advances for oct-guided ophthalmic surgery and intraoperative oct: microscope integration, surgical instrumentation, and heads-up display surgeon feedback,” PloS one, vol. 9, no. 8, p. e105224, 2014. [DOI] [PMC free article] [PubMed] [Google Scholar]
- [20].Gonenc B, et al. , “Force-sensing microneedle for assisted retinal vein cannulation,” in SENSORS, 2014 IEEE. IEEE, 2014, pp. 698–701. [DOI] [PMC free article] [PubMed] [Google Scholar]
- [21].Gijbels A, et al. , “Development and experimental validation of a force sensing needle for robotically assisted retinal vein cannulations,” in 2015 IEEE International Conference on Robotics and Automation (ICRA). IEEE, 2015, pp. 2270–2276. [Google Scholar]
- [22].Saito H. and Togawa T, “Detection of needle puncture to blood vessel using puncture force measurement,” Medical and Biological Engineering and Computing, vol. 43, no. 2, pp. 240–244, 2005. [DOI] [PubMed] [Google Scholar]
- [23].Leng T, et al. , “The chick chorioallantoic membrane as a model tissue for surgical retinal research and simulation,” Retina, vol. 24, no. 3, pp. 427–434, 2004. [DOI] [PubMed] [Google Scholar]
- [24].Gonenc B, et al. , “Towards robot-assisted retinal vein cannulation: A motorized force-sensing microneedle integrated with a handheld micromanipulator,” Sensors, vol. 17, no. 10, p. 2195, 2017. [DOI] [PMC free article] [PubMed] [Google Scholar]
- [25].Schoevaerdts L, et al. , “Design and evaluation of a new bioelectrical impedance sensor for micro-surgery: application to retinal vein cannulation,” International journal of computer assisted radiology and surgery, vol. 14, no. 2, pp. 311–320, 2019. [DOI] [PubMed] [Google Scholar]
- [26].Ourak M, et al. , “Combined oct distance and fbg force sensing cannulation needle for retinal vein cannulation: in vivo animal validation,” International journal of computer assisted radiology and surgery, vol. 14, no. 2, pp. 301–309, 2019. [DOI] [PubMed] [Google Scholar]


