

Abstract
Dietary nitrate (NO3−) ingestion can be beneficial for health and exercise performance. Recently, based on animal and limited human studies, a skeletal muscle NO3− reservoir has been suggested to be important in whole body nitric oxide (NO) homeostasis. The purpose of this study was to determine the time course of changes in human skeletal muscle NO3− concentration ([NO3− ) following the ingestion of dietary NO3−. Sixteen participants were allocated to either an experimental group (NIT: n = 11) which consumed a bolus of ~1300 mg (12.8 mmol) potassium nitrate (KNO3), or a placebo group (PLA: n = 5) which consumed a bolus of potassium chloride (KCl). Biological samples (muscle (vastus lateralis), blood, saliva and urine) were collected shortly before NIT or PLA ingestion and at intervals over the course of the subsequent 24 h. At baseline, no differences were observed for muscle [NO3−] and [NO2−] between NIT and PLA (P > 0.05). In PLA, there were no changes in muscle [NO3−] or [NO2−] over time. In NIT, muscle [NO3−] was significantly elevated above baseline (54 ± 29 nmol/g) at 0.5 h, reached a peak at 3 h (181 ± 128 nmol/g), and was not different to baseline from 9 h onwards (P > 0.05). Muscle [NO2−] did not change significantly over time. Following ingestion of a bolus of dietary NO3− skeletal muscle [NO3−] increases rapidly, reaches a peak at ~3 h and subsequently declines towards baseline values. Following dietary NO3− ingestion, human m. vastus lateralis [NO3−] expressed a slightly delayed pharmacokinetic profile compared to plasma [NO3−].
Keywords: Nitrate, Nitrite, Nitric oxide, Skeletal muscle
1. Introduction
Pharmacokinetics studies are important for determining the fate of administered substances or drugs, and can be broken down into several factors: absorption, distribution, metabolism and excretion [1]. In human physiology, knowledge of the time course of the uptake of an ingested substance into a target tissue, such as blood or muscle, is imperative in optimising the therapeutic or ergogenic effect of that substance, while also minimising the occurrence of potential adverse events.
Nitrate (NO3−) and nitrite (NO2−) are metabolites related to the production of the signalling molecule, nitric oxide (NO), which is essential in the maintenance of normal physiological function, including the regulation of blood pressure [2,3]. The ingestion of inorganic NO3− in NO3− -rich food and drink sources augments NO bioavailability and may have important physiological effects [4,5]. Several studies have described dynamic changes in [NO3−] and [NO2−] in biological tissues such as saliva [6–8], plasma [9,10 for review see Ref. [11], and urine [12–14] following dietary NO3− ingestion or supplementation.
Piknova et al. [15,16] reported that gluteus maximus muscle [NO3−] was higher than that of blood and other organs in rodents. The existence of higher [NO3−] in vastus lateralis muscle, compared to plasma, and its elevation following dietary NO3− ingestion, has recently been confirmed in humans [17,18]. It is possible that this relatively high muscle [NO3−] has functional significance [19]. Skeletal muscle possesses the enzymatic machinery required for the reduction of NO3− and NO2− to NO (i. e., xanthine oxidoreductase, aldehyde oxidase, sulphite oxidase [16]); and it is possible that skeletal muscle serves as a NO3− ‘reservoir’ that might be drawn upon when access to dietary NO3− is restricted [5,15]. However, the time course over which muscle [NO3−] changes following acute dietary NO3− ingestion, and how this relates temporally and quantitatively to changes in [NO3−] in other biological compartments (saliva, blood and urine), has yet to be fully investigated.
The purpose of the present study was therefore to describe, for the first time, the pharmacokinetic profile of human skeletal muscle [NO3−] and [NO2−] over 24 h following bolus dietary NO3− ingestion. We hypothesised that skeletal muscle [NO3−] and [NO2−] would follow a similar profile to that described previously for plasma [9,10], with a peak value reached 1–3 h post NO3− ingestion and a subsequent fall back to the pre-ingestion baseline by 24 h.
2. Methods
The local Research Ethics Committee (Sport and Health Sciences, University of Exeter) approved this study, which was conducted in accordance with the principles of the Declaration of Helsinki. Participants provided written informed consent prior to commencement of the study after the experimental procedures and associated benefits and risks associated with participation had been explained.
3. Participants
Participants were ostensibly healthy and free of cardiovascular, respiratory, metabolic or musculoskeletal diseases or disorders. Exclusion criteria included use of dietary supplements, blood pressure medication, tobacco smoking, vegan or vegetarian diet, and use of antibacterial mouthwash. Sixteen individuals were enrolled and successfully completed the study (Table 1).
Table 1.
Characteristics of participants and groups that completed the study.
| Group | Sex | Age (y) | Height (m) | Body Mass (kg) |
|---|---|---|---|---|
|
| ||||
| Active (NIT) | Male (n = 9) | 24 ± 4 | 1.79 ± 0.07 | 81.3 ± 17 |
| Female (n = 2) | 22 ± 3 | 1.67 ± 0.04 | 57.6 ± 6.2 | |
| Total (n = 11) | 23 ± 4 | 1.77 ± 0.08 | 76.5 ± 17.3 | |
| Placebo (PLA) | Male (n = 5) | 25 ± 6 | 1.78 ± 0.06 | 73.1 ± 6.8 |
4. Experimental design
Participants were allocated into one of two groups in which either a placebo (PLA; n = 5 males) or active (NIT; n = 11, 9 males) dietary supplement was ingested. We employed a parallel group, rather than crossover, experimental design to reduce the number of muscle biopsies required per participant, recognising that no changes in muscle [NO3−] or [NO2−] were expected with PLA. After adhering to a prescribed low-NO3− diet (~20–40 mg NO3−/day; ~0.004–0.005 mmol/kg) for 24 h, participants attended the laboratory on three separate occasions within the following 24-h period during which all food and drink was provided. Fig. 1 illustrates the experimental procedures and the times at which biological tissue samples were collected. On the day of the experimental visits, participants arrived in a rested and fasted state at 07:00 a.m. Participants were asked a series of questions related to adherence to the prescribed diet, body mass measurement was completed and the initial urine sample was collected. After a 40-min period of rest, a cannula was inserted into a vein in the antecubital fossa and the initial blood samples were collected. Preparations for the muscle biopsies were completed and the first muscle tissue sample was collected. Following this, a low- NO3− breakfast was provided and, at 09:00 a.m., 140 mL of a drink containing either 12.8 mmol (~1300 mg) potassium nitrate (KNO3) (NIT) or 12.8 mmol potassium chloride, providing an equivalent dose of potassium but negligible NO3− (PLA), was ingested. All ensuing measurements and sample collections corresponded to the time of supplement ingestion and occurred at 0.5, 1, 2, 3, 9 and 24 h following ingestion of the supplement (Fig. 1).
Fig. 1.
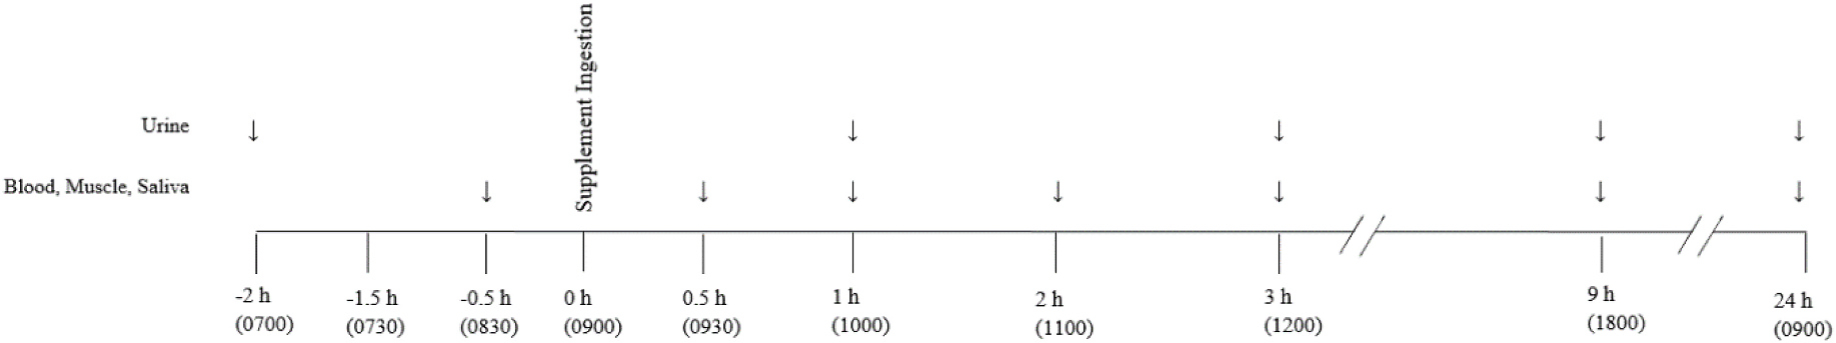
Schematic of experimental procedures and timings of measurement and sample collection. The ‘↓’ refer to the time-points at which each measurement was taken and the closed circle ‘●’ illustrates the ingestion of a single bolus of either a potassium nitrate (NIT: 12.8 mmol, ~1300 mg KNO3) or placebo (PLA) supplement.
5. Measurements
A total of seven muscle biopsies were collected from the m. vastus lateralis muscle using the percutaneous Bergström needle technique modified for manual vacuum [20]. Immediately upon collection, the samples were blotted using sterile gauze to remove blood and any visible adipose tissue. The sample was then placed in liquid nitrogen prior to being stored at − 80 °C until subsequent analysis.
Venous cannulation (20 g Insyte-WTM cannula; Becton Dickinson, Madrid, Spain) and venepuncture (BD Safety-Lok Blood Collection Set; Becton Dickson, UK) were used to collect blood samples from a vein in the antecubital fossa to determine [NO3−] and [NO2−] in whole blood, red blood cells, and plasma. Blood was drawn into 6 mL vacutainers pretreated with lithium-heparin (Becton Dickinson, NJ). 800 μL of the whole blood sample was extracted and inserted into a 1.5 mL Eppendorf containing 200 μL of a NO2− preservation solution and thoroughly vortexed prior to freezing in liquid nitrogen. Simultaneously two further vacutainers were centrifuged within 30 s of collection at 3300 g for 7 min at 4 °C. Following centrifugation, plasma was aliquoted into Eppendorfs and placed in liquid nitrogen. 900 μL of red blood cells remaining in the Eppendorf were subsequently extracted and combined with 100 μL of the NO2− preservation solution in separate tubes, vortexed, and placed in liquid nitrogen. The NO2− preservation solution consisted of 890.9 mM potassium ferricyanide (K3Fe(CN)6), 118.13 mM N-Ethylmaleimide (NEM), NP-40 (octyl phenoxylpolyethoxylethanol) added in a 1:9 ratio (v/v, NP-40/solution), and 4.5 mL deionised water (dH2O) [15].
Participants collected a sample of urine in a separate container (Kartell™; Milan, Italy) and this was aliquoted into Eppendorfs and immediately frozen in liquid nitrogen for subsequent NO3− and NO2− analysis.
Saliva sampling occurred at the same time points (Fig. 1) as muscle biopsies and entailed participants collecting their saliva in a 30 mL tube (Thermo Scientific™ Sterilin™; Massachusetts, USA) over a 2-min period. The samples were aliquoted into Eppendorfs and placed in liquid nitrogen before being stored in a − 80 °C freezer.
NO3− and NO2− concentration measurements in all biological samples was performed using ozone-based gas-phase chemiluminescence [21,22]. The initial step for determination of NO3− and NO2− in blood samples was the addition of ice-cold methanol to deproteinize samples which then underwent centrifugation at 11,000 g for 5 min. Urine and saliva samples were diluted with deionised water and were centrifuged similarly to plasma samples. The supernatant was extracted and used in the [NO3−] and [NO2−] quantification by a Sievers gas-phase chemiluminescence NO analyser (Sievers 280i Nitric Oxide Analyser, GE Analytical Instruments, Boulder, CO, USA). The analysis of muscle NO3− and NO2− content entailed the preliminary weighing of 15–20 mg muscle which was subsequently mixed with a NO2− preservation solution (K3Fe(CN)6, N-ethylmaleimide, water, Nonidet P-40) and homogenized using a bead homogenizer (see Ref. [22]).
6. Statistical analysis
Statistical analyses were performed using the IBM Statistical Package for Social Scientists (SPSS Version 27, SPSS Inc., Chicago, IL, USA) statistical software. Two-way repeated measures ANOVAs were used to determine differences in NO3− and NO2− concentrations in plasma, red blood cells, whole blood, saliva, urine and muscle across time (0, 0.5, 1, 2, 3, 9 and 24 h post supplement) and between groups (PLA and NIT). Significant main and interaction effects were analysed further and, where appropriate, least significant difference (LSD) post hoc tests were applied to identify the point at which significant differences occurred. Pearson product moment correlation coefficients were used to evaluate the significance of relationships between changes in plasma and changes in muscle [NO3−] and [NO3−]. Statistical significance was accepted at P < 0.05. The results are presented as mean ± standard deviation (SD).
7. Results
7.1. Baseline muscle, blood, saliva, and urinary [NO3−] and [NO2−]
At baseline, prior to the ingestion of any supplement, no differences were observed for muscle [NO3−] and [NO2−] between NIT (NO3−, 54 ± 29 nmol/g; NO2−, 2.4 ± 0.9 nmol/g) and PLA (NO3− 56 ± 11 nmol/g; NO2−, 2.5 ± 0.6 nmol/g) groups (both P > 0.05; Fig. 2). Similarly, no between-group differences were observed in [NO3−] and [NO2−] for saliva (Fig. 3), plasma or whole blood (Fig. 4), or urine (Fig. 5), (all P > 0.05). Red blood cell [NO3−] was greater (P < 0.05) for the PLA (14 ± 6 nmol/g) compared to the NIT (7 ± 4 nmol/g) group, but no differences (P > 0.05) were observed in red blood cell [NO2−] (NIT, 0.08 ± 0.05 nmol/g; PLA, 0.08 ± 0.03 nmol/g), (Fig. 4).
Fig. 2.
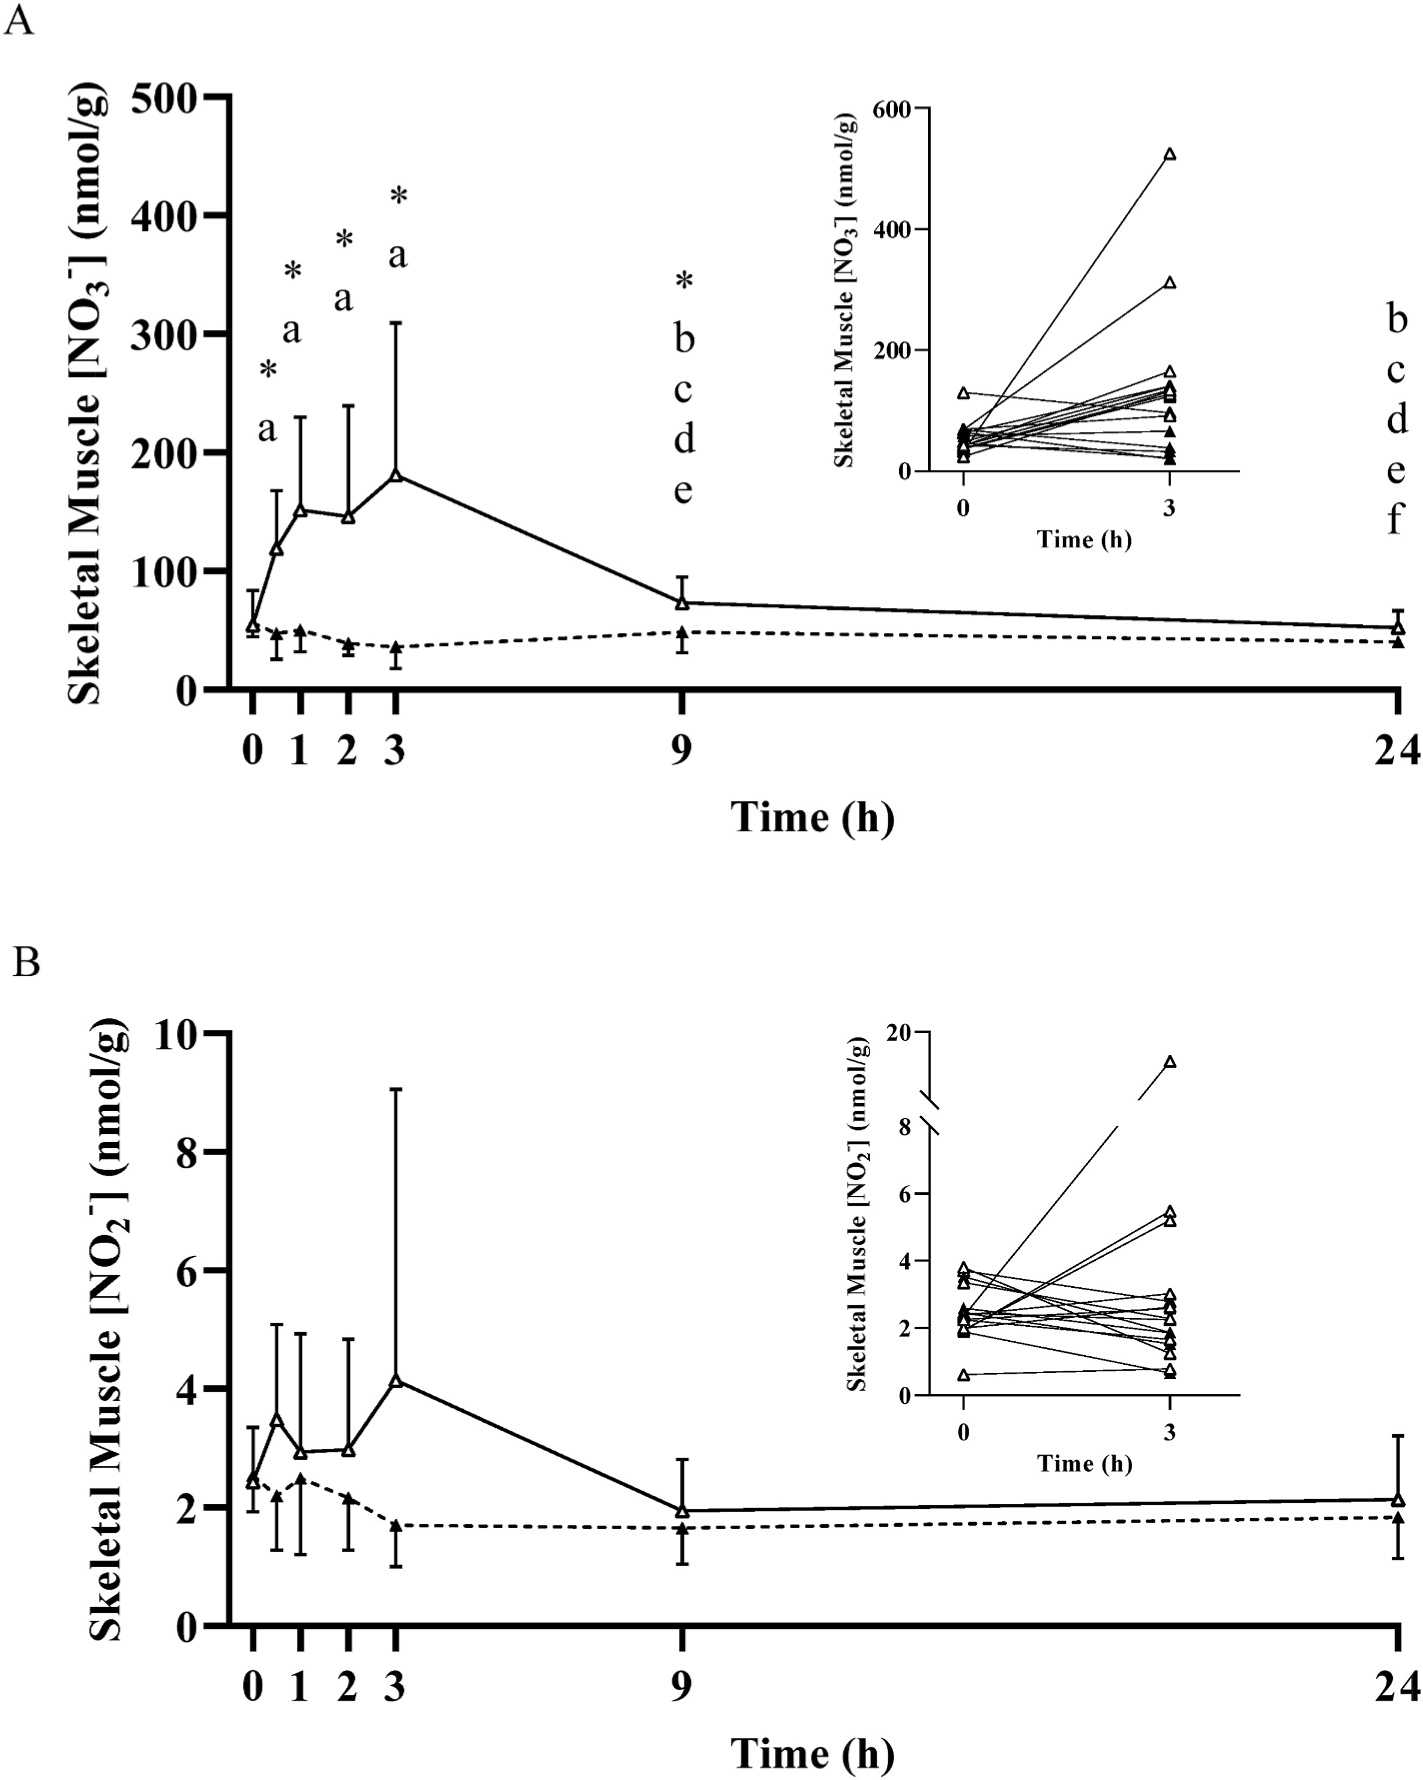
Mean ± SD skeletal muscle nitrate concentration ([NO3−]; Panel A) and nitrite concentration (NO2−; Panel B) prior to and following the ingestion of either a potassium nitrate (NIT: 12.8 mmol, ~1300 mg KNO3) or placebo (PLA) supplement over a 24-h period. No significant (P>0.05) differences were observed in the PLA group over time. Significant differences (P < 0.05) between groups are shown with ‘*’. In the NIT group, ‘a’ = significant difference when compared to baseline (0 h), ‘b’ = significant difference when compared to 0.5 h, ‘c’ = significant difference when compared to 1 h, ‘d’ = significant difference when compared to 2 h, ‘e’ = significant differences when compared to 3 h, and ‘f’ = significant difference when compared to 9 h following NO3− ingestion. Open triangles (Δ) represent the NIT group and closed triangles (▲) represent the PLA group. See text for further information. To exemplify the inter-individual variability in response, the inset figures show the individual participant responses between 0 and 3 h.
Fig. 3.
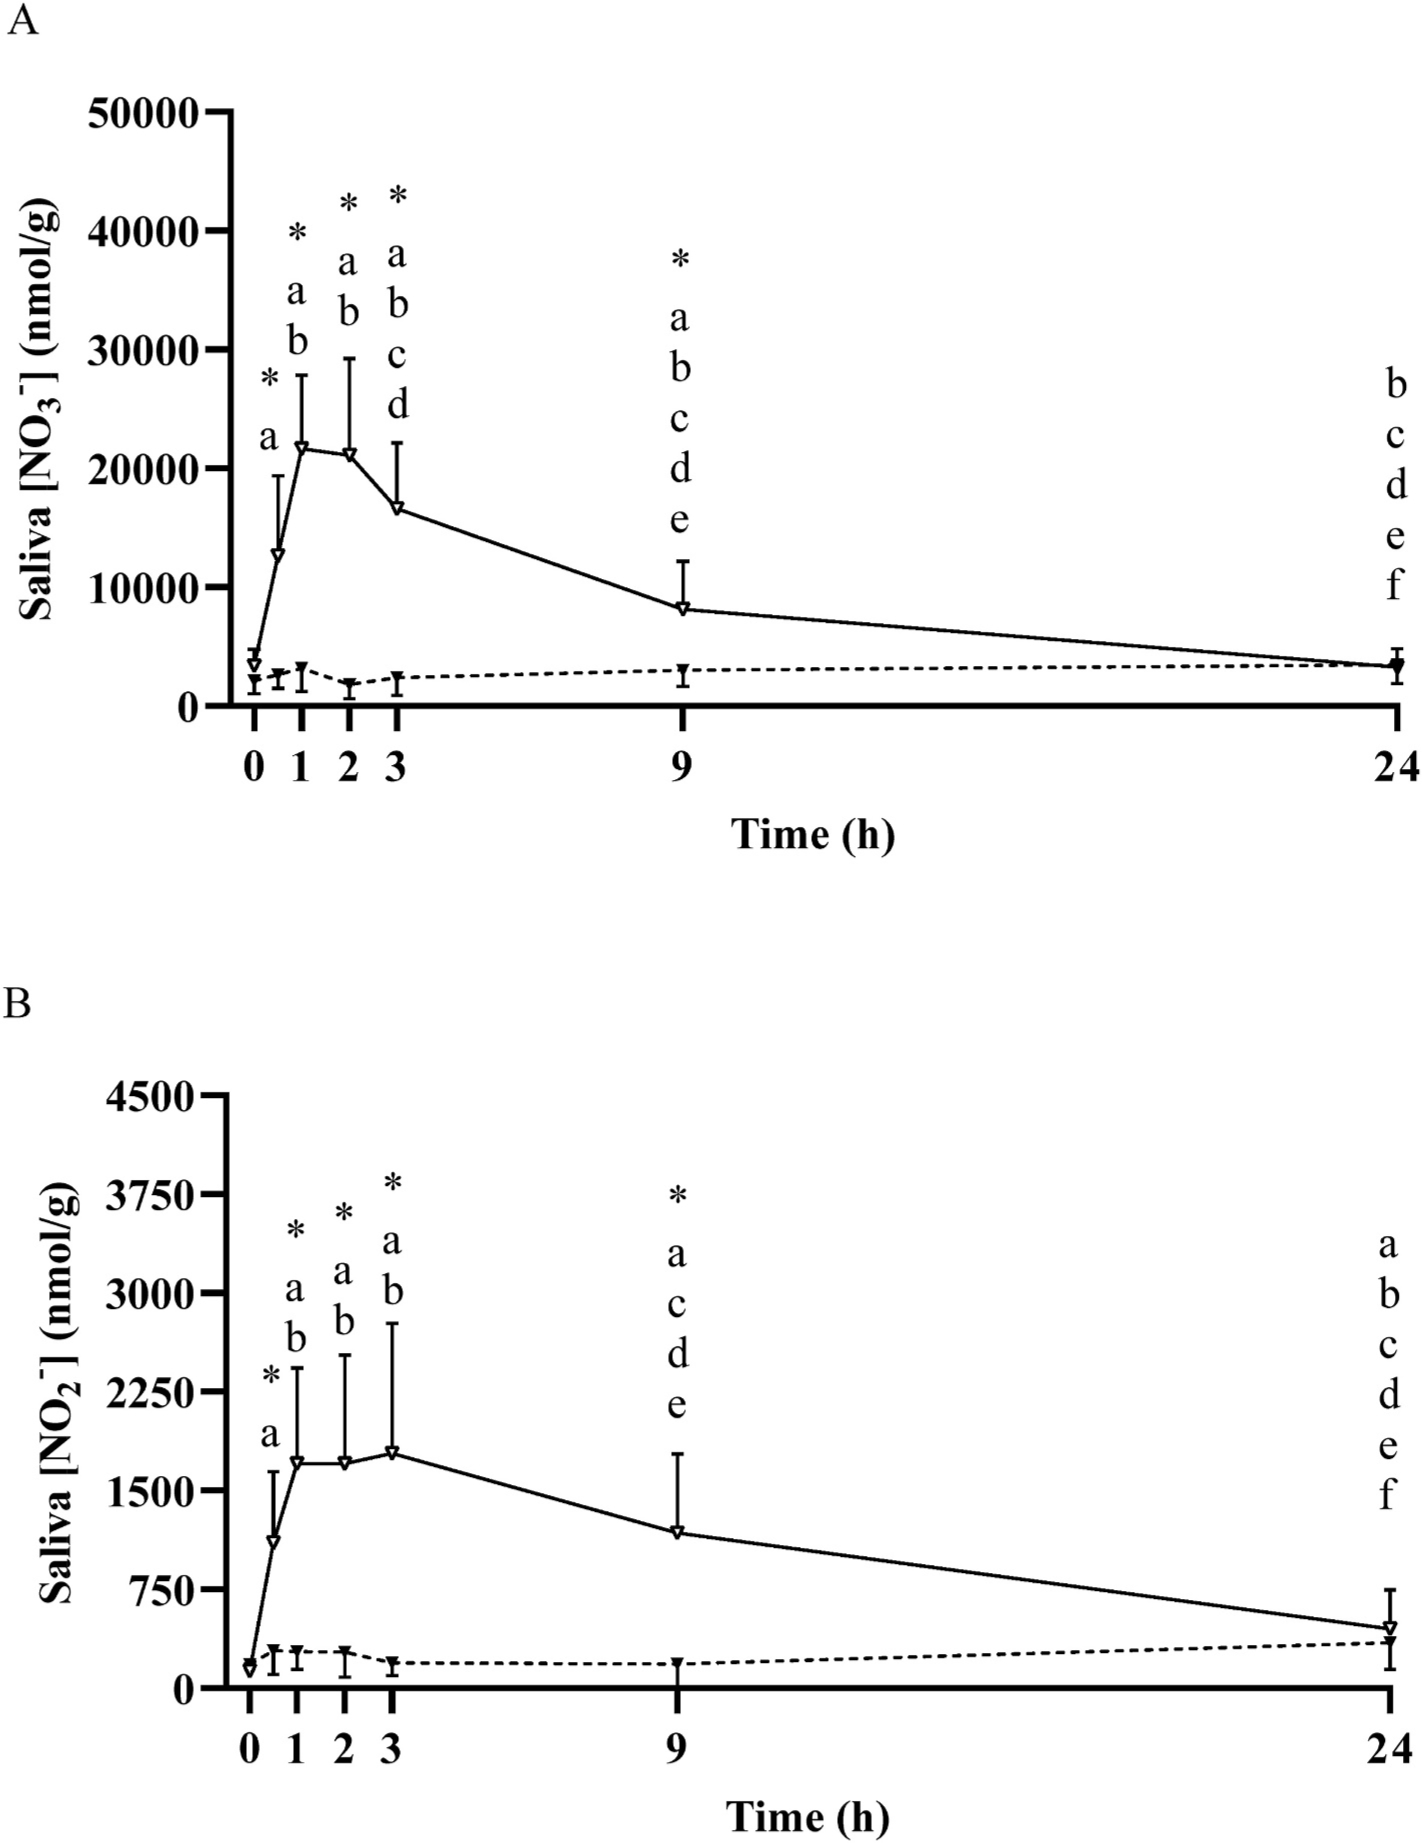
Mean ± SD salivary nitrate concentration ([NO3−]; Panel A) and nitrite concentration ([NO2−]; Panel B) prior to and following the ingestion of either a potassium nitrate (NIT: 12.8 mmol, ~1300 mg KNO3) or placebo (PLA) supplement over a 24-h period. No significant (P>0.05) differences were observed in the PLA group over time. Significant differences (P < 0.05) between groups are shown with ‘*’. In the NIT group; ‘a’ = significant difference when compared to baseline (0 h), ‘b’ = significant difference when compared to 0.5 h, ‘c’ = significant difference when compared to 1 h, ‘d’ = significant difference when compared to 2 h, ‘e’ = significant difference when compared to 3 h, and ‘f’ = significant difference when compared to 9 h following NO3− ingestion. Open triangles (Δ) represent the NIT group and closed triangles (▲) represent the PLA group. See text for further information.
Fig. 4.
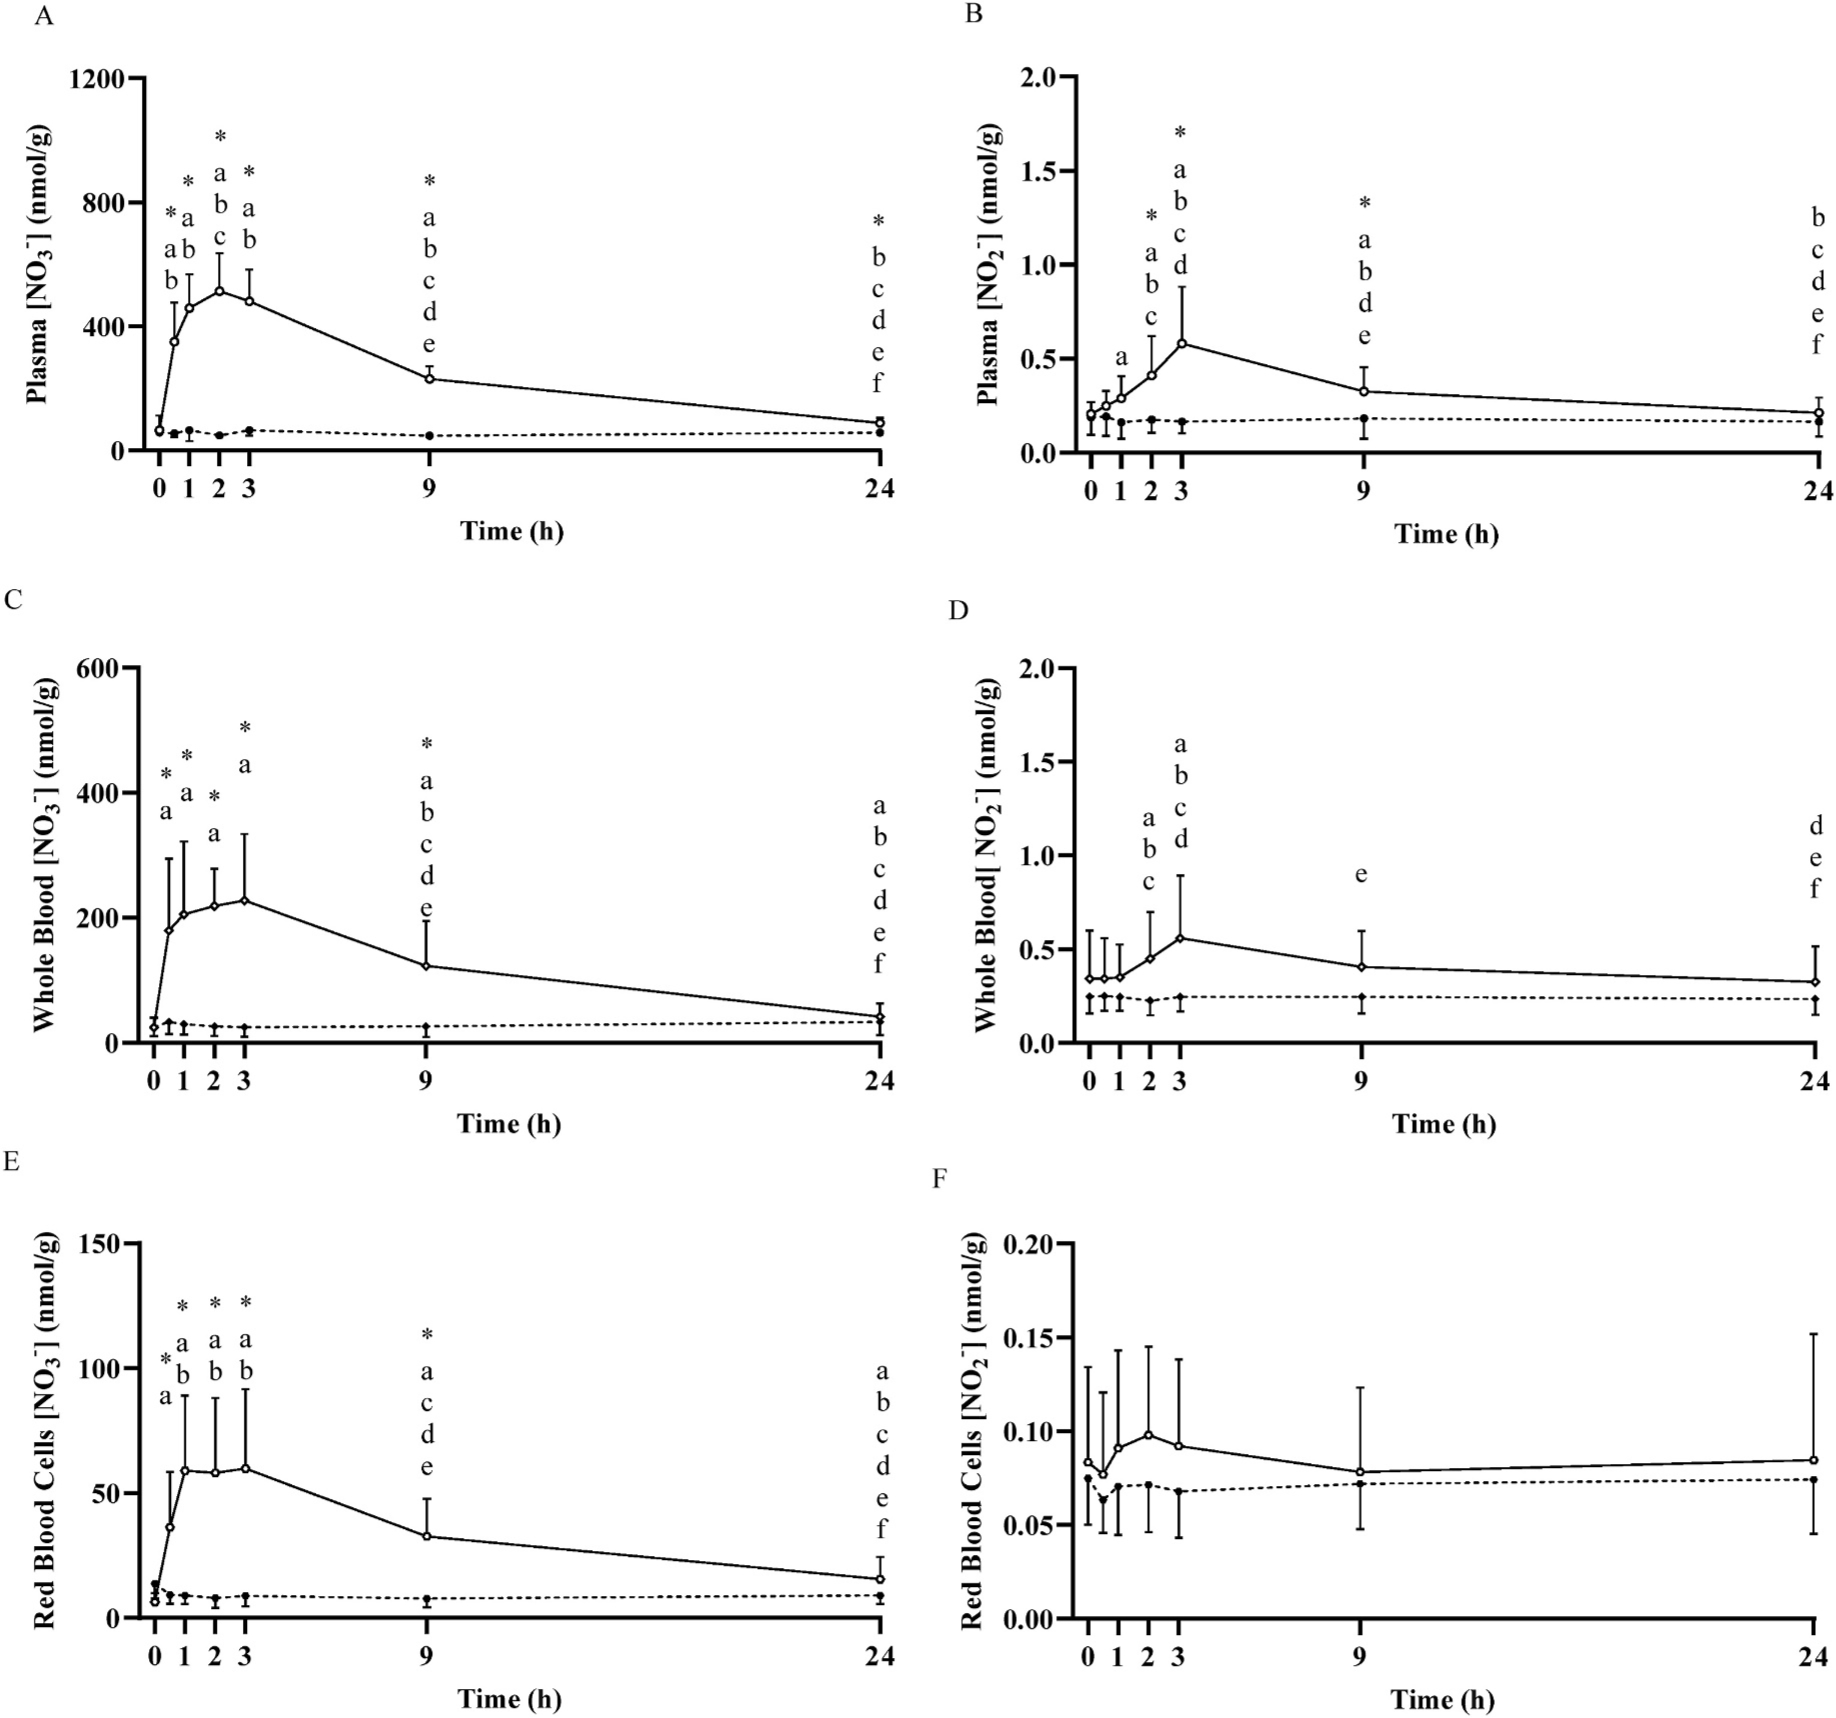
Mean ± SD plasma nitrate concentration ([NO3−]; Panel A) and nitrite concentration (NO2−; Panel B), whole blood [NO3−] (Panel C) and [NO2−] (Panel D), and red blood cell [NO3−] (Panel E) and [NO2−] (Panel F) prior to and following the ingestion of either a potassium nitrate (NIT: 12.8 mmol, ~1300 mg KNO3) or placebo (PLA) supplement over a 24-h period. No significant (P>0.05) differences were observed in the PLA group over time. Significant differences (P < 0.05) between groups are shown with ‘*’. In the NIT group, ‘a’ = significant differences when compared to baseline (0 h), ‘b’ = significant difference when compared to 0.5 h, ‘c’ = significant difference when compared to 1 h, ‘d’ = significant difference when compared to 2 h, ‘e’ = significant difference when compared to 3 h, and ‘f’ = significant difference when compared to 9 h following NO3− ingestion. Open triangles (Δ) represent the NIT group and closed triangles (▲) represent the PLA group. See text for further information.
Fig. 5.
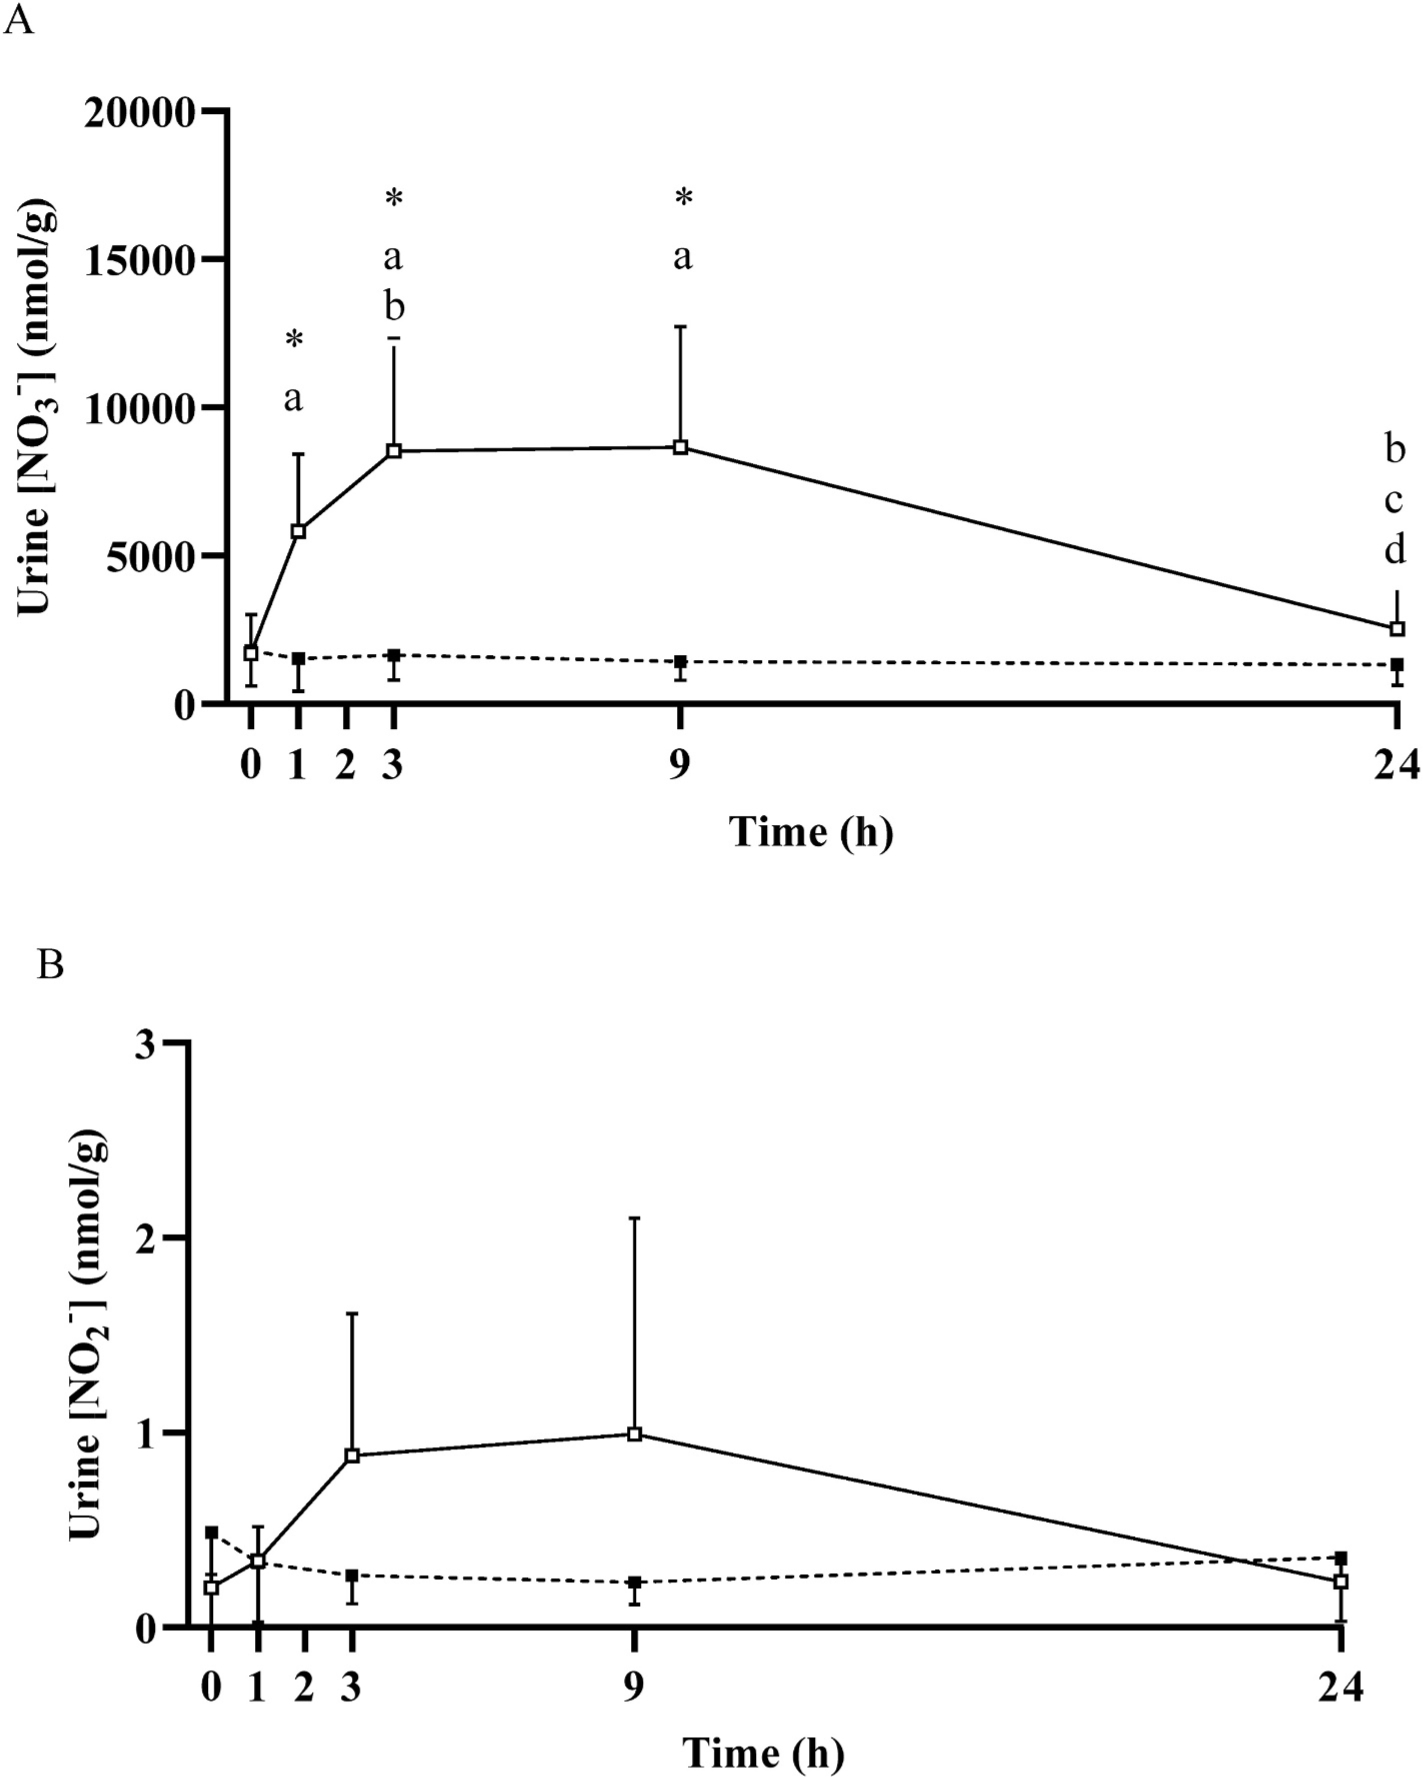
Mean ± SD urinary nitrate concentration ([NO3−]; Panel A) and nitrite concentration (NO2−; Panel B) prior to and following the ingestion of either a potassium nitrate (NIT: 12.8 mmol, ~1300 mg KNO3) or placebo (PLA) supplement over a 24-h period. No significant (P>0.05) differences were observed in the PLA group over time. Significant differences (P < 0.05) between groups are shown with ‘*’. In the NIT group, ‘a’ = significant differences when compared to baseline (0 h), ‘b’ = significant difference when compared to 1 h, ‘c’ = significant difference when compared to 3 h, ‘d’ = significant difference when compared to 9 h following NO3− ingestion. Open triangles (Δ) represent the NIT group and closed triangles (▲) represent the PLA group. See text for further information.
When considered across both NIT and PLA groups (n = 16), no differences (P > 0.05) were observed between baseline skeletal muscle [NO3−] (55 ± 25 nmol/g) and plasma [NO3−] (63 ± 38 nmol/g), but muscle [NO2−] (2.5 ± 0.8 nmol/g) was ~12-fold greater than plasma [NO2−] (0.2 ± 0.1 nmol/g) (P < 0.05). Plasma [NO3−] (63 ± 38 nmol/g; n = 16) was ~2.5-fold greater than whole blood [NO3−] (25 ± 15 nmol/g, P < 0.01), and ~7-fold greater than red blood cell [NO3−] (9 ± 6 nmol/g, P < 0.001). In contrast, plasma [NO2−] (0.2 ± 0.1 nmol/g) was not different from whole blood [NO2−], (0.3 ± 0.2 nmol/g, P = 0.06), but both were greater than red blood cell [NO2−] (0.1 ± 0.04 nmol/g, both P < 0.001).
7.2. Effect of dietary NO3− ingestion on muscle, blood, saliva, and urinary [NO3−] and [NO2−]
No changes in muscle, blood, saliva or urinary [NO3−] or [NO2−] were observed across time in the PLA group (all P > 0.05; Figs. 2–5). In contrast, following NO3− ingestion, [NO3−] and/or [NO2−] changed with time in all tissues assessed. Muscle [NO3−] and [NO2−] values during the 24 h measurement period are presented in Fig. 2. Muscle [NO3−] was significantly greater than baseline at 0.5 h (119 ± 49 nmol/g), increased ~3-fold (181 ± 128 nmol/g) to its peak at 3 h, and was not different to baseline from 9 h (P >0.05) onwards. No significant changes in muscle [NO2−] were observed (all P > 0.05).
Plasma [NO3−] and [NO2−] across the 24 h period are presented in Fig. 4. Plasma [NO3−] was significantly greater than baseline at 0.5 h (351 ± 126 nmol/g), increased ~8-fold (514 ± 122 nmol/g) to its peak at 2 h, remained elevated at 9 h (230 ± 42 nmol/g, P < 0.05), and was not different from baseline at 24 h (88 ± 16 nmol/g, P > 0.05). Plasma [NO2−] was greater than baseline at 1 h (0.3 ± 0.1 nmol/g, P < 0.05), attained its peak at 3 h (0.6 ± 0.3 nmol/g), and was not different from baseline at 24 h (0.2 ± 0.1 nmol/g, P > 0.05). Saliva [NO3−] was significantly increased above baseline from 0.5 h to 9 h (all P < 0.05; Fig. 3). Both whole blood [NO3−] and [NO2−], red blood cell [NO3−] and saliva [NO2−] were elevated above baseline across the 24 h period (all P < 0.05; Figs. 3 and 4). No significant increases were observed in red blood cell [NO2−], although there was a tendency towards an increase above baseline at 0.5 h (P = 0.09) and 2 h (P = 0.05). Urinary [NO3−] was increased above baseline from 1 h to 9 h (all P < 0.05), and urinary [NO2−] tended to be higher at 1 h (P = 0.08), was greater than baseline at 3 h and 9 h (both P < 0.05), and was not different from baseline at 24 h (P > 0.05; Fig. 5).
The ratios between plasma and muscle [NO3−] and [NO2−] across time are presented in Fig. 6. At baseline, the plasma/muscle [NO3−] ratio was close to unity, indicating no clear muscle-to-blood or blood-to-muscle gradient, whereas the plasma/muscle [NO2−] ratio was ~0.1, indicating that [NO2−] is substantially higher in muscle than blood. No changes were observed in the plasma/muscle [NO3−] ratio in PLA (P > 0.05). In NIT, following supplementation, the plasma/muscle [NO3−] ratio was significantly greater than baseline (1.3 ± 0.7) at 0.5 h (3.3 ± 1.3), attaining its peak at 2 h (4.6 ± 2.4), and returning to baseline at 24 h (P > 0.05). No changes were identified in the plasma/muscle [NO2−] ratio in PLA (P > 0.05). In NIT, the plasma/muscle [NO2−] ratio was significantly elevated at 2 h (0.2 ± 0.1 a.u.), reached its peak at 3 h (0.3 ± 0.2 a.u.) and remained elevated at 24 h (0.1 ± 0.1 a.u.), compared to baseline (all P < 0.05).
Fig. 6.
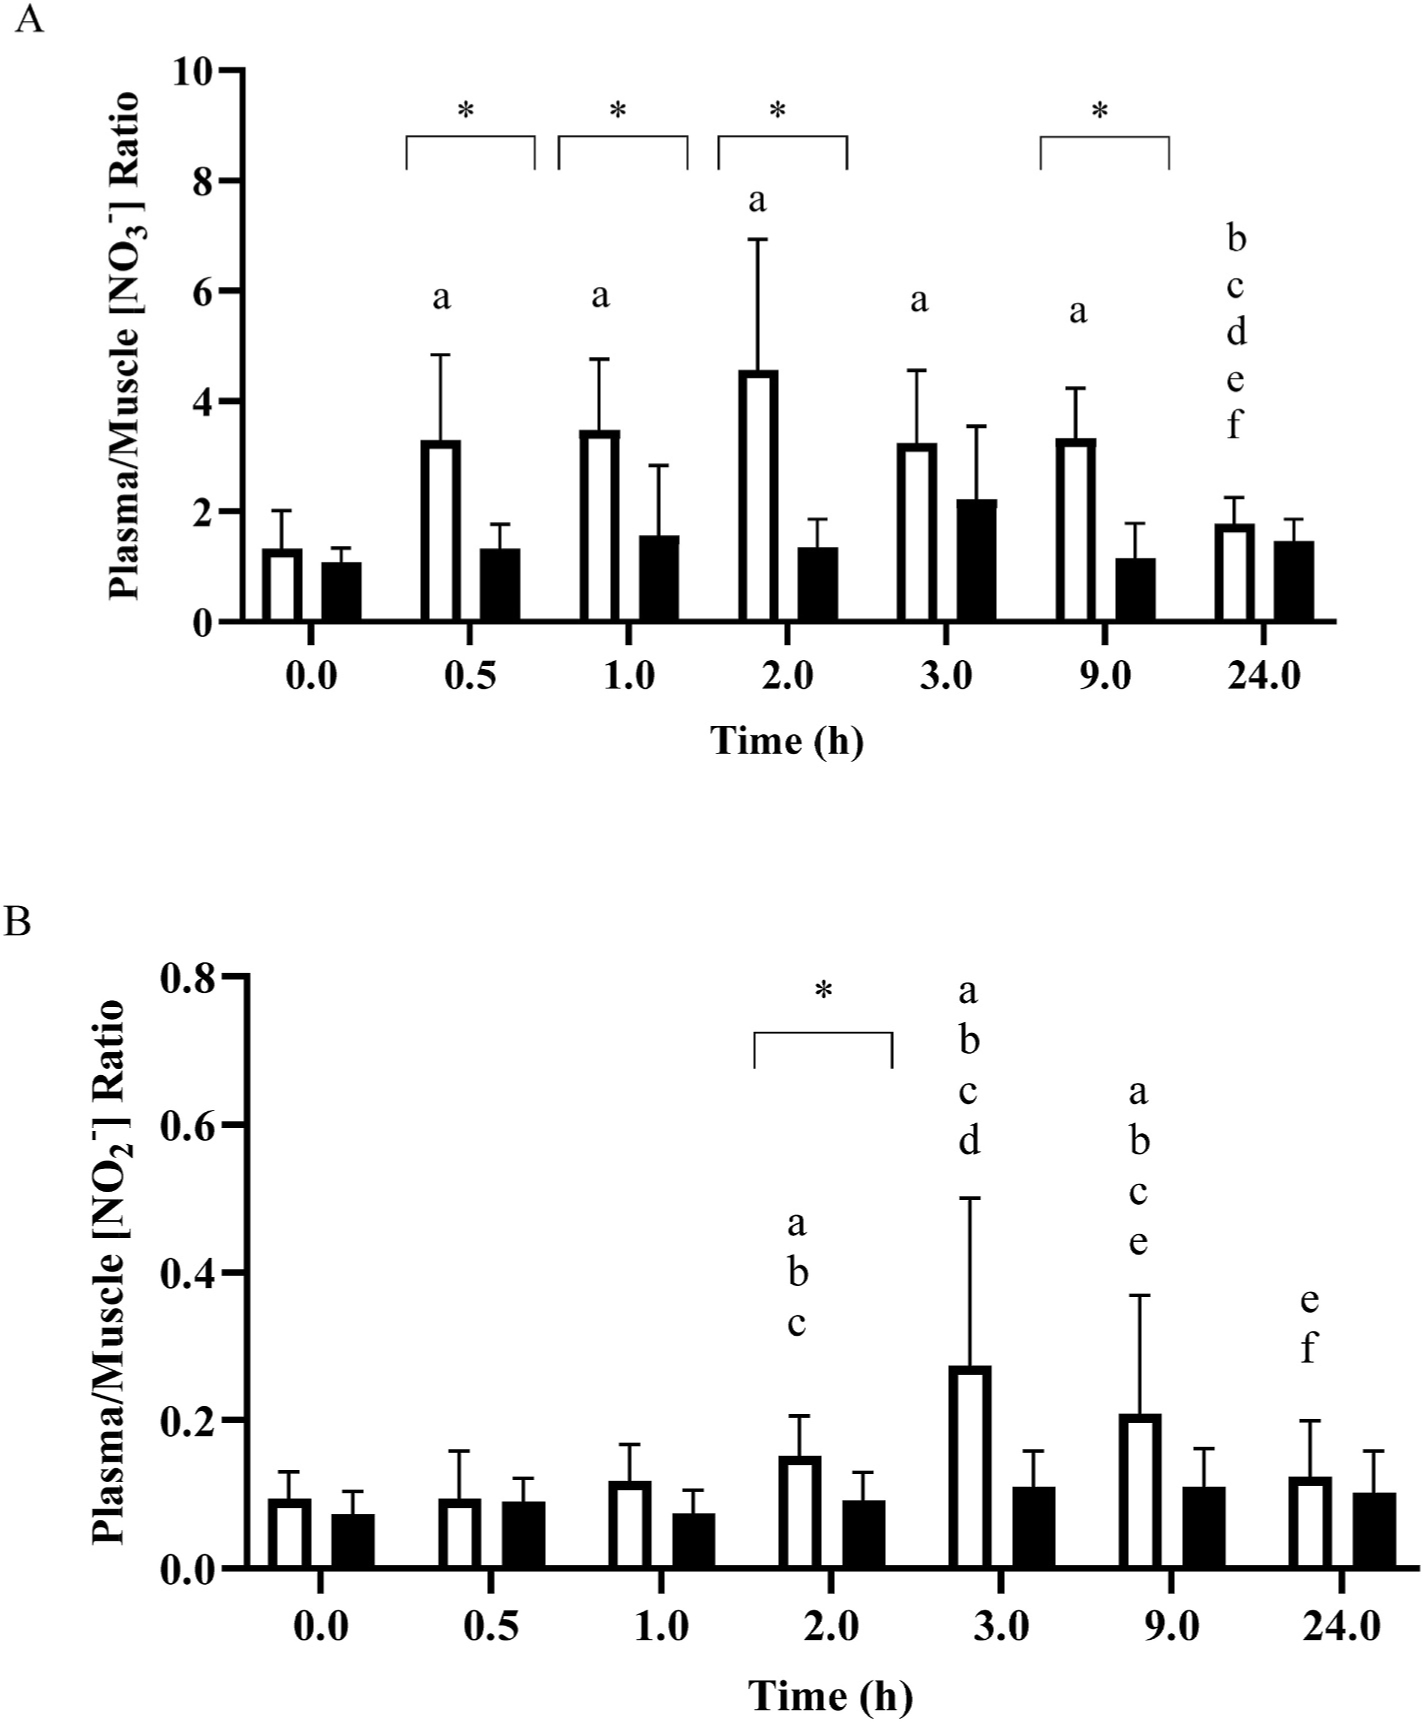
Mean ± SD plasma/muscle nitrate concentration ([NO3−]) ratio (Panel A) and plasma/muscle nitrite concentration ([NO2−]) ratio (Panel B) prior to and for the 24-h following the ingestion of either a potassium nitrate (NIT: 12.8 mmol, ~1300 mg KNO3) or placebo (PLA) supplement. Significant differences (P < 0.05) between the NIT and PLA group are illustrated with ‘*’. For NIT, ‘a’ = significant difference when compared to 0 h, ‘b’ = significant difference when compared to 0.5 h, ‘c’ = significant difference when compared to 1 h, ‘d’ = significant difference when compared to 2 h, ‘e’ = significant difference when compared to 3 h, and ‘f’ = significant difference when compared to 9 h following NO3− ingestion. Open symbols represents the NIT group and closed symbols represent the PLA group.
There was no significant correlation between plasma and muscle [NO3−] at baseline (r = 0.13; P > 0.05). However, the percentage change in plasma [NO3−] was significantly correlated with the percentage change in muscle [NO3−] at 0.5, 1, 2, and 9 h following NO3− ingestion (r = 0.52–0.70; P < 0.05). Similarly, there was no significant correlation between plasma and muscle [NO2−] at baseline (r = 0.48; P > 0.05) but the percentage change in plasma [NO2−] was significantly correlated with the percentage change in muscle [NO2−] at 1, 2, 3 and 9 h following NO3− ingestion (r = 0.58–0.78; P > 0.05).
The changes in muscle, plasma, saliva, and urinary [NO3−] and [NO2−] across time relative to their respective baseline are presented in Fig. 7. At 1 h post NO3− ingestion, the change in [NO3−] was significantly greater for plasma (+815 ± 426%) compared to muscle (+225 ± 153%, P > 0.001) and urine (+400 ± 386%, P > 0.001), but was not different from saliva (+686 ± 455%, P > 0.05). At 3 h, urinary [NO3−] had increased further from baseline (+618 ± 469%) and was not different from plasma (+799 ± 397%), saliva (+492 ± 327%) or muscle (+328 ± 414%) (all P > 0.05). At 9 h, plasma [NO3−] remained elevated above baseline (+341 ± 185%) (P > 0.05) and was significantly higher than muscle (+68 ± 96%), but was not different from saliva (+214 ± 245%) and urine (+624 ± 598%) (both P > 0.05). At 24 h, there was no difference in the relative change from baseline in any of the variables except for between plasma and muscle (P > 0.05). The change in saliva [NO2−] was greater than for all other samples across all measurement time points (P > 0.05). Both plasma and muscle [NO2−] were greater than baseline 1–3 h following NO3− ingestion, and there were no differences between these tissues at any time (all P > 0.05). Urinary [NO2−] was greater than baseline at 3 and 9 h post supplementation (P < 0.05), and the magnitude of change was greater than observed for both muscle and plasma.
Fig. 7.
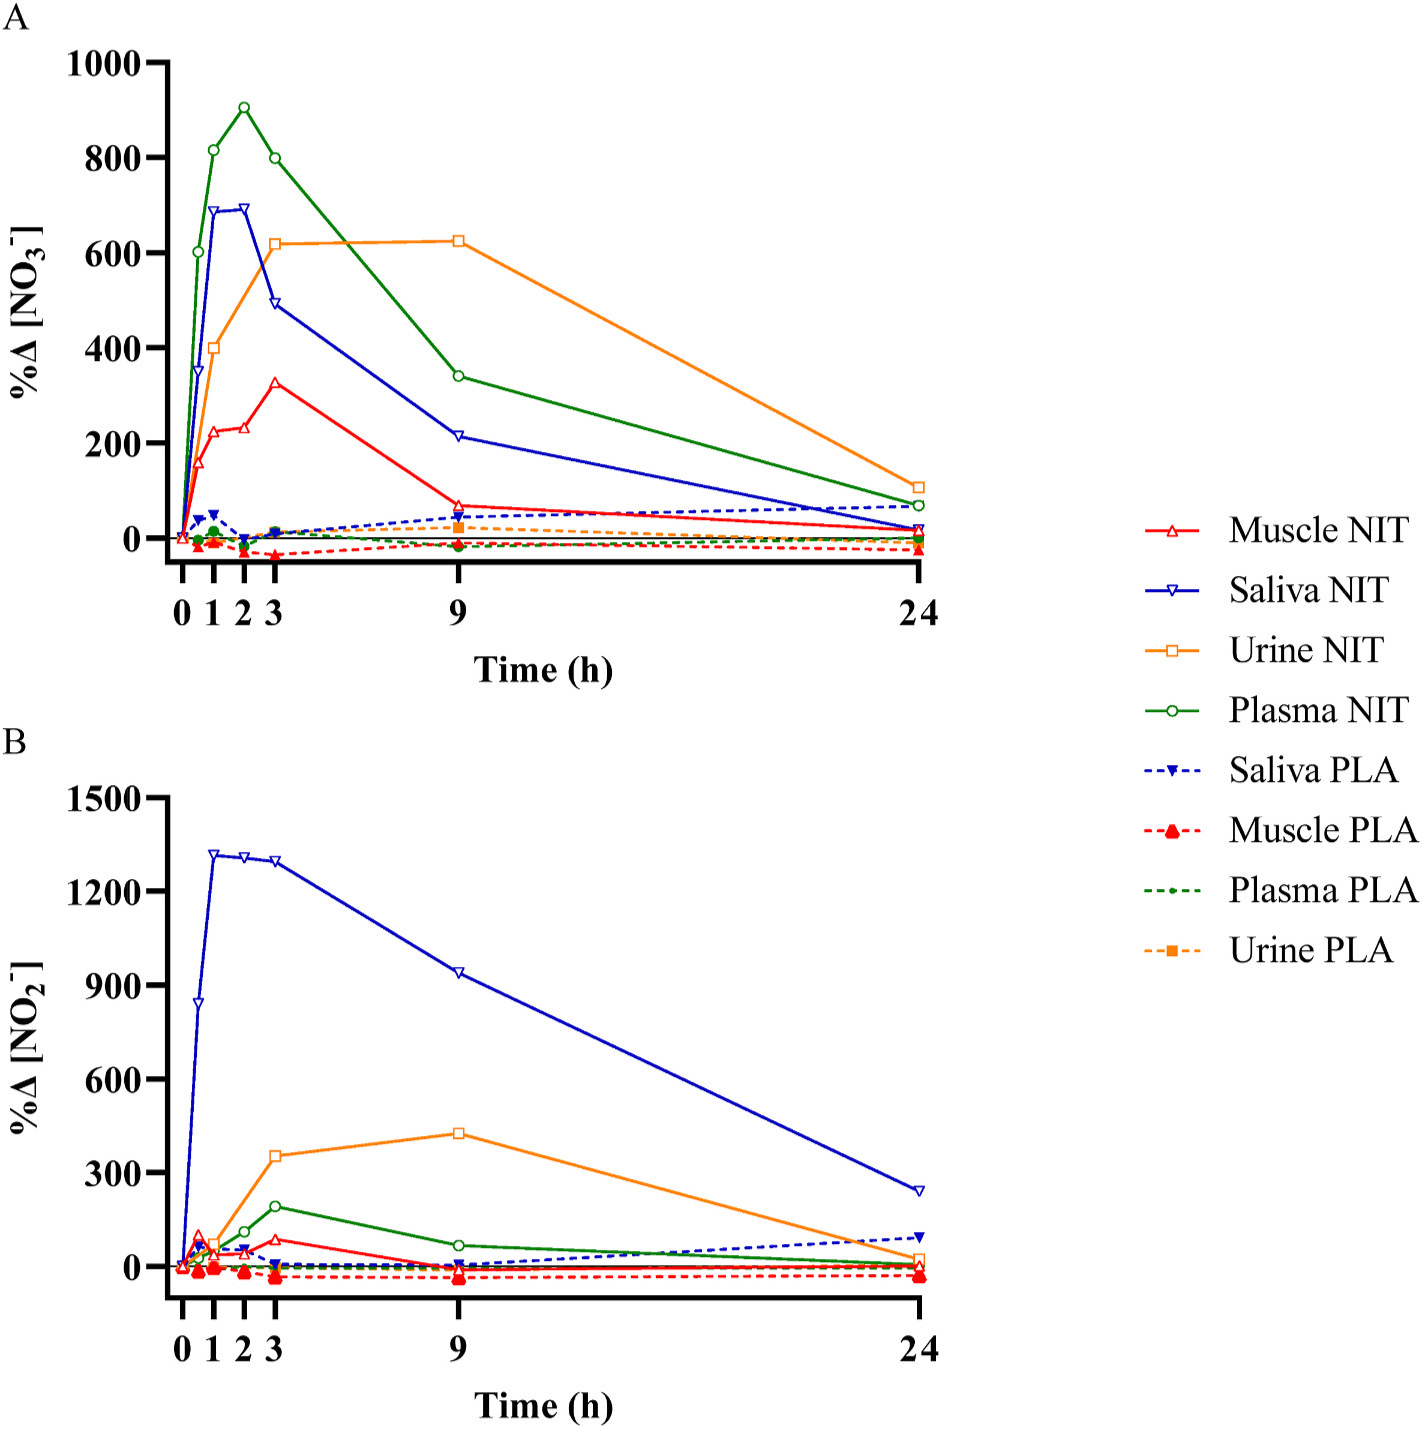
The relative change compared to baseline (%Δ) in nitrate concentration ([NO3−]; Panel A) and nitrite concentration (NO2−; Panel B) in different biological compartments for 24-h following the acute ingestion of a bolus of potassium nitrate (NIT: 12.8 mmol, ~1300 mg KNO3) or placebo (PLA). For clarity of visualisation, only group mean responses are shown.
8. Discussion
The effects of dietary NO3− supplementation on physiological responses (e.g., blood pressure and exercise performance) are complex and highly variable between individuals [11,23]. The efficacy of NO3− supplementation is often evaluated in relation to the magnitude of elevation in plasma [NO3−] and [NO2−]. However, NO3− metabolism is a dynamic process involving the transport of NO3− and NO2− between biological compartments, and a more complete understanding of the biological fate of the ingested NO3−, and its functional consequences, requires concurrent consideration of NO3− and NO2− pharmacokinetics in numerous tissues (e.g., saliva, blood, skeletal muscle, urine). It has been reported that rodent muscle has a relatively high [NO3−] [15,16], and that this NO3− reservoir is highly sensitive to the NO3− content of the diet [24]. However, further studies in rodents showed non-uniform distribution of NO3− over different skeletal muscle groups [25,26], which complicates the originally formulated simple hypothesis that declared skeletal muscle to be a whole body NO3− reservoir [15]. The primary purpose of the present investigation was to characterize, for the first time, the pharmacokinetic profile of human vastus lateralis muscle [NO3−] and [NO2−] following bolus ingestion of dietary NO3−. Consistent with our hypothesis, we found that skeletal muscle [NO3−] was significantly increased above baseline at 0.5 h, reached its peak at ~3 h, remained elevated for ~9 h and then returned to baseline 24 h after NO3− ingestion. In contrast, muscle [NO2−] was not significantly elevated following NO3− ingestion.
8.1. Time course of nitrate elevation in biological tissues
With the exception of urine, the pharmacokinetic profiles of NO3− elevation in the biological tissues we sampled were broadly similar, with a rapid elevation leading to peak concentration at 1–3 h, followed by a slower decline thereafter, and a return to baseline at 24 h following NO3− ingestion. These profiles, which are illustrated as a percentage change from baseline in Fig. 7, indicate that the time-to-peak concentration occurs in saliva at ~1 h, in plasma at ~2 h, in muscle at ~3 h, and in urine between 3 and 9 h.
Our results for saliva, plasma and urine are consistent with previous reports [10,11,13,14,27,28]. However, a novel finding of the present study is the rapid uptake of NO3− into skeletal muscle, which was evident at 0.5 h following the ingestion of an acute bolus of KNO3. This highlights the speed with which NO3− is absorbed from the intestine into the bloodstream, transported to other tissues, and sequestered from the circulation into storage sites including muscle [19]. This process may be facilitated via the actions of sialin, a protein involved in the active transport of NO3− [29], which has been demonstrated to be present in skeletal muscle [18,30]. The change in muscle [NO3−] was correlated with the change in plasma [NO3−], consistent with the existence of blood to muscle NO3− exchange following NO3− ingestion.
Two previous studies have measured [NO3−] in human skeletal muscle following dietary NO3− ingestion but with more limited temporal resolution. Nyakayiru et al. [17] reported that vastus lateralis muscle [NO3−] was significantly elevated in type II diabetes mellitus patents at 2, 4, and 7 h, following the ingestion of ~12 mmol NaNO3−. Similarly, Wylie et al. [18], reported that vastus lateralis muscle [NO3−] was significantly increased at 2 h post ingestion of beetroot juice containing 12.8 mmol NO3−. In the present study, muscle [NO3−] approximated 40–50 nmol/g at baseline and was elevated to a peak of ~180 nmol/g following NO3− ingestion (Fig. 2). These values are similar to those reported by Nyakayiru et al. [17] but considerably lower than those reported by Wylie et al. [18]. It is notable that in all three studies, the influence of dietary NO3− ingestion on muscle [NO3−] is qualitatively similar (i.e., a 4–5 fold increase in [NO3−]) despite the considerable differences in absolute concentrations reported between laboratories, which may be related in part to factors such as diet, age and physical activity levels. The measurement of [NO3−] in muscle is both relatively new and technically challenging, and experimental techniques continue to evolve [26].
To our knowledge, this is the first study in any species to determine the time course of [NO3−] changes in plasma, red blood cells and whole blood following dietary NO3− ingestion. Interestingly, the time-to-peak [NO3−] in red blood cells and whole blood occurred at 3 h, which was slightly later than in plasma and may suggest a slight lag in the entry of NO3− into the red cell from the plasma. However, it should be noted that although the absolute increase and time-to-peak [NO3−] differed in plasma, red blood cells and whole blood, the values were not significantly different between 1 and 3 h following NO3− ingestion (Fig. 4).
The time course of changes in urine [NO3−] differed from the pattern observed in the other compartments, reflecting delayed dynamics for the excretion of NO3−. The results indicate that urine [NO3−] was significantly increased 1 h post NO3− ingestion and remained elevated for 9 h before returning to baseline at 24 h. These results are consistent with previous literature [12–14,28]. It has been reported that up to 75% of ingested NO3− is ultimately expelled in the urine [31]. The sustained elevation of urinary [NO3−] indicates that the body is still expelling significant quantities of NO3− 9 h following NO3− ingestion and is consistent with the earlier decrease in [NO3−] in blood and muscle.
8.2. Time course of nitrite elevation in biological tissues
NO2− is an important ion in NO metabolism, being both the product of NO oxidation and the precursor to NO formation depending on the prevailing physiological milieu [32,33]. Following dietary NO3− ingestion, salivary [NO2−] was significantly increased at 0.5 h, reached peak values between 1 and 3 h, and remained elevated above baseline for 24 h. Salivary [NO3−] and [NO2−] changes displayed similar temporal dynamics. In contrast, the change in plasma [NO2−], including time-to-peak concentration, was delayed compared to changes in plasma [NO3−], in accordance with previous reports [9–11,14]. This sequence of events is consistent with the existence of an enterosalivary pathway by which ingested NO3− that enters the bloodstream is concentrated in the salivary glands and reduced to NO2− via the action of anaerobic bacteria in the oral cavity [34]. This NO2− is subsequently swallowed, contributing to an increased circulating blood [NO2−], and may in turn be reduced to NO under certain physiological conditions such as tissue hypoxia [35,36]. Urinary [NO2−] evidenced a different time course to that of other biological compartments, being significantly increased at 3 h and 9 h before returning to baseline at 24 h following NO3− ingestion.
There was no significant increase in skeletal muscle [NO2−] at any time point following NO3− ingestion, although appreciable measurement and inter-individual variability may have obscured the existence of a true difference, at least at 3 h (see Fig. 2B). Similarly, Wylie et al. [18] found that muscle [NO2−] was elevated 3-fold by NO3− ingestion but this increase was also non-significant. Nyakayiru et al. [17], due to their extraction protocol, were unable to detect NO2− in their muscle samples. Overall, it appears that dietary NO3− ingestion does not consistently or appreciably increase muscle [NO2−] in humans. This is in contrast to rodents in which dietary NO3− supplementation significantly elevated both muscle [NO3−] and [NO2−] [24]. Muscle NO3− and NO2− is likely only reduced to NO ‘on demand’ and thus differences in the degree of activity between species may be important (i.e., the participants in our study were mainly confined to bed rest whereas the rats in earlier studies were able to move freely around their cages). It is also possible that there is a species-related difference in the activity of xanthine oxidoreductase (the main native mammalian nitrate reductase, and also nitrite reductase) in rodents and humans. It is worth noting that there are challenges to the sensitive measurement of small concentrations of NO2− in the relatively small muscle biopsy samples that can be harvested in human volunteers compared to the whole muscles which are excised and analysed in rodent studies [26]. However, the possibility of genuine inter-species difference in muscle [NO2−] should be also considered and further explored [19].
8.3. Plasma to muscle ratios for nitrate and nitrite
The plasma/muscle [NO3−] ratio at baseline was approximately 1, indicating a similar concentration in these two tissues. This contrasts with the two previous studies in humans, both of which reported a higher baseline [NO3−] in vastus lateralis muscle compared to plasma [17,18], and also with several investigations in rat gluteus maximus [15, 16]. Following dietary NO3− ingestion, the plasma/muscle [NO3−] ratio widened, indicating a relatively greater increase in plasma compared to muscle [NO3−], results which are also consistent with previous studies regardless of the muscle used [17,18,24]. Our results for the plasma/muscle [NO2−] ratio are, however, consistent with Wylie et al. [18], with both studies showing higher muscle compared to plasma [NO2−] both at baseline and following NO3− ingestion, despite a greater relative change in plasma [NO2−]. It is possible that this difference has functional significance: skeletal muscle possesses the enzymatic machinery required for nitrite reduction to NO (i.e., xanthine oxidoreductase, aldehyde oxidase, sulphite oxidase [16]), and the presence of high NO2− availability may therefore be functionally more important than high NO3−.
It has been speculated that skeletal muscle serves as a NO3− store or reservoir which can be drawn on to support NO metabolism in other regions of the body, perhaps especially in situations when dietary NO3− intake is limited or the need for NO is suddenly increased [5,15,19]. This hypothesis was formulated on the basis of reports that skeletal muscle [NO3−] is appreciable higher than plasma [NO3−] such that there is a muscle-to-blood gradient for NO3− [15,18] and that muscle [NO3−] not only increases following dietary NO3− supplementation but also falls when dietary NO3− is restricted [24,25]. The results of the present study challenge the original formulation of this proposal by showing that human vastus lateralis muscle [NO3−] was not higher than plasma [NO3−] either at baseline or following dietary NO3− supplementation. Moreover, there was no evidence in the present study that NO3− is stored for any longer in human muscle than in blood, with both tissues returning to baseline [NO3−] values at 24 h following dietary NO3− ingestion.
It is important to note that recent studies indicate substantial differences in [NO3−] between different skeletal muscles in the rat with the gluteus maximus having the highest concentration [19]. In the present study with human volunteers, we only obtained a muscle biopsy from the vastus lateralis and it is not known whether differences in [NO3−] exist between different muscles in humans. This apparent paradox between earlier animal studies and human studies highlights the hazards of inter-species comparisons when formulating hypotheses. However, it is not inconceivable that the preferred storage forms for NO differ between species, owing perhaps to differences in the capacity for NO3− and/or NO2− reduction, and/or that, compared to rodents, humans rely relatively more on nitrite, S-nitrosothiols or some other mediator for NO production. In this respect, in humans, a muscle-to-blood NO2− gradient might potentially serve a similar role to the muscle-to-blood NO3− gradient previously identified in rodents [16]. The hypothesis that human skeletal muscle serves as a whole-body NO3− reservoir requires further study.
8.4. Experimental considerations and implications
This study was designed to ascertain the time course, including the time-to-peak concentration, of skeletal muscle [NO3−] and [NO2−] following the acute ingestion of 12.8 mmol NO3− and to relate it to the time course of [NO3−] and [NO2−] in other biological compartments (saliva, blood (including plasma, red cells and whole blood), and urine). One strength of this study was that the diet and physical activity of the participants was carefully controlled. For the 24 h preceding the experiment and during the experiment, participants were provided with a low NO3− (~30 mg) diet, which was designed using a custom-made database (Nick McMahon, personal communication). This enabled better isolation of the specific physiological response to the acute ingestion of NO3− during the experiment as well as attenuating variability between participants at baseline. Participants remained in bed (either in a supine or seated position) for the majority of the initial 9 h sample collection period, with restrictions placed on the amount of movement individuals were allowed to complete. This meant that it was possible to remove the potential unknown consequence of movement on the pharmacokinetic response to NO3− ingestion. It should be considered, however, that these restrictions on diet and physical activity may not reflect the typical ‘real world’ situation, in particular with regard to NO3− to NO2− conversion.
In the present study, participants received an acute bolus of KNO3 when previously we have administered NO3− via beetroot juice [18]. It is possible that tissue NO3− uptake might differ between these different sources with the other bioactive components in beetroot juice facilitating a greater retention of NO3− and greater conversion of NO3− to NO2− [11,37].
One limitation to the present study was the number of muscle biopsies donated by the participants, which we restricted to seven. While this provided good granularity in describing the time course of muscle NO3− loading and retention, especially in the first 3 h following NO3− ingestion, the lack of measurements made between 3 h and 9 h means that we cannot exclude the possibility that peak muscle [NO3−] and [NO2−] was reached at a later time than 3 h. The requirement to limit the number of muscle biopsies also meant that we were unable to explore the dose-response relationship between the quantity of NO3− ingested and the pharmacokinetics of tissue concentration changes. The focus of our study was on muscle [NO3−] and [NO2−] pharmacokinetic profiles following acute bolus ingestion of NO3−, and the influence of chronic NO3− supplementation (i.e. daily NO3− ingestion) on muscle NO3− and NO2− retention, and plasma/muscle [NO3−] and [NO2−] ratios, remains to be determined.
We harvested muscle tissue via needle biopsy from the m. vastus lateralis because this is a relatively safe and convenient procedure in humans. However, it is possible that, as for rodents [19], there are differences in [NO3−] and [NO2−] between human muscles, possibly as a consequence of differences in the predominant muscle fiber type. At rest, blood flow is higher to rat skeletal muscles that are comprised predominantly of type I fibers (slow-twitch; e.g., soleus) compared to type II fibers (fast-twitch; e.g. biceps femoris) [38] and differences in blood flow and NO3− delivery might be expected to impact muscle NO3− uptake. Differences in the properties of type I and type II muscle, including with regard to O2 delivery and the propensity for oxidative metabolism and fatigue development, have also been suggested to be relevant to the efficacy of NO3− supplementation for enhancing exercise performance [39,40]. The human vastus lateralis is a mixed muscle containing ~42% type I fibers [41] but there are substantial differences in muscle fiber typology and metabolic properties across other human muscles that might potentially impact NO3− storage. At the present time, it is not possible to discern whether differences between the results of the present study in humans and previous studies in rodents reflect genuine inter-species differences or methodological factors including the characteristics of the muscles sampled.
It is presently unknown whether the potential ergogenic effects of dietary NO3− supplementation are more strongly related to increased muscle or blood [NO3−] and [NO2−]. However, the results of this study indicate that peak [NO3−] and [NO2−] in both compartments are reached at ~3 h following NO3− ingestion. This suggests high nitrate flow between blood and muscle compartments and enables estimation of the time at which peak muscle [NO3−] is reached following NO3− ingestion. Assuming that ergogenic effects are more likely to arise when NO bioavailability is at its highest, the present results support the current recommendation to ingest NO3− approximately 3 h prior to the performance of exercise [5].
In summary, the present study provides the first comprehensive description of changes in skeletal muscle [NO3−] and [NO2−] following acute dietary NO3− ingestion. We show that muscle [NO3−] rises rapidly (within 0.5 h) and reaches a peak at ~3 h before declining to the initial baseline within 24 h. The dynamics of muscle NO3− loading are slightly slower than saliva and blood, and faster than urine. While muscle [NO3−] was significantly elevated following NO3− ingestion, the rise in muscle [NO2−] was not statistically significant, in part due to appreciable measurement variability. Unlike some previous studies, we did not find that muscle [NO3−] was higher than blood [NO3−] at baseline or at any other time point following NO3− ingestion, challenging the previously formulated hypothesis that human skeletal muscle serves as a NO3− reservoir, at least in the case of m. vastus lateralis. However, [NO2−] was appreciably higher in muscle than blood, raising the possibility that, in humans, a muscle NO2− ‘store’ and/or a muscle-to-blood NO2− gradient may have functional significance.
Acknowledgements
Stefan Kadach was supported by a QUEX studentship, jointly provided by the University of Exeter and the University of Queensland.
References
- [1].Wagner JG, History of pharmacokinetics, Pharmacol Ther 12 (1981) 537–562. [DOI] [PubMed] [Google Scholar]
- [2].Moncada S, Palmer RMJ, Higgs EA, Nitric oxide: physiology, pathophysiology, and pharmacology, Pharmacol Rev 43 (1991) 109–142. [PubMed] [Google Scholar]
- [3].Lundberg JO, Weitzberg E, Gladwin MT, The nitrate-nitrite-nitric oxide pathway in physiology and therapeutics, Nat Rev Drug Discov 7 (2008) 156–167. [DOI] [PubMed] [Google Scholar]
- [4].DeMartino AW, Kim-Shapiro DB, Patel RP, Gladwin MT, Nitrite and nitrate chemical biology and signalling, Brit J Pharmacol 176 (2019) 228–245. [DOI] [PMC free article] [PubMed] [Google Scholar]
- [5].Jones AM, Vanhatalo A, Seals DR, Rossman MJ, Piknova B, Jonvik KL, Dietary nitrate and nitric oxide metabolism: mouth, circulation, skeletal muscle, and exercise performance, Med Sci Sports Exerc 53 (2021) 280–294. [DOI] [PubMed] [Google Scholar]
- [6].Spiegelhalder B, Eisenbrand G, Preussman R, Influence of dietary nitrate on nitrite content of human saliva: possible relevance to in vivo formation of N-nitroso compounds, Food Cosmet Toxicol 14 (1976) 545–548. [DOI] [PubMed] [Google Scholar]
- [7].Lundberg JO, Govoni M, Inorganic nitrate is a possible source for systemic generation of nitric oxide, Free Rad Biol Med 37 (2004) 395–400. [DOI] [PubMed] [Google Scholar]
- [8].Lundberg JO, Carlström M, Larsen FJ, Weitzberg E, Roles of dietary inorganicnitrate in cardiovascular health and disease, Cardiovasc Res 89 (2011) 525–532. [DOI] [PubMed] [Google Scholar]
- [9].Webb AJ, Patel N, Loukogeorgakis S, Okorie M, Aboud Z, Misra S, Rashid R, Miall P, Deanfield J, Benjamin N, MacAllister R, Hobbs AJ, Ahluwalia A, Acute blood pressure lowering, vasoprotective, and antiplatelet properties of dietary nitrate via bioconversion to nitrite, Hypertension 51 (2008) 784–790. [DOI] [PMC free article] [PubMed] [Google Scholar]
- [10].Wylie LJ, Kelly J, Bailey SJ, Blackwell JR, Skiba PF, Winyard PG, Jeukendrup AE, Vanhatalo A, Jones AM, Beetroot juice and exercise: pharmacodynamic and dose-response relationships, J Appl Physiol 115 (2013) 325–336. [DOI] [PubMed] [Google Scholar]
- [11].James PE, Willis GR, Allen JD, Winyard PG, Jones AM, Nitrate pharmacokinetics: taking note of the difference, Nitric Oxide 48 (2015) 44–50. [DOI] [PubMed] [Google Scholar]
- [12].Bartholomew B, Hill MJ, The pharmacology of dietary nitrate and the origin of urinary nitrate, Food Chem Tox 22 (1984) 789–795. [DOI] [PubMed] [Google Scholar]
- [13].Pannala AS, Mani AR, Spencer JPE, Skinner V, Bruckdorfer KR, Moore KP, Rice-Evans CA, The effect of dietary nitrate on salivary, plasma, and urinary nitrate metabolism in humans, Free Rad Biol Med 34 (2003) 576–584. [DOI] [PubMed] [Google Scholar]
- [14].McDonagh STJ, Wylie LJ, Webster JMA, Vanhatalo A, Jones AM, Influence of dietary nitrate food forms on nitrate metabolism and blood pressure in healthy normotensive adults, Nitric Oxide 72 (2018) 66–74. [DOI] [PubMed] [Google Scholar]
- [15].Piknova B, Park JW, Swanson KM, Dey S, Noguchi CT, Schechter AN, Skeletal muscle as an endogenous nitrate reservoir, Nitric Oxide 47 (2015) 10–16. [DOI] [PMC free article] [PubMed] [Google Scholar]
- [16].Piknova B, Park JW, Lam KK, Schechter AN, Nitrate as a source of nitrite and nitric oxide during exercise hyperemia in rat skeletal muscle, Nitric Oxide 55–56 (2016) 54–61. [DOI] [PMC free article] [PubMed] [Google Scholar]
- [17].Nyakayiru J, Kouw IWK, Cermak NM, Senden JM, van Loon LJC, Verdijk LB, Sodium nitrate ingestion increases skeletal muscle nitrate content in humans, J Appl Physiol 123 (2017) 637–644. [DOI] [PubMed] [Google Scholar]
- [18].Wylie LJ, Park JW, Vanhatalo A, Kadach S, Black MI, Stoyanov Z, Schechter AN, Jones AM, Piknova B, Human skeletal muscle nitrate store: influence of dietary nitrate supplementation and exercise, J Physiol 597 (2019) 5565–5576. [DOI] [PMC free article] [PubMed] [Google Scholar]
- [19].Piknova B, Schechter AN, Park JW, Vanhatalo A, Jones AM, Skeletal muscle nitrate as a regulator of systemic nitric oxide homeostasis, Exerc Sport Sci Rev 50 (2022) 2–13. [DOI] [PMC free article] [PubMed] [Google Scholar]
- [20].Bergström J, Percutaneous needle biopsy of skeletal muscle in physiological and clinical research, Scand J Clin Lab Invest 35 (1975) 609–616. [PubMed] [Google Scholar]
- [21].Pinder AG, Rogers SC, Khalatbari A, Ingram TE, James PE, The measurement of nitric oxide and its metabolites in biological samples by ozone-based chemiluminescence, Methods Mol Biol 476 (2008) 11–28. [DOI] [PubMed] [Google Scholar]
- [22].Piknova B, Schechter AN, Measurement of nitrite in blood samples using the ferricyanide-based hemoglobin oxidation assay, Methods Mol Biol 704 (2011) 39–56. [DOI] [PMC free article] [PubMed] [Google Scholar]
- [23].Jones AM, Thompson C, Wylie LJ, Vanhatalo A, Dietary nitrate and physical performance, Annu Rev Nutr 38 (2018) 303–328. [DOI] [PubMed] [Google Scholar]
- [24].Gilliard CN, Lam JK, Cassel KS, Park JW, Schechter AN, Piknova B, Effect of dietary nitrate levels on nitrate fluxes in rat skeletal muscle and liver, Nitric Oxide 75 (2018) 1–7. [DOI] [PMC free article] [PubMed] [Google Scholar]
- [25].Park JW, Thomas SM, Schechter AN, Piknova B, Control of rat muscle nitrate levels after perturbation of steady state dietary nitrate intake, Nitric Oxide 109 (2021) 42–49. [DOI] [PMC free article] [PubMed] [Google Scholar]
- [26].Park JW, Thomas SM, Wylie LJ, Jones AM, Vanhatalo A, Schechter AN, Piknova B, Preparation of rat skeletal muscle homogenates for nitrate and nitrite measurements, J Vis Exp Jul 29 (173) (2021). [DOI] [PubMed] [Google Scholar]
- [27].Burleigh MC, Liddle L, Monaghan C, Muggeridge DJ, Sculthorpe N, Butcher JP, Henriquez FL, Allen JD, Easton C, Salivary nitrite production is elevated in individuals with a higher abundance of oral nitrate-reducing bacteria, Free Rad Biol Med 120 (2018) 80–88. [DOI] [PubMed] [Google Scholar]
- [28].Capper TE, Siervo M, Clifford T, Taylor G, Iqbal W, West D, Stevenson EJ, Pharmacokinetic profile of incremental oral doses of dietary nitrate in young and older adults: a crossover randomized clinical trial, nxab354, J Nutr (2021), 10.1093/jn/nxab354 (Online ahead of print). [DOI] [PMC free article] [PubMed] [Google Scholar]
- [29].Qin L, Liu X, Sun Q, Fan Z, Xia D, Ding G, Ong HL, Adams D, Gahl WA, Zheng C, Qi S, Jin L, Zhang C, Gu L, He J, Deng D, Ambudkar IS, Wang S, Sialin (SLC17A5) functions as a nitrate transporter in the plasma membrane, Proc Natl Acad Sci USA 109 (2012) 13434–13439. [DOI] [PMC free article] [PubMed] [Google Scholar]
- [30].Srihirun S, Park JW, Teng R, Sawaengdee W, Piknova B, Schechter AN, Nitrate uptake and metabolism in human skeletal muscle cell cultures, Nitric Oxide 94 (2020) 1–8. [DOI] [PMC free article] [PubMed] [Google Scholar]
- [31].Wagner DA, Schultz DS, Deen WM, Young VR, Tannenbaum SR, Metabolic fate of an oral dose of 15N-labeled nitrate in humans: effect of diet supplementation with ascorbic acid, Cancer Res 43 (1983) 1921–1925. [PubMed] [Google Scholar]
- [32].Dejam A, Hunter CJ, Schechter AN, Gladwin MT, Emerging role of nitrite in human biology, Blood Cells Mol Dis 32 (2004) 423–429. [DOI] [PubMed] [Google Scholar]
- [33].Gladwin MT, Schechter AN, Kim-Shapiro DB, Patel RP, Hogg N, Shiva S, Cannon RO, Kelm M, Wink DA, Espey MG, Oldfield EH, Pluta RM, Freeman BA, Lancaster JR, Feelisch M, Lundberg JO, The emerging biology of the nitrite anion, Nat Chem Biol 1 (2005) 308–314. [DOI] [PubMed] [Google Scholar]
- [34].Duncan C, Dougall H, Johnston P, Green S, Brogan R, et al. , Chemical generation of nitric oxide in the mouth from the enterosalivary circulation of dietary nitrate, Nat Med 1 (1995) 546–551. [DOI] [PubMed] [Google Scholar]
- [35].Cosby K, Partovi KS, Crawford JH, Patel RP, Reiter CD, Martyr S, Yang BK, Waclawiw MA, Zalos G, Xu X, Huang KT, Shields H, Kim-Shapiro DB, Schechter AN, Cannon RO, Gladwin MT, Nitrite reduction to nitric oxide by deoxyhemoglobin vasodilates the human circulation, Nat Med 9 (2003) 1498–1505. [DOI] [PubMed] [Google Scholar]
- [36].Kapil V, Milsom AB, Okorie M, Maleki-Toyserkani S, Akram F, Rehman F, Arghandawi S, Pearl V, Benjamin N, Loukogeorgakis S, MacAllister R, Inorganic nitrate supplementation lowers blood pressure in humans: role for nitrite-derived NO, Hypertension 56 (2010) 274–281. [DOI] [PubMed] [Google Scholar]
- [37].Flueck JL, Bogdanova A, Mettler S, Perret C, Is beetroot juice more effect than sodium nitrate? The effects of equimolar nitrate dosages of nitrate-rich beetroot juice and sodium nitrate on oxygen consumption during exercise, Appl Physiol Nutr Metab 41 (2016) 421–429. [DOI] [PubMed] [Google Scholar]
- [38].Ferguson SK, Hirai DM, Copp SW, Holdsworth CT, Allen JD, Jones AM, Musch TI, Poole DC, Impact of dietary nitrate supplementation via beetroot juice on exercising muscle vascular control in rats, J Physiol 591 (2013) 547–557. [DOI] [PMC free article] [PubMed] [Google Scholar]
- [39].Ferguson SK, Holdsworth CT, Wright JL, Fees AJ, Allen JD, Jones AM, Musch TI, Poole DC, Microvascular oxygen pressures in muscles comprised of different fiber types: impact of dietary nitrate supplementation, Nitric Oxide 48 (2015) 38–43. [DOI] [PMC free article] [PubMed] [Google Scholar]
- [40].Jones AM, Ferguson SK, Bailey SJ, Vanhatalo A, Poole DC, Fiber type-specific effects of dietary nitrate, Exerc Sport Sci Rev 44 (2016) 53–60. [DOI] [PubMed] [Google Scholar]
- [41].Staron RS, Hagerman FC, Hikida RS, Murray TF, Hostler DP, Crill MT, Ragg KE, Toma K, Fiber type composition of the vastus lateralis muscle of young men and women, J Histochem Cytochem 48 (2000) 623–629. [DOI] [PubMed] [Google Scholar]