Abstract
The hippocampal CA2 region is essential for social memory. To determine whether CA2 activity encodes social interactions, we recorded from CA2 pyramidal neurons in male mice during social behavior. While CA2 neuronal firing showed only weak spatial selectivity, it accurately encoded contextual changes and distinguished between a novel and familiar mouse. In the Df(16)A+/− mouse model of the human 22q11.2 microdeletion, which confers a 30-fold increased risk of schizophrenia, CA2 social coding was impaired, consistent with the social memory deficit observed in these mice; in contrast, spatial coding accuracy was greatly enhanced. CA2 pyramidal neurons were previously found to be hyperpolarized in Df(16)A+/− mice, likely due to upregulation of TREK-1 K+ current. We found that TREK-1 blockade rescued social memory and CA2 social coding in Df(16)A+/− mice, supporting a crucial role for CA2 in the normal encoding of social stimuli and in social behavioral dysfunction in disease.
Introduction
Social memory is indispensable for a wide range of social behaviors1. Deficits in social memory and social behavioral changes are commonly associated with neuropsychiatric disease2. Lesion studies in both humans3 and rodents4 indicate that the hippocampus is necessary not only for several forms of declarative memory5 but also for encoding social memory. Although the ability of hippocampal neural firing to represent spatial, contextual and semantic information that may contribute to memory encoding has been well established6–9, how hippocampus encodes and represents social information is less well understood.
The hippocampal CA2 subregion is a critical component of the circuit necessary for encoding social information into declarative memoryl10–12. Social memory depends on the CA2 projections to ventral CA110, an area that is also required for social memory and that can encode social engrams13,14. However, it is unclear as to whether and how dorsal CA2 itself encodes social information.
CA2 spatial firing properties differ from those of dorsal CA1 and CA3 regions: CA2 place fields have less spatial information than those in CA1 or CA315–18, are spatially unstable in the same environment over time15 (unlike those in CA1), and CA2 activity is more sensitive to contextual change than CA1 and CA319. Of interest, CA2 place fields globally remap in the presence of novel objects or of familiar or novel social stimuli16, although whether CA2 firing contains specific social information that is relevant to social memory remains unknown.
The role of CA2 in social memory is of clinical relevance as postmortem hippocampal tissue from individuals with schizophrenia or bipolar disorder reveal a 30% decrease in the number of parvalbumin positive interneurons selectively in CA220,21. CA2-selective loss of PV+ interneurons is also observed in the Df(16)A+/− mouse model of the human 22q11.2 microdeletion22, which confers a 30-fold increase in the risk of developing schizophrenia23. Although reduced inhibition might be expected to enhance CA2 pyramidal neuron (PN) activity and thus enhance social memory, these mice actually have a profound deficit in social memory22. This may reflect the concomitant hyperpolarization and decreased excitability seen in CA2 PNs, which is thought to be due to increased current through TREK-1 two-pore K+ channels22, whose mRNA expression is normally highly enriched in CA224. Whether and how the opposing actions of decreased CA2 PN inhibition and enhanced TREK-1 hyperpolarizing current affect in vivo CA2 PN firing and/or contribute to social memory deficits of the Df(16)A+/− mice is unknown. Here we addressed these questions using extracellular electrophysiological recordings from dorsal CA2 PNs and behavioral analysis in both wild-type and Df(16)A+/− mice during spatial exploration and social interactions.
Results
CA2 spatial firing was unstable during a three-chamber social interaction task
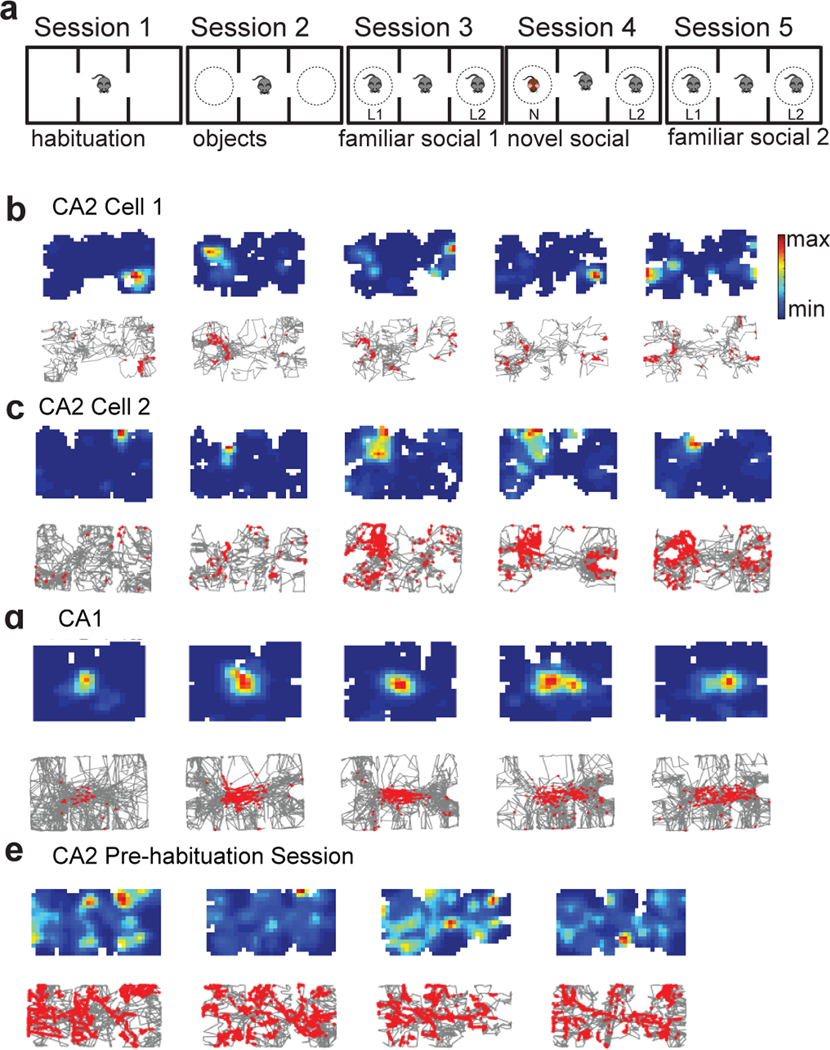
We recorded single unit activity from dorsal CA2 and CA1 pyramidal neurons as mice performed a three-chamber social interaction task (Figure 1a) in which mice explored in five sequential 10-minute sessions chambers that: 1) were void of all objects (empty chamber session); 2) contained two identical empty wire cup cages (novel objects session); 3) contained familiar littermates (L1 and L2), one in each cage (familiar social session 1); 4) contained a novel mouse in one cup and one of the littermates in the other (novel social session); and 5) contained both original littermates (familiar social session 2).
Figure 1. Hippocampal firing in the three-chamber interaction task.
a, The three-chamber interaction task. Mice explored the following three-chamber environments in five sequential 10-min sessions: 1) empty arena (empty session), 2) two identical novel objects (empty wire cup cages) placed in the two side chambers (objects session), 3) two familiar littermates (L1 and L2) placed one in each cup (familiar social session 1; fam1), 4) a novel mouse (N) present in one cup and the remaining littermate present in the other cup (novel social session), 5) return to the two original familiar mice (familiar social session 2; fam2). b, Top: Example CA2 neuron place cell heat maps (top). Bottom: single spikes (red dots) on top of trajectory trace (gray). Maximum firing rates in sessions 1–5 were: 7 Hz, 7 Hz, 9 Hz, 9 Hz, and 5 Hz, respectively. c, Example CA2 neuron that was nearly silent in non-social sessions 1 and 2 but became active in social sessions 3–5. Maximum firing rates in sessions 1–5 were: 1 Hz, 2 Hz, 15 Hz, 22 Hz, 10 Hz. d, Example CA1 cell showing stable place fields throughout all sessions. Maximum firing rates in sessions 1–5 were: 1 Hz, 5 Hz, 7 Hz, 4 Hz, 4 Hz. e, Example firing of a CA2 cell during four 10-min successive sessions of a 40 min pre-habituation period to the empty chambers. Maximum firing rates in sessions 1–4 were: 19 Hz, 34 Hz, 13 Hz, 19 Hz.
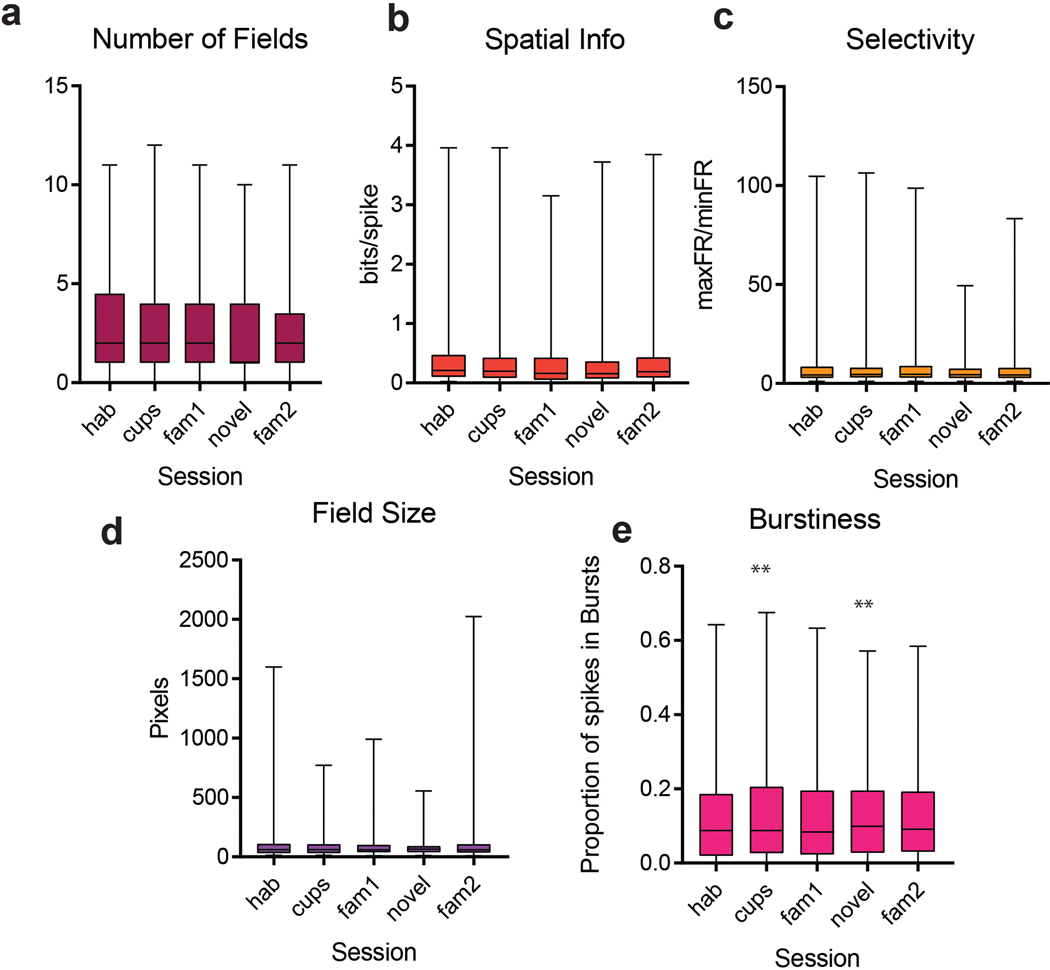
CA2 PNs showed only weak spatially selective firing as an animal explored the three chambers in the five sessions (Figure 1b,c), consistent with previous reports15–17. Analysis of data from 192 CA2 neurons from 6 animals and 87 CA1 neurons from 3 animals revealed that CA2 PNs have more place fields per cell (CA2 = 2.61 ± 0.12 fields; CA1 = 2.0 ± 0.15 fields; p=0.02, unpaired t-test), larger place fields (CA2=107.3 ± 10.1 pixels; CA1=62.94 ± 5.96 pixels; p=0.04, unpaired t-test), and lower spatial information scores than CA1 (CA2 = 0.42 ± 0.02 bits/spike; CA1 = 0.60 ± 0.09 bits/spike; p < 0.001, unpaired t-test). Representative examples are shown in Figure 1 and Extended Data Figure 1. Our results are in agreement with previous studies showing that CA2 firing is less spatially selective than that of CA115,17,18,25. The number and size of CA2 place fields, along with the amount of spatial information, did not vary from session to session in the three-chamber task (Extended Data Figure 1). Quantitative differences in spatial information scores between our study and previous results, for both CA1 and CA2, are likely explained by our use of multi-chamber environment, which is known to decrease absolute values of spatial selectivity26–28.
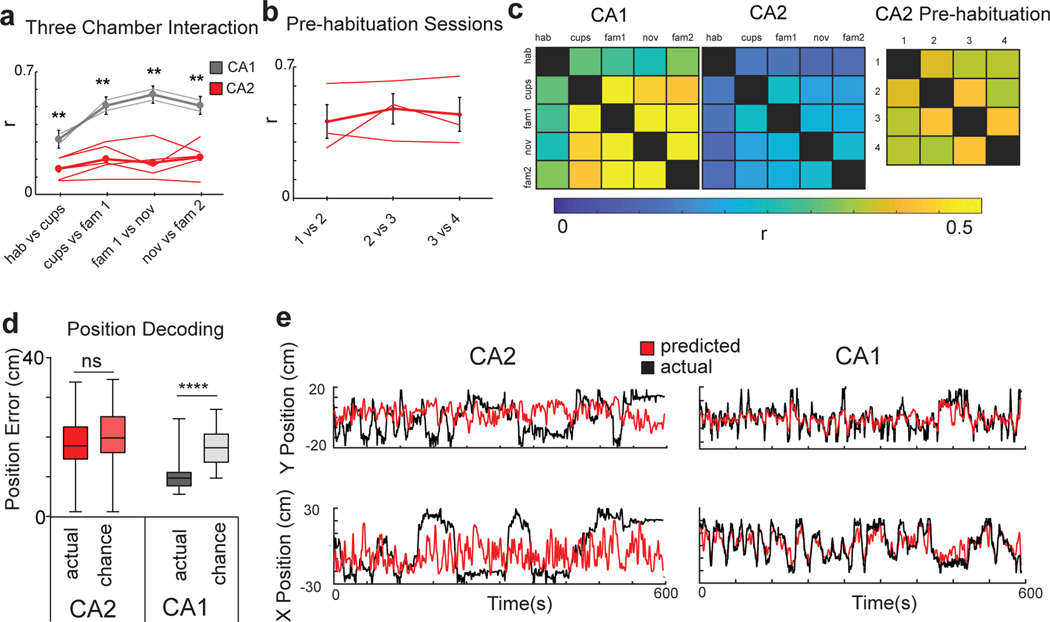
CA2 place fields were also less spatially stable across the different sessions of the three-chamber task in comparison to CA1. This was evident in both individual cell firing plots (Figure 1b–d), and in measurements of Pearson’s correlation values (r) of place fields between different sessions (Figure 2a, c). Of interest, compared to the three-chamber task, CA2 spatial firing was significantly more stable throughout a 40-minute-long pre-habituation session to the empty three-chamber environment that was run on the day prior to the three-chamber task (Figures 1e and 2b,c), suggesting that alterations in the content of the chambers decreases stability of spatial firing (Figure 2b).
Figure 2. CA2 spatial firing is unstable and fails to decode position.
a, Pearson’s correlation (r) between place field maps in successive pairs of the five three-chamber task sessions for CA2 and CA1 neurons. Thin traces show results from individual animals and thick traces show means (n=192 CA2 neurons from 6 animals; n=87 CA1 neurons from 3 animals). Error bars show SEM. CA2 firing was less stable than CA1 firing (paired two-sided t-tests with Bonferroni correction for multiple comparisons; p = 0.02, 0.006, 0.003, 0.009). b, CA2 place field correlations between successive pairs of the four 10-min pre-habituation sessions (n=103 CA2 neurons from 4 animals). Data is presented as mean ± SEM. c, Left, Color-coded plots of mean spatial correlations between each pair of sessions averaged over all CA2 and CA1 neurons in three-chamber task. Right, CA2 neuron correlations for pairs of sessions during the 40-min pre-habituation period. d, Mean error of position with support vector machine (SVM) decoding based on CA2 and CA1 population spatial firing data in three-chamber task compared to chance performance. CA1 decoding performed above chance (p<0.0001, two-sided Wilcoxon rank-sum test; n=87 neurons from 3 animals) whereas CA2 did not (p=0.42; n=192 neurons from 6 animals). For all box plots displayed the center line is the mean; box limits are upper and lower quartiles; whiskers show min to max values in data sets. e, Example of SVM position decoding with a linear kernel from CA2 and CA1 neuron firing from individual mice. Actual X-Y position trajectory (black traces) and predicted location (red traces) decoded from CA2 and CA1 firing (smoothed for visualization). Location plotted relative to center of the three-chamber environment. *p<0.05, **p<0.01, ***p<0.001, ****p<0.0001.
Addition of a social stimulus was previously reported to enhance the stability of CA2 spatial firing16. However, we found that the spatial correlation between the two familiar mice sessions (sessions 3 versus 5; r = 0.21 ± 0.22), which contained the same social stimuli at the same locations, was no greater than the spatial correlations between the object and familiar social sessions (sessions 2 versus 3/5; r = 0.23 ± 0.24), or the novel and familiar social sessions (sessions 3 versus 4; r = 0.25 ± 0.27; p>0.05 in all comparisons, paired t-tests), indicating that in our task social content did not stabilize spatial firing (Figure 2a,c).
CA2 population activity encoded contextual but not spatial information in the three- chamber task
Populations of neurons have been found to accurately encode aspects of an environment even if individual neurons do not. For example, PNs in dentate gyrus29 and ventral CA130, which have lower spatial information content compared to dorsal CA1 neurons, can encode position at the population level as accurately as dorsal CA1. To examine whether this was the case for dorsal CA2 pyramidal neurons, we used a machine learning approach. A set of support vector machines (SVM)31–33 using a linear kernel were trained to decode the position of an animal as it explored the three chambers based on CA1 or CA2 population activity. Whereas the decoder based on CA1 activity accurately predicted an animal’s location in all sessions of the three-chamber task, the decoder based on CA2 activity failed to predict spatial location above chance levels during any of the sessions (Figure 2d,e; Extended Data Figure 2). The finding that spatial position could be decoded from CA1 activity but not CA2 activity was confirmed using a Bayesian decoder (Extended Data Figure 3). The SVM also failed to decode position using CA2 firing in any of the four 10-min sessions of the 40 min period of pre-habituation to the empty chambers, indicating that CA2 also provided weak spatial representations of a constant, empty environment (Extended Data Figure 2).
Next we examined whether the sensitivity of CA2 firing to contextual change19 was sufficient to decode the changes in environmental content in the five sessions of the three-chamber task, and whether there were any differences in decoding ability of CA2 compared to CA1. Indeed, when we trained a linear decoder using CA2 population activity to determine in which session an animal was engaged, the decoder performed significantly better than chance and outperformed a CA1-based decoder (Figure 3a,b).
Figure 3. CA2 encodes contextual changes and the presence of social stimuli.
a, SVM decoder performance for identifying in which of the 5 sessions of the three-chamber task or 4 sessions of the pre-habituation session a mouse was engaged. Decoder trained on either CA2 (dark red) or CA1 (dark grey) firing during three-chamber task performed significantly better than chance (lighter shaded bars): CA2, p < 0.0001 (n=192 neurons from 6 animals); CA1, p =0.009 (n=87 neurons from 3 animals). CA2 three-chamber session decoding accuracy was significantly greater than CA1 (p=0.007, two-sided Wilcoxon rank-sum test). Decoder trained on CA2 activity during four 10-min sessions of pre-habituation period predicted pre-habituation session slightly above chance (p=0.03, n=94 neurons from 4 animals). Accuracy of pre-habituation session decoding was significantly lower than that for three-chamber session decoding (p=0.03). The ratio of performance over chance accuracy was significantly higher in the three-chamber sessions (2.1 ± 0.09) compared to pre-habituation sessions (1.2 ± 0.06; p=0.002). Box plots display the center line as the mean; box limits are upper and lower quartiles; whiskers show min to max values in data sets. b, CA1 and CA2 color-coded decoding accuracy for all possible session pairs in three-chamber task (one vs one decoder). c, 40/192 CA2 PNs significantly increased their firing rate in the presence of social stimuli (difference in normalized firing rate > 2 standard deviations from the non-social sessions to the social sessions, see Extended Data Figure 4 for more information). *p<0.05, **p<0.01, ***p<0.001, ****p<0.0001.
To determine whether the ability of CA2 firing to decode session reflected the encoding of information about the content in a given session versus the marking of passage of time due to spatial drift15, we trained a decoder on CA2 activity in the four identical sessions of the 40 min pre-habituation period, where there was no change in content. Although the decoder was able to distinguish among the four 10 min sessions slightly above chance level (p=0.03), decoder accuracy was significantly below that observed for the three-chamber task (p=0.01; Figure 3a), with the ratio of performance accuracy to chance accuracy in the three-chamber task (2.1 ± 0.09) significantly larger than in the pre-habituation sessions (1.2 ± 0.06; p=0.002, t-test). We thus conclude that CA2 contains significant information about environmental content in addition to any information about the passage of time. This conclusion is further supported by our finding that CA2 place fields were more stable in the 40 min pre-habituation session compared to the three-chamber task (Figure 2 a,b) and by findings on social coding presented below.
A subset of CA2 cells increased their firing rate in the presence of a social stimulus
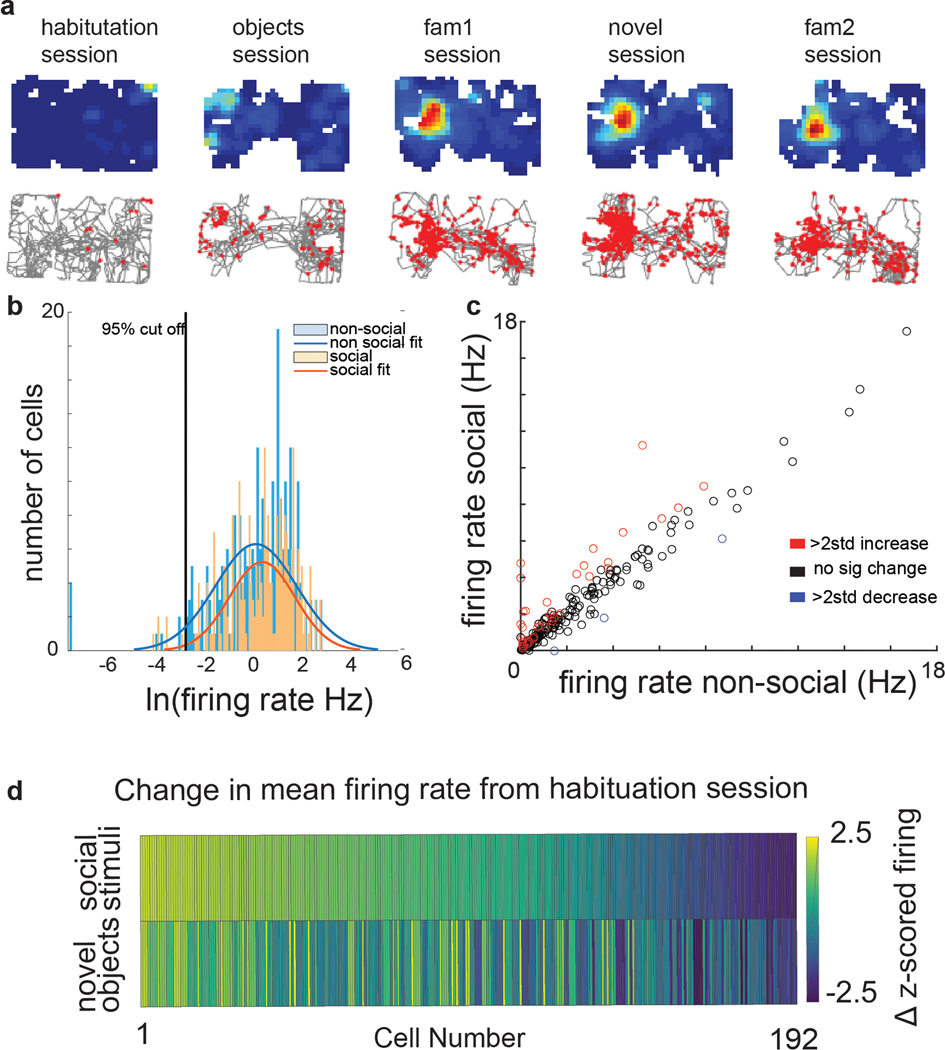
We next explored whether CA2 PN firing was sensitive to the presence of another mouse (a social stimulus). The mean z-scored firing rate of CA2 neurons differed significantly among the non-social and social sessions of the three-chamber task (ANOVA; p=0.0004), whereas CA1 firing remained relatively constant (ANOVA p=0.29). Moreover, 40/192 (~20%) of individual CA2 neurons significantly increased their mean z-scored firing rate (>2) during the social sessions (3–5) compared to the non-social sessions (1 and 2) (Figure 3c). In addition, 12 of the 40 neurons were initially silent (or nearly so) in the two preceding non-social sessions, with an initial firing rate in the bottom 5% of the population (<0.007 Hz; Extended Data Figure 4). The increase in activity did not reflect random shifts in firing as only 3/192 (<2%) of CA2 cells were significantly more active during the non-social sessions than the social sessions, and none active during non-social sessions fell silent during social sessions. The mean firing rate of CA2 neurons was significantly greater in the social compared to non-social sessions (Extended Data Figure 4c). In contrast only 2/87 CA1 cells significantly increased their firing rate (z-score >2) in the social compared to non-social sessions, similar to the 3/87 fraction of CA1 cells that fired significantly more during the non-social sessions.
Although CA2 firing has been found to respond to both novel objects and social stimuli16, silencing of CA2 impairs social but not object memory11, suggesting that CA2 responds differently to these stimuli. Indeed, the difference in CA2 PN firing rates between the empty arena and object session was significantly different from the difference in firing rate between the empty arena and social sessions (p= 5.8 × 10−37; Wilcoxon rank-sums test; (Extended Data Figure 4).
CA2 encodes social novelty
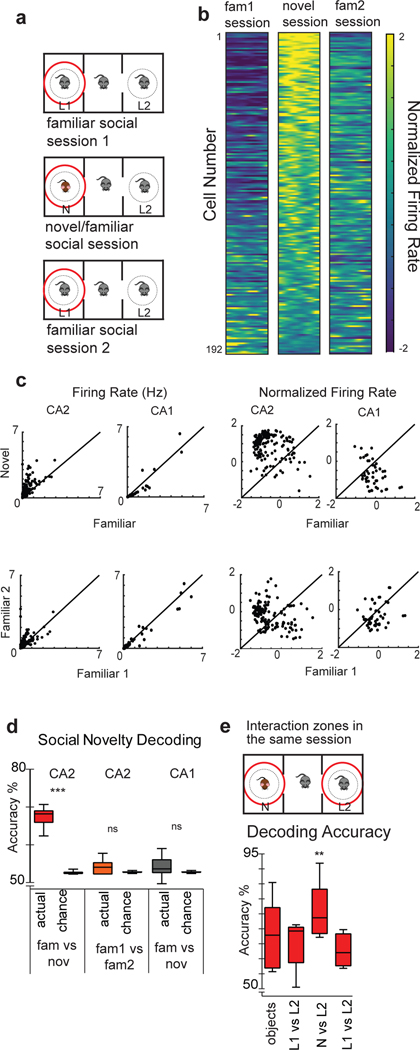
To determine whether CA2 encodes specific social information that could contribute to social memory, we examined CA2 firing while an animal was exploring within an interaction zone (7cm, a body length) of the cups (Figure 4a). To limit potential spatial firing contributions, we compared CA2 firing among different sessions within the same interaction zone around the cup that contained the novel mouse in session 4. We found that 77/192 CA2 PNs showed a significant (<2 SD) increase in firing during interactions with a novel mouse compared to a familiar mouse (Figure 4b,c). Some CA2 PNs maintained an increase in firing around the novel animal throughout the 10 min period of a given social session, whereas other neurons increased their firing only transiently during the initial encounters with the novel animal (Figure 4b). As a result, the mean CA2 population z-scored firing rate when an animal was exploring around a novel animal (0.83 ± 0.06) was significantly greater than the firing rate around the familiar littermate in the flanking sessions (−0.26 ± 0.04; Mann Whitney U<0.0001) (Figure 4b,c). Moreover, the population firing rates around the novel animal differed significantly from that around the familiar animal (averaged from sessions 3 and 5; p<0.0001, Wilcoxon rank-sum test).
Figure 4. CA2 codes for novel social information.
a, Protocol for measuring CA2 firing rate in all three social sessions when a subject mouse was within the same 7-cm-wide interaction zone around the same cup that contained the novel animal. b, Color-coded Z-scored firing rate in the interaction zone over the time course of the three social sessions for all 192 neurons. Interactions were divided into 50 time bins and firing rate was calculated for each bin to visualize CA2 activity over the course of an interaction (see Extended Data Figure 4 for CA1 data). The population firing rate vector around the novel animal differed significantly from the familiar firing rate vector (p= 0.02, two-sided Wilcoxon rank-sum test). c, Plot of firing rate in the interaction zone around the novel versus familiar mouse (the latter averaged across the two familiar sessions). Each point is a separate cell. None of the CA1 firing rate vectors in the interaction zone are significantly different from one another. Normalized FRs are shown to the left. d, A linear decoder trained on CA2 activity in the interaction zone performed significantly above chance in decoding interactions with a novel (session 4) versus familiar mouse (sessions 3 and 5; p < 0.0001, two-sided Wilcoxon rank-sum test). The CA2-based decoder failed to decode interactions with the same familiar mouse in session 3 (fam1) versus session 5 (fam2). A decoder based on CA1 activity failed to distinguish interactions between the novel and familiar mouse. (n=192 CA2 neurons from 6 animals; n=87 CA1 neurons from 3 animals). e, Performance of a linear decoder trained on CA2 firing in interaction zones around left and right cups in a single session to determine which cup the mouse was around. The two interaction zones could be distinguished in all sessions significantly above chance (p < 0.0001, two-sided Wilcoxon rank-sum test). Decoding accuracy was significantly enhanced in the novel mouse session (session 4) compared to the other three sessions (p =0.004 Wilcoxon rank sum post hoc to Kruskal-Wallis). Box plots display the center line as the mean; box limits are upper and lower quartiles; whiskers show min to max values in data sets. *p<0.05, **p<0.01,***p<0.001, ****p<0.0001.
In contrast to the enhanced firing to social novelty, individual CA2 neuron firing rates around the same familiar mouse in session 3 compared to session 5 did not differ significantly (Figure 4b,c). Only a small fraction of cells showed a normalized firing rate difference greater than 2 to the same familiar animal (5/192), similar to that predicted by chance for a normal distribution. There was no significant difference in the two firing rate vectors to the same familiar animal (p>0.05, Wilcoxon rank-sum test). These results indicate that the increased firing to a novel mouse compared to a familiar mouse measured in sequential sessions was not simply due to the passage of time or to CA2 variability as the difference in time between the two familiar mouse sessions was twice that in the novel versus familiar mouse sessions. Finally, CA1 firing showed no significant change to the novel animal under the same conditions (Figure 4c, Extended Data Figure 5), confirming recent results14 and the importance of dorsal CA210−12 but not dorsal CA113 in social memory.
To examine whether CA2 firing was specifically tuned to social novelty versus other types of novel experiences, we examined CA2 firing around the wire cages (session 2) compared to that at the same location in the empty arena (session 1) since the cups represented novel objects. Although the CA2 z-scored firing rate around the empty cup (0.40 ± 0.06) was greater than that in the empty arena session (−0.48 ± .05; p<0.01, Wilcoxon rank-sum test), the increased firing around the novel animal (0.83 ± 0.06) was significantly greater than that around the novel object (p=0.009, Wilcoxon rank-sum test; Extended Data Figure 5).
To explore further the social information content in CA2 firing, we asked whether a linear decoder could detect the presence of a familiar mouse versus a novel mouse (Figure 4d). Indeed, CA2 population activity accurately decoded social interactions with the novel mouse versus the familiar mouse located in the same cup as the novel mouse among the three social sessions (p < 0.0001, Wilcoxon rank-sum test). In contrast, social novelty could not be decoded from CA1 population activity. Importantly, CA2 activity failed to distinguish interactions with the same familiar mouse in session 3 compared to session 5, confirming that it was specific responses to the different social stimuli that drove decoder performance rather than simply the passage of time over the three social sessions.
As an additional probe of CA2 information content, we determined whether a decoder could discriminate in a single session whether a subject mouse was exploring within the interaction zone around the cup in the left chamber versus the cup in the right chamber, a comparison that incorporates both spatial and non-spatial cues (Figure 4e). In all four sessions that contained the cups (sessions 2–5), the decoder distinguished whether an animal was exploring the left versus right interaction zones at a level significantly better than chance. The ability of CA2 firing to decode left from right in the empty cup session 2, in which two identical objects were present, suggests that CA2 firing may contain coarse spatial information sufficient to distinguish right from left (although decoder performance may have been driven by subtle physical differences in the two cups). Of particular note, left-right decoder performance was significantly enhanced in the novel mouse session compared to either the object session or the two familiar mice sessions (Figure 4e), supporting the view that CA2 firing contained significant information on social novelty.
CA2 neurons in Df(16)A+/− mice showed altered spatial, contextual and social firing
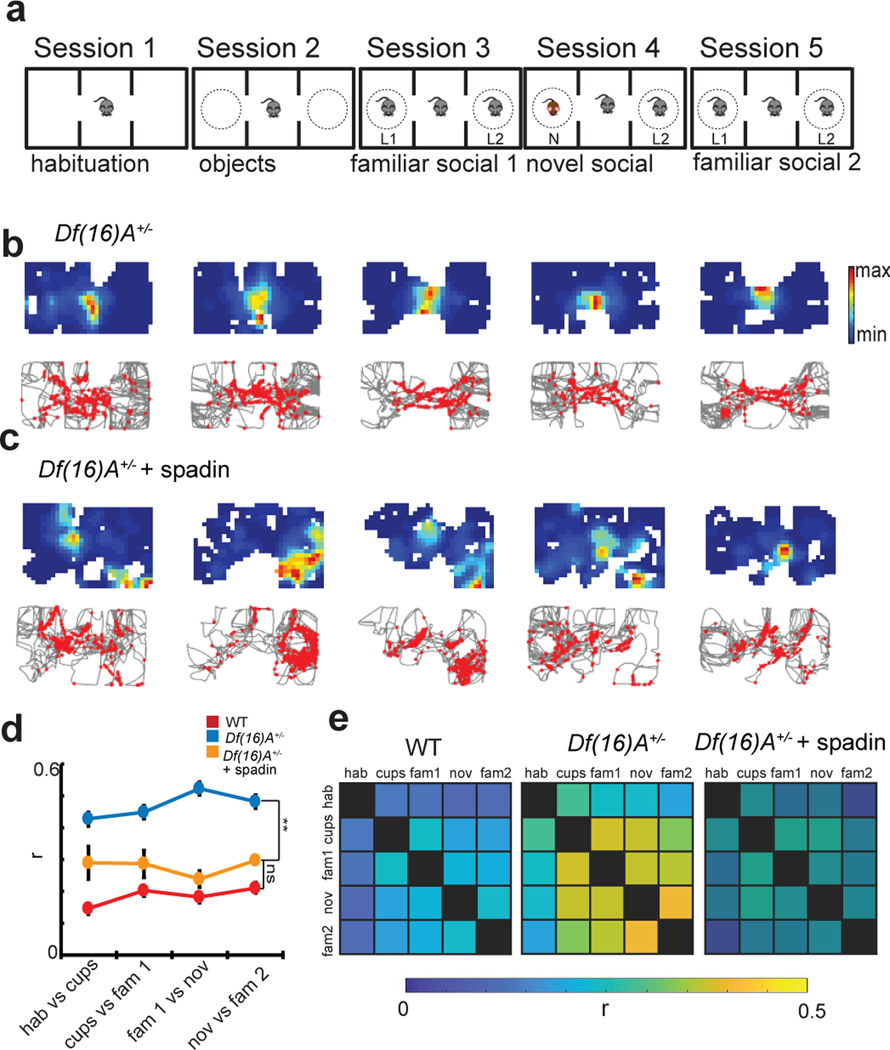
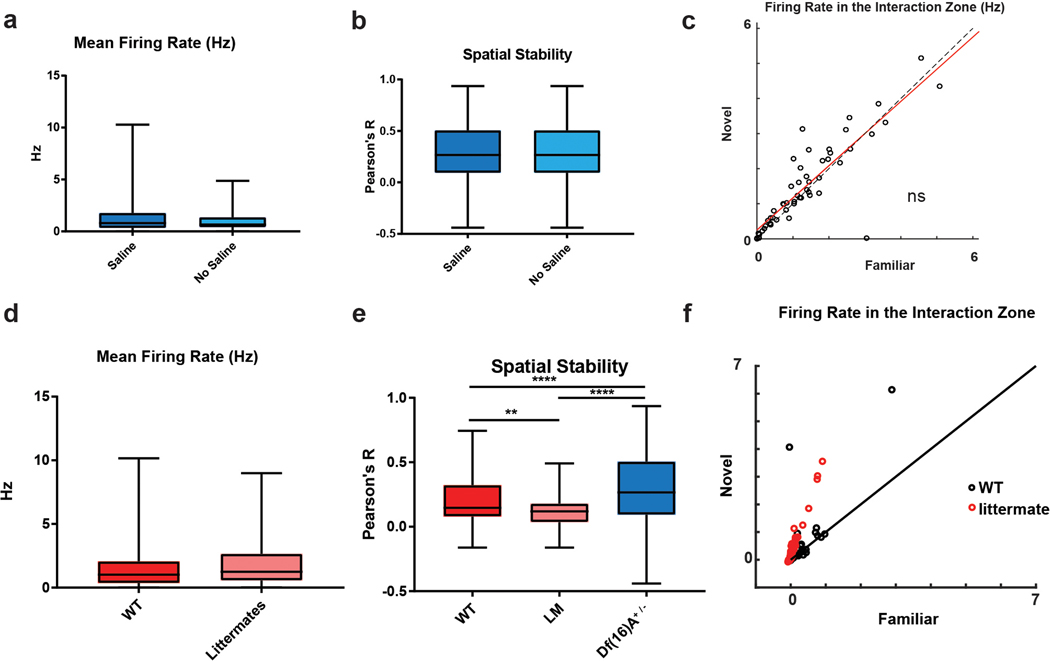
Are the social firing properties of CA2 PNs altered in mouse models of human disease with known deficits in social memory? To test this possibility, we recorded the activity of 128 CA2 neurons during the three-chamber task from five Df(16)A+/− mice (Figure 5a; Extended Data Figure 6). The mean firing rate of CA2 neurons from Df(16)A+/− mice during the five sessions of the three-chamber task was significantly decreased compared to that in two groups of wild-type mice, unrelated wild-type mice of the same C57Bl/6J genetic background and wild-type littermates (Extended Data Figure 6, Extended Data Figure 7). This suggests that the inhibitory effect of CA2 PN hyperpolarization in these mice due to TREK-1 upregulation may predominate over the excitatory effect of decreased feedforward inhibition22.
Figure 5. Spatial firing of CA2 neurons in Df(16)A+/− mice and effect of systemic injection of TREK-1 antagonist spadin.
a, Three-chamber task used to assess firing of CA2 neurons from Df(16)A+/− mice in absence or presence of spadin. b, Spatial firing of example CA2 neuron from a Df(16)A+/− mouse (maximum firing rates in sessions 1–5 were: 5, 2, 4, 2, and 2 Hz). c, Spatial firing of CA2 neuron from different Df(16)A+/− mouse that was injected with spadin 30 min prior to start of recordings (maximum firing rates in sessions 1–5 were: 2, 7, 17, 2, and 12 Hz). d, Place field stability between pairs of consecutive sessions for indicated groups of mice. Data is presented as mean ± SEM. e, Place field stability between all pairs of sessions for the three groups of mice. Wild-type data in d and e was same as shown in Figure 2. Df(16)A+/− mice in absence of spadin: n=128 neurons from 5 mice. Df(16)A+/− mice in presence of spadin: n=91 neurons from 5 mice. *p<0.05, **p<0.01,***p<0.001, ****p<0.0001.
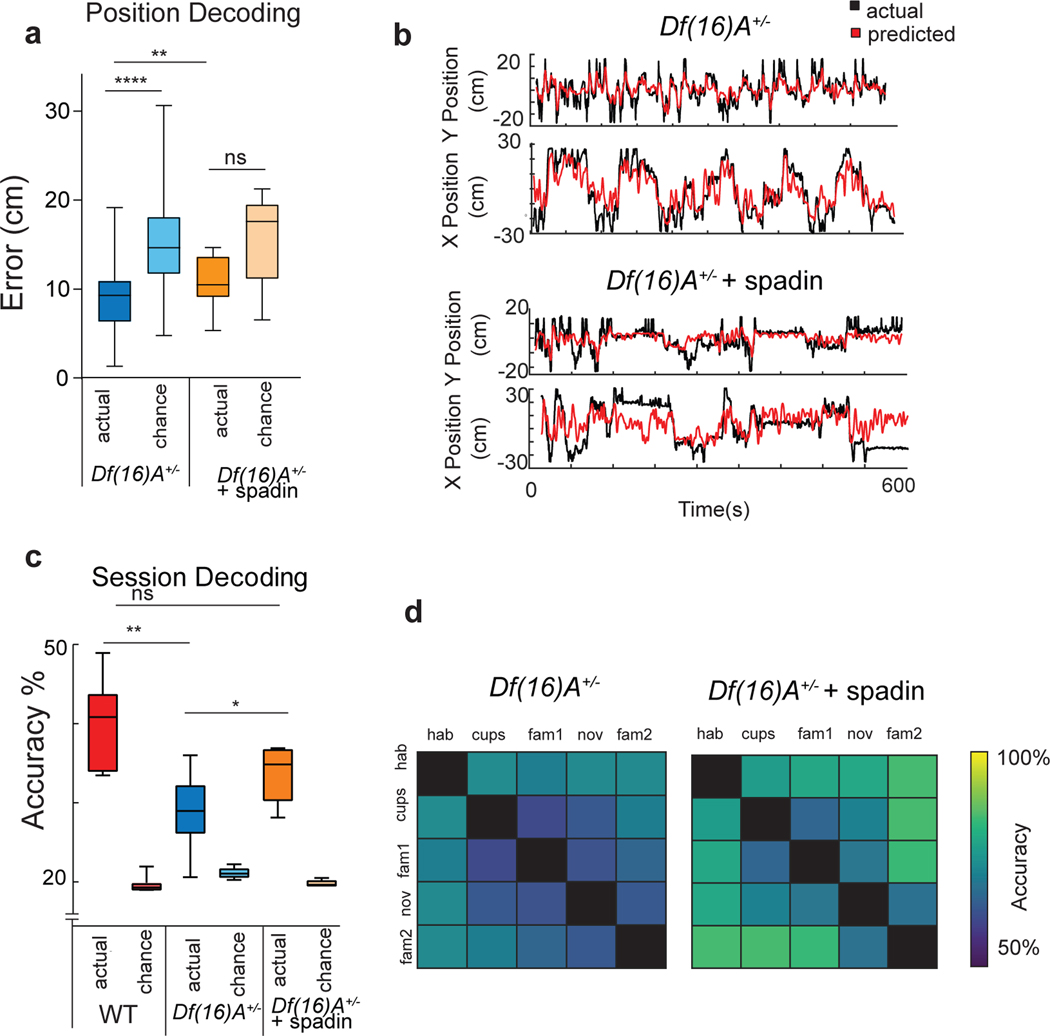
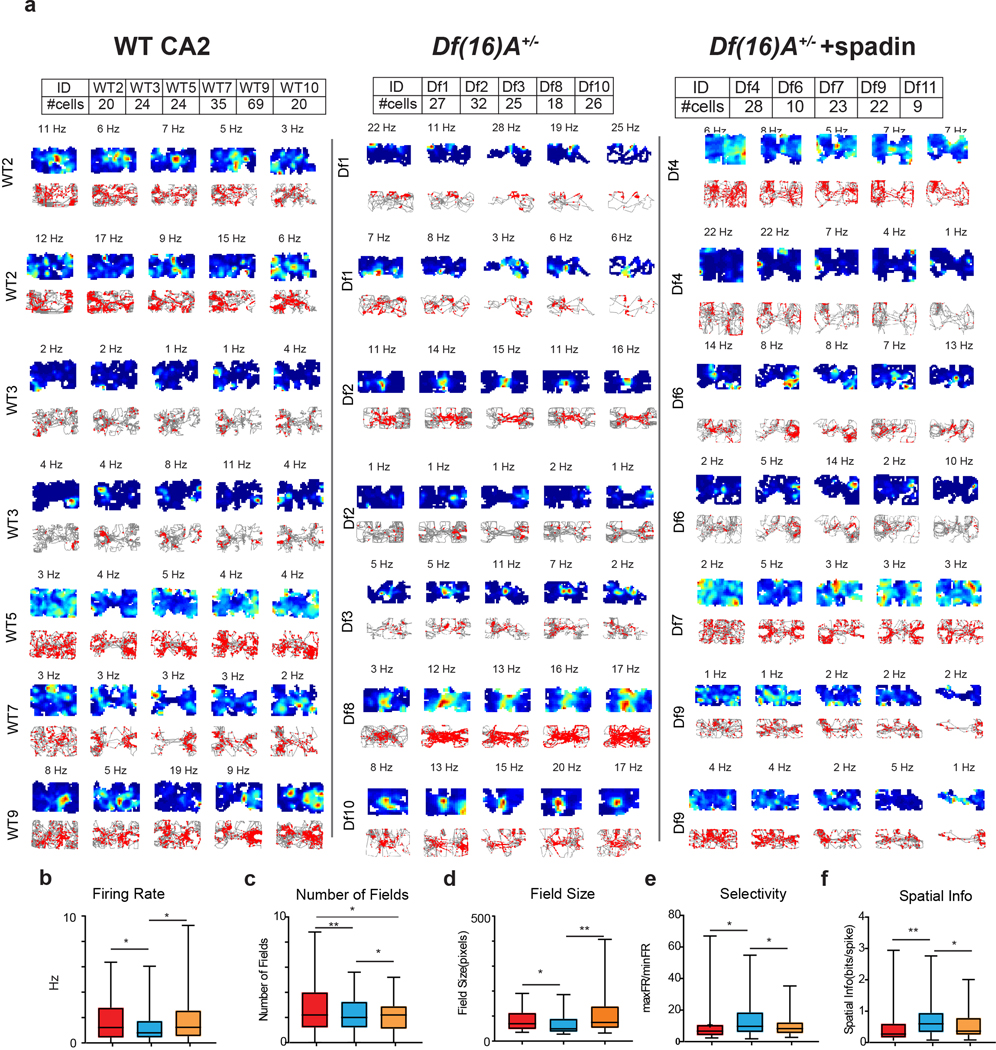
Surprisingly, the spatial coding properties of CA2 neurons in the mutant strain were significantly enhanced so that they more closely resembled the spatial coding characteristic of CA1 pyramidal cells (Figure 5, Extended Data Table 1, Extended Data Figure 6). Thus, CA2 neuron spatial firing in Df(16)A+/− mice showed a significant increase in stability across the sessions of the three-chamber task in (Figure 5c,d). Moreover, CA2 PNs in Df(16)A+/− mice had fewer and smaller place fields with a higher average spatial information and selectivity compared to wild-type mice (Extended Data Figure 6c–f). The increase in place field stability was not due to the increase in field size, based on the finding that the y-axis intercept of the regression line for a plot of field size versus stability34 was significantly higher for Df(16)A+/− animals (Df(16)A+/− = 0.29 ± 0.032; wild-type = 0.15 ± 0.028; p < 0.001, ANCOVA). In addition, a linear decoder trained on CA2 PN population activity could now predict the spatial location of the Df(16)A+/− mice (Figure 6a,b), in contrast to the poor decoding performance of CA2 activity in wild-type mice (Figure 2d). Finally, the normal ability of CA2 activity to decode session was significantly impaired in the mutant mice (Figure 6c,d), implying a deficit in contextual coding.
Figure 6. CA2 population activity decoding of position and session in Df(16)A+/− mice and the effect of spadin.
a, Position of an animal was decoded significantly better than chance (p < 0.001, two-sided Wilcoxon rank-sum test) from CA2 population activity in Df(16)A+/− mice (n=128 neurons from 5 mice). Spadin decreased decoding accuracy (p =0.003, Wilcoxon rank-sum test) to chance levels (p=0.07, n=91 neurons from 5 mice). b, Predicted versus actual trajectory for example Df(16)A+/− mice in absence (top) and presence (bottom) of spadin. c, Overall CA2 decoding accuracy for session in three-chamber task is impaired in Df(16)A+/− mice compared to wild-type mice (p =0.008, two-sided Wilcoxon rank-sum test), although it is significantly greater than chance (p<0.05, Wilcoxon rank-sum test) (n=128 neurons from 5 mice). Treatment with spadin significantly increased session decoding performance (p=0.006, two-sided Wilcoxon rank-sum test) (n=91 neurons from 5 mice). Wild-type CA2 data same as shown in Figure 3a. d, Decoding accuracy for pairs of sessions in absence and presence of spadin. Box plots display the center line as the mean; box limits are upper and lower quartiles; whiskers show min to max values in data sets. *p<0.05, **p<0.01, ***p<0.001, ****p<0.0001.
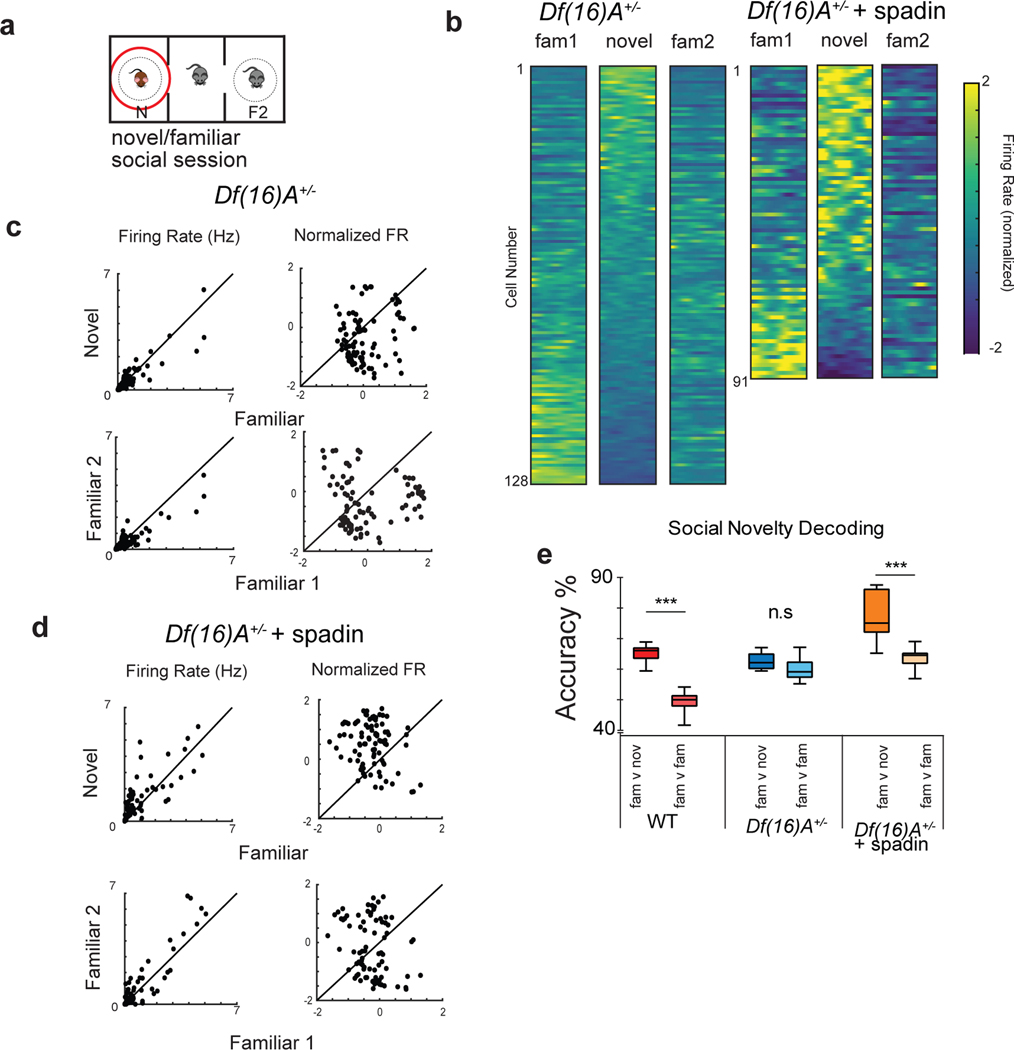
Are the social coding properties of CA2 neurons also altered in the Df(16)A+/− mice? Indeed, we found a significant impairment in the ability of CA2 activity from these mice to encode social information and social novelty (Figure 7). Thus, CA2 neurons of Df(16)A+/− mice failed to increase their firing around a novel social stimulus (Figure 7b,c; compare with Figure 4b,c). In addition, the CA2 population normalized firing rate around the novel mouse in session 4 did not differ from the population firing rate around the familiar mouse in either session 3 or 5 (Figure 7b,c; p>0.05, Kruskal Wallis). This is in distinction to the significant difference in firing rate vectors we observed for wild-type mice when exploring a familiar versus novel mouse (Figure 4b,c). In addition, only 3/128 CA2 PNs showed a significant increase (>2 SD) in normalized firing rate when a Df(16)A+/− mouse interacted with a novel versus familiar animal (Figure 7c), in contrast to the 20% of cells in wild-type mice that increased their firing rate in response to social novelty (Figure 4b,c).
Figure 7. Social coding deficit in Df(16)A+/− mice and its rescue by spadin.
a, CA2 firing was analyzed in the three social sessions in the interaction zone defined by the cup containing the novel animal. b, Z-scored CA2 firing rates for each cell during social sessions as a function of time in the interaction zone in untreated (left, n=128 neurons from 5 mice) and spadin-treated (right, n=91 neurons from 5 mice) Df(16)A+/− mice. c,d, Comparison of CA2 neuron firing rates in Df(16)A+/− animals in absence (c) or presence (d) of spadin. Rates plotted when animal was within the interaction zone around the novel versus familiar mouse (top) or during interactions with the same familiar mouse in session 3 versus 5 (bottom). Graphs on left show mean firing rates (Hz); graphs on right show mean z-scored firing rates. e, Accuracy by which CA2 activity decoded interactions with the familiar versus novel mouse (fam v nov) or with the same familiar mouse in session 3 versus 5 (fam v fam). Data shown for wild-type mice (same as Figure 3d) compared to Df(16)A+/− mice in absence and presence of spadin. Decoding accuracy for novel versus familiar mouse was significantly greater than decoding for the same familiar mouse in wild-type and spadin-treated Df(16)A+/− mice (p =0.0006, two-sided Wilcoxon rank-sum test, n=91 neurons from 5 mice), but not in untreated Df(16)A+/− mice (p =0.67, two-sided Wilcoxon rank-sum test, n=128 neurons from 5 mice). Box plots display the center line as the mean; box limits are upper and lower quartiles; whiskers show min to max values in data sets. *p<0.05, **p<0.01,***p<0.001, ****p<0.0001.
Next we explored the social information contained in CA2 firing in Df(16)A+/− mice using the decoder approach described above. Although the decoder was able to distinguish interactions with the novel versus familiar mouse, decoder performance was barely above chance levels (p = 0.04, Wilcoxon rank-sum test), compared to the much higher statistical significance seen above in wild-type mice (p < 0.0001, Wilcoxon rank-sum test). Importantly, the performance of the decoder in discriminating interactions with the novel versus familiar mouse (session 4 versus sessions 3 and 5) did not differ from its ability to distinguish interactions with the same familiar mouse in session 3 versus 5 (Figure 7e; p=0.36, Wilcoxon rank-sum test). This contrasts with the effect of social novelty to significantly enhance decoder performance in wild-type mice (Figure 4d), suggesting that decoder performance in the mutant mice is not driven by differences in social information content.
TREK-1 inhibition rescued social memory and CA2 social coding deficits in Df(16)A+/− mice
Given that the decrease in mean CA2 firing rate in the Df(16)A+/− mice may reflect increased TREK-1 K+ current22, we next explored whether TREK-1 blockade can rescue the abnormal CA2 neural coding properties and social memory in the mutant mice. Indeed, we found that intraperitoneal injection of Df(16)A+/− mice with spadin (0.1 ml at 10−5 M 30 min prior to testing), a naturally occurring selective peptide antagonist of TREK-135, largely reverted CA2 pyramidal neuron spatial, contextual and social firing properties to wild-type levels (Figures 5–7; Extended Data Figure 6b–f) and rescued social memory (Figure 8). In contrast, injection of a control group of Df(16)A+/− mice with the spadin vehicle saline had no effect on CA2 firing (Extended Data Figure 7) or social memory (Figure 8).
Figure 8. Effect of TREK-1 inhibition on social memory deficits in Df(16)A+/− mice.
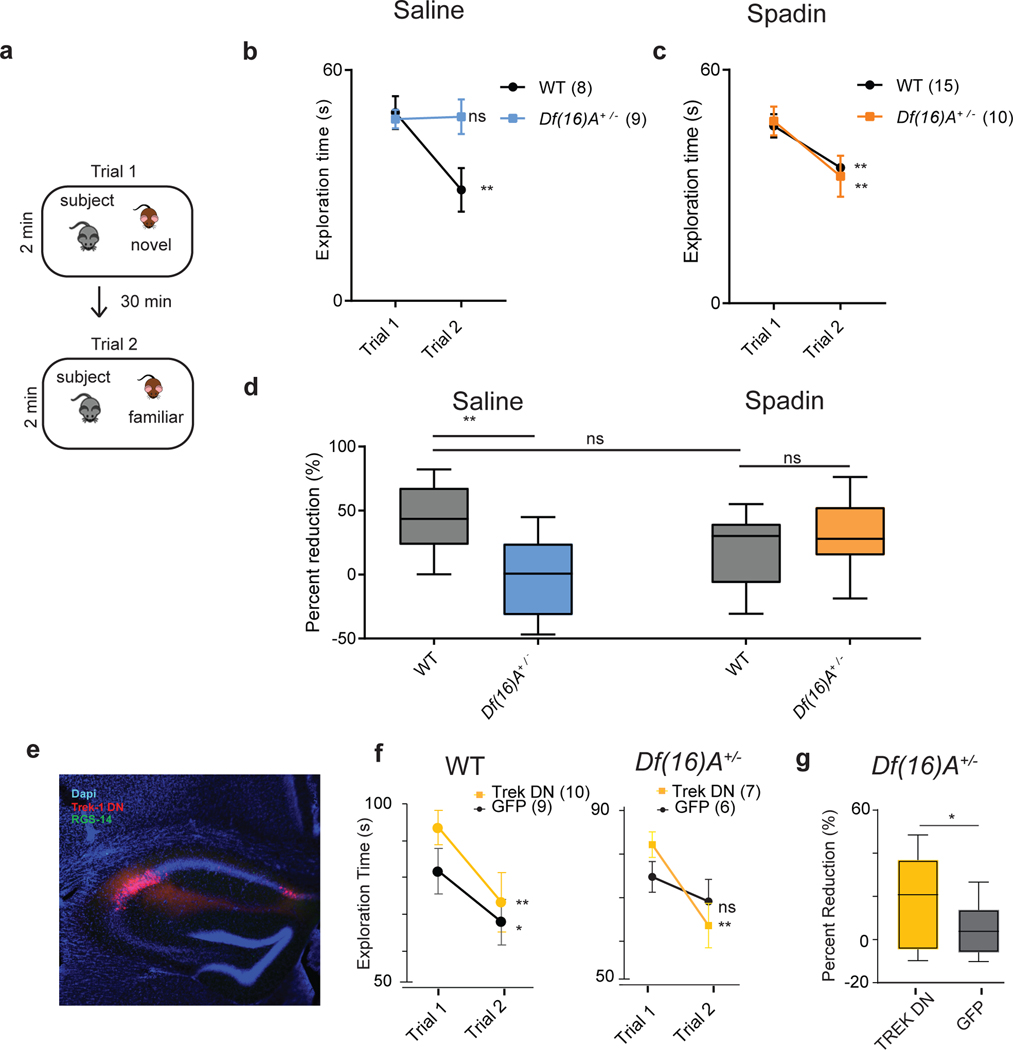
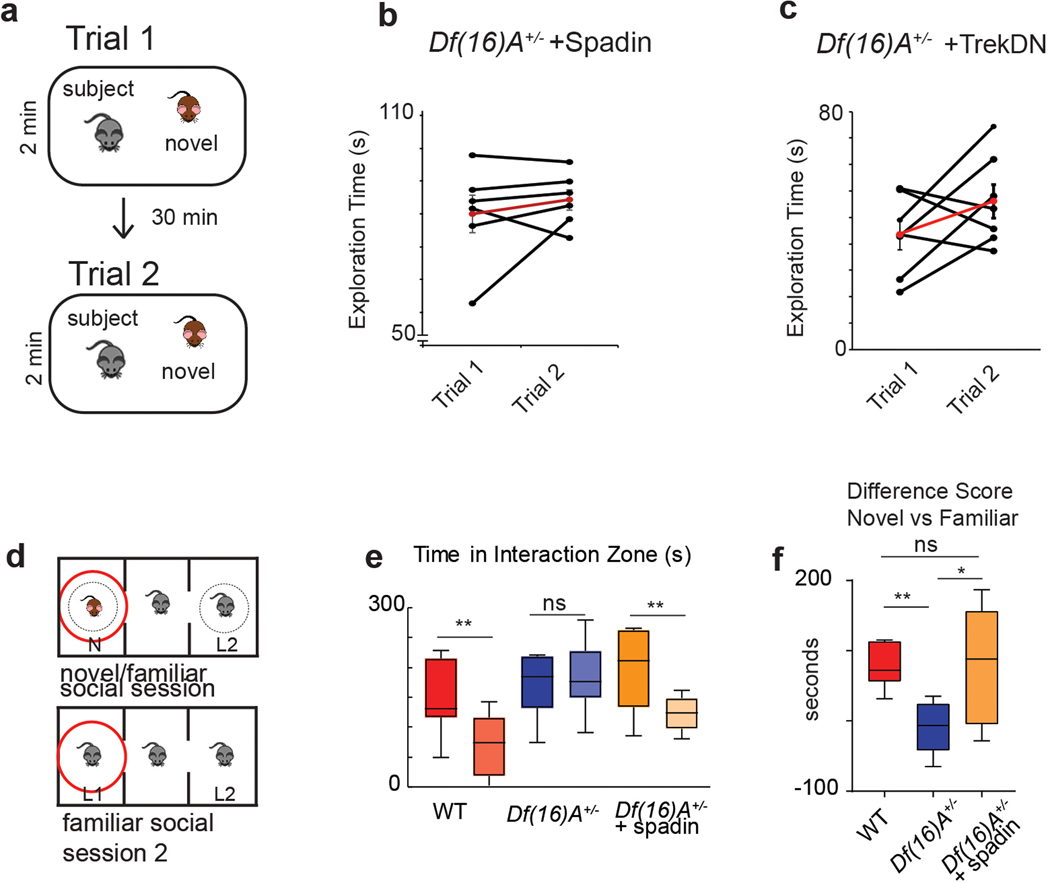
a, The direct interaction task. Trial 1, A subject mouse was presented with a novel stimulus mouse for 2 min. The novel mouse was then removed from the cage. Trial 2, After 30 min the same (now familiar) stimulus mouse was reintroduced. b, Wild-type mice injected with saline showed a decreased interaction time in trial 2 compared to trial 1 (p=0.001, two-sided paired t-test posthoc to 2 way ANOVA (p=0.007, F= 9.717, df=1), n=8 mice), indicating social memory. Df(16)A+/− mice injected with saline showed no decrease in interaction time (p=0.99, n=9 mice). Data is presented as mean ± SEM. c, Mice injected with spadin 30 min prior to trial 1 showed a significant decrease in interaction time in trial 2 compared to trial 1 for both wild-type (p< 0.01, two-sided paired t-test, n=15 mice) and Df(16)A+/− mice (p < 0.01, paired t-test, n=10 mice). Spadin-treated WT mice and Df(16)A+/− mice did not differ significantly from one another (2-way ANOVA, p=0.48, F= 0.53, df=1). Data is presented as mean ± SEM. d, Percent reduction in interaction time is significantly lower in saline-treated Df(16)A+/− mice than other experimental groups (ANOVA, p=0.009, F=4.36, df=3, n=10 mice). Spadin-treated Df(16)A+/− mice do not differ from saline- or spadin-treated wild-type mice (p=0.37, two-sided paired t-test, n=9 mice). (e) Immunohistochemistry showing viral mediated expression in CA2 (identified by CA2 marker RGS-14, green signal) of TREK-1 DN tagged with GFP (TREK-1 DN, red signal). f,g, Social memory in wild-type and Df(16)A+/− mice expressing TREK-1 DN or GFP (control) in CA2. There was a significant decrease in interaction time in trial 2 for wild-type mice expressing TREK-1 DN (p=0.005, n=10 mice) or GFP (p=0.03, n=9 mice, posthoc to ANOVA, p=0.03, df=3, F=3.52) and for Df(16)A+/− mice expressing TREK-1 DN (p=0.001, n=7 mice) but not GFP (p=0.07, n=6 mice; two-sided paired t-tests for all comparisons post hoc to ANOVA, p=0.007, df=3, F=7.9). Data is presented as mean ± SEM. Box plots display the center line as the mean; box limits are upper and lower quartiles; whiskers show min to max values in data sets. *p<0.05, **p<0.01, ***p<0.001, ****p<0.0001.
Spadin administration increased CA2 neuron mean firing rate throughout the five sessions of the three-chamber task to wild-type values (Extended Data Figure 6b), consistent with the idea that the decreased firing rate in Df(16)A+/− mice was caused by TREK-1 upregulation. Compared to untreated Df(16)A+/− mice, CA2 neurons in spadin-treated Df(16)A+/− mice had more and larger place fields (Figure 5b; Extended Data Figure 6c,d) that were less stable across sessions (Figure 5c,d), resembling CA2 firing in wild-type animals. Notably, spadin also decreased the spatial selectivity and information content of CA2 PN firing (Extended Data Figure 6e,f, Extended Data Table 1) and decreased position decoding performance in the Df(16)A+/− mice to chance levels (Figure 6a,b), as found for wild-type mice (Figure 2d). In contrast, spadin enhanced the ability of CA2 population activity to decode in which session of the three-chamber task a mouse was engaged, thus rescuing CA2 contextual coding (Figure 6c,d).
Of further importance, TREK-1 antagonism rescued the social coding properties of CA2. Indeed, following spadin treatment CA2 firing in Df(16)A+/− mice around a novel mouse was now significantly greater than firing around a familiar mouse (Figure 7a–d), with 33/91 cells showing a significant (>2 SD) increase (Figure 7d), similar to the fraction in wild-type mice (Figure 4). Moreover, spadin treatment, but not saline, rescued both the significant difference in the CA2 population firing rate vector around a novel versus familiar mouse (p=0.01, Wilcoxon rank-sum test; Figure 7b,d; Extended Data Figure 7) and the effect of social novelty to enhance SVM decoding of interactions with animals in a given cup across different sessions (Figure 7e).
Systemic and CA2-selective TREK-1 inhibition rescues social memory in Df(16)A+/− mice
Given that spadin rescued CA2 social coding, we next examined its action on social memory. In a direct interaction test (Figure 8a–d), a subject mouse was first exposed to a novel stimulus mouse for 2 min in trial 1. After the mice were separated for 30 min, the subject mouse was re-introduced to the now familiar stimulus mouse for 2 min in trial 2. In wild-type mice social memory is expressed as a decrease in interaction time with the stimulus mouse in trial 2 relative to trial 1, reflecting the decrease in social novelty. Whereas saline-treated Df(16)A+/− mice showed no decrease in social exploration in trial 2, consistent with a deficit in social memory, after spadin treatment we saw a significant decrease in social interaction time in trial 2 (Figure 8a–d). Importantly, spadin-treated Df(16)A+/− mice showed no decrease in interaction time when a novel mouse was introduced in trial 2, showing that the decrease in interaction when the same mouse was presented in trials 1 and 2 reflected decreased social novelty associated with social memory, and not simply task fatigue (Extended Data Figure 8b). Spadin treatment also rescued social memory performance in the three-chamber task (Extended Data Figure 8d–f).
Because the effects of spadin were observed following systemic injection, we next asked whether selective suppression of TREK-1 in CA2 would also rescue social memory. We therefore injected a TREK-1 dominant negative virus (Trek-1 DN)36 in CA2 of Df(16)A+/− and wild-type mice to decrease TREK-1 K+ current selectively in this region, taking advantage of the fact that the AAV2/5 serotype has a natural tropism to infect CA237. Df(16)A+/− animals expressing TREK-1 DN in CA2 showed a significant improvement in social memory in the direct interaction test, manifest as a decreased social exploration of the now-familiar stimulus mouse in trial 2, as compared to control Df(16)A+/− animals expressing GFP (Figure 8e–g). Moreover, mice expressing TREK-1 DN showed no decrease in interaction time when a novel animal was introduced in trial 2, confirming that the decrease in exploration of the same mouse reflected social memory (Extended Data Figure 8c). As a further control, injection of the TREK-1 DN virus in CA2 did not alter social memory performance in wild-type mice (Figure 8f).
Discussion
Here we report that the firing of dorsal CA2 pyramidal neurons, which play a critical role in social memory10–12,38 was enhanced during social interactions, with a particularly marked increase in firing when an animal explored a novel conspecific. At the population level, CA2 activity discriminated discriminated interactions with a novel versus a familiar mouse, as well as social versus non-social contexts. In contrast, CA2 neurons provided a relatively weak representation of spatial information, at either the single cell or population level. Although CA2 spatial firing is relatively weak, especially compared to dorsal CA1 neurons, it is possible that CA2 may contain behaviorally relevant spatial information under certain conditions, as seen in the increased spatial selectivity of CA2 firing in the Df(16)A+/− mice.
Although CA2 activity was clearly responsive to social stimuli, our experiments were not designed to reveal whether the firing of individual CA2 neurons or the CA2 population contained a representation for a social engram that encodes the specific social identity of a familiar conspecific. Such social engram cells were identified in ventral CA1 by Okuyama and colleagues, who reported that the subset of ventral CA1 neurons that project to the shell of the nucleus accumbens become selectively active during interactions with a specific familiar mouse following social learning and are required for social memory13. However, in contrast to our results in dorsal CA2, ventral CA1 neurons were not reported to increase their firing in response to social novelty39. This is perhaps surprising as our laboratory found that dorsal CA2 provides excitatory input to the same subset of ventral CA1 neurons identified by Okuyama et al and that this CA2 input is necessary for encoding social memory10. How the novel social coding in dorsal CA2 is transformed into familiar specific firing in ventral CA1 remains unknown, although the dorsal CA2 inputs do recruit substantial feedforward inhibition in ventral CA1.
In support of an important behavioral role of CA2 pyramidal neuron firing properties, we found that the social22 and contextual40 memory deficits in the Df(16)A+/− mouse model of the 22q11.2 microdeletion were associated with impaired CA2 encoding of social and contextual information. In contrast, CA2 activity in these mice showed improved spatial encoding properties. Moreover, we found that systemic pharmacological blockade in the mutant mice of the TREK-1 K+ channel, whose upregulation is thought to contribute to hyperpolarization and reduced excitability of CA2 pyramidal neurons in Df(16)A+/− mice22, rescued the normal encoding of social and contextual information by CA2 neurons, restored normal social memory, and reverted CA2 spatial firing to wild-type levels. The social dysfunction in the mutant mice was likely due to enhanced TREK-1 in CA2 since expression of a dominant negative TREK-1 construct selectively in CA2 pyramidal neurons was also able to rescue social memory.
Why should selective TREK-1 inhibition rescue social memory behavior and CA2 firing properties in the Df(16)A+/− mice as it is not expected to restore the decreased synaptic inhibition in CA2 of these mice22? One possible explanation involves a differential action on the two major excitatory inputs to dorsal CA2 pyramidal neurons, which come from entorhinal cortex layer II stellate cells through the perforant path and hippocampal CA3 pyramidal neurons via the Schaffer collaterals. Piskorowski and colleagues22 found that the decrease in CA2 feedforward inhibition in the Df(16)A+/− mice was selective for the Schaffer collateral inputs, with no change in feedforward inhibition through the entorhinal cortical inputs. Thus, if CA2 received its major social information from the entorhinal cortical inputs, the rescue of CA2 neuron hyperpolarization would restore normal levels of CA2 social information processing. That social information may arrive via the direct cortical inputs as opposed to CA3 is consistent with a recent study showing that silencing dorsal CA3 did not affect social memory41.
To our knowledge, our results provide the first instance of a mechanism-based pharmacological rescue of social behavior in a mouse genetic model of a human mutation strongly linked to schizophrenia. This is notable given the difficulty in treating the negative symptoms of schizophrenia, including social withdrawal. Interestingly, spadin administration, in addition to rescuing social and contextual coding, caused the spatially selective firing properties of CA2 PNs in the mutant mice to revert to the less precise spatial firing characteristic of CA2 PNs in wild-type mice. This suggests that the increased spatial stability in the Df(16)A+/− mice may actually contribute to impaired social coding by altering the normal mixed selectivity of CA2 firing to a more selective coding mode dominated by spatial information.
The gain-of-function of improved CA2 spatial coding in the Df(16)A+/− mice resembles results noted in other studies of place fields in genetic mouse models, including a pathological hyperstability of place fields in the Fmr1 KO mouse model of fragile X syndrome42. Our results may also be related to a previous finding that Df(16)A+/− mice have decreased reward-related remapping of CA1 place fields43. Accordingly, the more stable spatial firing in CA2 of the Df(16)A+/− mice may reflect a deficit in remapping to altered context or social reward. Perhaps the pyramidal cell hyperpolarization may render CA2 neurons less sensitive to weak excitatory or neuromodulatory inputs that convey contextual information. In addition, the loss of CA2 feedforward inhibition through the Schaffer collateral input may shift the balance of excitatory input to favor the more spatially oriented information conveyed by CA3. Finally, as CA2 is enriched in receptors for the social neuropeptides oxytocin44 and vasopressin38,45,46, improper integration of these social signals could contribute to the behavioral and social coding deficits of the Df(16)A+/− mice.
Our results provide further support that CA2 and its dysfunction contributes importantly to normal social behavior and to social behavioral abnormalities characteristic of certain neuropsychiatric disorders, including schizophrenia. Moreover, our findings emphasize the potential importance of CA2 and TREK-1 as targets for novel therapeutic approaches to treating social endophenotypes associated with these disorders. Finally, the strong and consistent correlation observed between CA2 firing properties and social memory behavior in wild-type mice, Df(16)A+/− mice, and Df(16)A+/− mice treated with spadin provides strong support for the view that CA2 social firing properties contribute to the encoding, storage and recall of social memory.
Methods
We bred Df(16)A+/− mice and their wild-type littermates on a pure (>99.9%) C57BL/6J background (The Jackson Laboratory) as previously described22,23. Experiments were carried out on adult male mice (22–28 g, 3–6 months old). Mice were housed 3–5 in a cage under a 12:12 h light/dark cycle with access to food and water ad libitum. Experiments were conducted during the light cycle. All procedures were approved by the Animal Care and Use Committee of Columbia University and were in accordance with the National Institutes of Health guidelines for care and use of animals.
Surgical Procedures
19 mice (10 Df(16)A+/− mice, 3 wild-type littermates, 6 wild-type C57Bl/6J non-littermates), were implanted with electrode bundles containing 7–8 tetrodes in a moveable drive using sterile surgical techniques. Wild-type littermates and wild-type non-littermates were not significantly different in any of the physiological measures discussed with the exception of spatial stability, in which littermates were significantly less stable that non-littermate wild-type mice; both control groups were significantly less stable than both CA1 and Df(16)A+/− CA2 recordings (Extended Data Figure 8).
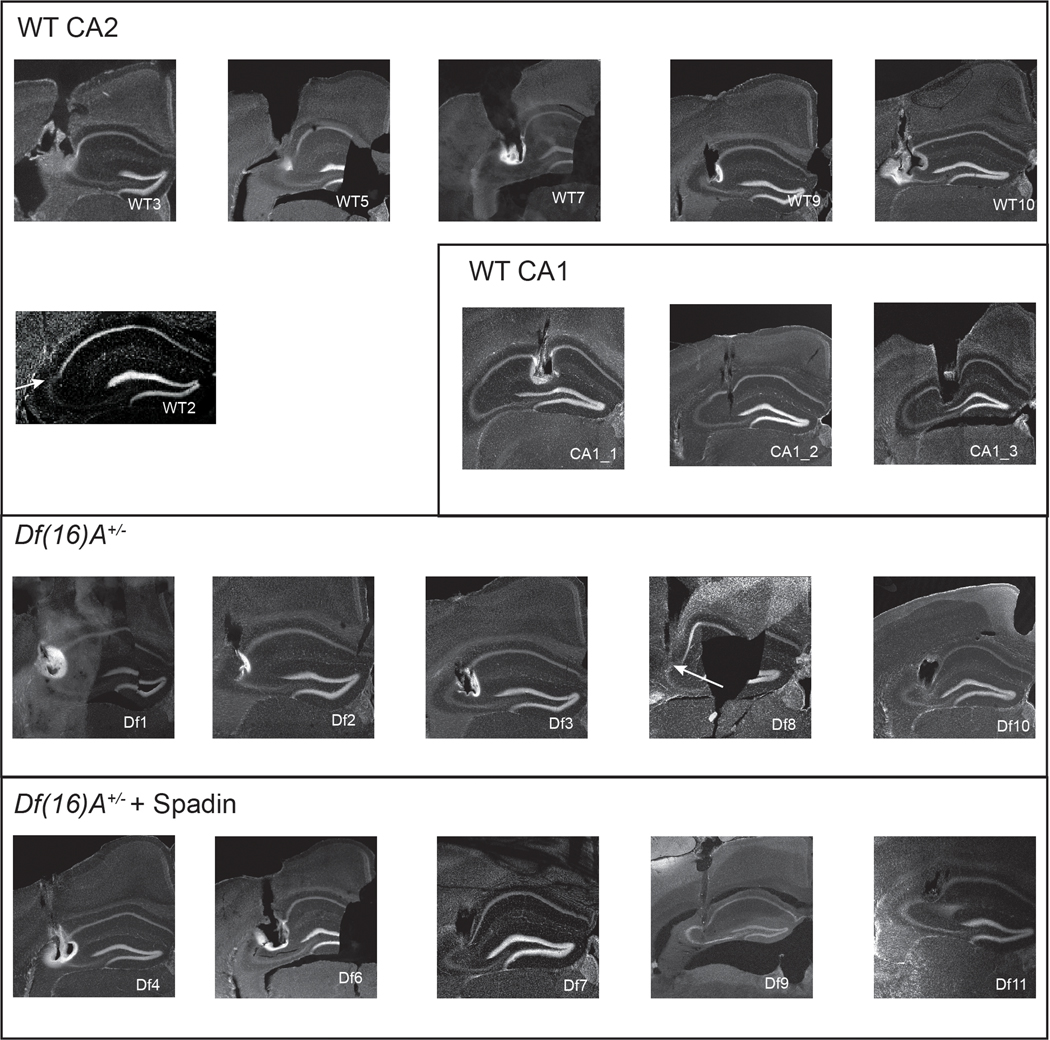
Animals were anesthetized with 2–5% isoflourane and placed in a stereotaxic frame. Craniotomies were made above CA2 (1.8 mm posterior to bregma, 2.15 mm lateral to the midline, ~1.5 mm below the brain surface) or CA1 (1.9 mm posterior to bregma, 1.8 mm lateral to the midline, ~1 mm below the brain surface). To prevent damage to the recording site, tetrodes were implanted above the structure and turned down 50–150 μm per day after recovery from surgery. A skull screw was placed over the contralateral visual cortex to serve as ground. To verify recording locations, 50 μA of current was passed through the channels at the end of the experiment to create an electrolytic lesion (Extended Data Figure 9).
Although we cannot rule out the possibility that some electrodes recorded from neurons outside of CA2, we followed the same procedures used in previous in vivo electrophysiological studies of CA2 of which we are aware, using careful stereotactic placement of electrodes verified by electrolytic lesions based on overall morphology of the hippocampus15,16,25,47,48. We used the same coordinates in all mice where we attempted to record from CA2 (AP −1.8, ML 2.15, DV −1.8), which aligns with other studies of CA2 in vivo firing properties and anatomical studies of CA2 in mice25,47,48. We relied on a comparison of the lesion site to the location of CA2 in the appropriate section in the Allen Mouse Brain Atlas, as well as through our laboratory’s extensive experience in staining for CA2 in intact mouse brain11. We did not use data from animals whose tetrodes appeared to be in the more densely packed cell layer of CA1 compared to CA2, or that missed the hippocampus altogether (6 animals from the CA2 groups were excluded from analysis based on these criteria). We note that mistargeting of CA2 is unlikely to account for our two central findings, which are that CA2 has low spatial information content and that CA2 encodes social information. Thus, as dorsal CA1 and CA3 pyramidal neurons bordering CA2 both have a higher degree of spatially selective firing than CA218, their inclusion in our “CA2” population will only cause us to overestimate the spatial information in true CA2 neuron firing. Conversely, as dorsal CA1 and CA3 respond poorly to social stimuli13,14,39 and are not required for social memory13,41, in contrast to dorsal CA210–12, any contribution of cells in these regions will cause us to underestimate the social information encoded by CA2.
For viral injections, 200 μl of either AAV2.5-hsyn-mCherry or AAV2.5.-hsyn-TREK-1DN-GFP were injected bilaterally into CA2 (1.8 mm posterior to bregma, 1.8 mm lateral to the midline, 1.2 mm below the brain surface). Injection of the compounds was randomized for both the Df(16)A+/− mice and their wild type littermates. After experiments animals were perfused, and brains were cut on a vibrotome and stained for Neuromab anti-RGS-14(73–170) and Millipore mouse anti-NeuN (MAB3770.) One animal was excluded from the TREK-1 DN group because there was only unilateral expression of the virus.
Recording and Spike Sorting
Recordings were amplified, band-pass filtered (1–1,000 Hz LFPs, 300–6,000 Hz spikes), and digitized using the Neuralynx Digital Lynx system or the OpenEphys GUI. LFPs were collected at a rate of 2 kHz, while spikes were detected by online thresholding and collected at 30 kHz. Units were initially clustered using Klustakwik, sorted according to the first two principal components, voltage peak and energy from each channel. Clusters were then accepted, merged or eliminated based on visual inspection of feature segregation, waveform distinctiveness and uniformity, stability across recording session, and inter-spike interval distribution. Clusters with an Lratio<0.05 were included in the analysis49.
Behavior: Three-chamber Interaction Task
Mice were given one week to recover from surgery, after which tetrodes were turned down to stratum pyramidale of the hippocampus. After tetrodes reached the hippocampus and were stable for at least 48 hours (Extended Data Figure 9), animals were habituated to the three-chamber arena (60 × 40 cm) for 40–50 minutes. Barriers were placed in the environment every 10 minutes to briefly isolate mice in the center chamber to match the protocol of the three-chamber task (Figure 1d). The following day animals were run in the three-chamber social interaction task shown in Figure 1a. The subject mouse was isolated in the central chamber between each of the five sessions by placement of barriers. Side chambers were quickly wiped with 70% alcohol between each session to rid the side chambers of any olfactory cues from the previous session. The trajectory of the animal was recorded in Neuralynx using LEDs on the head to track the position of the head or using custom MATLAB software for tracking webcam images. Trajectory and behavior were analyzed using custom scripts in MATLAB. Interaction zones were defined as a 7 cm annulus from the edges of each respective cup. Experimenters were blind to experimental condition during recordings.
Behavior: Direct Interaction Task
The direct interaction task was performed on 9 wild-type mice and 9 Df(16)A+/− mice injected with saline control and with 16 wild-type and 13 Df(16)A+/− mice injected with spadin. Subject mice were habituated to the cage for 30 min. A novel juvenile male mouse was placed into the cage for 2 min (Trial 1), during which the subject mouse was allowed to explore the juvenile. Mice that interacted for less than 24 seconds in Trial 1 were excluded from analysis (1 wild-type mouse was excluded from the saline group; 1 wild-type and 3 Df(16)A+/− mice were excluded from the spadin group). The juvenile mouse was removed for 30 minutes and then placed back into the cage with the subject for an additional 2 minutes (Trial 2). For the novel-novel version of the direct interaction task (Extended Data Figure 7), a second novel juvenile mouse was placed in the cage in Trial 2. Behavioral videos were recorded and analyzed in Anymaze 2.0; social interactions were defined as periods of facial or anogenital sniffing, grooming of the juvenile mouse, and periods of chasing the juvenile. Researchers were blind to experimental condition during both the behavioral experiments and the analysis.
Spatial Fields
Spatial analyses were performed with custom written scripts in MATLAB. From each session, X,Y positions from LEDs placed on the animals head during the three-chamber were projected onto the apparatus axis. The position and spiking data were binned into 5-cm wide segments, generating the raw maps of spike number and occupancy probability, with unvisited bins for each session represented as NaNs. Rate map, number of place fields, field sizes, spatial information, and selectivity were calculated. A Gaussian kernel (SD = 5.5 cm) was applied to both raw maps of spike and occupancy, and a smoothed rate map was constructed by dividing the smoothed spike map by the smoothed occupancy map. A place field was defined as a continuous region, of at least 9 cm, where the firing rate was above 10% of the peak rate in the maze, with a peak firing rate >2 Hz. Spatial stability was calculated as the Pearson’s correlation (r) of the firing rate in each binned location for each session only using those spatial bins that were visited in all sessions being compared.
Statistics and Normalization
All effects presented as statistically significant exceeded an α-threshold of 0.05. All independence tests were two-tailed. All independence testing of paired values (that is, changes across conditions) used paired t-tests or in cases of non-normal data distributions(where stated) signed rank tests. No statistical methods were used to pre-determine sample sizes but our sample sizes are similar to those reported in previous publications10,11,15,16,17. All t-tests and rank tests performed with more than two groups were done post-hoc following ANOVA tests or Kruskal Wallis tests; Bonferroni corrections for multiple comparisons were used for these tests. Normalization refers to z-scored data. For all box plots displayed the center line is the mean; box limits are upper and lower quartiles; whiskers and min to max values in data sets.
Position Decoder
For decoding position, we considered the different sessions of the tasks separately to evaluate the different valences. For all the datasets, unless otherwise specified, we used 10-fold cross validation to validate the performance of the decoders. We divided each individual 10 min trial into 10 temporally contiguous periods of equal size in terms of number of data points (spikes). We then trained the decoders using the data from 9 of the 10 periods and tested the performance of the decoder on the remaining data in the session.
To decode the position of the animal, we first divided the arena into 12 × 8 equally sized, square bins. We then labeled each time point with the discrete location in which the animal was found. For each pair of locations, we trained a Support Vector Machine (SVM) classifier with a linear kernel to classify the cell activities into either of the two assigned locations using all the identified cells unless specified otherwise. We used only the data corresponding to the two assigned locations; to correct for unbalanced data due to inhomogeneous exploration of the arena we balanced the classes with weights inversely proportional to the class frequencies48. The output of the classifiers was then combined to identify the location with the largest number of votes as the most likely location. The decoding error reported corresponds to the median physical distance between the center of this location and the actual position of the mouse in each time bin of the test set, unless otherwise specified. For datasets with different numbers of cells we randomly down sampled until all groups had equal numbers of cells.
To assess the statistical significance of the decoder, we computed chance distributions of decoding error using shuffled distributions of spike events. Briefly, for each shuffling, we assigned a random time bin to each spike event for each cell independently while maintaining the overall density of spike events across all cells. That is, we chose only time bins in which there were spike events in the original data and kept the same number and magnitude of the events in each time bin. This method destroyed spatial information as well as temporal correlations but kept the overall activity across cells constant. We trained one decoder on each shuffled distribution and pooled all the errors obtained. We finally assessed the statistical significance of the decoding errors for the 10-fold cross-validation of the original data by comparing them to the decoding errors obtained from the shuffled data using the non-parametric Mann-Whitney U test, from which we obtained a p-value of significance. This was done for each animal compared to its own shuffled data and then distributions for actual and chance performance for each group were combined to assess significance across the population of animals. In some cases we also compared the performance of the SVM trained on two experimental groups from this study; in this case we randomly downsampled until both groups had equal numbers of cells. Differences in distributions of decoding performance were determined using the Wilcoxon rank-sum test. In some instances, as noted, we also used a Naïve Bayes decoder50 to compare the performance of the SVM with probabilistic approaches, in which case the same protocol for determining chance performance was used. These analyses were written in Matlab and Python 2.
Session/Social Information Decoder
All sessions were divided into 5 equal time bins, and a Support Vector Machine (SVM) was trained to decode either which session the animal was engaged or with which animal the subject mouse was interacting with, using four time bins to train and the remaining time bin to test. For example, if there were five animals per group, we would take the five values from the five-fold cross validation from each animal, giving us 25 values in the distribution of decoding values. These were compared to the same number of chance values, calculated from the shuffled data, using the Wilcoxon rank sum test to assess significance. In the case of unequal interaction times, training sets were subsampled to the length of the shorter interactions. Chance distributions were determined by training and testing the decoder on shuffled data, described above. Statistical significance was assessed by comparing to the distribution of the shuffled data using the Mann-Whitney U test.
Spadin administration
For the three-chamber experiments described, 0.1 ml of 10−5 M spadin (Tocris) or saline was administered intraperitoneally 30 minutes before the three-chamber interaction task in 5 of the Df(16)A+/− mice. Administration of saline or spadin was randomized. CA2 firing properties in Df(16)A+/− mice treated with saline did not show any significant differences from the untreated Df(16)A+/− mice (Extended Data Figure 7). For the direct interaction task described, either 0.1 ml of saline or 0.1 ml of 10−5 M spadin was injected into Df(16)A+/− mice and wild-type littermate controls 30 minutes before trial 1 of the direct interaction.
TREK-1 Dominant Negative Virus Generation
From36: A dnTREK-1 mutant was created from the mTREK-1 plasmid by the introduction of two point mutations in the selectivity filter of the pore region (G161E and G268E). The mutations were introduced using the QuikChange kit (Stratagene). The primers designed to generate the mutation of G161 to E were 5′-CCATAGGATTTGAGAACATCTCACCACGC-3′ (forward) and 5′-GGGTGGTGAGATGTTCTCAAATCCTATGG-3′ (reverse), and 5′-CTCTAACAACTATTGAATTTGGTGACTACGTTGC-3′ (forward) and 5′-GCAACGTAGTCACCAAATTCAATAGTTGTTAGAG-3′ (reverse) for G268 to E. This mutant channel expresses well but carries no current when expressed in CHO cells.
Extended Data
Extended Data Figure 1. Single CA2 cell spatial firing properties during the different sessions of the three- chamber task.
a–d, Single cell measures that did not differ during sessions (ANOVA p>0.05; n=192 CA2 neurons from 6 mice). e, Burst index (number of spikes in bursts of at least three successive spikes with an interspike interval < 6 ms) was significantly higher in sessions with novel objects and the novel mouse (p =0.002, 0.001 two-sided t-test with Bonferroni correction post hoc to performing ANOVA; n=192 CA2 neurons from 6 mice). Box plots display the center line as the mean; box limits are upper and lower quartiles; whiskers show min to max values in data sets. *p<0.05, **p<0.01, ***p<0.001, ****p<0.0001.
Extended Data Figure 2. Mouse movement behavior and CA2 and CA1 neuron spatial decoding properties in various conditions.
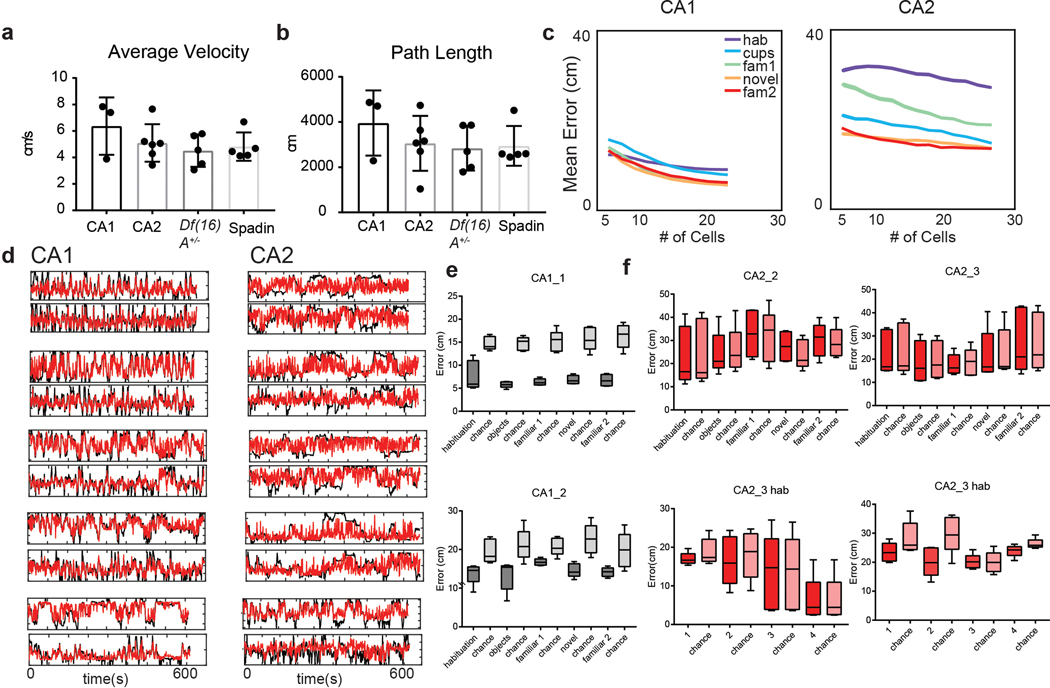
a–b, There was no significant difference between (a) mean velocity (ANOVA, p=0.36, n=6,3,5,5 mice), or (b) average path length (ANOVA, p= 0.71, n=6,3,5,5 mice) in the different experimental groups of mice. Data is presented as mean ± SEM. c, The relationship between the number of cells used to decode position by an SVM linear classifier and the accuracy of decoding for CA1 (left) and CA2 (right) cells. Note: CA2 spatial decoding accuracy was not significantly greater than chance levels in any of our recordings for any number of cells. CA1 decoding accuracy became greater than chance as additional cells were added to the decoder. Even with 30 CA2 cells, spatial decoding accuracy was less than chance and less than decoding accuracy with half as many CA1 cells. d, Example plots of real (black) versus predicted position by the model (red). e, CA1 population activity decoded position significantly better than chance in all sessions of the 3-chamber task. Data shown for two mice (CA1_1, n=21 neurons; CA1_2, n=27 neurons). f, CA2 population activity did not decode position better than chance in any 3-chamber task session (left graphs) or during the four individual ten-minute sessions of the pre-habituation session (right graphs). Data shown for two mice (CA2_2, n=25 neurons; CA2_3, n=31 neurons). Box plots display the center line as the mean; box limits are upper and lower quartiles; whiskers show min to max values in data sets. *p<0.05, **p<0.01, ***p<0.001, ****p<0.0001.
Extended Data Figure 3. Bayesian Decoding of Position in the three-chamber task.
a, Bayesian decoding of position based on CA1 activity (dark-shaded bars) in one example animal was significantly greater than chance performance (light-shaded bars) in all five sessions of the three-chamber task. Example shown for one wild-type animal. (*p<0.05, **p<0.01, **p<0.001, two-sided Wilcoxon Rank Sum). b, Example Bayesian decoding of position from CA2 activity in two animals in the three-chamber task. For all 6 wild-type animals examined, the Bayesian decoder for position based on CA2 neuron activity never performed significantly better than chance. (p>0.05, two-sided Wilcoxon Rank Sum). P values relative to chance for all WT mice with CA2 recordings were equal to: WT7, p=0.48; WT2, p=0.36; WT3, p=0.06; WT5, p=0.17; WT10, p=0.19; WT9, p=0.49. Box plots display the center line as the mean; box limits are upper and lower quartiles; whiskers show min to max values in data sets. *p<0.05, **p<0.01, ***p<0.001, ****p<0.0001.
Extended Data Figure 4. The firing rate of a subset of CA2 cells significantly increased from the non-social to the social sessions.
a, An example cell that only began to fire in the social sessions. b, Firing rate distributions for all CA2 cells in nonsocial (blue bars) and social (orange bars) sessions, each fit with a Gaussian distribution. Six percent of CA2 cells that were active in the social sessions were classified as silent in the non-social sessions based on firing rates >2 SD below the median firing rate (<0.007 Hz). c, Mean CA2 firing rates in the social versus non-social sessions in the three-chamber task. Each circle is a different cell. Red circles, the 40 cells whose z-scored mean firing rates increased >2-fold in social versus non-social sessions. Blue circles, the 3 cells whose z-scored firing rates decreased >2-fold in the social versus non-social sessions. There was a significant increase in mean firing rate (two-sided paired t-test, p=0.015) from the non-social (mean firing rate=1.69 Hz, sem=0.19) to the social sessions (mean firing rate=1.84 Hz, sem=0.19). d, Change in z-scored firing rate from the empty arena session to the social sessions (right) and to the novel object session (left). The two firing rate vectors differed significantly (two-sided Wilcoxon rank-sum test, p=5.80 e-37). *p<0.05, **p<0.01, ***p<0.001, ****p<0.0001.
Extended Data Figure 5. Responses of CA1 and CA2 neurons to novel stimuli.
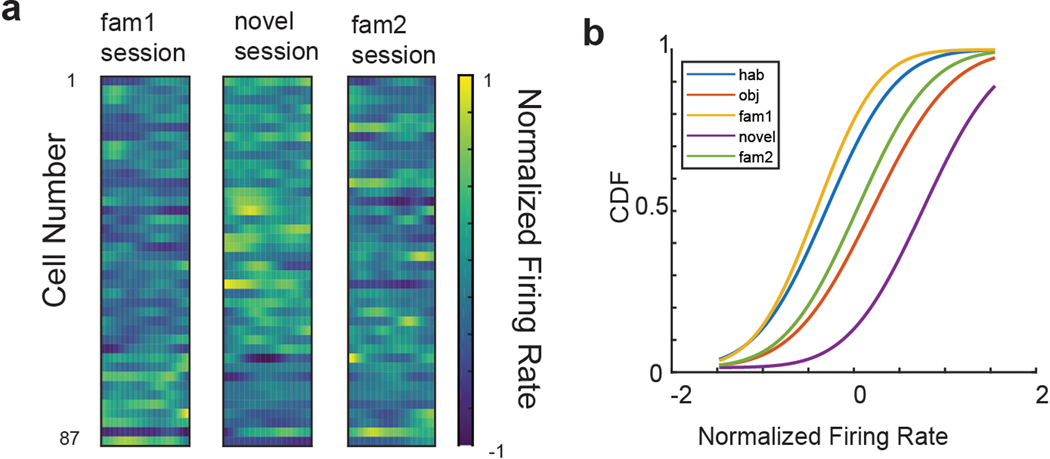
a, Color-coded z-scored firing rates in the interaction zone around the novel mouse (session 4) and familiar mouse (sessions 3 and 5) for 87 CA1 neurons (n=3 mice). There was no significant difference in firing rates among sessions (ANOVA, p=0.17). b, Cumulative distributions of z-scored firing rates for all 192 CA2 neurons (n= 6 mice) in the interaction zones in each session of the five 3-chamber task sessions. CA2 activity in the interaction zones was significantly different among the different sessions (Kruskal Wallis test; p<0.0001). CA2 firing rates in interaction zone around the novel object (wire cup cage) were significantly greater than in same spatial location in empty chamber (two-sided Mann-Whitney test, p=0.02). CA2 firing rates around the novel mouse were significantly higher than around the novel object (mean z-scored firing rates=0.83 ± .06 and 0.19 ± 0.08, respectively; two-sided Mann-Whitney test, p=0.56).
Extended Data Figure 6. CA2 spatial firing in Df(16)A+/− mice and effect of spadin.
a, Additional examples of CA2 neuron spatial firing from wild-type, Df(16)A+/−, and spadin-treated Df(16)A+/− animals. Each row under a given group shows pairs of heatmap and trajectory plots in the five sessions for an individual neuron from a given animal identified on the left. Maximum firing rate (Hz) is indicated above the heatmaps; numbers of cells from each animal in each group are indicated in the tables above. b-f, CA2 neuron firing and spatial properties. Red bars, wild-type mice; blue bars, Df(16)A+/− mice; orange bars, Df(16)A+/− mice injected with spadin. b, Df(16)A+/− mice have a lower overall firing rate than wild-type mice (p=0.02, paired t-test). Spadin increased the firing rate in the Df(16)A+/− mice (p=0.04, two-sided paired t-test). c-f, Compared to CA2 neurons in wild-type mice, CA2 neurons in Df(16)A+/− mice had: c, fewer place fields per cell (p<0.0001, paired t-test); d, smaller place fields (p=0.02); e, place fields with higher spatial selectivity (p=0.02); and f, place fields with higher spatial information content (p=0.008). CA2 neuron firing rates, place field size, selectivity and spatial information content in Df(16)A+/− mice treated with spadin were not significantly different from values in wild-type mice (p>0.05). Number of fields per cell in spadin-treated Df(16)A+/− mice was significantly greater than in untreated Df(16)A+/− animals (p=0.01) but significantly less than in wild-type mice (p=0.02). For all statistics listed: WT, n=192 neurons; Df(16)A+/−, n=128 neurons; Df(16)A+/− given spadin, n=91 neurons. Box plots display the center line as the mean; box limits are upper and lower quartiles; whiskers show min to max values in data sets. *p<0.05, **p<0.01, ***p<0.001, ****p<0.0001.
Extended Data Figure 7. Control experiments for firing properties of CA2 neurons in Df(16)A+/− mice.
a,b, Saline injection (control for spadin injection) in Df(16)A+/− mice did not alter CA2 (a) mean firing rate (two-sided paired t-test p=0.21) or (b) spatial stability in the five sessions of the three-chamber task (two-sided paired t-test, p=0.31; n=128 neurons). c, CA2 neuron firing rate in saline-injected Df(16)A+/− mice did not differ in interaction zone around the novel compared to familiar mouse (two-sided paired t-test, p=0.7), similar to uninjected Df(16)A+/− mice (Figure 7a) but distinct from CA2 novel firing preference in wild-type mice (Figure 4c) and spadin-injected Df(16)A+/− mice (Figure 7d). d–f, CA2 neuron firing properties in two groups of wild-type control mice used for comparison with Df(16)A+/− mice (all on identical C57Bl/6J backgrounds): wild-type littermates of Df(16)A+/− mice (n= 56 neurons from 2 mice) and wild-type non-littermates (n=136 neurons from 4 mice). d, There was no significant difference in mean firing rate between wild-type non-littermates (WT) and wild-type littermates (LM) (paired t-test, p= 0.19). e, CA2 spatial stability was slightly but significantly lower in wild-type littermates compared to wild-type non-littermates (two-sided paired t-test with Bonferroni correction, p=0.002); spatial stability of both wild-type groups was significantly less than that of Df(16)A+/− mice (two-sided paired t-test with Bonferroni correction, p<0.0001 in both cases). f, The two wild-type control groups did not differ in their increase in firing around the novel compared to familiar animal (two-sided paired t-test, p=0.45). Box plots display the center line as the mean; box limits are upper and lower quartiles; whiskers show min to max values in data sets. *p<0.05, **p<0.01, ***p<0.001, ****p<0.0001.
Extended Data Figure 8. Effects of TREK-1 inhibition on social behavior.
a, Control experiment for direct interaction test using two different novel mice in trials 1 and 2. b, There was no decrease in exploration of the second novel mouse when spadin was administered 30 min before trial 1 (p=0.57, two-sided paired t-test, n= 6 mice). c, There was no decrease in exploration of the second novel mouse in trial 2 in Df(16)A+/− mice expressing TREK-1 DN in CA2 (p=0.34, two-sided paired t-test, n= 6 mice). Black points and lines show individual animals. Red lines and points show means. Bars show SEM. d–f, Comparison of social interaction times in three-chamber task (d) for wild-type mice, Df(16)A+/− mice, and Df(16)A+/− mice injected with spadin (n=6, 5 and 5 mice, respectively). e, Time spent in interaction zone around cup containing the novel animal (novel session 4; bars with dark shades of color) compared to time spent in same interaction zone when the familiar mouse was present (averaged from familiar sessions 3 and 5; bars with light shades of color). Wild-type and spadin-treated Df(16)A+/− groups spent significantly less time exploring the familiar animal (two-sided paired t-test, p<0.01). Df(16)A+/− mice spent similar time exploring the familiar and novel animals (p>0.05; paired t-test). f, Data from panel e plotted as difference scores. (WT versus Df(16)A+/− mice, p=0.007, df=3,F=1.2; Df(16)A+/− mice in absence versus presence of spadin, p=0.03, post hoc to ANOVA, p=0.02, df=3,F=1.2). Box plots display the center line as the mean; box limits are upper and lower quartiles; whiskers show min to max values in data sets. *p<0.05, **p<0.01, ***p<0.001, ****p<0.0001.
Extended Data Figure 9. Tetrode tracks from all animals in which recordings were obtained for this study.
Targeting of CA2 and CA1 in the animals included in this study. Some of our 8 tetrodes targeted to CA2 may have picked up a few cells from neighboring CA1 and CA3 regions, which would only cause us to underestimate any true differences between CA2 and CA1 spatial and social properties.
Extended Data Table 1.
Spatial properties of the 3 experimental CA2 groups.
| Mean Firing Rate | Mean | SEM | ANOVA | WT vs Df(16)A+/− | Df(16)A+/− vs Spadin | WT vs Spadin |
|---|---|---|---|---|---|---|
| WT | 1.73 | 0.1322 | p=0.02 | p=0.02 | p=0.01 | p=0.57 |
| Df(16)A+/− | 1.3 | 0.1206 | ||||
| Spadin | 1.87 | 0.2137 |
| Number of Fields | Mean | SEM | ANOVA | WT vs Df(16)A+/− | Df(16)A+/− vs Spadin | WT vs Spadin |
|---|---|---|---|---|---|---|
| WT | 2.8067 | 0.0778 | p<0.0001 | p<0.0001 | p<0.0001 | p=0.26 |
| Df(16)A+/− | 1.8923 | 0.0783 | ||||
| Spadin | 3.0703 | 0.1115 |
| Field Size | Mean | SEM | ANOVA | WT vs Df(16)A+/− | Df(16)A+/− vs Spadin | WT vs Spadin |
|---|---|---|---|---|---|---|
| WT | 36.67 | 0.8583 | p=0.0009 | p=0.02 | p=0.02 | p=0.73 |
| Df(16)A+/− | 40.24 | 1.206 | ||||
| Spadin | 36.16 | 1.258 |
| Selectivity | Mean | SEM | ANOVA | WT vs Df(16)A+/− | Df(16)A+/− vs Spadin | WT vs Spadin |
|---|---|---|---|---|---|---|
| WT | 10.61 | 0.9467 | p=0.0009 | p=0.02 | p=0.02 | p=0.80 |
| Df(16)A+/− | 13.96 | 1.044 | ||||
| Spadin | 10.24 | 0.8526 |
| Spatial Info | Mean | SEM | ANOVA | WT vs Df(16)A+/− | Df(16)A+/− vs Spadin | WT vs Spadin |
|---|---|---|---|---|---|---|
| WT | 0.5453 | 0.0509 | p=0.01 | p=0.008 | p=0.03 | p=0.76 |
| Df(16)A+/− | 0.7365 | 0.0492 | ||||
| Spadin | 0.5699 | 0.05173 |
Supplementary Material
Acknowledgements
We thank J. Gogos for initially providing the Df(16)A+/− mice and for advice and guidance. We thank Y. Matsushita of Ono Pharmaceuticals for suggesting we study the action of spadin. We also thank Y.M. Zafrina, A. Kleinbort, and H.G. Yueh for their technical support, Bina Santoro for assistance with and animal breeding, and C.D. Salzman and D.Aranov for helpful discussions and comments on the manuscript. This work was supported by a grant from NSF GRFP to M.L.D., grants R01MH104602 and R01MH106629, S.A.S, P.I., support from the Zegar Family Foundation, and a grant from Ono Pharmaceuticals.
Footnotes
Declaration of Interests
The authors declare no competing interests.
Data and Code Availability Statement
The datasets generated during and/or analysed during the current study are available from the corresponding author on reasonable request.
All scripts for analyzing data are also available by request.
References Cited
- 1.Berry RJ & Bronson FH Life history and bioeconomy of the house mouse. Biol. Rev. 67, 519–550 (1992). [DOI] [PubMed] [Google Scholar]
- 2.Meltzer HY, Thompson PA, Lee MA & Ranjan R. Neuropsychologic deficits in schizophrenia: Relation to social function and effect of antipsychotic drug treatment. Neuropsychopharmacology 14, 27S–33S (1996). [DOI] [PubMed] [Google Scholar]
- 3.Steinvorth S, Levine B. & Corkin S. Medial temporal lobe structures are needed to re-experience remote autobiographical memories: evidence from H. M. and W. R. Neuropsychologia 43, 479–496 (2005). [DOI] [PubMed] [Google Scholar]
- 4.Kogan JH, Frankland PW & Silva AJ Long- term memory underlying hippocampus- dependent social recognition in mice. Hippocampus 1063, 47–56 (2000). [DOI] [PubMed] [Google Scholar]
- 5.Squire LR & Wixted JT The Cognitive Neuroscience of Human Memory Since H. M. Annu Rev Neurosci 259–290 (2011). [DOI] [PMC free article] [PubMed] [Google Scholar]
- 6.O’Keefe J. & Dostrovsky J. The hippocampus as a spatial map. Preliminary evidence from unit activity in the freely-moving rat. Brain Res. 34, 171–175 (1971). [DOI] [PubMed] [Google Scholar]
- 7.MacDonald CJ, Lepage KQ, Eden UT & Eichenbaum H. Hippocampal ‘time cells’ bridge the gap in memory for discontiguous events. Neuron 71, 737–749 (2011). [DOI] [PMC free article] [PubMed] [Google Scholar]
- 8.Kraus B, Robinson R, White J, Eichenbaum H. & Hasselmo M. Hippocampal ‘Time Cells’: Time versus Path Integration. Neuron 78, 1090–1101 (2013). [DOI] [PMC free article] [PubMed] [Google Scholar]
- 9.McKenzie S. et al. Hippocampal representation of related and opposing memories develop within distinct, hierarchically organized neural schemas. Neuron 83, 202–215 (2014). [DOI] [PMC free article] [PubMed] [Google Scholar]
- 10.Meira T. et al. A hippocampal circuit linking dorsal CA2 to ventral CA1 critical for social memory dynamics. Nat. Commun. 9, 1–14 (2018). [DOI] [PMC free article] [PubMed] [Google Scholar]
- 11.Hitti FL & Siegelbaum SA The hippocampal CA2 region is essential for social memory. Nature 508, 88–92 (2014). [DOI] [PMC free article] [PubMed] [Google Scholar]
- 12.Stevenson EL & Caldwell HK Lesions to the CA2 region of the hippocampus impair social memory in mice. Eur. J. Neurosci. 40, 3294–3301 (2014). [DOI] [PMC free article] [PubMed] [Google Scholar]
- 13.Okuyama T, Kitamura T, Roy DS, Itohara S. & Tonegawa S. Ventral CA1 neurons store social memory. Science (80-. ). 353, 1536–1541 (2016). [DOI] [PMC free article] [PubMed] [Google Scholar]
- 14.Rao RP, von Heimendahl M, Bahr V. & Brecht M. Neuronal responses to conspecifics in the ventral CA1. Cell Rep. 27, 3460–3472.e3 (2019). [DOI] [PubMed] [Google Scholar]
- 15.Mankin E. a., Diehl GW, Sparks FT, Leutgeb S. & Leutgeb JK Hippocampal CA2 activity patterns change over time to a larger extent than between spatial contexts. Neuron 85, 190–202 (2015). [DOI] [PMC free article] [PubMed] [Google Scholar]
- 16.Alexander GM et al. Social and novel contexts modify hippocampal CA2 representations of space. Nat. Commun. 7, 10300 (2016). [DOI] [PMC free article] [PubMed] [Google Scholar]
- 17.Oliva A, Fern A. & Ber A. Spatial coding and physiological properties of hippocampal neurons in the Cornu Ammonis subregions. Hippocampus 1607, 1593–1607 (2016). [DOI] [PubMed] [Google Scholar]
- 18.Lu L. et al. Topography of place maps along the CA3-to-CA2 Axis of the hippocampus. Neuron 87, 1078–1092 (2015). [DOI] [PubMed] [Google Scholar]
- 19.Wintzer ME, Boehringer R, Polygalov D. & McHugh TJ The hippocampal CA2 ensemble is sensitive to contextual change. J. Neurosci. 34, 3056–66 (2014). [DOI] [PMC free article] [PubMed] [Google Scholar]
- 20.Benes FM, Kwok EW, Vincent SL & Todtenkopf MS A reduction of nonpyramidal cells in sector CA2 of schizophrenics and manic depressives. Biol. Psychiatry 44, 88–97 (1998). [DOI] [PubMed] [Google Scholar]
- 21.Zhang ZJ & Reynolds GP A selective decrease in the relative density of parvalbumin- immunoreactive neurons in the hippocampus in schizophrenia. Schizophr. Res. 55, 1–10 (2002). [DOI] [PubMed] [Google Scholar]
- 22.Piskorowski RA et al. Age-dependent specific changes in area CA2 of the hippocampus and social memory deficit in a mouse model of the 22q11.2 deletion syndrome. Neuron 89, 163–176 (2016). [DOI] [PMC free article] [PubMed] [Google Scholar]
- 23.Karayiorgou M, Simon TJ & Gogos J. a. 22q11.2 microdeletions: linking DNA structural variation to brain dysfunction and schizophrenia. Nat. Rev. Neurosci. 11, 402–416 (2010). [DOI] [PMC free article] [PubMed] [Google Scholar]
- 24.Talley EM, Solo G, Lei Q, Kim D. & Bayliss DA CNS distribution of members of the two-pore-domain ( KCNK ) potassium channel family. J. Neurosci. 21, 7491–7505 (2001). [DOI] [PMC free article] [PubMed] [Google Scholar]
- 25.Boehringer R. et al. Chronic loss of CA2 transmission leads to hippocampal hyperexcitability. Neuron 94, 642–655 (2017). [DOI] [PubMed] [Google Scholar]
- 26.Skaggs WE & McNaughton BL Spatial firing properties of hippocampal CA1 populations in an environment containing two visually identical regions. J. Neurosci. 18, 8455–8466 (1998). [DOI] [PMC free article] [PubMed] [Google Scholar]
- 27.Spiers HJ, Hayman RMA, Jovalekic A, Marozzi E. & Jeffery KJ Place field repetition and purely local remapping in a multicompartment environment. Cereb. Cortex 25, 10–25 (2015). [DOI] [PMC free article] [PubMed] [Google Scholar]
- 28.Grieves RM, Duvelle É, Wood ER & Dudchenko PA Field repetition and local mapping in the hippocampus and the medial entorhinal cortex. J. Neurophysiol. 118, 2378–2388 (2017). [DOI] [PMC free article] [PubMed] [Google Scholar]
- 29.Stefanini F. et al. “A distributed neural code in the dentate gyrus and in CA1.” Neuron ( 2020). [DOI] [PMC free article] [PubMed] [Google Scholar]
- 30.Keinath AT et al. Precise spatial coding is preserved along the longitudinal hippocampal axis. Hippocampus 24, 1533–1548 (2014). [DOI] [PMC free article] [PubMed] [Google Scholar]
- 31.Saitta L. Support-Vector Networks. Mach. Learn. 297, 273–297 (1995). [Google Scholar]
- 32.Barak O, Rigotti M. & Fusi S. The Sparseness of Mixed Selectivity Neurons Controls the Generalization–Discrimination Trade-Off. J. Neurosci. 33, 3844–3856 (2013). [DOI] [PMC free article] [PubMed] [Google Scholar]
- 33.Rigotti M. et al. The importance of mixed selectivity in complex cognitive tasks. Nature 497, 585–90 (2013). [DOI] [PMC free article] [PubMed] [Google Scholar]
- 34.Giocomo LM et al. Grid cells use HCN1 channels for spatial scaling. Cell 147, 1159–1170 (2011). [DOI] [PubMed] [Google Scholar]
- 35.Borsotto M. et al. Targeting two-pore domain K+ channels TREK-1 and TASK-3 for the treatment of depression: A new therapeutic concept. Br. J. Pharmacol. 172, 771–784 (2015). [DOI] [PMC free article] [PubMed] [Google Scholar]
- 36.Voloshyna I. et al. TREK-1 Is a novel molecular target in prostate cancer. Cancer Res. 68, 1197–1204 (2008). [DOI] [PubMed] [Google Scholar]
- 37.Pasquale G. Di et al. Identification of PDGFR as a receptor for AAV-5 transduction. Nat. Med. 9, 1306–1312 (2003). [DOI] [PubMed] [Google Scholar]
- 38.Smith AS, Williams Avram SK, Cymerblit-Sabba A, Song J. & Young WS Targeted activation of the hippocampal CA2 area strongly enhances social memory. Mol. Psychiatry 1–8 (2016). [DOI] [PMC free article] [PubMed] [Google Scholar]
- 39.von Heimendahl M, Rao RP & Brecht M. Weak and nondiscriminative responses to conspecifics in the rat hippocampus. J. Neurosci. 32, 2129–2141 (2012). [DOI] [PMC free article] [PubMed] [Google Scholar]
- 40.Stark KL et al. Altered brain microRNA biogenesis contributes to phenotypic deficits in a 22q11-deletion mouse model. Nat. Genet. 40, 751–760 (2008). [DOI] [PubMed] [Google Scholar]
- 41.Chiang MC, Huang AJY, Wintzer ME, Ohshima T. & McHugh TJ. A role for CA3 in social recognition memory. Behav. Brain Res. 354:22–30 (2018). [DOI] [PubMed] [Google Scholar]
- 42.Talbot ZN et al. Normal CA1 place fields but discoordinated network discharge in a Fmr1-null mouse model of fragile X syndrome. Neuron 684–697 (2018). doi: 10.1016/j.neuron2017.12.043 [DOI] [PMC free article] [PubMed] [Google Scholar]
- 43.Zaremba JD et al. Impaired hippocampal place cell dynamics in a mouse model of the 22q11.2 deletion. Nat. Neurosci. 20, 1612 (2017). [DOI] [PMC free article] [PubMed] [Google Scholar]
- 44.Raam T, Mcavoy KM, Besnard A, Veenema AH & Sahay A. Hippocampal oxytocin receptors are necessary for discrimination of social stimuli. Nat. Commun. 1–14 (2017). doi: 10.1038/s41467-017-02173-0 [DOI] [PMC free article] [PubMed] [Google Scholar]
- 45.Young WS, Li J, Wersinger SR & Palkovits M. The vasopressin 1b receptor is prominent in the hippocampal area CA2 where it is unaffected by restraint stress or adrenalectomy. Neuroscience 143, 1031–1039 (2006). [DOI] [PMC free article] [PubMed] [Google Scholar]
- 46.Cui Z, Gerfen CR & Young WS Hypothalamic and other connections with dorsal CA2 area of the mouse hippocampus. J. Comp. Neurol. 521, 1844–1866 (2013). [DOI] [PMC free article] [PubMed] [Google Scholar]
Methods references
- 47.Kay K. et al. A hippocampal network for spatial coding during immobility. 02, 97356 (2016). [DOI] [PMC free article] [PubMed] [Google Scholar]
- 48.Alexander GM et al. CA2 neuronal activity controls hippocampal low gamma and ripple oscillations. 1–25 (2018). [DOI] [PMC free article] [PubMed] [Google Scholar]
- 49.Schmitzer-torbert N. & Redish AD Neuronal Activity in the Rodent Dorsal Striatum in Sequential Navigation: Separation of Spatial and Reward Responses on the Multiple T Task. J. Neurophysiol. 91, 2259–2272 (2004). [DOI] [PubMed] [Google Scholar]
- 50.Brown EN, Frank LM, Tang D, Quirk MC & Wilson MA A statistical paradigm for neural spike train decoding applied to position prediction from ensemble firing patterns of rat hippocampal place cells. J. Neurosci. 18, 7411–7425 (1998). [DOI] [PMC free article] [PubMed] [Google Scholar]
Associated Data
This section collects any data citations, data availability statements, or supplementary materials included in this article.


