Abstract
Deep brain stimulation is a complex movement disorder intervention that requires highly invasive brain surgery. Clinicians struggle to predict how patients will respond to this treatment. To address this problem, we are working toward developing a clinical tool to help neurologists predict deep brain stimulation response. We analyzed a cohort of 105 Parkinson’s patients who underwent deep brain stimulation at Vanderbilt University Medical Center. We developed binary and multicategory models for predicting likelihood of motor symptom reduction after undergoing deep brain stimulation. We compared the performances of our best models to predictions made by neurologist experts in movement disorders. The strongest binary classification model achieved a 10-fold cross validation AUC of 0.90, outperforming the best neurologist predictions (0.56). These results are promising for future clinical applications, though more work is necessary to validate these findings in a larger cohort and taking into consideration broader quality of life outcome measures.
Introduction
Parkinson’s disease (PD) is a relatively common movement disorder and affects 572 per 100,000 people worldwide.1 PD symptoms vary by patient and often include tremor, rigidity, stiffness, and trouble walking.2,3 Deep brain stimulation (DBS) is a highly complex surgical intervention for PD and other movement disorders, such as essential tremor, and dystonia.2 DBS uses an implanted electric pulse generator to deliver electrical stimulation to specific areas in the brain that control movement.2 Successful electrode implantation and programming is highly complex and requires collaboration from several neurological and neurosurgical disciplines.4-6 Despite undergoing invasive surgery, many DBS patients do not experience an improvement in symptoms4-6 DBS may also worsen symptoms, such as those stemming from dementia7, and lead to adverse reactions, of both minor and major significance.8 Occasionally, additional invasive surgery is required to remove or replant the pulse generator.8
Researchers have identified many factors which affect PD progression and DBS responsiveness. Active lifestyles, caffeine consumption, and moderate alcohol consumption are associated with less severe PD symptoms. 9 Conversely, family history, pesticide exposure, rural living, and well water drinking are associated with higher rates of PD onset.10 Interestingly, patients with left-sided symptoms experience less severe motor symptoms, while patients with right-sided symptoms experience less severe cognitive symptoms.11-13 Reduced volume of the brain region called the putamen is also associated with more severe PD progression.14 Strong DBS responsiveness (defined as reduction of symptoms post-DBS) is associated with higher responsiveness to treatment with levodopa, lower baseline tremor severity, and lower age.15 These associations are often contradicted and debated between studies,16-18 a fact which underscores the need for a better understanding of the factors influencing PD and DBS. These challenges and the risks of surgical implantation necessitate a better system for predicting DBS response so that weak responders can be screened out prior to surgery.
Machine learning (ML) is a computational method for identifying patterns in datasets, and has made a large impact in clinical settings from clinical decision support to surgical assistance.19 We are interested in applying ML to improve candidate evaluation and patient counselling prior to DBS. Habets et al. trained a logistic regression ML model to identify strong and weak responders to DBS within a population of 86 PD patients (AUC: 0.79).20 ML has also been used to improve DBS pulse generator programming and electrode placement.21,22 In this study we build on existing PD, DBS, and ML research to construct a predictive model which distinguishes strong (likely to improve) and weak (unlikely to improve) responders to DBS. We incorporate a wide selection of preoperative variables informed by clinically known and suspected relationships to PD and DBS. Preoperative variables are chosen to maximize the final model’s applicability to preoperative patient analysis. Finally, we compare our model to clinical specialists to validate its clinical relevance.
Methods
Overview and Cohort
We analyzed health records from the Vanderbilt University Medical Center (VUMC) neurocognitive research database. We included a cohort of PD patients who underwent DBS at VUMC. We excluded any patients who had missing on-medication UPDRS III benchmarks before and after surgery. The final supervised-learning cohort contained 105 patients. Patients who did not meet the UPDRS III benchmark requirements for inclusion were reserved in a secondary cohort intended for applying semi-supervised learning. We engineered binary and multicategory target variables to distinguish strong and weak responders to DBS. Last, we trained binary and multicategory machine learning classification models to predict motor improvement. To assess clinical significance, we compared our models’ predictions with those of trained neurologists.
Variables and Data
Table 1 categorizes and summarizes the data available in the VUMC neurocognitive and movement disorders databases. From these databases we extracted preoperative demographic, medical, medication, imaging, and neurocognitive variables. Surgical settings were excluded from analysis, since they do not serve an informative role in deciding to undergo DBS.
Table 1:
Categorized overview of available data. Cells may represent multiple variable fields in the database. Not every variable shown is used in model training. Imaging volumes are reported for left and right areas (L/R).
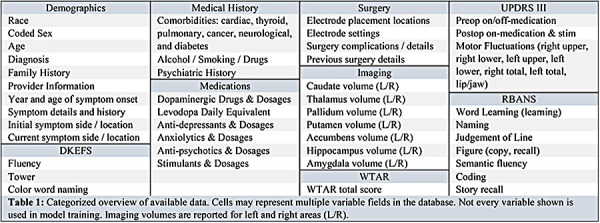
This study also examines pre-to-post operative changes in neurocognitive function assessments. The neurocognitive assessments we analyzed include: the Parkinson’s Disease Questionnaire (PD-Q-39)23, the Unified Parkinson’s Disease Rating Scale (UPDRS)24, the Delis-Kaplan Executive Function System (DKEFS)25, the Wechsler Test of Adult Reading (WTAR)26, and the Repeatable Battery for the Assessment of Neuropsychological Status (RBANS)27.
The PD-Q-39 is a 39-question survey which scores quality of life for PD patients.23 The UPDRS is a four-part test which scores non-motor experiences of daily living, motor experiences of daily living, motor examination, and motor complications.24 UPDRS section three (UPDRS III) quantifies motor function and is divided into body subregions.24 UPDRS III also includes body-area subscores, which quantify motor fluctuations in the right upper, right lower, left upper, left lower, right, left, and facial extremities. UPDRS III assessment is performed pre- and post-operation, and on and off medication. DKEFS is a broad set of tests which assess a variety of executive functioning areas, such as verbal fluency. WTAR is a cognitive test for assessing intelligence quotient in traumatic brain injury patients. RBANS assesses cognitive decline in several categories, such as naming, word list recall, and semantic fluency.
Feature Engineering
We defined the age (in years) of symptom onset to be the difference between date of birth and date of symptom onset, which was obtained from the patient during clinical evaluation. We defined pre-operation symptom duration (in years) to be the difference between age pre-operation and age of symptom onset. We defined strong DBS response as improvement (score decrease) in on-medication UPDRS III preop to postop. Weak DBS response is defined as on-medication UPDRS III worsening (score increase) or staying the same. We did not consider cognitive changes, due to lack of benchmarking data. We also defined a multicategory operation success parameter, using three classes: UPDRS III worsened greater than 25%, UPDRS III improved greater than 20%, and UPDRS III change between 25% worse and 20% better. These class boundaries were chosen to divide the cohort into three evenly sized groups, and to differentiate between high and low magnitude of response with as few classes as possible.
Data Preprocessing and Feature Analysis
We preprocessed our data by imputing missing numeric variables (henceforth features) with each feature’s mean value. Missing boolean and categorical features were labeled with missing-indicators. Categorical features were one-hot encoded into boolean representations of each categorical option. Variance filtering28 was performed by robust-scaling the feature set and filtering out any features with variance below 0.03. We chose the robust-scaling method, which removes the median and scales to the interquartile range, because it produces boolean and numeric variances on a similar scale for even comparison. Select-K-Best filtering29 was performed by scaling the feature set to zero mean and unit variance (standard scaling) and choosing the features with the highest DBS-improvement correlation by Pearson’s Chi-squared test30 (figure 1). The number of features chosen was tuned for performance, and a value of 30 was determined to be optimal. Standard scaling was chosen because chi-squared scores are scaled relative to each feature and we wanted an even weighting of boolean and numeric features in the correlation analysis.
Figure 1:
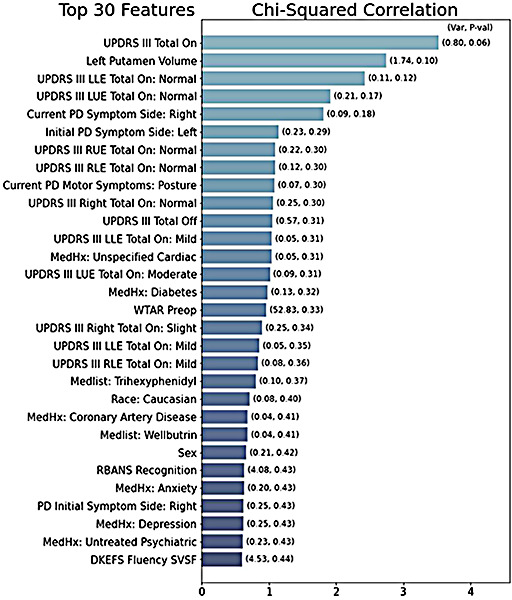
Bar graph representing the top-30 features, ranked by chi-squared correlation with improved UPDRS III score. The column variance is listed above each column. Features with zero variance are ignored. The white column text shows the calculated p value for the feature.
After variance and correlation filtering, we tuned the preprocessing pipeline alongside each predictive model through grid search parameters. The features selected above were fed into the preprocessing pipeline without scaling, so that the pre-classifier scaling method could be tuned as a hyperparameter. We considered standard scaling31, minimummaximum scaling32, robust scaling33, and no-scaling as preprocessing options. Next, we applied the Synthetic Minority Oversampling Technique34 to generate 21 synthetic observations of the minority class (weak DBS-response) for an even class balance (63 in each class). The oversampling step’s k-neighbors parameter was tuned within the model grid search. Due to low data quantity (n=105), conjugate undersampling of the majority class was not applied in this study. Last, we considered dimensionality reduction via linear and kernel principal component analysis.35,36 The reduction method and size were also tuned in the final model grid search.
Binary Classification
We trained and compared several supervised and semi-supervised binary classifiers. We trained four model types well studied in the clinical domain, including support vector, logistic regression, k-neighbors, and random forest classifiers.37-41 We also trained conjugate semi-supervised classifiers via pseudo-labeling on the reserved semi-supervised cohort. Pseudo-labeling is a technique which uses a trained supervised classifier to predict targets on unlabeled data, so that the newly labeled data can be used to retrain a more generalizable model.42 The proportion of labelled to pseudo-labeled data used was 10:1; thus 11 additional patients were sampled from the semi-supervised cohort for pseudo-labeling.
Models and preprocessing pipelines were analyzed via grid search with cross validation test scores averaged across 10 stratified hold-out testing folds.43 Standard deviation across the testing folds was also collected for each metric. Binary metrics included the receiver operating characteristic area under the curve (AUC)44, accuracy, precision, and recall. The best model was selected to maximize mean cross-validation test AUC.
Multicategory Classification
We trained the same supervised and semi-supervised models as before, but as multiclass predictors. Models were analyzed with cross validation test scores averaged across 10 stratified testing folds. Standard deviation across the testing folds was also collected for each metric. AUC is poorly defined in multiclass problems, so we instead relied primarily on f1-score and mean-squared-error to evaluate the multiclass models. We also evaluated precision and recall scores. F1, precision, and recall scores were macro-averaged across the three classes.45 The best model was selected to maximize mean f1 -macro.
Clinical Performance Comparison
With the goal of deploying a clinical model to reduce the risk of poor outcomes in DBS candidates, we compared the performances of our best models with trained movement disorder experts. Two board certified neurologists reviewed the patients and training features analyzed in this study to predict whether each patient’s motor function would improve after DBS. The neurologists made both a binary (will they improve: yes/no) and multicategory (in which range will they improve) prediction for each patient. The most accurate predictions from both neurologists were combined to form a neurologist-best-case prediction set.
We compared binary AUC, accuracy, recall, precision, and kappa scores, along with multiclass f1, mean squared error, precision, and recall scores. Metrics were averaged across 10 stratified held-out cross validation test sets. Multiclass metrics were macro-averaged between classes.
Additional Statistical Analyses
Two board-certified neurologists reviewed the results of our analyses to identify features of interest for further study. Features of interest were explored with two-sample independent t-tests, allowing unequal variances to make as few assumptions about the data as possible. From these t-tests we obtained 95% confidence intervals for the true differences in mean measures between groups, as well as p-value estimates of statistical significance.
Results
Summary Statistics
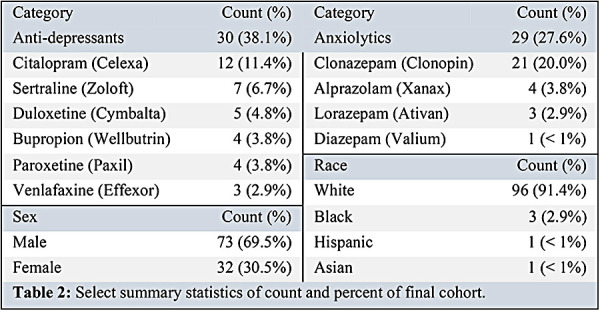
1,893 (64.5%) of 2,935 total patient records in our database were diagnosed with PD. Of those with PD, 105 (3.58%) patients had records of both pre- and postoperative UPDRS III scores. Table 2 summarizes demographic data of our final cohort. Most study participants were male (69.5%) and white (91.4%). Black, Hispanic, and Asian participants made up 4.8% of study participants. 27.6% of the cohort were prescribed anxiolytics, and 38.1% of the cohort were prescribed anti-depressants.
Table 2:
Select summary statistics of count and percent of final cohort.
Feature Analysis
Figure 1 depicts the top-30 features by Person’s chi-squared correlation with motor improvement. Preop total and extremity tremor scores were highly correlated with DBS response. Also highly correlated were left putamen volume, symptom side, race, and histories of cardiac, psychiatric, and diabetic complications (figure 1).
Table 3 describes the differences in variable ranges between the weak and strong response groups. Strong DBS responders were lower in median levodopa equivalent prescription range, but were higher in median left putamen volume, UPDRS III (on and off) scores, and WTAR scores (table 3, figure 2).
Table 3:
Comparison of medians and interquartile ranges (IQR) of select features relative to strong and weak response groups. P values were obtained from two-sample t tests allowing unequal variances. Strong response is defined as a negative change (improvement) in UPDRS III score post-DBS. Weak response is defined as a positive or no change (worsening) in UPDRS III score post-DBS.
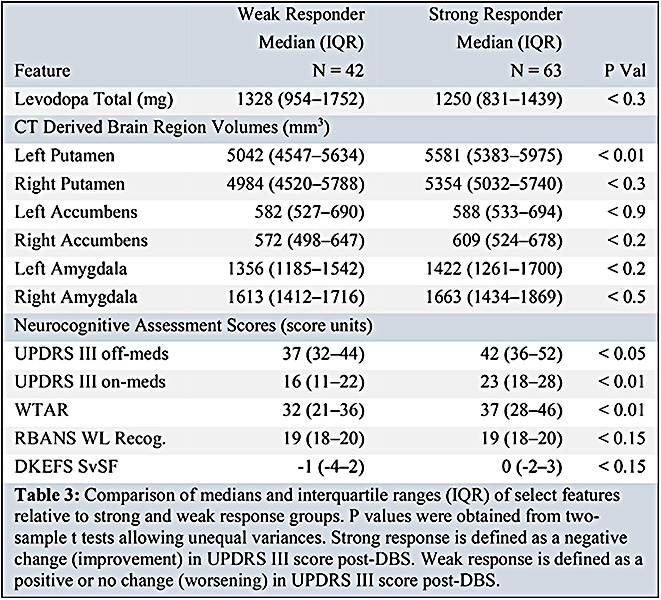
Figure 2:
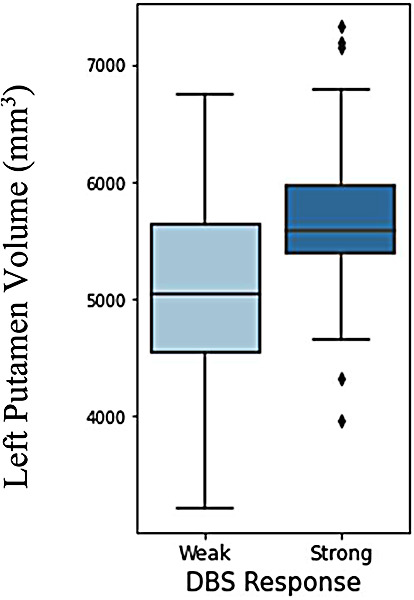
Boxplot of DBS outcome vs size of left putamen area in brain. Strong response is UPDRS III improvement (score decrease). Weak response is UPDRS III worsening (score increase).
Independent two-sample t-tests allowing unequal variances found statistically significant differences in mean left putamen volume, UPDRS III off-medication score, UPDRS III on-medication score, and WTAR score between weak and strong DBS responders (p<0.01, 0.05, 0.01, 0.01, respectively). From these tests we are 95% confident that the true difference in feature means lay between 244 and 926 mm3, 0.4 and 8.4, 3.8 and 11.0, and 0.0 and 12.4, respectively, between response groups. Figure 2 shows a boxplot comparing left putamen volume between DBS response groups.
Figure 3 shows boxplot comparisons of UPDRS III change post-DBS vs race, symptom side, and psychiatric status. All three African American patients showed weak responses to DBS. A two-sample t-test allowing unequal variances found a statistically significant difference in mean UPDRS III improvement for white and black patients (p<0.01). From this test we are 95% confidence that the true difference in mean UPDRS III improvement between these groups lays between 3.9 and 9.9 (white group with greater improvement).
Figure 3:
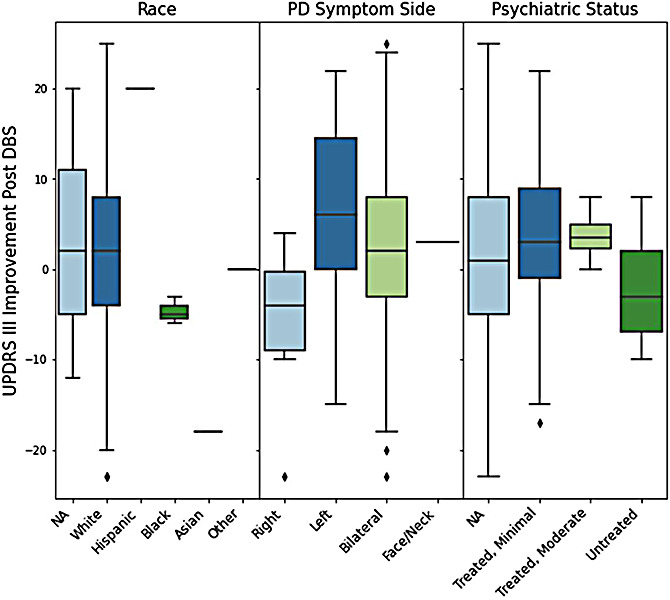
Comparison of UPDRS III score improvement after DBS, grouped by race, symptom side, and psychiatric status. Positive improvements indicate strong DBS response. Negative improvements indicate weak DBS response.
Patients with left-sided symptoms averaged higher score improvements than those with right sided symptoms. A two-sample t-test allowing unequal variances found a statistically significant difference in mean UPDRS III improvement for these groups (p<0.02). From this test we are 95% confidence that the true difference in mean UPDRS III improvement between these groups lays between 2.9 and 20.0 (left-sided group with greater improvement).
Patients with untreated psychiatric conditions averaged lower improvements in UPDRS III score than those with treated psychiatric conditions. From our two-sample t-test we are 95% confident that the true difference in mean UPDRS III improvement between these groups lays between 1.1 and 10.6. However, we did not find sufficient evidence that there is a difference between these groups (p<0.2).
Classification Results
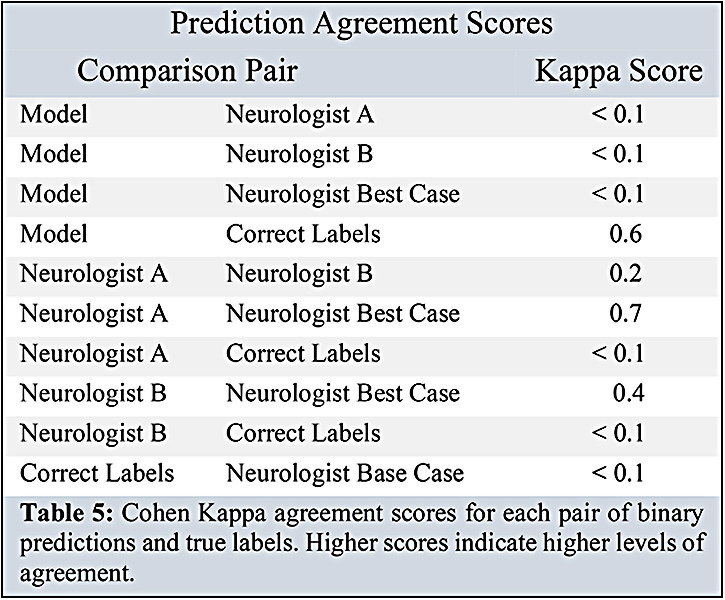
Table 4 shows the cross-validated performance metrics for our best optimized binary and multicategory models. The highest AUC binary model was a supervised support vector classifier (AUC 0.90). The multicategory model with the highest performance was a logistic regression with pseudo-labeling (f1-macro: 50.9, MSE: 0.68). Table 4 also compares our best performing models against the performance of the neurologists. The binary and multicategory models both outperformed the neurologists and neurologists-best-case (best-neurologist AUC: 0.560, best-neurologist f1 -macro: 0.264). Table 5 compares the Cohen kappa agreement scores between the best binary model, neurologist A, neurologist B, and neurologist-best-case.
Table 4:
Comparison of tuned classifiers’ and neurologists’ cross-validated performance metrics. Metrics are averaged across 10 holdout stratified testing folds. Standard deviation (o) across these folds is shown in parentheses. AUC is reported on a 0 to 1 scale (higher is better). Accuracy, precision, recall and f1 are reported as percentages (higher is better). Multicategory precision and recall scores are macro-averaged across classes. MSE (mean-squared-error) is unbounded (lower is better). *The best scores and models are marked with single asterisks.
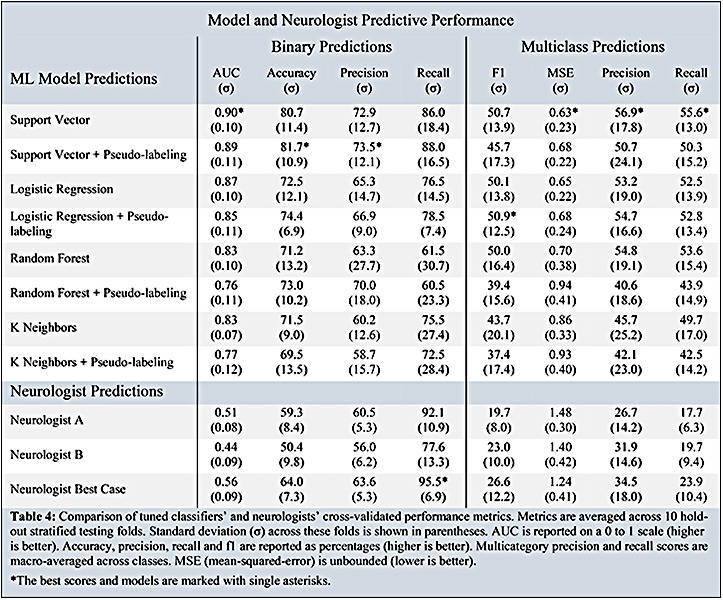
Table 5:
Cohen Kappa agreement scores for each pair of binary predictions and true labels. Higher scores indicate higher levels of agreement.
Discussion
In this study, we built, optimized, and analyzed eight machine learning models. Logistic regression and support vector classifiers seemed to produce the best fits to our data. Our models outperformed the clinical experts in a variety of performance metrics, suggesting that there may be a viable future for this type of tool in the clinic. The addition of imaging features in our analysis may have produced a significant performance improvement over similar studies which did not include them. In addition, we found several interesting outcome-correlations, including race, symptom-sidedness, psychiatric status, and putamen volume.
Our strongest binary classification model outperformed the trained neurologists. The strongest multicategory classification model achieved lower performance, yet still outperformed the neurologists. In both cases, the neurologists achieved high recall scores, but low AUC and f1 scores, suggesting a tendency to overpredict strong DBS response (predicting ’strong response’ for every patient in the binary case yields 100% recall). The low kappa interrater agreement scores between neurologists underscore the clinical difficulty in predicting DBS response. One possible explanation for the discrepancies between the neurologists is that they would not typically make predictions based on a binary indication of change in UPDRS III. Rather, neurologists consider a host of factors around motor fluctuations, medication responsiveness, and quality of life. Our study used a best-case agreement scheme to generate a set of the strongest predictions from our two board-certified neurologist-reviewers. Future analyses may benefit from an additional expert reviewer, as an odd number of reviewers would permit a majority-voting scheme to generate the best-case predictions.
Our best-fit binary model’s results rival those of previous ML studies in this arena.20 One major difference in our approach is the inclusion of imaging data into our predictor. Despite the performance improvement, imaging features are more difficult to obtain, and future end-users may prefer a tool which does not require them. These findings highlight the challenge of balancing performance with user-friendliness.
This study found a significant positive correlation between larger left putamen volumes and positive DBS response. Interestingly, other studies have noted decreased size and grey matter volume of the putamen in Parkinson’s and other neurodegenerative disorders.14,46 Further, research has shown that targeting the putamen with DBS improves motor fluctuations.47 It is possible that a larger putamen is easier to target with DBS, or that patients with larger putamen regions have less severe symptoms. The exact link is between DBS, tremor, and the putamen, is unknown but the limited research available suggests that a connection is probable. The differences observed in left and right putamen size significances may be due to differences in symptom-sidedness and/or surgical implant sidedness.
There was a strong correlation between race and DBS response. All three African American patients in this study experienced worsened motor symptoms. Additionally, one out of one Asian participant experienced worsened tremors. The small number of nonwhites in the study (5) makes it challenging to accurately analyze the impact of race on DBS response. Other research has indicated a lower prevalence of PD in African-Americans and Latinos, as compared with whites.48 These differences are believed not to be related to age, sex, income, insurance, or healthcare utilization, but rather biological or other differences.48 More longitudinal data are needed to thoroughly explore the interesting relationships between race and DBS response.
The difference in symptom sidedness and outcome may be related to differences observed in PD progression between symptom sidedness groups. Many studies have noted less severe cognitive symptoms in patients with right-sided symptoms and less severe motor symptoms in patients with left-sided symptoms.11-13 Our study noted motor outcome favorability for left-sided patients, which is consistent with the general observation of less severe motor outcomes in left-sided PD patients.
One limitation of our study is that we only included motor symptom scores (UPDRS III) as success benchmarks, while other studies have included broader features related to quality of life. For example, Habets et al. defined strong response relative to changes in UPDRS II, III, and IV.20 UPDRS II measures PD difficulties in daily life and UPDRS IV measures complications of therapy, while UPDRS III only measures motor fluctuation severity.24 Management of motor fluctuations is a major motivating factor in choosing to undergo DBS, so changes in their severity are a reasonable benchmark for DBS response. Further, we were able to gather a larger training cohort by only requiring UPDRS III measurements, which are more regularly recorded in our database. If we had access to more data, we would have liked to have included benchmarks from the PD-Q-39, UPDRS II, or UPDRS IV, which measure factors beyond motor symptoms in PD patients.23
Another limitation of this study is the lack of an external validation test set. We chose not to withhold a final test set due to the small size of our dataset (N=105) which could easily become overfit if the sample size were further reduced. We validated our results with 10-fold stratified cross validation, providing an optimistic estimate of our model’s fit.
Conclusion
Our predictive model produced a clinically significant performance improvement. These results are very promising for the future of DBS candidate evaluation, counselling, and expectation-setting. More work is necessary to validate these findings in a larger cohort and taking into consideration broader quality of life outcome measures. However, if these models can be further refined and validated in larger cohorts, it may be possible to deploy such a tool in the clinical setting to better support DBS candidate counselling, evaluation, and expectation setting.
Figures & Table
References
- 1.Marras C, Beck JC, Bower JH, et al. Prevalence of parkinson’s disease across north america. NPJ Parkinsons Dis. 2018;4:21. doi: 10.1038/s41531-018-0058-0. [DOI] [PMC free article] [PubMed] [Google Scholar]
- 2.Stroke NIoNDa. Deep brain stimulation for movement disorders Ninds.nih.gov2020 [Available from: https://www.ninds.nih.gov/Disorders/Patient-Caregiver-Education/Fact-Sheets/Deep-Brain-Stimulation-Movement-Disorders-Fact. [Google Scholar]
- 3.Stroke NIoNDa. Parkinson’s disease information page Ninds.nih.gov: National Institute of Health; 2020 [Available from: https://www.ninds.nih.gov/Disorders/Patient-Caregiver-Education/Fact-Sheets/Deep-Brain-Stimulation-Movement-Disorders-Fact. [Google Scholar]
- 4.Hu W, Stead M. Deep brain stimulation for dystonia. Transl Neurodegener. 2014;3(1):2. doi: 10.1186/2047-9158-3-2. [DOI] [PMC free article] [PubMed] [Google Scholar]
- 5.Groiss SJ, Wojtecki L, Südmeyer M, Schnitzler A. Deep brain stimulation in parkinson’s disease. Ther Adv Neurol Disord. 2009;2(6):20–8. doi: 10.1177/1756285609339382. [DOI] [PMC free article] [PubMed] [Google Scholar]
- 6.Flora ED, Perera CL, Cameron AL, Maddern GJ. Deep brain stimulation for essential tremor: A systematic review. Mov Disord. 2009;2(6):20–8. doi: 10.1002/mds.23195. [DOI] [PubMed] [Google Scholar]
- 7.2020. Stroke NIoNDa. Dystonias fact sheet Ninds.nih.gov: National Institute of Health. [Available from: https://www.ninds.nih.gov/disorders/patient-caregiver-education/fact-sheets/dystonias-fact-sheet. [Google Scholar]
- 8.Fenoy AJ, Simpson RK., Jr. Risks of common complications in deep brain stimulation surgery: Management and avoidance. J Neurosurg. 2009;2(6):20–8. doi: 10.3171/2013.10.JNS131225. [DOI] [PubMed] [Google Scholar]
- 9.Paul KC, Chuang YH, Shih IF, et al. The association between lifestyle factors and parkinson’s disease progression and mortality. Mov Disord. 2009;2(6):20–8. doi: 10.1002/mds.27577. [DOI] [PMC free article] [PubMed] [Google Scholar]
- 10.Martino R, Candundo H, Lieshout PV, Shin S, Crispo JAG, Barakat-Haddad C. Onset and progression factors in parkinson’s disease: A systematic review. Neurotoxicology. 2017;61:132–41. doi: 10.1016/j.neuro.2016.04.003. [DOI] [PubMed] [Google Scholar]
- 11.Baumann CR, Held U, Valko PO, Wienecke M, Waldvogel D. Body side and predominant motor features at the onset of parkinson’s disease are linked to motor and nonmotor progression. Movement Disorders. 2009;2(6):20–8. doi: 10.1002/mds.25650. [DOI] [PubMed] [Google Scholar]
- 12.Katzen HL, Levin BE, Weiner W. Side and type of motor symptom influence cognition in parkinson’s disease. Movement Disorders. 2009;2(6):20–8. doi: 10.1002/mds.21105. [DOI] [PubMed] [Google Scholar]
- 13.Tomer R, Levin BE, Weiner WJ. Side of onset of motor symptoms influences cognition in parkinson’s disease. Annals of Neurology. 2009;2(6):20–8. doi: 10.1002/ana.410340412. [DOI] [PubMed] [Google Scholar]
- 14.Luo X, Mao Q, Shi J, Wang X, Li CR. Putamen gray matter volumes in neuropsychiatric and neurodegenerative disorders. World J Psychiatry Ment Health Res. 2019;3(1) [PMC free article] [PubMed] [Google Scholar]
- 15.Kleiner-Fisman G, Herzog J, Fisman DN, et al. Subthalamic nucleus deep brain stimulation: Summary and meta-analysis of outcomes. Movement Disorders. 2009;2(6):20–8. doi: 10.1002/mds.20962. [DOI] [PubMed] [Google Scholar]
- 16.Frizon LA, Hogue O, Achey R, et al. Quality of life improvement following deep brain stimulation for parkinson disease: Development of a prognostic model. Neurosurgery. 2009;2(6):20–8. doi: 10.1093/neuros/nyy287. [DOI] [PubMed] [Google Scholar]
- 17.Schuepbach WMM, Tonder L, Schnitzler A, et al. Quality of life predicts outcome of deep brain stimulation in early parkinson disease. Neurology. 2009;2(6):20–8. doi: 10.1212/WNL.0000000000009045. [DOI] [PubMed] [Google Scholar]
- 18.Zaidel A, Bergman H, Ya Ritov, MD ZI. Levodopa and subthalamic deep brain stimulation responses are not congruent. Movement Disorders. 2009;2(6):20–8. doi: 10.1002/mds.23294. [DOI] [PubMed] [Google Scholar]
- 19.Rowe M. An introduction to machine learning for clinicians. Acad Med. 2009;2(6):20–8. doi: 10.1097/ACM.0000000000002792. [DOI] [PubMed] [Google Scholar]
- 20.Habets JGV, Janssen MLF, Duits AA, et al. Machine learning prediction of motor response after deep brain stimulation in parkinson’s disease-proof of principle in a retrospective cohort. PeerJ. 2020;8:e10317. doi: 10.7717/peerj.10317. [DOI] [PMC free article] [PubMed] [Google Scholar]
- 21.Houston B, Thompson M, Ko A, Chizeck H. A machine-learning approach to volitional control of a closed-loop deep brain stimulation system. J Neural Eng. 2014;3(1):2. doi: 10.1088/1741-2552/aae67f. [DOI] [PubMed] [Google Scholar]
- 22.Park SC, Cha JH, Lee S, Jang W, Lee CS, Lee JK. Deep learning-based deep brain stimulation targeting and clinical applications. Front Neurosci. 2019;13:1128. doi: 10.3389/fnins.2019.01128. [DOI] [PMC free article] [PubMed] [Google Scholar]
- 23.Jenkinson C, Fitzpatrick R, Peto V, Greenhall R, Hyman N. The parkinson’s disease questionnaire (pdq-39): Development and validation of a parkinson’s disease summary index score. Age Ageing. 2009;2(6):20–8. doi: 10.1093/ageing/26.5.353. [DOI] [PubMed] [Google Scholar]
- 24.The unified parkinson’s disease rating scale (updrs): Status and recommendations. Mov Disord. 2009;2(6):20–8. doi: 10.1002/mds.10473. [DOI] [PubMed] [Google Scholar]
- 25.Homack S, Lee D, Riccio CA. Test review: Delis-kaplan executive function system. J Clin Exp Neuropsychol. 2009;2(6):20–8. doi: 10.1080/13803390490918444. [DOI] [PubMed] [Google Scholar]
- 26.Wechsler D. Wechsler test of adult reading: Wtar: Psychological Corporation. 2001.
- 27.Randolph C, Tierney MC, Mohr E, Chase TN. The repeatable battery for the assessment of neuropsychological status (rbans): Preliminary clinical validity. J Clin Exp Neuropsychol. 2009;2(6):20–8. doi: 10.1076/jcen.20.3.310.823. [DOI] [PubMed] [Google Scholar]
- 28.Scikit-learn. Variancethreshold scikit-learn.org2020 [version 0.24.1:[Available from: https://scikit-learn.org/stable/modules/generated/sklearn.feature_selection.VarianceThreshold.html. [Google Scholar]
- 29.Scikit-learn. Selectkbest scikit-learn.org2020 [Available from: https://scikit-learn.org/stable/modules/generated/sklearn.feature_selection.SelectKBest.html. [Google Scholar]
- 30.McHugh ML. The chi-square test of independence. Biochem Med (Zagreb) 2009;2(6):20–8. doi: 10.11613/BM.2013.018. [DOI] [PMC free article] [PubMed] [Google Scholar]
- 31.Scikit-learn. Standardscaler 2020 [version 0.24.1:[Available from: https://scikit-learn.org/stable/modules/generated/sklearn.preprocessing.StandardScaler.html. [Google Scholar]
- 32.Scikit-learn. Minmaxscaler scikit-learn.org2020 [verison 0.24.1:[Available from: https://scikit-learn.org/stable/modules/generated/sklearn.preprocessing.RobustScaler.html. [Google Scholar]
- 33.Scikit-learn. Robustscaler scikit-learn.org2020 [version 0.24.1:[Available from: https://scikit-learn.org/stable/modules/generated/sklearn.preprocessing.RobustScaler.html. [Google Scholar]
- 34.Chawla NVaB K. W., Hall L. O., Kegelmeyer W. P. Smote: Synthetic minority over-sampling technique. Journal of Artificial Intelligence Research. 2009;2(6):20–8. [Google Scholar]
- 35.Scikit-learn. Pca scikit-learn.org2020 [version 0.24.1:[Available from: https://scikit-learn.org/stable/modules/generated/sklearn.decomposition.PCA.html. [Google Scholar]
- 36.Scikit-learn. Kernelpca scikit-learn.org2020 [version 0.24.1:[Available from: https://scikit-learn.org/stable/modules/generated/sklearn.decomposition.KernelPCA.html. [Google Scholar]
- 37.Nick TG, Campbell KM. Logistic regression. Methods Mol Biol. 2007;404:273–301. doi: 10.1007/978-1-59745-530-5_14. [DOI] [PubMed] [Google Scholar]
- 38.Huang S, Cai N, Pacheco PP, Narrandes S, Wang Y, Xu W. Applications of support vector machine (svm) learning in cancer genomics. Cancer Genomics Proteomics. 2009;2(6):20–8. doi: 10.21873/cgp.20063. [DOI] [PMC free article] [PubMed] [Google Scholar]
- 39.Breiman L. Random forests. Machine Learning. 2009;2(6):20–8. [Google Scholar]
- 40.Sarica A, Cerasa A, Quattrone A. Random forest algorithm for the classification of neuroimaging data in alzheimer’s disease: A systematic review. Frontiers in Aging Neuroscience. 2017;9:329. doi: 10.3389/fnagi.2017.00329. [DOI] [PMC free article] [PubMed] [Google Scholar]
- 41.Zhang Z. Introduction to machine learning: K-nearest neighbors. Ann Transl Med. 2014;3(1):2. doi: 10.21037/atm.2016.03.37. [DOI] [PMC free article] [PubMed] [Google Scholar]
- 42.Hao W, Prasad S. Semi-supervised deep learning using pseudo labels for hyperspectral image classification. IEEE Trans Image Process. 2009;2(6):20–8. doi: 10.1109/TIP.2017.2772836. [DOI] [PubMed] [Google Scholar]
- 43.Scikit-learn. Cross-validation: Evaluating estimator performance scikit-learn.org2020 [version 0.24.1:[Available from: https://scikit-learn.org/stable/modules/cross_validation.html#stratified-k-fold. [Google Scholar]
- 44.Ling CX, Huang J, Zhang H, editors. Berlin, Heidelberg: Springer Berlin Heidelberg; Auc: A better measure than accuracy in comparing learning algorithms2003; [Google Scholar]
- 45.Visani MGaEBaG. Metrics for multi-class classification: An overview. Statistics arXiv. 2020.
- 46.Pitcher TL, Melzer TR, Macaskill MR, et al. Reduced striatal volumes in parkinson’s disease: A magnetic resonance imaging study. Transl Neurodegener. 2014;3(1):2. doi: 10.1186/2047-9158-1-17. [DOI] [PMC free article] [PubMed] [Google Scholar]
- 47.Montgomery EB, Jr., Huang H, Walker HC, Guthrie BL, Watts RL. High-frequency deep brain stimulation of the putamen improves bradykinesia in parkinson’s disease. Mov Disord. 2009;2(6):20–8. doi: 10.1002/mds.23842. [DOI] [PMC free article] [PubMed] [Google Scholar]
- 48.Dahodwala N, Siderowf A, Xie M, Noll E, Stern M, Mandell DS. Racial differences in the diagnosis of parkinson’s disease. Mov Disord. 2009;2(6):20–8. doi: 10.1002/mds.22557. [DOI] [PMC free article] [PubMed] [Google Scholar]


