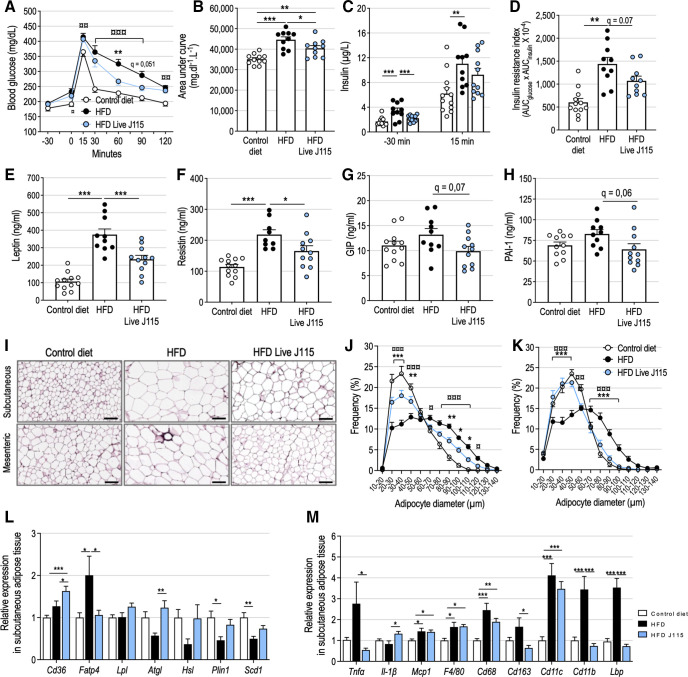
Figure 4.
Live Dysosmobacter welbionis J115T reduces adipose tissue expansion and inflammation on high-fat diet (HFD) and improves altered metabolic profile. (A) Plasma glucose profile and (B) mean area under the curve measured during an oral glucose tolerance test (OGTT). (C) Plasma insulin measured 30 min before and 15 min after glucose administration during the OGTT. (D) Insulin resistance index. (E) Leptin, (F) resistin, (G) glucose-dependent insulinotropic polypeptide (GIP) and (H) plasminogen activator inhibitor-1 (PAI-1) plasma levels after a 6 hours fasting period. (I) Representative H&E-stained pictures of subcutaneous and mesenteric adipose tissues (SAT and MAT, respectively). Scale bar=100 µm. (J) Adipocytes diameter (µm) distribution in the SAT. (K) Adipocytes diameter (µm) distribution in the MAT. (L) Relative expression of genes related to lipid metabolism in the SAT. (M) Relative expression of genes related to inflammation and immune system in the SAT. Number of mice per group: 9–12. Results are represented as dot plots and bar plots with mean±SEM for figure parts B–H and as bar plots with mean±SEM for figure parts L and M. Data were analysed using one-way analysis of variance (ANOVA) followed by Tukey’s post hoc test for figure parts B–H, L and M and two-way repeated measures ANOVA for figure parts A, J and K. *q<0.05; **q<0.01; ***q<0.001 for HFD versus HFD Live J115 comparisons and ¤¤q<0.01 control versus HFD, ¤¤¤q<0.001 for control versus HFD comparisons. HFD, high-fat diet.

