

Abstract
Background:
Impaired brain energy metabolism is a key feature of Parkinson’s disease (PD). Terazosin (TZ) binds phosphoglycerate kinase 1 and stimulates its activity, which enhances glycolysis and increases ATP levels. Preclinical and epidemiologic data suggest that TZ may be neuroprotective in PD. We aimed to assess target engagement and safety of TZ in people with PD.
Methods:
We performed a 12-week pilot study in people with PD. Participants were randomized to receive 5 mg TZ or placebo. Participants and study personnel were blinded. We assessed TZ target engagement by measuring brain ATP with 31P-magnetic resonance spectroscopy (MRS) and whole blood ATP with a luminescence assay. Robust linear regression models compared changes between groups controlling for baseline brain and blood ATP levels, respectively. We also assessed clinical measures of PD and adverse events.
Results:
Thirteen participants were randomized. Mild dizziness/lightheadedness was more common in the TZ group, and three participants taking TZ dropped out because of dizziness and/or orthostatic hypotension. Compared to the placebo group, the TZ group had a significant increase in the ratio of βATP to inorganic phosphate in the brain. The TZ group also had a significant increase in blood ATP levels compared to the placebo group (p<0.01).
Conclusions:
This pilot study suggests that TZ may engage its target and change ATP levels in the brain and blood of people with PD. Further studies may be warranted to test the disease-modifying potential of TZ.
1. INTRODUCTION
Impaired brain energy metabolism is a key feature of Parkinson’s disease (PD) [1, 2]. This is supported by several findings. Aging impairs glucose metabolism in the brain and is a major risk factor for PD [3], mutations associated with a predisposition to PD impair mitochondrial function [4], and compounds that induce mitochondrial toxicity, such as MPTP and rotenone, cause PD [5]. Thus, therapeutic strategies that overcome bioenergetic deficits in the brain could benefit people with PD. We recently discovered that terazosin (TZ), an α−1 adrenergic receptor antagonist prescribed for benign prostatic hyperplasia (BPH), also binds and stimulates phosphoglycerate kinase 1 (PGK1) activity [6, 7]. TZ enhances glycolysis and increases ATP levels [6, 7]. In toxin-induced and genetic models of PD in mice, rats, flies, and induced pluripotent stem cells, TZ slowed or prevented neuron loss [6]. In animals, this benefit was associated with an increase in striatal ATP levels [6]. In addition, analyses of three independent databases, the Truven Health Analytics MarketScan, Danish Nationwide Health Registries, and Optum Research, suggest that use of TZ may reduce the risk of developing PD relative to patients taking tamsulosin, an α−1 adrenergic receptor antagonist also prescribed for BPH that does not bind to PGK1 and does not increase ATP [6, 8, 9]. Analysis of the Parkinson’s Progression Markers Initiative database revealed that TZ slowed progression of PD relative to those taking tamsulosin or neither drug [6].
Because the neuroprotective effects of TZ in animals and cells are mediated by PGK1, the goal of this study was to learn if TZ also engages its PGK1 target in people with PD and increases ATP levels. We assessed target engagement in the brain using 31P-magnetic resonance spectroscopy (31P-MRS). Previous studies using 31P-MRS in PD have reported decreased ATP levels [10, 11], but 31P-MRS has not been used as a means to measure target engagement of a therapeutic. We also assessed target engagement in the periphery by measuring ATP in whole blood with a luminescence assay. Because orthostatic hypotension is a TZ side-effect, and because orthostatic hypotension often complicates PD [12], a secondary goal was to obtain preliminary data about safety.
2. METHODS
2.1. Participants
Participants were recruited from the University of Iowa Hospitals and Clinic’s Movement Disorders Division. Inclusion criteria were a PD diagnosis that conformed to UK Brain Bank Criteria by a subspecialty trained movement-disorders physician, age ≥40 years old, and a Hoehn & Yahr score of 1 to 3. Participants were eligible even if taking medications to treat their PD. Participants were excluded if they had orthostatic hypotension at the time of screening or if they reported a history of orthostatic hypotension. Additionally, participants were excluded if they reported current or past use of any α−1 adrenergic receptor antagonist, including TZ, doxazosin, alfuzosin, or tamsulosin. Written informed consent was obtained from each participant prior to study initiation. The protocols and procedures were approved by the University of Iowa Institutional Review Board (IRB #201902772). This study was registered on clinicaltrials.gov (NCT03905811).
2.2. Study design
The 12-week study design is shown in Fig. 1A. This was a double-blinded study where all participants and study personnel were blinded to treatment and participants were randomized to TZ or placebo in a 1:1 fashion using a random number generator maintained by the study pharmacy. Participants started taking 1 mg TZ daily and each week increased by 1 mg; after four weeks they continued 5 mg TZ daily for the remainder of the study. We chose this dose because the average daily dose of TZ from epidemiologic studies showing benefit in patients with PD was approximately 5 mg per day[6]. TZ was purchased from NuCara Compounding Pharmacy (Coralville, IA). The pharmacy over-encapsulated commercially available TZ capsules and created a matched placebo using the same methods.
Figure 1. Study Design and Results.
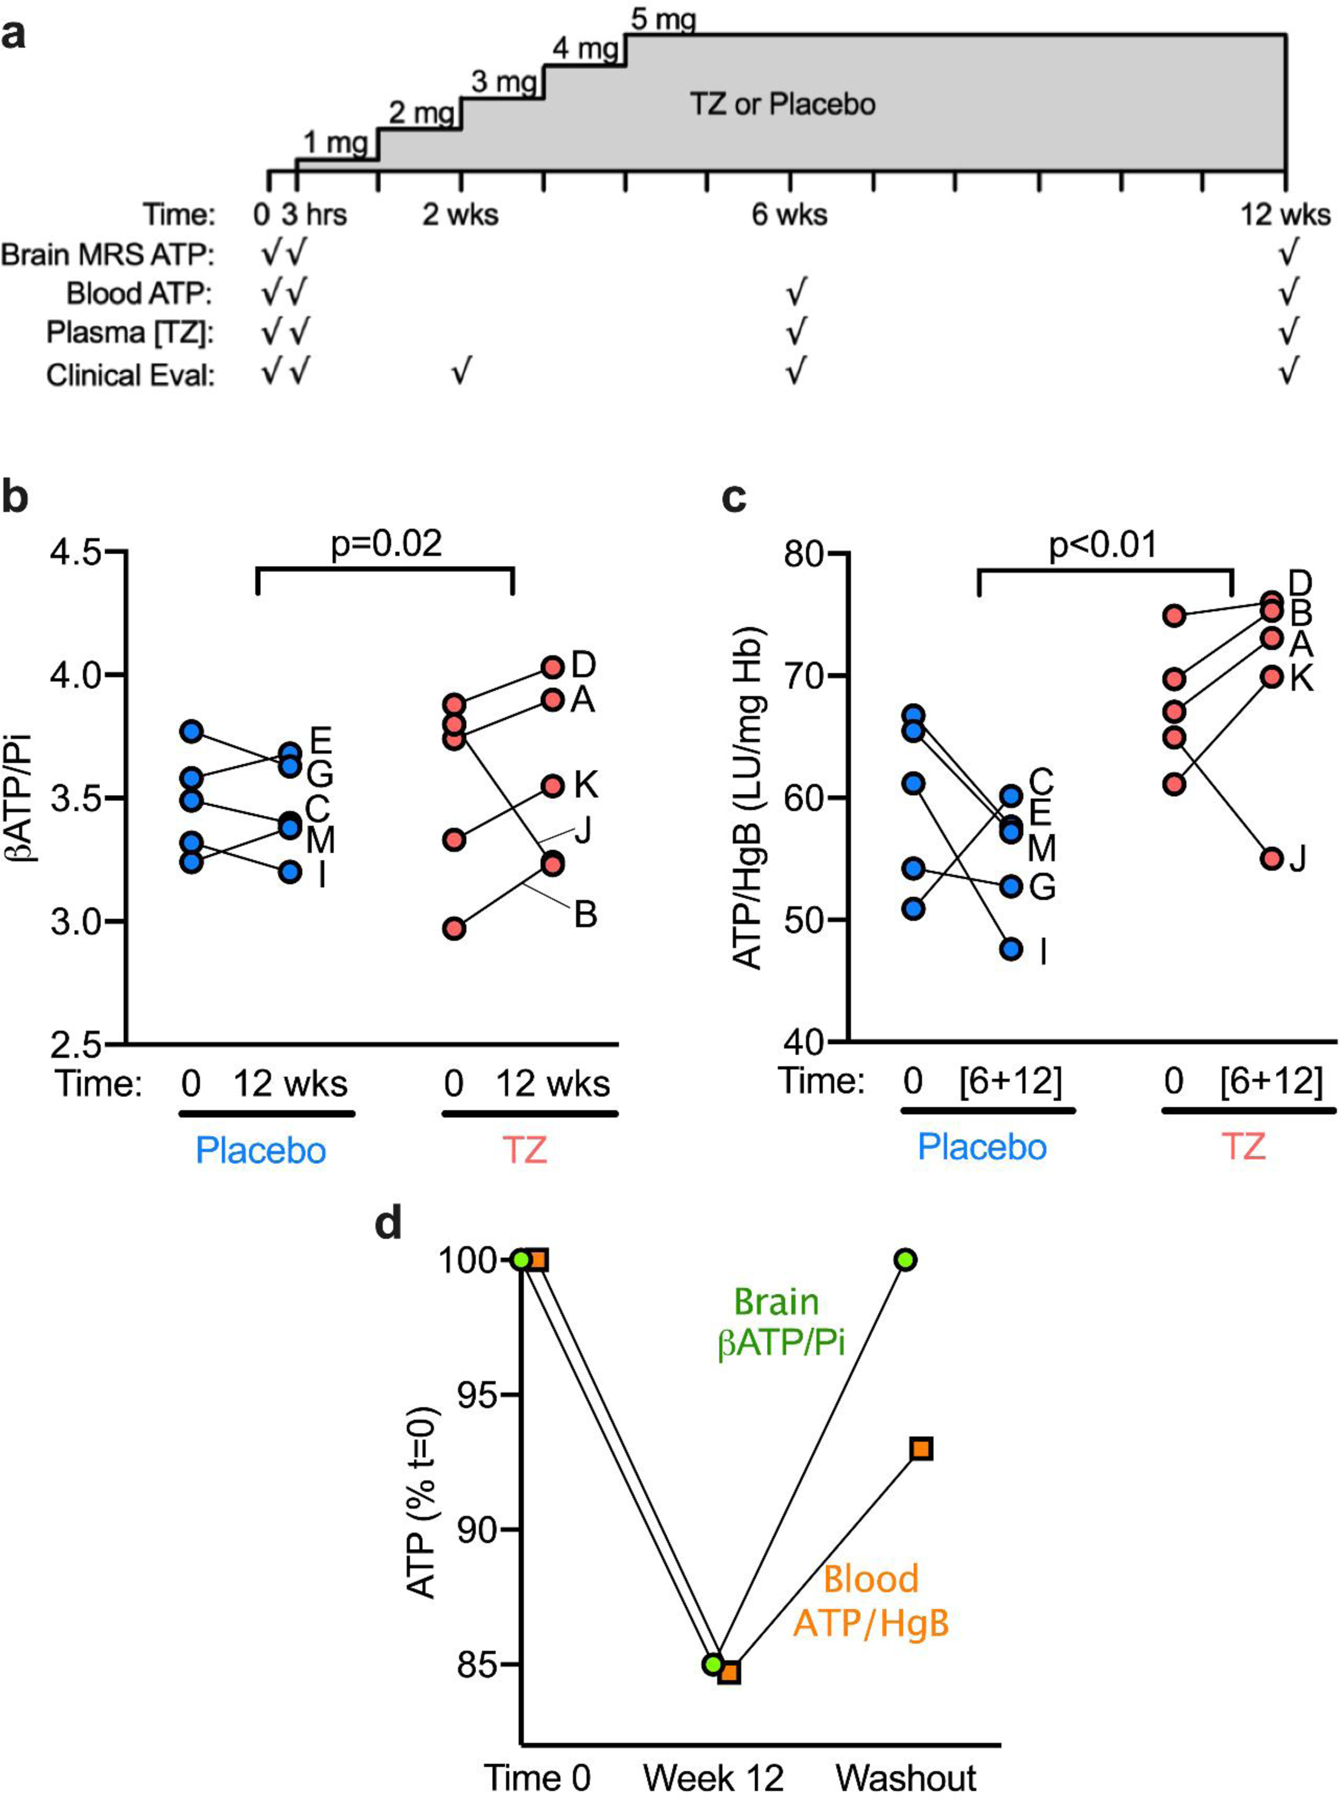
a) Schematic of study drug administration and assessments. Participants underwent indicated assessments at time 0 prior to initiation of TZ or placebo, then at 3 hours after a single dose of study drug, and again at 2 weeks, 6 weeks, and 12 weeks.
b-c) Data for individual participants is indicated by letters A-J.
b) The mean change over 12 weeks in βATP/Pi in the placebo group was −0.02 ± 0.13 (mean ± SD) compared to +0.05 ± 0.35 in the TZ group (t=3.16, p=0.015).
c) The mean change in the placebo group was −4.63 ± 8.88 compared to + 2.33 ± 7.39 in the TZ group (t=5.03, p=0.002).
d) In Participant J, the TZ-associated decrease in brain and whole blood ATP was reversible 24 weeks after the discontinuation of TZ. Data are the percentage change in βATP/Pi in brain and ATP/HgB in whole blood at 12 weeks and after 24 weeks off TZ. Data are normalized to time 0, before beginning TZ.
ATP: Adenosine triphosphate
MRS: 31Phosphate Magnetic Resonance Spectroscopy
Hgb: Hemoglobin
LU: Luminescence
Pi: Inorganic phosphate
The COVID-19 pandemic caused a pause in research activities after eight participants had been randomized but not yet completed the trial. Participation continued with at-home monitoring and videoconferencing. When limited clinical research resumed, the remaining participants were brought in for their final visit. We refer to the last evaluation as the 12-week timepoint, although because of the pandemic disruption, some participants received study drug for longer than 12 weeks (Supplementary Table 1).
2.3. Clinical procedures
Participants came to study visits in the practically defined ‘OFF’ state, after having held their dopaminergic medications overnight for at least 12 hours. Participants were assessed for orthostatic hypotension, tolerability, drug-related adverse effects, the Unified Parkinson’s Disease Rating Scale (UPDRS), and the timed up-and-go (TUG) assessment.
To quantify plasma TZ concentration, we developed a liquid chromatography-mass spectrometery (LC-MS) method to measure TZ levels.
2.4. Phosphorous magnetic resonance spectroscopy (31P-MRS)
TZ increases ATP levels in the brains of rodents and flies [6]. Therefore, we measured the ratio of βATP to inorganic phosphate (βATP/Pi) in brain with 31P-MRS a non-invasive means to measure high energy phosphates [13]. Earlier studies using 31P-MRS reported decreased ATP levels and decreased βATP/Pi ratios in the brain of people with PD [10, 11]. βATP/Pi also decreases with aging, the major risk factor for PD [14]. Participants were allowed to take their regular dopaminergic medications prior to 31P-MRS neuroimaging. All scans were performed on a GE MR950 7T scanner equipped with a RAPID Biomedical 31P/1H dual tuned birdcage head coil. The 31P-MRS data was acquired using a free induction decay (FID) sequence with a rectangular-shaped excitation pulse of short duration (152 μs) and flip angle of 20⁰. Other parameters for FID sequence include the TR=2000 ms, number of sampling points=2048, and spectral width=10,000Hz. Further information regarding acquisition and processing of images is contained in the supplementary materials.
2.5. Luminescence assay to quantify changes in blood ATP
Because PGK1 is expressed in all cells and because TZ increases ATP levels in cultured cell lines and induced pluripotent stem cell-derived dopamine neurons from patients with PD [6, 7], we also measured whole blood ATP (ATP/HgB) with a luminescence assay. We collected and lysed whole blood and stored it until all blood draws were complete. ATP was measured with a luciferase-based assay. Whole blood ATP levels were normalized to hemoglobin levels measured with a calorimetric assay [15]. To minimize experimental variation, we averaged the 6- and 12-week measures of whole blood ATP/HgB; at the 6-week time point, participants had been taking 5 mg TZ for 2 weeks, and plasma TZ concentrations were stable between 6 and 12 week (Supplementary Table 1).
We did not calculate sample size prior to this study as this was a pilot study and the goal was to estimate changes in ATP levels via 31P-MRS and whole-blood luminescence assays as a function of TZ use to guide subsequent clinical trials. Additional details for participants and all aspects of the study are in Supplementary Information.
RESULTS
We enrolled 13 participants; eight were randomized to receive TZ and five to receive placebo (Table 1). The TZ and placebo groups were well-matched on age and sex. The TZ group tended to have a lower BMI than the placebo group. There were no group differences in clinical severity of PD or duration of disease at baseline.
Table 1.
Baseline Demographics and Plasma TZ Concentrations.
| Terazosin (N=8) |
Placebo (N=5) |
p-value | |
|---|---|---|---|
| Age (yrs), mean ± SD | 64.8 ± 6.1 | 68.8 ± 6.6 | 0.30 |
| Male, % (n) | 37.5 (3) | 60.0 (3) | 0.83 |
| BMI, mean ± SD | 24.8 ± 5.3 | 31.3 ± 6.6 | 0.08 |
| Baseline UPDRS Total Score | 25.3 ± 8.6 | 32.4 ± 10.7 | 0.21 |
| Baseline UPDRS, Part 3 | 14.8 ± 6.5 | 19.4 ± 12.1 | 0.38 |
| Baseline Systolic Blood Pressure (sitting), mean ± SD | 139 ± 20 | 139 ± 16 | 0.99 |
| Baseline Diastolic Blood Pressure (sitting), mean ± SD | 78 ± 10 | 79 ± 3 | 0.81 |
| Duration of Disease (yrs), mean ± SD | 5.7 ± 3.2 | 4.1 ± 2.6 | 0.34 |
| TZ plasma concentration at 3 hours (μg/mL), mean ± SD | 0.03 ± 0.01 | 0.0 ± 0.0 | <0.05 |
| TZ plasma concentration at 6 weeks (μg/mL), mean ± SD | 0.08 ± 0.03 | 0.0 ± 0.0 | <0.05 |
| TZ plasma concentration at 12 weeks (μg/mL), mean ± SD | 0.07 ± 0.02 | 0.0 ± 0.0 | <0.05 |
BMI: Body Mass Index; mL: milliliter; SD: Standard Deviation; μg: microgram; TZ: Terazosin
UPDRS: Unified Parkinson’s Disease Rating Scale
3.1. Safety and tolerability
Dizziness/lightheadedness was more common in the TZ group (P=0.01) and three participants taking TZ dropped out because of dizziness and/or orthostatic hypotension. The mean (95% confidence interval) orthostatic change (supine to standing for three minutes) in systolic blood pressure at baseline was +5 mmHg (95% CI [−7 – 17]) in the placebo group and +2 mmHg (95% CI [−8 – 11]) in the TZ group. After 12 weeks, the mean change was −1 mmHg (95% CI [−13 – 11]) in the placebo group and −13 mmHg (95% CI [−25 – −2]) in the TZ group. The mean change in diastolic blood pressure at baseline was −5 mmHg (95% CI [−10 – 0]) compared to −1 mmHg (95% CI [ −5 – 2]) in the placebo and TZ groups, respectively. After 12 weeks, the means were +3 mmHg (95% CI [−5 – 11]) and +5 mmHg (95% CI [−3 – 13]) in the placebo and TZ groups, respectively. Five participants in each group completed the study. Plasma TZ levels were stable at 6 and 12 weeks. See supplementary information for additional results.
3.2. 31P-MRS findings
Participants in the TZ group had a mean increase over 12 weeks in βATP/Pi of 0.19 (95% CI [0.12 – 0.27]) compared to a mean decrease of −0.03 (95% CI [−0.11 – 0.05]) in the placebo group. A robust linear regression model, which accounted for the outlier, indicated that the change between groups was significant (P=0.02). At 12 weeks, we found that brain βATP/Pi increased compared to baseline values in 4 of 5 persons taking TZ and 2 of 5 taking placebo (Figure 1b). The increase in βATP/Pi was greater for those 4 TZ-treated participants than for any of the placebo group.
3.3. ATP/HgB levels in whole blood
Participants taking TZ had a mean increase in ATP/HgB of 8.96 LU/mg Hb (95% CI [ 6.20 – 11.73]) compared to −7.61 LU/mg Hb in the placebo group (95% CI [−10.38 – −4.85]) (P<0.01; Figure 1c). Of note, there was a direct correlation between the change in ATP/HgB and βATP/Pi amongst the patients in the TZ group (r2=0.94, p=0.02); however, such an association did not exist in the placebo group (r2=−0.33, p=0.58).
3.4. A TZ-induced decrease in ATP
In Participant J, both brain βATP/Pi and blood ATP/HgB levels decreased, a striking difference from other participants taking TZ (Figure 1b,1c). To further test whether these changes in Participant J might be attributed to TZ, we repeated measurements after a 24-week washout (Figure 1d). ATP levels returned toward basal values in both brain and blood.
3.5. TZ did not change clinical outcomes
TZ did not significantly change clinical assays of PD severity over the course of the 12-week study (Supplemental Figure 2). The mean change in the UPDRS Total Motor Score was 3.8 ± 18.9 (mean ± SD) in the placebo group and 8.3 ± 7.0 in the TZ group (P=0.61). The mean change in the UPDRS part 3 score was 4.4 ± 15.5 in the placebo group and 8.2 ± 6.0 in the TZ group (P=0.59). The mean change in the timed-up-and-go assessment (TUG) was +0.04 ± 0.9 sec. in the placebo group and −0.4 ± 1.2 sec in the TZ group (P=0.59).
4. DISCUSSION
We conducted a pilot of target engagement and safety of TZ in people with PD. The study was double-blind, randomized, and placebo-controlled over 12 weeks. Despite the limited sample size, our results have several implications.
Data from this pilot study have several implications. First, TZ may alter ATP levels in the brain of people with PD. The results match previous studies showing that TZ stimulates glycolysis and increases ATP levels in cell lines, iPSC dopamine neurons from patients with PD, and Drosophila and mouse brain [6, 7].
TZ may increase ATP levels in whole blood. These data also suggest that TZ engaged its target in humans with PD. If future studies indicate that whole-blood ATP assays or another assay of peripheral metabolism parallel brain ATP changes, it could benefit large studies by simplifying the experimental requirements.
TZ administration may have decreased ATP levels in one participant. At high concentrations, TZ interferes with PGK1 enzymatic activity [6]. Participant J had a high TZ concentration, but it was in the same range as other participants. We speculate that some difference in Participant J’s PGK1 or metabolism might have accounted for her divergent response to TZ. This result suggests the possibility of person-to-person variability in the response to TZ. Because we did not study a broad range of PD patients, we cannot identify a specific type of patient that may be most or least likely to benefit from TZ, but future studies of ATP responses to TZ may provide insight on this issue.
Our results suggest that administering TZ to people with PD requires vigilance for orthostatic hypotension. Autonomic insufficiency is a common occurrence in PD, and it often manifests as orthostatic hypotension. TZ is an α1-adrenergic receptor antagonist prescribed for BPH and rarely for hypertension. A known consequence of inhibiting the α1-adrenergic receptor is orthostatic hypotension; this is the reason that patients starting a TZ prescription for BPH begin with a low dose of 1 mg/day and then gradually increase the dose. Of note, TZ has been safely prescribed for several decades, most often in older men including thousands of patients with PD [8, 9].
Our findings provide evidence that TZ engaged its target in people with PD. Importantly, we used two independent metrics – 31P-MRS and whole-blood measures of ATP/HgB. These results, combined with mechanistic data in multiple PD animal models [6], retrospective analyses of the Parkinson’s Progression Markers Initiative database revealing that TZ slowed progression of PD [6], and independent retrospective pharmacoepidemiologic analyses of three large administrative databases revealing that use of TZ is associated with a decreased risk of PD [8, 9] support prospective, randomized, placebo-controlled trials to determine if TZ is effective in slowing or preventing neurodegeneration in PD. Our data may be informative for such studies.
Supplementary Material
ACKNOWLEDGEMENTS
This study was funded by NIH Grant 5UL1TR002537–04 through the University of Iowa Institute for Clinical and Translational Science and was conducted using equipment supported by NIH Grant S10RR028821. MJW is an investigator of the Howard Hughes Medical Institute. The study sponsors had no role in the conduct, analysis, or reporting of these results.
Footnotes
COMPETING INTERESTS:
The University of Iowa Research Foundation has filed patents for intellectual property related to use of TZ and related compounds for neurodegeneration. LL and MJW are co-founders of Shandong Bangentai Biomedical Technology Group Co., Ltd in Jinan, China. This company is working to develop treatments for people with PD. The authors declare no other competing interests.
ADDITIONAL INFORMATION
Supplementary information is available for this paper. Correspondence and requests for materials should be addressed to JLS, MJW or NSN.
REFERENCES
- [1].Schapira AH, Mitochondria in the aetiology and pathogenesis of Parkinson’s disease., Lancet Neurol 7(1) (2008) 97–109. [DOI] [PubMed] [Google Scholar]
- [2].Saxena U, Bioenergetics failure in neurodegenerative diseases: back to the future., Expert Opin Ther Targets 16(4) (2012) 351–4. [DOI] [PubMed] [Google Scholar]
- [3].Hoyer S, Brain glucose and energy metabolism during normal aging, Aging (Milano) 2(3) (1990) 245–58. [DOI] [PubMed] [Google Scholar]
- [4].Schapira AH, Mitochondrial complex I deficiency in Parkinson’s disease, Adv Neurol 60 (1993) 288–91. [PubMed] [Google Scholar]
- [5].Blesa J, Phani S, Jackson-Lewis V, Przedborski S, Classic and new animal models of Parkinson’s disease, J Biomed Biotechnol 2012 (2012) 845618. [DOI] [PMC free article] [PubMed] [Google Scholar]
- [6].Cai R, Zhang Y, Simmering JE, Schultz JL, Li Y, Fernandez-Carasa I, Consiglio A, Raya A, Polgreen PM, Narayanan NS, Yuan Y, Chen Z, Su W, Han Y, Zhao C, Gao L, Ji X, Welsh MJ, Liu L, Enhancing glycolysis attenuates Parkinson’s disease progression in models and clinical databases, J Clin Invest 129(10) (2019) 4539–4549. [DOI] [PMC free article] [PubMed] [Google Scholar]
- [7].Chen X, Zhao C, Li X, Wang T, Li Y, Cao C, Ding Y, Dong M, Finci L, Wang JH, Li X, Liu L, Terazosin activates Pgk1 and Hsp90 to promote stress resistance., Nat Chem Biol 11(1) (2015) 19–25. [DOI] [PMC free article] [PubMed] [Google Scholar]
- [8].Simmering JE, Welsh MJ, Liu L, Narayanan NS, Pottegard A, Association of glycolysis-enhancing alpha-1 blockers with risk of developing Parkinson Disease, JAMA Neurol 78(4) (2021) 407–413. [DOI] [PMC free article] [PubMed] [Google Scholar]
- [9].Sasane R, Bartels A, Field M, Sierra MI, Duvvuri S, Gray DL, Pin SS, Renger JJ, Stone DJ, Parkinson disease among patients treated for benign prostatic hyperplasia with alpha1 adrenergic receptor antagonists, J Clin Invest 131(11) (2021). [DOI] [PMC free article] [PubMed] [Google Scholar]
- [10].Hattingen E, Magerkurth J, Pilatus U, Mozer A, Seifried C, Steinmetz H, Zanella F, Hilker R, Phosphorus and proton magnetic resonance spectroscopy demonstrates mitochondrial dysfunction in early and advanced Parkinson’s disease., Brain 132(Pt 12) (2009) 3285–97. [DOI] [PubMed] [Google Scholar]
- [11].Montagna P, Pierangeli G, Cortelli P, Zaniol P, Funicello R, Lugaresi E, Barbiroli B, Brain oxidative metabolism in Parkinson’s Disease studied by phosphorus 31 magnetic resonance spectroscopy, J Neuroimaging 3(4) (1993) 225–228. [Google Scholar]
- [12].Hiorth YH, Pedersen KF, Dalen I, Tysnes OB, Alves G, Orthostatic hypotension in Parkinson disease: a 7-year prospective population-based study, Neurology 93(16) (2019) e1526–e1534. [DOI] [PubMed] [Google Scholar]
- [13].Hu MT, Taylor-Robinson SD, Chaudhuri KR, Bell JD, Labbe C, Cunningham VJ, Koepp MJ, Hammers A, Morris RG, Turjanski N, Brooks DJ, Cortical dysfunction in non-demented Parkinson’s disease patients: a combined (31)P-MRS and (18)FDG-PET study, Brain 123 ( Pt 2) (2000) 340–52. [DOI] [PubMed] [Google Scholar]
- [14].van der Knaap MS, van der Grond J, van Rijen PC, Faber JA, Valk J, Willemse K, Age-dependent changes in localized proton and phosphorus MR spectroscopy of the brain, Radiology 176(2) (1990) 509–15. [DOI] [PubMed] [Google Scholar]
- [15].Kirby BS, Hanna G, Hendargo HC, McMahon TJ, Restoration of intracellular ATP production in banked red blood cells improves inducible ATP export and suppresses RBC-endothelial adhesion, Am J Physiol Heart Circ Physiol 307(12) (2014) H1737–44. [DOI] [PMC free article] [PubMed] [Google Scholar]
Associated Data
This section collects any data citations, data availability statements, or supplementary materials included in this article.