Figure 3.
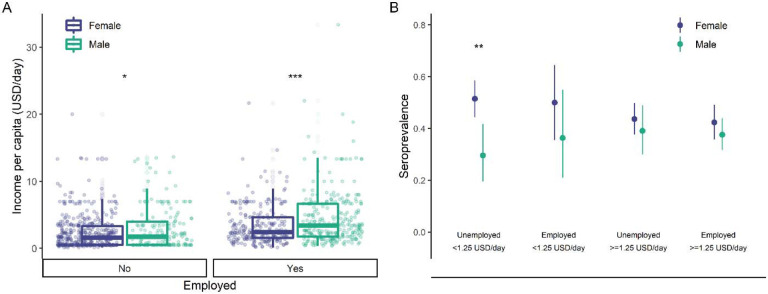
Socioeconomic vulnerability among women. A: Household income (per capita) by employment status and gender. B: Seroprevalence by household income (per capita), employment status and gender. Asterisks indicate statistically significant differences (Bonferroni-adjusted p<0.05: *; <0.01: **; <0.001: ***).

