Abstract
Substrate-derived biomarkers are necessary in slowly progressing monogenetic diseases caused by single-enzyme deficiencies to identify affected patients and serve as surrogate markers for therapy response. N-glycanase 1 (NGLY1) deficiency is an ultra-rare autosomal recessive disorder characterized by developmental delay, peripheral neuropathy, elevated liver transaminases, hyperkinetic movement disorder and (hypo)-alacrima. We demonstrate that N-acetylglucosamine-asparagine (GlcNAc-Asn; GNA), is the analyte most closely associated with NGLY1 deficiency, showing consistent separation in levels between patients and controls. GNA accumulation is directly linked to the absence of functional NGLY1, presenting strong potential for its use as a biomarker. In agreement, a quantitative liquid chromatography with tandem mass spectrometry assay, developed to assess GNA from 3 to 3000 ng/ml, showed that it is conserved as a marker for loss of NGLY1 function in NGLY1-deficient cell lines, rodents (urine, cerebrospinal fluid, plasma and tissues) and patients (plasma and urine). Elevated GNA levels differentiate patients from controls, are stable over time and correlate with changes in NGLY1 activity. GNA as a biomarker has the potential to identify and validate patients with NGLY1 deficiency, act as a direct pharmacodynamic marker and serve as a potential surrogate endpoint in clinical trials.
Keywords: N-glycanase 1, NGLY1 deficiency, GNA, GlcNAc-Asn, biomarker
Graphical Abstract
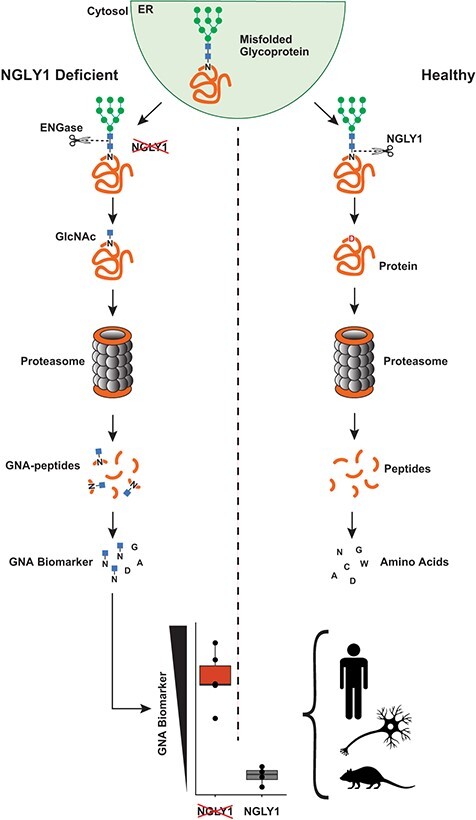
Graphical Abstract.
Abbreviations
- (AGA)
aspartylglycosaminidase
- (AGU)
aspartylglyucosaminuria
- (Asn)
asparagine
- (Asp)
aspartic acid
- (BSA)
bovine serum albumin
- (CSF)
cerebrospinal fluid
- (DTT)
dithiothreitol
- (EDTA)
ethylenediaminetetraacetic acid
- (ENGase)
endo-beta-N-acetylglucosaminidase
- (ER)
endoplasmic reticulum
- (ERAD)
endoplasmic-reticulum-associated protein degradation
- (GAPDH)
glyceraldehyde-3-phosphate dehydrogenase
- (GFP)
green fluorescent protein
- (GNA)
GlcNAc-Asn
- (HEK)
human embryonic kidney
- (HET)
heterozygous
- (KO)
knockout
- (LC–MS/MS)
liquid chromatography with tandem mass spectrometry
- (NGLY1)
N-glycanase 1
- (NHGNA)
Neu5Ac1Hex1GlcNAc1-Asn
- (Nrf1)
anti-nuclear factor, erythroid 2 like 1
- (PBS)
phosphate-buffered saline
- (PND)
post-natal day
- (SC)
Spinal Cord
- (WT)
wild-type
N-glycanase 1 (NGLY1) deficiency is an ultra-rare autosomal recessive disorder. Approximately 100 patients have been identified globally to date predominantly through genetic sequencing. It is a progressive disease that causes significant physical and intellectual disabilities. Although disease presentation and severity is heterogeneous, affected individuals generally share five key features: severe global developmental delay, peripheral neuropathy, elevated liver transaminases, a hyperkinetic movement disorder and (hypo)-alacrima (inability to produce tears) (1–3). Many affected individuals are unable to walk, speak or perform basic self-care activities such as feeding, toileting and bathing. The disease is also associated with frequent hospitalizations for seizures, surgeries and infections (1). Diagnosis of NGLY1 deficiency relies on genetic testing in combination with key clinical features (e.g. alacrima, which is a feature of very few disorders) (2,3). However, due to the rarity of the disease, heterogenous presentation and limited availability of medical genetics services, diagnosis can be a long and difficult process. Currently, there are no approved therapies for NGLY1 deficiency.
NGLY1 deficiency is caused by a mutation in the NGLY1 gene (1), which encodes NGLY1, a cytosolic N-glycanase implicated in the endoplasmic reticulum-associated protein degradation (ERAD) pathway that serves to recognize and eliminate unfolded or incorrectly processed glycoproteins. Misfolded glycoproteins are translocated from the endoplasmic reticulum (ER) to the cytosol where they are deglycosylated by NGLY1. NGLY1 is the only known cytosolic enzyme that can catalyse hydrolysis of the amide bond between an N-linked glycan and a protein. This cleavage results in two products—a free oligosaccharide and a deaminated protein in which the asparagine (Asn) residue that is deglycosylated is converted to aspartic acid (Asp). These two products enter different catabolic pathways. The deaminated protein is degraded into peptides by the proteasome and further hydrolysed to amino acids. In parallel the free oligosaccharide is processed in the cytosol by endo-beta-N-acetylglucosaminidase (ENGase) and Man2C1. The resulting hexasaccharide is transported into the lysosome for complete catabolism into monosaccharides by lysosomal mannosidases and hexosaminidases (4) (Fig. 1A).
Fig. 1.
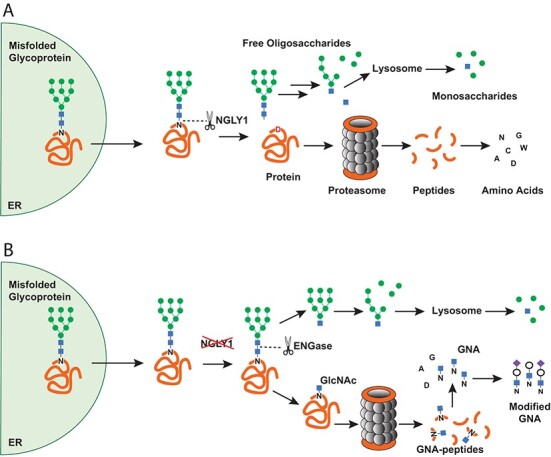
A model for the generation of GNA in NGLY1 deficiency. (A) Normal degradation of misfolded proteins through the ERAD pathway. (B) NGLY1 deficiency leads to generation and accumulation of GNA. N = Asn; D = Asp
In the absence of NGLY1, glycans can be cleaved from the protein at alternate bonds by enzymes downstream of NGLY1 (e.g. ENGase), allowing glycan catabolism to continue but resulting in GlcNAc-Asn (GNA), an uncleaved GlcNAc that remains linked to the Asn on the protein. The partially deglycosylated protein can be degraded to peptides, and the peptides hydrolysed to amino acids. However, the cytosolic Asn maintains its bond with GlcNAc. Therefore, the substrate bond normally cleaved by NGLY1 (GlcNAc-Asn) accumulates. In theory, it could be used as a primer for larger glycosylated-Asn metabolites (modified GNA) such as Neu5Ac1Hex1GlcNAc1-Asn (NHGNA) (Fig. 1B) (5–8). GNA has been found in the urine, plasma (9) and dried blood spots (6) of patients with NGLY1 deficiency, as well as in a rat model of NGLY1 deficiency (10).
Based on the extremely limited population of patients with NGLY1 deficiency, high phenotypic variability among patients and the slowly progressive nature of the disease (1), a reliable biomarker that originates from one or many substrates of NGLY1 (a substrate derived biomarker) could be a critical measure of the activity of therapeutics that aim to restore NGLY1 activity. Consistent with the recent food and drug administration guidance and the understanding of the relationship between NGLY1 deficiency and accumulation of its substrate biomarker, GNA should be considered as an endpoint in clinical trials (11). Additionally, this biomarker could be critical in identifying affected patients, clarifying diagnosis for patients with variants of uncertain significance and to act as a direct pharmacodynamic marker of activity for investigational therapies (9).
The previous body of literature (7,11,12) and the conceptual connection linking GNA accumulation to the absence of functional NGLY1 present a strong rationale for its use as a biomarker of NGLY1 activity. To evaluate this, a new quantitative GNA detection assay was developed and used in conjunction with semi-quantitative analyses to determine if increased GNA accumulation in NGLY1-deficient samples is increased over that of other metabolites. Here we present the data from cell lines, tissues, urine and plasma from an NGLY1-deficient rat model of the disease and from NGLY1-deficient patient samples evaluating and confirming GNA as the major metabolomic signature in NGLY1 deficiency. These data suggest that this newly developed assay could be used to reliably measure GNA as a biomarker of disease in NGLY1-deficient patients.
Materials and Methods
Cell line creation, maintenance and transfection
Jump-In™ GripTite™ Human Embryonic Kidney (HEK) 293 (Thermo A14150), HepG2 (ATCC HB-8065) and ReNcell VM human neural progenitor (Millipore SCC008) cell lines were cultured according to manufacturer’s protocols. Poly D-Lysine was added as a coating to supplement the culture of all the above cells, and laminin was used only for the ReNcells.
Loss-of-function mutations were created in the NGLY1 gene using the CRISPR-Cas9 system, a guide with the sequence ‘GGTGATTGCCAGAAGAACTA’ and a single-stranded oligonucleotide to direct repair of the cleavage site to include a stop mutation using the sequence ‘gZZtcaggtagttgatgtcacttggcgatattcctgcaaacatgaagaggtgattgccagaTgaactaaggttaaagaagcattacttcgagacactFZt’ where F =Phosphorothioate-A, Z = Phosphorothioate-T and the capital T in the near centre of the oligonucleotide would create the necessary stop-gain mutation. Ribonucleoprotein complexes were electroporated into cells using the Neon system according to the manufacturer’s protocol (Thermo MPK5000). Cleavage efficiency was estimated using the GeneArtTM Genomic Cleavage Detection Kit (#A24372). Limited dilution was used to create clonal populations of cells. Editing was confirmed in pools that exhibited similar growth to unedited controls by Sanger sequencing around the editing locus. Selected clones contained stop-gain or frameshift mutations that create stop codons (Supplementary Fig. S1).
Cells were transfected according to manufacturer’s protocols (Lipofectamine 3000, Thermo Fisher) and allowed to recover for 24 h before harvesting and analysis as described below.
Liquid chromatography with tandem mass spectrometry analysis of urine oligosaccharides
Targeted semi-quantitative analysis of patient urine oligosaccharides was carried out using a clinically validated liquid chromatography with tandem mass spectrometry (LC–MS/MS) method. Urine was analysed by LC–MS/MS and Z-scores were determined for NGLY1-deficient patients and their related controls against the reference cohort of 68 unrelated controls. Due to low detection levels and/or a lack of differences between patients and controls, three metabolites were dropped from the presented graphs that were analysed as part of this data set: Hex3HexNAc3, creatinine and Hex5HexNAc3 (Supplementary Fig. S2). The data were then filtered for metabolites that contain Asn then re-plotted and further grouped by sample status (NGLY1-deficient patient, parent or sibling).
Semi-quantitative untargeted analysis of plasma metabolites
A broad metabolite analysis panel was performed on patient plasma (MetaGA™ panel, Metabolon) as previously described (12). This semi-quantitative, semi-biassed screen compared 16 NGLY1-deficient patients and 8 unaffected siblings to a healthy paediatric control cohort of 300 individuals. Only analytes that were detectable across all samples were used to assess abundance changes.
Quantitative GNA assay
Samples were homogenized in phosphate-buffered saline (PBS) and mixed with three volumes of ice cold Internal Standard Solution (acetonitrile containing 60 ng/ml d3-GNA, Omicron Biochemicals, Inc. Catalog number AAG-004, Lot# Q01-N0816). They were then centrifuged at 6100 g for 30 min. An aliquot of each supernatant was transferred to an autosampler plate. The supernatant was separated via HPLC (Shimadzu VP Series 10 System) and analysed via MS/MS (Applied Biosystems/MDS SciEx API 4000). Detection and accuracy were assessed in surrogate matrices (PBS + bovine serum albumin [BSA], charcoal stripped serum). Each surrogate matrix was spiked with 30 and 300 ng/ml of GNA (Omicron Biochemicals, Inc. Catalog number AAG-003), processed and analysed to determine recovery and accuracy.
GNA measurement in laboratory cell lines
NGLY1-deficient cell lines were grown, counted using a hemacytometer, diluted to 0.5–2 × 10⁶ cells, pelleted and analysed. The calculated GNA concentration per cell count was averaged across two samples and compared between control and NGLY1-deficient cells. Cell pellets were resuspended in PBS and analysed as described in Quantitative GNA assay. Statistical analysis of GNA data was carried out using non-parametric methods (Wilcoxon or Kruskal–Wallis tests).
GNA measurement in NGLY1-deficient rat samples
Rats derived from previously reported parentage (10,13) were established in a colony. After breeding and birth, they were weaned, and samples were taken starting at post-natal Day (PND) 35. Genotypes were verified using PCR with the KAPA Hot Start Mouse Genotyping Kit (Kapa Biosystems KK7352) following manufacturers protocols for a touchdown PCR with the following primers targeted to Ngly1: Forward: 5′-GCCTGCTGTCTGAGGAACAT-3′, Reverse 1: 5′-TCCTTTCAGCAAGCCAGGAG-3′, Reverse 2: 5′-TTCCCGATGACAGTGAAGCC-3′ (Supplementary Fig. S3). Rat urine and plasma were collected for Ngly1 wild-type (WT), heterozygous (HET) and knockout (KO) animals (N = 6 per genotype, 3 male and 3 female). Samples were frozen, stored and subsequently analysed in one batch. Plasma samples over the course of the study from 2 to 10 weeks were taken from the tail vein and urine samples were collected by placing the rats in a metabolic cage for 12 h before returning them to their home cage.
Terminal cerebrospinal fluid (CSF) was collected by intra-cisterna magna puncture, drawn with a syringe, frozen and later analysed. Terminal plasma samples were isolated from blood drawn via cardiac puncture at sacrifice. Data were plotted and analysed for statistically significant accumulation using a Kruskal test and a Dunn’s test. Freeze–thaw testing was carried out by thawing samples, splitting the samples into two aliquots and immediately freezing one aliquot at −80°C. The frozen sample was then thawed and both samples were analysed in tandem. The other sample was kept at room temperature.
Tissue samples were taken upon sacrifice without perfusion. Samples were frozen, dissected to 20–50 mg size pieces while frozen, homogenized and analysed. Data were plotted and analysed for statistically significant accumulation using a Kruskal test and Wilcoxon test.
GNA concentration was averaged for each tissue tested within each genotype. GNA concentrations for Ngly1 KO rats were compared to their HET and WT controls to determine the fold increase in concentration.
GNA measurement in clinical samples
Samples were obtained from a biobank of NGLY1-deficient patient samples housed at Stanford University to quantify GNA accumulation in humans. These samples were collected in 2017 and provide a resource and repository for NGLY1-deficient patient material (NGLY1 Biobank, Grace Science Foundation).
Patient urine samples from 6 NGLY1 deficient donors and 4 siblings and patient plasma from 19 NGLY1 patients, 8 unaffected sibling, and 31 parental controls were analysed using the quantitative GNA assay developed during this study (see Quantitative GNA assay). Urine samples were diluted to fit in the dynamic range of the assay. Patient data was compared with related controls using a Wilcoxon test to determine significance.
Western blot
Cells were collected and lysed in Pierce RIPA buffer (Thermo Fisher, Waltham, WA, USA) containing Halt™ protease inhibitor cocktail (Thermo Fisher, Waltham, WA, USA) and 5 mM ethylenediaminetetraacetic acid (EDTA) (Thermo Fisher, Waltham, WA, USA). The lysate was then spun down at 10,000 g in a desktop centrifuge and the pellet was discarded. Total protein content was determined using bicinchoninic acid assay (Thermo Fisher, Waltham, WA, USA). Lysates from each sample containing equal amount of protein were mixed with 4× protein loading buffer (Thermo Fisher, Waltham, WA, USA) and 5 mM dithiothreitol (DTT) (Thermo Fisher, Waltham, WA, USA) and denatured at 70°C for 10 min. The lysates were then loaded onto 4–12% bis-tris protein gel (Thermo Fisher, Waltham, WA, USA) and gel electrophoresis was run at 120 V for 1 h in a Novex electrophoresis gel box (Thermo Fisher, Waltham, WA, USA). The protein was then transferred to a 45-μm nitrocellulose membrane (Cytiva) in a Novex gel transfer box (Thermo Fisher, Waltham, WA, USA). After transferring, the membrane was blocked in 5% milk-tris-buffered saline with Tween® buffer and NGLY1 protein was probed using a rabbit NGLY1 antibody (Sigma HPA036825, 1:1000) and subsequently a Cy5-conjugated goat anti-rabbit secondary antibody (Cytiva, PA45011). The fluorescence bands were captured on a GE electrochemiluminescence imager (Cytiva). Glyceraldehyde-3-phosphate dehydrogenase (GAPDH) was probed using mouse anti-GAPDH antibody at 1:10, 000 dilution (Millipore, MAB374) and served as a protein loading control.
Results
GNA accumulation identified in NGLY1-deficient patient urine and plasma through semi-quantitative analyses
To validate previous findings that GNA and its derivatives accumulate in NGLY1 deficiency (9), a panel composed of metabolites associated with lysosomal storage diseases and multiple putative downstream metabolites was used to test NGLY1-deficient patient urine (14). Urine was collected from patients with NGLY1 deficiency (16 probands) and a matched control sample data set, consisting of 8 unaffected siblings or half siblings, 21 parents (carriers) and 68 unrelated controls roughly matched in age to the patient and relation cohort (28 controls younger than 3 years, 27 controls aged 3–20 years, 19 controls older than 20 years).
Analysis of this cohort shows elevation in GlcNAc linked Asn-containing metabolites across NGLY1-deficient patients compared to the related unaffected controls; however, GNA showed the most consistent separation between patients and controls (Fig. 2A, Supplementary Fig. S4). Asn-linked metabolites were also plotted against the unaffected controls separated by relationship status to assess differences between parents and related siblings across oligosaccharides. No Asn-linked metabolite or set of metabolites was found to be elevated in unaffected control samples (Fig. 2B).
Fig. 2.
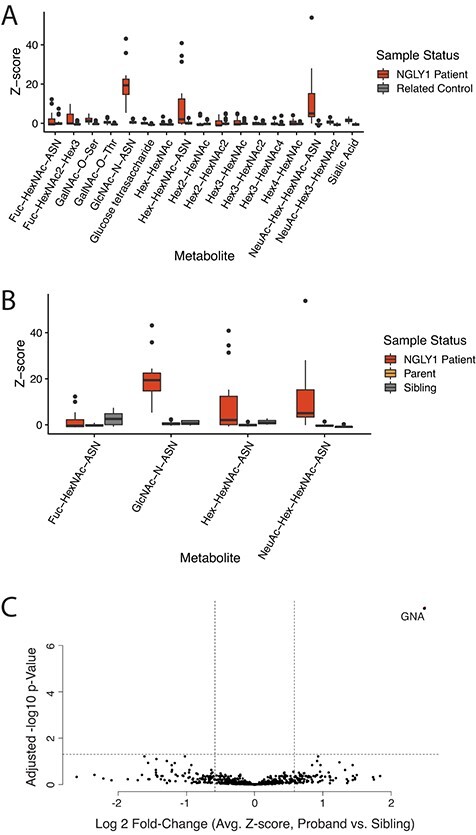
GNA elevation found to correlate with NGLY1 deficiency in semiquantitative analysis of patient sample metabolites. (A) Targeted semi-quantitative analysis of disease-associated oligosaccharides in NGLY1-deficient patient urine compared to unaffected related control samples. (B) Semi-quantitative asparagine-linked oligosaccharides in NGLY1-deficient patient urine and unaffected siblings and parents. (C) Semiquantitative identification and analysis of metabolites in NGLY1-deficient patient and unaffected control plasma.
To rule out whether metabolites other than GNA could be primary metabolic indicators of NGLY1 deficiency and identify other possible metabolic indicators of the disease, a broad, untargeted semi-quantitative analysis of human plasma was performed. The semi-quantitative analysis of metabolites in NGLY1-deficient patient plasma detected 882 metabolites across all samples analysed (Fig. 2C). The data points shown are the average Z-scores, calculated against the analyte abundance of 300 unrelated controls, for the 16 patients compared to the 8 unaffected sibling samples, which were further analysed for significance using a t-test with correction for multiple testing (P < 0.05; FDR, 10%; fold change, >1.25). The significance and separation of GNA from the rest of the metabolites underscore the observation that GNA was the only analyte detected that showed consistently elevated levels and separation between NGLY1-deficient patients and unaffected controls (other analytes showed inconsistent elevation or less separation from sibling controls; Supplementary Fig. S5).
Development of a quantitative assay for GNA accumulation
To measure the specific amount of GNA accumulation across NGLY1-deficient samples, a sensitive, quantitative, LC–MS/MS assay was developed and characterized.
Assay conditions were optimized as described in Methods, and a GNA dilution series was created using standards (unlabelled and 2H-labelled GNA from Omicron Bio) to test the accuracy and linearity of the assay. The expected GNA concentration based on the known amount of standard in the sample was plotted against the calculated GNA concentration. The quantitative assay was able to accurately detect GNA using LC–MS/MS over a linear range of 3–3000 ng/ml, as shown in Fig. 3A.
Fig. 3.
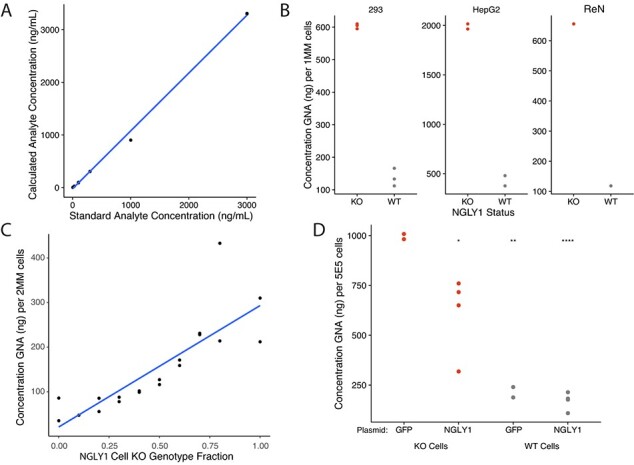
Development of a quantitative method to detect GNA shows accumulation of GNA in NGLY1 KO cells. (A) GNA analysis across concentrations in surrogate matrix (PBS + BSA, standard curve, average 2 replicates). (B) GNA accumulation in various NGLY1-deficient cell lines. (C) WT versus NGLY1 KO HEK293 cell mixing and GNA detection. (D) Expression of NGLY1 reduces GNA in NGLY1 KO HepG2 cells. *P < 0.05; **P < 0.01; ***P < 0.0001.
GNA accumulation in NGLY1-deficient cell lines
NGLY1-deficient cell lines should also exhibit the accumulated GNA phenotype and provide a convenient source of positive control material for the assay. Multiple NGLY1-deficient cell lines were created using the CRISPR-Cas9 system (Supplementary Fig. S1). All edited NGLY1 KO cell lines showed accumulation of GNA, including HEK 293 (4.4-fold accumulation), liver HepG2 (4.7-fold accumulation) and neuronal ReNCells (5.6-fold accumulation) cell lines (Fig. 3B).
To determine whether the GNA signal was proportional to the number of NGLY1 KO cells in a sample, WT and KO HEK293 cells were mixed in various ratios. GNA signal was found to positively correlate with the number of KO cells per pellet, with GNA level increasing proportionally with increased KO cell number (Fig. 3C). GNA was not found to accumulate in the culture media using this method without any media concentration, indicating that the cells must be lysed before measurement (Supplementary Fig. S6).
To demonstrate that the amount of GNA detected by the assay was dependent on the lack of functional NGLY1, WT and NGLY1 KO HepG2 cells were transfected with exogenous NGLY1 expressed from a plasmid and assessed for GNA levels after 24 h. Transfection of NGLY1 plasmid in NGLY1 KO resulted in a significant reduction in the accumulation of GNA after 24 h compared to cells transfected with a control green fluorescent protein (GFP) that should not impact GNA concentration (average GNA levels per sample for ~5E5 cells per sample: GFP NGLY1 KO cells, 995 ng; WT control cells, 214 ng; plasmid NGLY1 rescue in KO cells, 611 ng, plasmid NGLY1 overexpression in WT cells, 170 ng).
GNA accumulation in NGLY1-deficient rats
The rat Ngly1 KO preclinical model for NGLY1 deficiency survives to adulthood and reliably models various aspects of NGLY1 deficiency (10,13). To determine whether GNA is elevated in Ngly1-deficient rats, GNA levels were measured longitudinally in the urine and plasma of Ngly1 KO, HET and WT rats over the course of 10 weeks, starting at PND 33. Levels of GNA were consistently elevated in the plasma and urine of Ngly1 KO rats compared to HET and WT animals across all time points measured (Fig. 4A). Urine data showed higher variability compared to plasma; however, GNA levels were consistently higher in both matrices in the Ngly1 KO animals compared to HET and WT animals across all measurements.
Fig. 4.
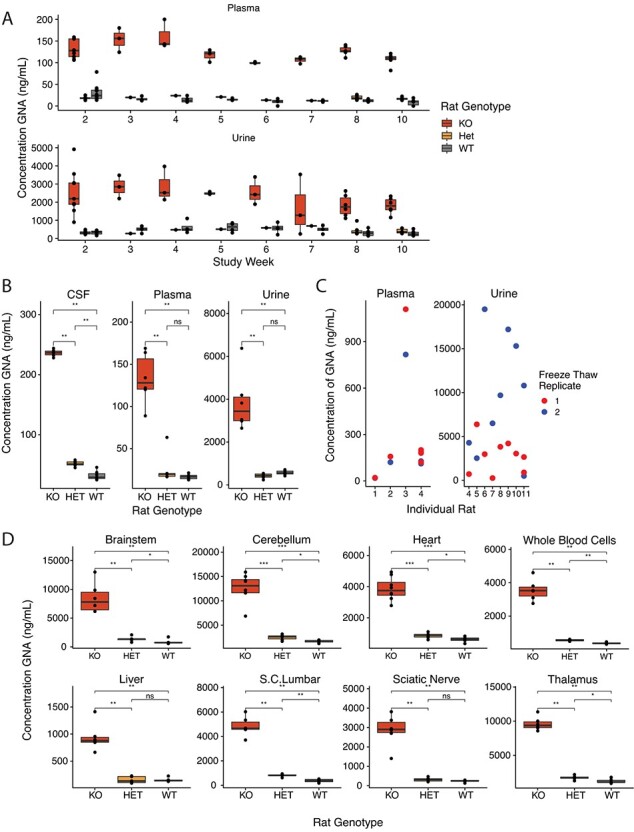
The rat model of NGLY1 deficiency shows accumulation of GNA in all tissues. (A) Consistently high levels of GNA detected in Ngly1 KO rats compared to HET and WT animals across longitudinal measurements in a 10-week study (PNDs 33–110). (B) Elevated levels of GNA detected in CSF, plasma and urine in Ngly1 KO rats at terminal collection. (C) Freeze–thaw study in rat plasma and urine demonstrates an increase in GNA signal post-thaw in urine and relative stability in plasma. (D) GNA is consistently higher across tissue types in Ngly1 KO rats compared to HET and WT rats at PNS ~110. S.C. = Spinal Cord; *P < 0.05; **P < 0.01; ***P < 0.001.
In addition, CSF, plasma and urine GNA levels were measured at the terminal timepoint. GNA levels were higher in the Ngly1 KO animals in all matrices compared to the HET and WT animals (Fig. 4B). Samples from HET animals appeared to have slightly higher CSF GNA levels compared to WT animals, suggesting the potential for an intermediate phenotype in HET animals (Fig. 4B). Plasma is more stable than urine after being subjected to a single freeze–thaw. Average GNA levels changed only 1.2-fold after freeze–thaw in plasma but changed 3.5-fold in urine after freeze–thaw (Fig. 4C).
Figure 4D shows the results of GNA testing in rat tissues at terminal collection. GNA was elevated in all tissues tested, including brain, spine, whole blood, liver, heart and sciatic nerve for Ngly1 KO animals compared to HET and WT animals (Supplementary Table S1).
Quantification of GNA accumulation in humans with NGLY1 deficiency
The quantitative GNA assay was applied to human samples to determine the accumulation of GNA in NGLY1-deficient patients over controls. NGLY1-deficient patient plasma was consistently elevated over related unaffected controls, with no significant difference observed between parental carriers and siblings (Fig. 5A). Patient urine GNA was also elevated on average; however, analysis was limited due to high GNA variability (Fig. 5B). In plasma, GNA levels were significantly elevated (4.3-fold) over unaffected controls. In urine, GNA levels increased by 3.3-fold over unaffected controls.
Fig. 5.
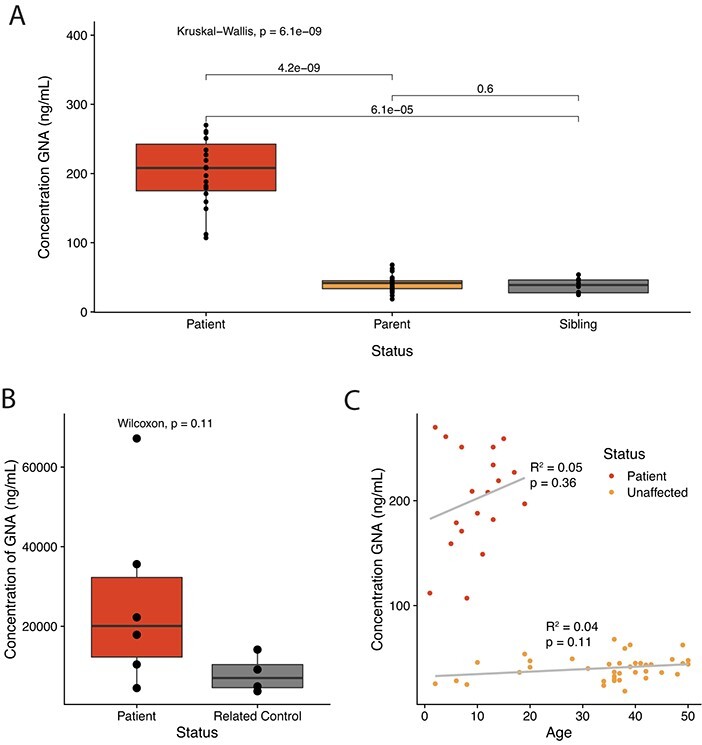
GNA accumulates in NGLY1-deficient patient samples. (A) The quantitative assay demonstrates GNA is elevated in the plasma of patients with NGLY1 deficiency compared to unaffected parent and sibling control samples. (B) The quantitative assay demonstrates GNA is elevated in the urine of patients with NGLY1 deficiency compared to unaffected related control samples. (C) GNA level in patient plasma does not significantly correlate with donor age by linear model.
To determine if there was a correlation or impact of age on GNA level, which could limit the utility of GNA as a biomarker, the age of each donor was considered and correlated with GNA concentration. No significant correlation was found using a linear regression comparing GNA concentration in plasma and sample donor age (Fig. 5C).
Discussion and Conclusions
A biomarker that can complement medical opinion and genetic testing for a rare genetic disorder must be consistent over time and reliably report on the function or status of the genetic mutation(s). GNA, the primary substrate biomarker elevated in NGLY1 deficiency, is stable and consistent over time and across matrices and timepoints in human and rat samples. This suggests that it meets the criteria to report on NGLY1 functional status. Analysis of human plasma samples showed elevation in all patients ages 2–21 years and no change in accumulation that correlated with age in unaffected controls up to 50 years of age (Fig. 5C). Ngly1-deficient rat plasma samples similarly showed elevation of GNA from PND 33 to 110 (Fig. 4A). Additionally, the in vitro data suggest that GNA levels can be reduced upon restoration of NGLY1 in an NGLY1 KO cell line (Fig. 3D). Stability over time increases the likelihood that changes in GNA levels are an accurate reflection of changes in NGLY1 function related to disease activity or therapy rather than being due to natural changes in GNA level over time.
Previous work identified GNA or likely derivatives in urine (15) and dried blood spots (6). The current study demonstrates that GNA is present not only in urine and plasma, but also in CSF and all tissues tested. Due to manifestations in the CNS (1–3), it is likely that a CSF biomarker will be vital to future development of therapies treating the neurological impact of NGLY1 deficiency. The correlation between CSF and brain tissue GNA biomarker levels in subsequent studies will build confidence that GNA will be informative of therapeutic response in the brain. In general, biomarkers in plasma (and possibly CSF) are preferable to urine biomarkers because they seem to be more stable, and their levels are, in theory, less likely to be influenced by changes in kidney function. Our data suggests that the GNA level in urine is more variable and would require further method development for continued use. Although urine GNA levels in patient samples were on average elevated compared to sibling controls, this was not consistent across all samples.
Despite efforts to identify other metabolites, GNA was the only analyte identified that was strongly associated with NGLY1 deficiency and showed consistent separation between patients and controls (Fig. 1C). While NGLY1 deficiency can also result in the accumulation of other glycans, presumably modifications of GNA such as NHGNA (Neu5Ac1Hex1GlcNAc1-Asn), GNA is the primary metabolite and the limit digestion product (5,8). NHGNA and other Asn-linked oligosaccharides may be potentially misleading and less useful in detecting NGLY1 deficiency or reporting on the state of functional NGLY1 since added sugar modifications may impact their catabolism or transport. It is unclear if NHGNA and similar modified GNA species are made intracellularly or extracellularly or if quantitative analyses of those species would yield similar results to those shown (8).
GNA accumulation is not unique to NGLY1 deficiency; it is also present in the inherited metabolic disease aspartylglyucosaminuria (AGU), which is caused by a deficiency of the lysosomal enzyme aspartylglycosaminidase (AGA) that can metabolize lysosomal GNA (16). Lack of GNA detection in NGLY1-deficient cell line media (Supplementary Fig. S6) means it is possible that little GNA escapes from the cytosol, consistent with the idea that NGLY1 is cytosolic and this metabolite would accumulate in the cytosol. Higher GNA concentrations in rat tissue compared to rat plasma and CSF also suggest that accumulation may occur in the cytosol (Fig. 4). The difference in localization between AGA and NGLY1 and thus the possible difference in localization of accumulating GNA may result in differences in detected GNA concentration in various samples and requires further study. The presence of GNA accumulation combined with genetic testing and/or consideration of key clinical features (e.g. for NGLY1 deficiency developmental delay, peripheral neuropathy, elevated liver transaminases, a hyperkinetic movement disorder (1,4,17) and alacrima (1,2,4,17)) may contribute to differentiation of the two diseases and support the successful diagnosis of NGLY1 deficiency as opposed to AGU. However, similar analyses suggest that biomarker levels alone may be sufficient to distinguish between the two diseases (14). This suggests GNA would still be useful in patient screening or to support diagnosis in the event genetic testing yields variants of uncertain significance.
The presence of GNA supports the identification of NGLY1 deficiency and validation of NGLY1 deficiency diagnosis over any other metabolite analysed in this study. By confirming and building upon previous data (6,15), this study has demonstrated that GNA, more than any other analyte tested, meets the key requirements for an effective biomarker in rare diseases (18): it effectively differentiates NGLY1-deficient patients from controls; remains stable over time; is present in plasma, CSF and urine; correlates with changes in NGLY1 activity; is found consistently among NGLY1-deficient organisms and tissues; and has an available quantitative assay for assessment. These data suggest that even during ambiguous clinical presentations or genetic testing, the presence of GNA could support the diagnosis of NGLY1 deficiency.
The rare, heterogenous and slowly progressing nature of NGLY1 deficiency makes clinical endpoint development especially challenging. Since NGLY1 deficiency is caused by a single enzyme deficiency that leads to the accumulation of the substrate, GNA will play a significant role in the development of therapeutics that aim to restore NGLY1 function (11).
Supplementary Material
Acknowledgement
Medical writing support was provided by Trish Rawn, PharmD and Judy Wiles of Facet Communications. Medical writing was funded by Grace Science, LLC. Special thanks to the Grace Science Foundation for funding early stages of this work and to the scientists, families and patients who provided help, donated samples and supported us.
Data Availability
De-identified data generated from the work that went into this paper is available upon request.
Supplementary Data
Supplementary Data are available at JB Online.
Conflict of Interest
William F. Mueller, Lei Zhu, Brandon Tan, Selina Dwight, Brendan Beahm, Matt Wilsey and Thomas Wechsler are or were employees of Grace Science, LLC.
Brett E. Crawford is or was an advisor and consultant to Grace Science, LLC.
Justin Mak and Tina Cowan received grant funding through the Grace Science Foundation.
Jake Pritchett and Eric Taylor were contracted by Grace Science, LLC.
References
- (1). NORD . (2021) NGLY1 Deficiency, https://rarediseases.org/rare-diseases/ngly1-deficiency/, (May 24, 2021, date last accessed)
- (2). Enns, G.M., Shashi, V., Bainbridge, M., Gambello, M.J., Zahir, F.R., Bast, T., Crimian, R., Schoch, K., Platt, J., Cox, R., Bernstein, J.A., Scavina, M., Walter, R.S., Bibb, A., Jones, M., Hegde, M., Graham, B.H., Need, A.C., Oviedo, A., Schaaf, C.P., Boyle, S., Butte, A.J., Chen, R., Chen, R., Clark, M.J., Haraksingh, R., Consortium, F.C., Cowan, T.M., He, P., Langlois, S., Zoghbi, H.Y., Snyder, M., Gibbs, R.A., Freeze, H.H., and Goldstein, D.B. (2014) Mutations in NGLY1 cause an inherited disorder of the endoplasmic reticulum-associated degradation pathway. Genet. Med. 16, 751–758 [DOI] [PMC free article] [PubMed] [Google Scholar]
- (3). Adams, J., and Schaaf, C.P. (2018) Diagnosis and genetics of alacrima. Clin. Genet. 94, 54–60 [DOI] [PubMed] [Google Scholar]
- (4). Suzuki, T., Huang, C., and Fujihira, H. (2016) The cytoplasmic peptide:N-glycanase (NGLY1) - structure, expression and cellular functions. Gene 577, 1–7 [DOI] [PMC free article] [PubMed] [Google Scholar]
- (5). Neville, D.C., Field, R.A., and Ferguson, M.A. (1995) Hydrophobic glycosides of N-acetylglucosamine can act as primers for polylactosamine synthesis and can affect glycolipid synthesis in vivo. Biochem. J. 307, 791–797 [DOI] [PMC free article] [PubMed] [Google Scholar]
- (6). Haijes, H.A., de Sain-van derVelden, M.G.M., Prinsen, H., Willems, A.P., van derHam, M., Gerrits, J., Couse, M.H., Friedman, J.M., vanKarnebeek, C.D.M., Selby, K.A., vanHasselt, P.M., Verhoeven-Duif, N.M., and Jans, J.J.M. (2019) Aspartylglycosamine is a biomarker for NGLY1-CDDG, a congenital disorder of deglycosylation. Mol. Genet. Metab. 127, 368–372 [DOI] [PubMed] [Google Scholar]
- (7). Hall, P.L., Lam, C., Alexander, J.J., Asif, G., Berry, G.T., Ferreira, C., Freeze, H.H., Gahl, W.A., Nickander, K.K., Sharer, J.D., Watson, C.M., Wolfe, L., and Raymond, K.M. (2018) Urine oligosaccharide screening by MALDI-TOF for the identification of NGLY1 deficiency. Mol. Genet. Metab. 124, 82–86 [DOI] [PMC free article] [PubMed] [Google Scholar]
- (8). Lee-Sundlov, M.M., Ashline, D.J., Hanneman, A.J., Grozovsky, R., Reinhold, V.N., Hoffmeister, K.M., and Lau, J.T. (2017) Circulating blood and platelets supply glycosyltransferases that enable extrinsic extracellular glycosylation. Glycobiology 27, 188–198 [DOI] [PMC free article] [PubMed] [Google Scholar]
- (9). Zhu, L., Tan B., Crawford, B. E., Dwight, S., Beahm, B., Wilsey, M., Wechsler, T., Mueller, W. F. (2020) AAV9-mediated gene therapy for NGLY1 deficiency and assessment of GNA biomarker changes in a rat disease model in Gene Therapy for the Special Senses, pp. 124–125, Molecular Therapy
- (10). Asahina, M., Fujinawa, R., Hirayama, H., Tozawa, R., Kajii, Y., and Suzuki, T. (2021) Reversibility of motor dysfunction in the rat model of NGLY1 deficiency. Mol. Brain. 14, 91. [DOI] [PMC free article] [PubMed] [Google Scholar]
- (11). Administration, U.S.D.o.H.a.H.S.F.a.D . (2020) Slowly progressive, low-prevalence rare diseases with substrate deposition that result from single enzyme defects: providing evidence of effectiveness for replacement or corrective therapies - guidance for industry, CDER, FDA Silver Spring, MD. [Google Scholar]
- (12). Dobrowolski, S.F., Alodaib, A., Karunanidhi, A., Basu, S., Holecko, M., Lichter-Konecki, U., Pappan, K.L., and Vockley, J. (2020) Clinical, biochemical, mitochondrial, and metabolomic aspects of methylmalonate semialdehyde dehydrogenase deficiency: report of a fifth case. Mol. Genet. Metab. 129, 272–277 [DOI] [PubMed] [Google Scholar]
- (13). Asahina, M., Fujinawa, R., Nakamura, S., Yokoyama, K., Tozawa, R., and Suzuki, T. (2020) Ngly1 -/- rats develop neurodegenerative phenotypes and pathological abnormalities in their peripheral and central nervous systems. Hum. Mol. Genet. 29, 1635–1647 [DOI] [PMC free article] [PubMed] [Google Scholar]
- (14). Mak, J., and Cowan, T.M. (2021) Detecting lysosomal storage disorders by glycomic profiling using liquid chromatography mass spectrometry. Mol. Genet. Metab. 21, 1096–7192 [DOI] [PMC free article] [PubMed] [Google Scholar]
- (15). Huang, R., Cathey, S., Pollard, L., and Wood, T. (2018) UPLC-MS/MS analysis of urinary free oligosaccharides for lysosomal storage diseases: diagnosis and potential treatment monitoring. Clin. Chem. 64, 1772–1779 [DOI] [PubMed] [Google Scholar]
- (16). Arvio, M., and Mononen, I. (2016) Aspartylglycosaminuria: a review. Orphanet J. Rare Dis. 11, 162. [DOI] [PMC free article] [PubMed] [Google Scholar]
- (17). Lam, C., Ferreira, C., Krasnewich, D., Toro, C., Latham, L., Zein, W.M., Lehky, T., Brewer, C., Baker, E.H., Thurm, A., Farmer, C.A., Rosenzweig, S.D., Lyons, J.J., Schreiber, J.M., Gropman, A., Lingala, S., Ghany, M.G., Solomon, B., Macnamara, E., Davids, M., Stratakis, C.A., Kimonis, V., Gahl, W.A., and Wolfe, L. (2017) Prospective phenotyping of NGLY1-CDDG, the first congenital disorder of deglycosylation. Genet. Med. 19, 160–168 [DOI] [PMC free article] [PubMed] [Google Scholar]
- (18). Gulbakan, B., Ozgul, R.K., Yuzbasioglu, A., Kohl, M., Deigner, H.P., and Ozguc, M. (2016) Discovery of biomarkers in rare diseases: innovative approaches by predictive and personalized medicine. EPMA J. 7, 24. [DOI] [PMC free article] [PubMed] [Google Scholar]
Associated Data
This section collects any data citations, data availability statements, or supplementary materials included in this article.
Supplementary Materials
Data Availability Statement
De-identified data generated from the work that went into this paper is available upon request.


