

Abstract
Intellectual disability (ID) is a neurodevelopmental disorder affecting approximately 0.5–3% of the population in the developed world. Individuals with ID exhibit deficits in intelligence, impaired adaptive behavior and often visual impairments. Cytoplasmic fragile X mental retardation 1 (FMR1)-interacting protein 2 (CYFIP2) is an interacting partner of the FMR protein, whose loss results in fragile X syndrome, the most common inherited cause of ID. Recently, CYFIP2 variants have been found in patients with early-onset epileptic encephalopathy, developmental delay and ID. Such individuals often exhibit visual impairments; however, the underlying mechanism is poorly understood. In the present study, we investigated the role of Cyfip2 in retinal and visual functions by generating and analyzing Cyfip2 conditional knockout (CKO) mice. While we found no major differences in the layer structures and cell compositions between the control and Cyfip2 CKO retinas, a subset of genes associated with the transporter and channel activities was differentially expressed in Cyfip2 CKO retinas than in the controls. Multi-electrode array recordings showed more sustained and stronger responses to positive flashes of the ON ganglion cells in the Cyfip2 CKO retina than in the controls, although electroretinogram analysis revealed that Cyfip2 deficiency unaffected the photoreceptor and ON bipolar cell functions. Furthermore, analysis of initial and late phase optokinetic responses demonstrated that Cyfip2 deficiency impaired the visual function at the organismal level. Together, our results shed light on the molecular mechanism underlying the visual impairments observed in individuals with CYFIP2 variants and, more generally, in patients with neurodevelopmental disorders, including ID.
Introduction
Neurodevelopmental disorders are a group of brain disorders, including attention deficit hyperactivity disorder, autism spectrum disorder (ASD) and intellectual disability (ID). Sensory disorders or atypical sensory features are broadly recognized as common features in children and adults with neurodevelopmental disorders. Atypical sensory features include reduced and excessive responsiveness and sensory seeking. Notably, the criteria for ASD in the Diagnostic and Statistical Manual of Mental Disorders, Fifth Edition, include hyper- or hyporeactivity to sensory input or unusual interest in sensory aspects of the environment. However, the causes and mechanisms of sensory disorders associated with neurodevelopmental disorders are poorly understood.
ID, formerly known as mental retardation, is characterized by deficits in intelligence (IQ < 70) and impaired adaptive behavior (1). Individuals with ID frequently exhibit visual and/or hearing disorders (2). Approximately 0.5–3% of the population in the developed world is considered to be affected by this disorder (3–6). Two evolutionarily conserved members of the cytoplasmic fragile X mental retardation 1 (FMR1)-interacting protein (CYFIP) family, CYFIP1 and CYFIP2, were originally identified as direct interacting partners of FMR protein (FMRP) (7), an RNA-binding protein whose loss leads to fragile X syndrome, the leading single-gene cause of ASD and ID (8–10). Additionally, CYFIP1 and CYFIP2 are critical components of the heteropentameric Wiskott–Aldrich syndrome protein family verprolin-homologous protein (WAVE) regulatory complex (WRC) (11). As a downstream effector of the small Rho GTPase Rac1, which interacts with CYFIP1/2, the WRC regulates actin-related protein 2/3 (Arp2/3) complex-mediated actin assembly in diverse cellular compartments including neuronal synapses (12,13). Therefore, CYFIP1 and CYFIP2 are thought to be key players in the RNA processing regulation and actin cytoskeleton dynamics, which are crucial for neuronal development and function (14). Despite high amino acid sequence homologies, CYFIP1 and CYFIP2 are suggested to exhibit in vivo functional differences because of their distinct interaction partners and spatiotemporal expression patterns in the brain (15,16). Indeed, Cyfip1- and Cyfip2-deficient mice show lethality at different developmental stages (17–19).
In humans, both CYFIP1 and CYFIP2 are linked to various neurological and neuropsychiatric disorders (14,20). Specifically, CYFIP1 gene deletions and duplications are associated with schizophrenia, ASD and ID (21,22). In contrast, deletions of the chromosomal region harboring CYFIP2 have been observed in patients with seizures, developmental delay and ID (23,24). In addition, recent whole-exome and whole-genome sequencing identified CYFIP2 variants in individuals with early-onset epileptic encephalopathy, developmental delay and ID (25–27). Generally, CYFIP2 variants in individuals with ID are linked to visual impairments (26,27). However, the underlying mechanisms of visual impairment associated with CYFIP2 variants remain unclear. In the current study, we investigated the role of Cyfip2 in the retinal and visual functions by combining molecular, histological, electrophysiological and behavioral analyses.
Results
Cyfip2 is expressed in the inner retina
We have previously reported that microRNA-124a (miR-124a) is required for neuronal maturation and function in the retina and brain (28,29). The Drosophila homolog of FMRP is physically and functionally associated with miR-124a (30). To gain insight into the function of FMRP in the retina, we focused on the FMRP-interacting proteins CYFIP1 and CYFIP2 in the current study. To investigate the spatial and temporal expression patterns of Cyfip1 and Cyfip2 in the retina, we performed in situ hybridization analysis using mouse retinal sections (Fig. 1A). Cyfip2 was expressed in the neuroblastic layer and ganglion cell layer (GCL) at embryonic day 13.5 (E13.5) and E17.5. After postnatal day 3 (P3), the Cyfip2 signal was restricted to the inner side of the retina. In contrast to Cyfip2, we did not detect significant signals of Cyfip1, an ortholog of Cyfip2, in the retina at all stages examined. We observed that the expression pattern of Fmr1 was similar to that of Cyfip2. We next examined the tissue distribution of Cyfip2 in mice using northern blot analysis and found that Cyfip2 is expressed in the retina, brain, thymus, heart, kidney, spleen and ovary (Fig. 1B).
Figure 1.
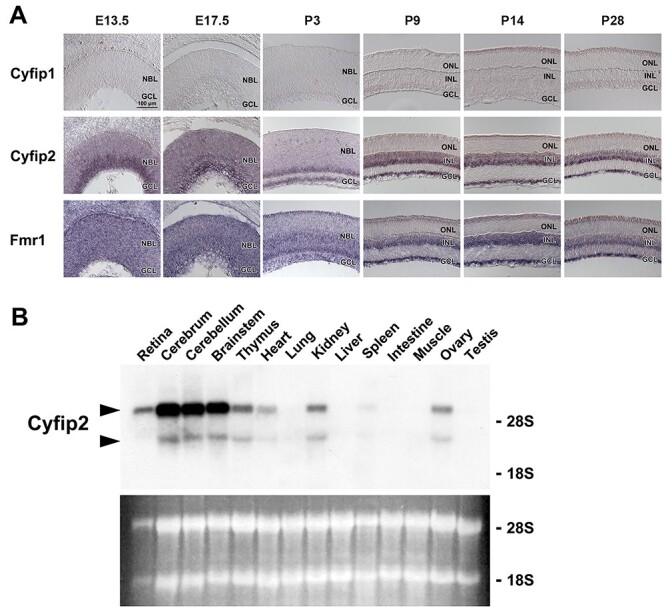
Spatial and temporal expression of Cyfip1, Cyfip2 and Fmr1. (A) In situ hybridization analysis of Cyfip1, Cyfip2 and Fmr1 in the developing mouse retina. Cyfip1 mRNA expression is below detection level. The Cyfip2 signal is detected in the NBL and GCL at E13.5 and E17.5, in the inner NBL and GCL at P3 and in the INL and GCL at P9, P14 and P28. The Fmr1 signal is observed in the NBL and GCL at E13.5, E17.5 and P3 as well as in the INL and GCL at P9, P14 and P28. NBL, neuroblastic layer; ONL, outer nuclear layer; INL, inner nuclear layer; GCL, ganglion cell layer. (B) Northern blot analysis of Cyfip2 transcripts in adult mouse tissues. Arrowheads indicate the Cyfip2 mRNA bands of ~6.4 and ~4.5 kb. The lower panel shows the ethidium bromide-stained RNA.
Histological characterization of the Cyfip2-deficient retina
To investigate the in vivo functions of CYFIP2 in the retina, we generated Cyfip2 flox mice by targeted gene disruption (Supplementary Material, Fig. S1A and B). Since Cyfip2−/− mice were shown to be perinatal lethal (17,18), we crossed Cyfip2 flox mice with Dkk3-Cre mice (31), which express Cre recombinase predominantly in retinal progenitor cells, to generate Cyfip2 conditional knockout (CKO) mice (Supplementary Material, Fig. S1A and B). We did not detect Cyfip2 mRNA in Cyfip2 CKO retinas by reverse transcription polymerase chain reaction (RT-PCR) (Supplementary Material, Fig. S1C).
To examine whether Cyfip2 deficiency affects retinal layer structure and cell composition, we performed histological analyses using retinal sections from Cyfip2 CKO mice. Toluidine blue staining showed that the thickness of the outer nuclear layer, outer plexiform layer, inner nuclear layer, inner plexiform layer (IPL) and GCL in Cyfip2 CKO retinas was comparable with the control (Fig. 2A and B). We immunostained retinal sections using marker antibodies against rhodopsin (rod outer segments), S-opsin (S-cone outer segments), Chx10 (bipolar cells), calbindin (horizontal cells and a part of amacrine cells) and S100β (Müller glial cells) and found no substantial differences between the control and Cyfip2 CKO retinas (Fig. 2C). We observed a small number of misplaced cells positive for Pax6 (a marker for amacrine and ganglion cells) in the IPL of Cyfip2 CKO retinas (Fig. 2C). To examine whether the mislocalized Pax6-positive cells are amacrine or ganglion cells, we immunostained retinal sections using marker antibodies against AP-2α (a marker for a part of amacrine cells) and Brn3a (a marker for a part of ganglion cells). We found that the number of amacrine and ganglion cells increased in the IPL of the Cyfip2 CKO retina compared with that of the control retina, although major populations exhibited proper positioning (Fig. 2D and E). To investigate which amacrine cell subtypes are misplaced in the Cyfip2 CKO retina, we immunostained retinal sections using marker antibodies against ChAT (starburst amacrine cells) and tyrosine hydroxylase (TH) (dopaminergic amacrine cells). We found no substantial differences between the control and Cyfip2 CKO retinas (Supplementary Material, Fig. S2), suggesting that Cyfip2 deficiency leads to misplacement of amacrine cell subtype(s) other than starburst and dopaminergic amacrine cells.
Figure 2.
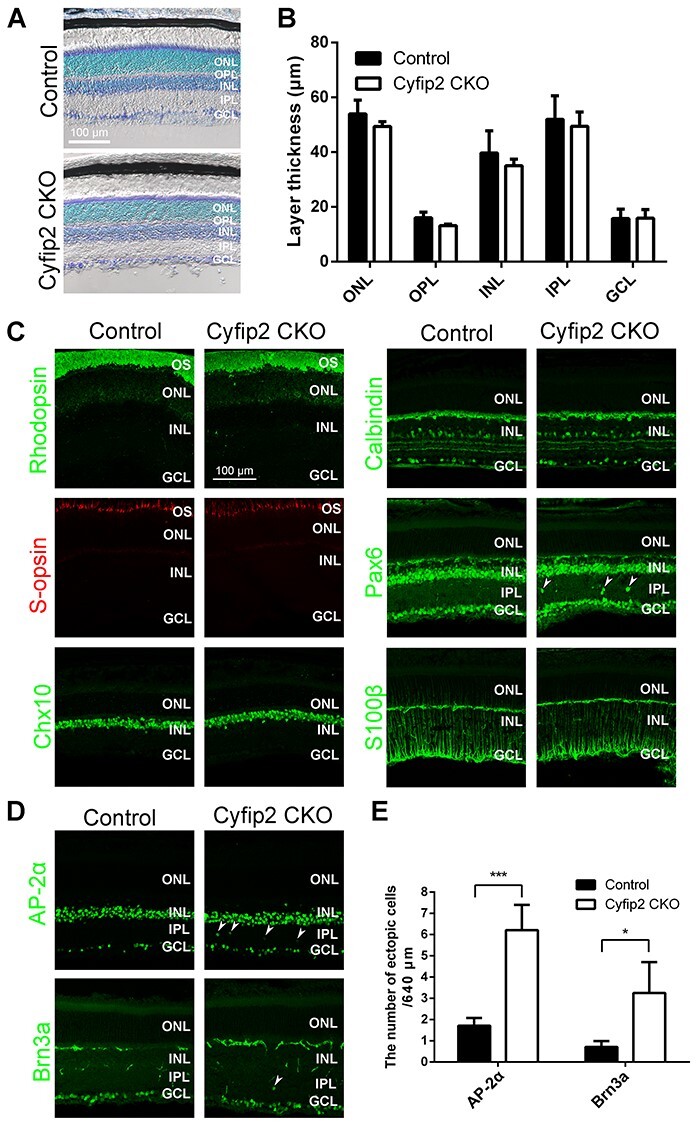
Histological analysis of the Cyfip2 CKO retina. (A) Toluidine blue staining of the control and Cyfip2 CKO retinas at 1 month. (B) The thickness of the ONL, OPL, INL, IPL and GCL in the control and Cyfip2 CKO retinas (n = 3 per each genotype). Data are presented as mean ± SD. There are no significant differences between the control and Cyfip2 CKO retinas (unpaired t-test). (C) Immunohistochemical analysis of the control and Cyfip2 CKO retinas at 1-month using marker antibodies as follows: rhodopsin (rod outer segments), S-opsin (S-cone outer segments), Chx10 (bipolar cells), calbindin (horizontal cells and a subset of amacrine cells), Pax6 (amacrine and ganglion cells) and S100β (Müller glial cells). Arrowheads indicate Pax6-positive cells in the IPL. (D) Immunohistochemical analysis of the control and Cyfip2 CKO retinas at 1 month using anti-AP-2α (a marker for a subset of amacrine cells) and anti-Brn3a (a marker for a subset of ganglion cells) antibodies. Arrowheads indicate AP-2α-positive or Brn3a-positive cells in the IPL. (E) The number of AP-2α-positive and Brn3a-positive cells in the IPL in the control and Cyfip2 CKO retinas (n = 4 retinas from four animals for each genotype). Data are presented as mean ± SD. *P < 0.05, ***P < 0.001 (unpaired t-test). OS, outer segment; ONL, outer nuclear layer; OPL, outer plexiform layer; INL, inner nuclear layer; IPL, inner plexiform layer; GCL, ganglion cell layer.
Changes in global gene expression in the retina due to Cyfip2 deficiency
Next, we performed RNA-sequencing (RNA-seq) analysis using total RNA purified from the control and Cyfip2 CKO retinas to assess the transcriptional consequences of Cyfip2 deficiency in the retina (Fig. 3; Supplementary Material, Fig. S3). Principal component analysis (PCA) showed that the cluster of Cyfip2 CKO retinas could be separated from that of the control retinas (Fig. 3A). Using the cut-off (fold change >1.2, < −1.2; P < 0.05), we obtained 256 downregulated and 247 upregulated genes in the Cyfip2 CKO retina. Several marker genes enriched in each retinal cell type were downregulated in the Cyfip2 CKO retina (Supplementary Material, Fig. S3), suggesting that the regulation of gene expression across various retinal cell types was affected by the Cyfip2 deficiency. We carried out Gene Ontology (GO) analysis and classified upregulated and downregulated genes into functional categories according to the GO term enrichment for molecular functions. These genes were associated with several molecular functions related to channel and transporter activities, including inorganic cation transmembrane transporter activity (Fig. 3B and C), implying that electrophysiological properties are affected in the Cyfip2 CKO retina.
Figure 3.
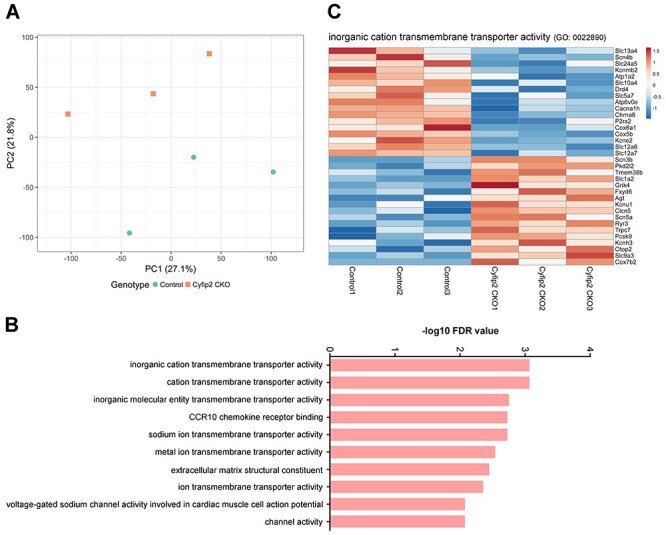
Gene expression profiles in the Cyfip2 CKO retina. (A) PCA of the RNA-seq data from the control and Cyfip2 CKO retinas. (B) The top 10 most significantly enriched molecular functions determined by gene ontology enrichment analysis for differentially expressed genes (fold change >1.2 or < −1.2; P < 0.05, unpaired t-test). X-axis indicates −log10 [false discovery rate (FDR)] and Y-axis indicates molecular functions. (C) Heatmaps of differentially expressed genes (fold change >1.2 or < −1.2; P < 0.05, unpaired t-test) associated with inorganic cation transmembrane transporter activity (GO: 0022890). Gene expression values were visualized using a color scale from blue to red. Fragments per kilobase of exon per million mapped fragment values from the RNA-seq dataset were used for the heatmap visualization.
Light response changes in the ganglion cells of the Cyfip2 CKO retina
To test the electrophysiological properties of the Cyfip2 CKO retina, we first measured the electroretinograms (ERGs) of Cyfip2 CKO mice under dark-adapted (scotopic) and light-adapted (photopic) conditions. Under scotopic conditions, the amplitude of a-waves and b-waves, originating mainly from the population activity of rod photoreceptor cells (a-waves) and rod bipolar cells (b-waves), was not significantly different between the control and Cyfip2 CKO mice (Fig. 4A–C). Similar to scotopic ERG, the amplitudes of photopic a-waves and b-waves, mainly reflecting the population activity of cone photoreceptor cells (a-waves) and cone ON bipolar cells (b-waves), in Cyfip2 CKO mice were comparable with the control mice (Fig. 4D–F). These results suggest that Cyfip2 deficiency does not affect photoreceptor and ON bipolar cell functions.
Figure 4.
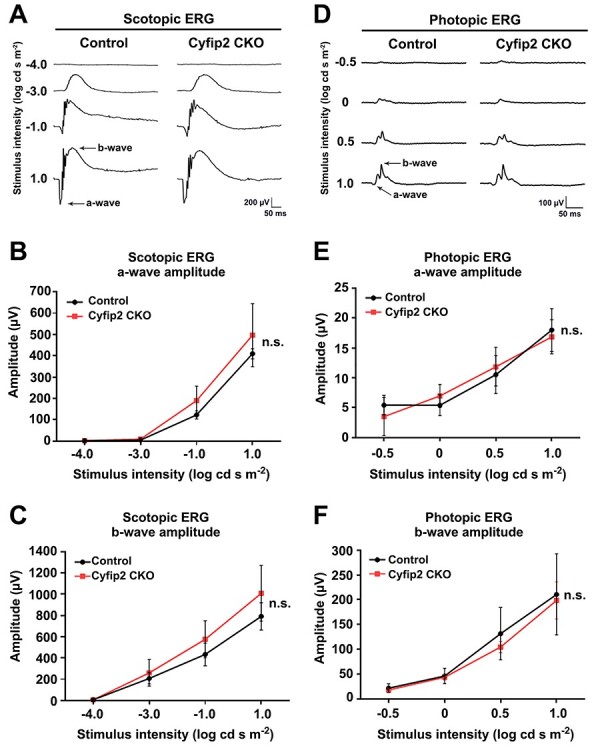
ERG analysis of Cyfip2 CKO mice. ERGs were recorded from the control (n = 4) and Cyfip2 CKO (n = 5) mice at 1 month. (A) Representative scotopic ERGs elicited by four different stimulus intensities (−4.0 to 1.0 log cd-s/m2) from the control and Cyfip2 CKO mice. (B, C) The scotopic amplitudes of a-wave (B) and b-wave (C) shown as a function of stimulus intensity. Data are presented as mean ± SD. n.s., not significant (two-way repeated-measures ANOVA). (D) Representative photopic ERGs elicited by four different stimulus intensities (−0.5 to 1.0 log cd-s/m2) from the control and Cyfip2 CKO mice. (E, F) Photopic amplitudes of a-wave (E) and b-wave (F) shown as a function of stimulus intensity. Data are presented as mean ± SD. n.s., not significant (two-way repeated-measures ANOVA).
Thereafter, multi-electrode array (MEA) recordings were obtained to evaluate the retinal outputs to the brain. Spike discharges were recorded from isolated mouse retinas, and each ganglion cell was classified based on the response properties to flash stimuli (17 ON cells, 10 OFF cells, 3 ON–OFF cells from the control retinas, 25 ON cells, 12 OFF cells and 4 ON–OFF cells from the Cyfip2 CKO retinas) (see Materials and Methods). We examined the basic ON and OFF responses of ganglion cells and did not conduct experiments to separate subtypes in detail. Raster plots and peristimulus time histograms calculated from an ON cell and an OFF cell are shown in Fig. 5A; ON–OFF cells are not shown. Other examples of ON cells and OFF cells from the Cyfip2 CKO retinas are also shown in Supplementary Material, Fig. S4A. ON cells of Cyfip2 CKO retinas (Fig. 5A, lower left) tended to show more prolonged, stronger responses to the positive flashes than those from the control retinas (Fig. 5A, upper left). The baseline firing rate in the ON cells from the Cyfip2 CKO retinas was higher than that in the ON cells of the control retinas (Mann–Whitney U test; n = 17 for the controls, n = 25 for Cyfip2 CKOs, P = 0.003). There was no significant difference in the baseline firing rate between the OFF cells in the control retinas and those in the Cyfip2 CKO retinas (Mann–Whitney U test; n = 10 for the controls, n = 12 for Cyfip2 CKOs, P = 0.59) (Supplementary Material, Fig. S4B). To evaluate the temporal properties of the light responses of ganglion cells, we calculated the cumulative relative frequency functions from a spike train of each ganglion cell during flash stimuli (Fig. 5B and C). In response to positive flashes, the cumulative relative frequency of the ON cells of the control retinas increased with post-stimulus time and took 0.42 s to reach 0.5 level (Fig. 5B, upper left, red line). In Cyfip2 CKO retinas, the probability increased virtually linearly and took 0.87 s to reach 0.5 level (Fig. 5B, lower left, red line). This result indicates that ON cells in Cyfip2 CKO retinas tended to respond to positive flash stimuli with a constant firing rate from the stimulus onset to offset. The latencies to reach a cumulative relative frequency of 0.5 level of ON cells in Cyfip2 CKO retinas were significantly longer than those of the control retinas (Fig. 5D, upper left, Mann–Whitney U test; n = 17 for the controls, n = 25 for Cyfip2 CKOs, P = 0.07 × 10⁻³), indicating that the ON cells of the Cyfip2 CKO retinas showed more sustained responses than those of the control retinas. The latencies of the OFF cells in response to negative flashes showed no significant difference between the control retinas and Cyfip2 CKO retinas (Fig. 5D, upper right, Mann–Whitney U test; n = 10 for the control, n = 12 for Cyfip2 CKO, P = 0.92). Statistical tests for the ON and OFF responses of the ON–OFF cells were not performed because of the small number of cells recorded in this study. We also analyzed the number of spikes of the ON cells recorded during the positive flash presentation and that of the OFF cells recorded during the negative flash presentation to evaluate the response intensity to the light stimulus. Statistical tests showed that the number of firings of the ON cells in the Cyfip2 CKO retinas was significantly higher than that in the control retinas (Fig. 5D, lower left, Mann–Whitney U test; n = 17 for the controls, n = 25 for Cyfip2 CKOs, P = 0.02). The spike number of the OFF cells in response to negative flashes showed no significant difference between the control and Cyfip2 CKO retinas (Fig. 5D, lower right, Mann–Whitney U test; n = 10 for the control, n = 12 for Cyfip2 CKO, P = 0.19). These results indicate that the response to positive flashes of the ON cells of Cyfip2 CKO retinas is more sustained and stronger than that of the control retinas.
Figure 5.
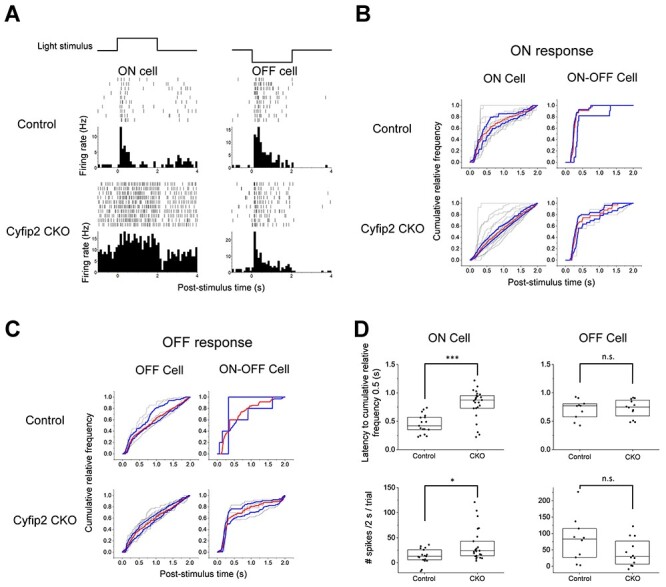
Firing properties of the ganglion cells in the Cyfip2 CKO retina. (A) Raster plots and peristimulus time histograms (PSTHs) of retinal ganglion cells in response to light stimuli. Both in the control and Cyfip2 CKO retinas, the ON cells and OFF cells responded just after the onset of flashes and the responses were consistent across trials. The time bin width in the PSTHs was 100 ms. (B) Cumulative relative frequency of the ON responses of the ON cells (left) and ON–OFF cells (right) plotted against post-stimulus time during the positive flash presentation. In all subsequent analyses, the average firing rate for 1 s before the stimulus onset was calculated as the spontaneous firing level and subtracted from spike data. Gray lines indicate cumulative relative frequency functions calculated from each cell. Red lines and blue lines indicate the median and upper/lower quartiles at each post-stimulus time, respectively. (C) Cumulative relative frequency of the OFF responses of the OFF cells (left) and ON–OFF cells (right) plotted against post-stimulus time during the negative flash presentation. (D) Summary of data on latencies to cumulative relative frequency 0.5 (upper) and numbers of spikes during flash stimulus presentation (lower). Each dot represents one cell. Box plots show median and quartiles. *P < 0.05, ***P < 0.001, n.s., not significant (Mann–Whitney U test).
Cyfip2 CKO mice exhibit impaired optokinetic responses
To explore the effect of Cyfip2 deficiency on visual function at the organismal level, we measured the optokinetic responses (OKRs), which are reflexive eye movements observed in response to moving objects (32), in Cyfip2 CKO mice (Fig. 6; Supplementary Material, Fig. S5). The OKRs are divided into initial and late OKRs based on the time range during eye movement (33,34). The initial OKR is a smooth eye movement observed in a short period within 500 ms after visual sensing of a moving object, while the late OKR is a series of eye movements that alter slow tracking and quick resetting to initial eye position within a longer period (30 s in this study).
Figure 6.
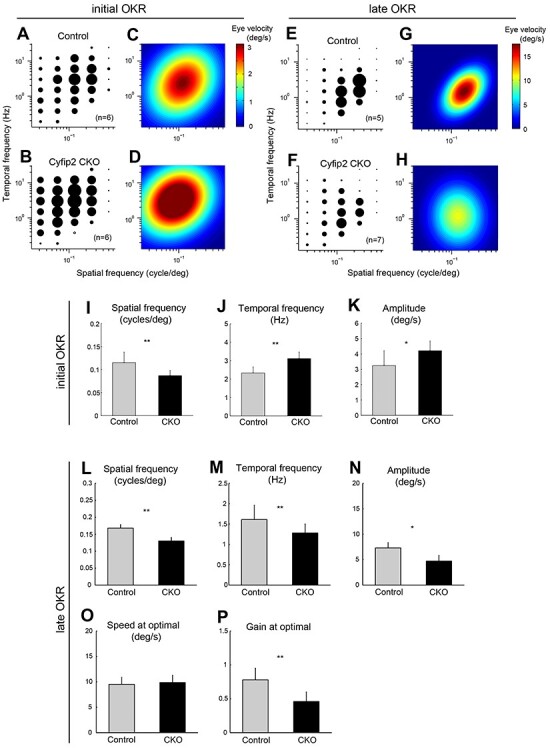
Impaired visual acuity in OKRs of Cyfip2 CKO mice. (A, B) Amplitude of the initial OKRs in the control (n = 6) and Cyfip2 CKO (n = 6) mice (2–3 months old). Amplitudes of the initial OKR represented by the diameter of the circles are plotted in the coordinate system of spatial and temporal frequencies (SF and TF, respectively). Filled symbols represent statistically significant responses (unpaired t-test, P < 0.05). (C, D) Heat map plots of the best-fit Gaussian functions for the initial OKRs in the control (C) and Cyfip2 CKO (D) mice. (E, F) Amplitudes of the late OKRs in the control (n = 5) and Cyfip2 CKO (n = 7) mice (2–3 months old). Filled symbols represent statistically significant responses (unpaired t-test, P < 0.05). (G, H) Heat map plots of the best-fit Gaussian functions for the late OKRs in the control (G) and Cyfip2 CKO (H) mice. (I–K) Comparisons of the properties of the initial OKRs in the control and Cyfip2 CKO mice. The optimal spatial frequency (I), temporal frequency (J) and amplitude (K) in the initial OKRs in the control and Cyfip2 CKO mice are shown. *P < 0.05, **P < 0.01 (unpaired t-test). (L–P) Comparison of the properties of the late OKRs in the control and Cyfip2 CKO mice. The optimal spatial frequency (L), temporal frequency (M), amplitude (N), the stimulus speed at an optimal spatiotemporal frequency (O) and gain at optimal stimuli (P) in the late OKRs in the control and Cyfip2 CKO mice are shown. *P < 0.05, **P < 0.01 (unpaired t-test).
To characterize the initial OKRs in Cyfip2 CKO mice, we used visual motion stimuli with spatiotemporal frequencies. Representative eye velocity profiles of the control and Cyfip2 CKO mice are shown in Supplementary Material, Fig. S5A and B. Cyfip2 CKO mice showed OKRs to a wide range of spatial and temporal frequencies compared to the control mice (Fig. 6A–D). While the optimal spatial frequency significantly decreased in Cyfip2 CKO mice compared with that in the control mice, the optimal temporal frequency and peak amplitude significantly increased in Cyfip2 CKO mice compared with those in the control mice (Fig. 6I–K).
To characterize the dependence of the late OKRs on the spatiotemporal frequency of the visual stimulus, the mean eye velocity was calculated during the slow phase of nystagmus for each condition. Representative eye position profiles of the control and Cyfip2 CKO mice are shown in Supplementary Material, Fig. S5C and D. Cyfip2 CKO mice showed weaker OKRs compared to the control mice (Fig. 6E–H). The optimal spatiotemporal frequencies of Cyfip2 CKO mice were significantly lower than those in the control mice (Fig. 6L and M). The peak amplitude of the responses was significantly decreased in Cyfip2 CKO mice compared with that in the control mice (Fig. 6N). The speed at the optimal stimulus was not significantly different between the control and Cyfip2 CKO mice (Fig. 6O). The gain at the optimal stimulus was smaller in Cyfip2 CKO mice than in the control mice (Fig. 6P).
Discussion
In the current study, we performed ERG, MEA and OKR analyses to investigate the retinal and visual functions in Cyfip2 CKO mice. We found that Cyfip2 CKO mice exhibited altered retinal ganglion cell responses as well as impaired initial- and late-phase OKRs. Future studies utilizing other methods such as two-photon calcium imaging in the V1 visual cortex would deepen our understanding of the roles of CYFIP2 in the visual system. Since Cre mRNA was detected weakly in the brain of Dkk3-Cre mice (31), we cannot exclude the possibility that Cyfip2 deficiency in the brain influenced OKRs in Cyfip2 CKO mice. It would be useful to evaluate neuronal functions in brain visual centers including the thalamus, superior colliculus and visual cortex in the Cyfip2 CKO mice. However, we have previously reported that retinal functional changes can modulate OKRs (35–38), suggesting that retinal functional changes due to Cyfip2 deficiency could cause impaired OKRs in Cyfip2 CKO mice.
We observed that ERG a- and b-wave amplitudes in the control and Cyfip2 CKO mice were comparable, implicating that the functions of photoreceptors and ON bipolar cells were unaffected by Cyfip2 deficiency. Based on this observation, we hypothesized that ganglion cell property changes in the Cyfip2 CKO retina were due to alterations in visual information processing in the inner retina rather than in the outer retina. Our hypothesis is further supported by in situ hybridization, which showed Cyfip2 expression mainly in the inner part of the retina. However, using RNA-seq analysis, we observed that the expression levels of the cone photoreceptor and horizontal cell marker genes decreased in Cyfip2 CKO retinas; hence, we cannot deny the possible contribution of the outer retina in addition to the inner retina to changes in the retinal ganglion cell responses resulting from Cyfip2 deficiency.
The CYFIP proteins, CYFIP1 and CYFIP2, interact with FMRP, an RNA-binding protein (7). CYFIP1 associates with ribonucleoprotein particles (RNPs) and mediates translational repression by FMRP (39). Although CYFIP2’s role in FMRP-mediated translational repression is not well known, it interacts with RNPs (40). We found that Cyfip2 and Fmr1 exhibited similar expression patterns using in situ hybridization, suggesting that FMRP and CYFIP2 could cooperatively regulate translation in the retina. Therefore, it would be worth investigating the functional relationship between FMRP and CYFIP2 in the retina. Previously, FMRP is reported to control transcription by regulating the translation of chromatin-associated proteins, including bromodomain-containing protein 4 (41). Downregulation or upregulation of a subset of genes in the Cyfip2 CKO retina might result from dysregulation of FMRP-mediated translation. In contrast, ERG recordings measuring scotopic a- and b-wave amplitudes demonstrated a reduction in the maximal photoreceptor response and an alteration of signal transmission between the photoreceptor and ON bipolar cells in Fmr1-deficient mice (42,43). Unchanged scotopic and photopic ERG amplitudes in the control and Cyfip2 CKO mice in this study suggest that distinct functions of FMRP and CYFIP2 in the photoreceptor and ON bipolar cells.
We observed displaced amacrine and ganglion cells in the IPL of the Cyfip2 CKO retina. In a zebrafish cyfip2 mutant, nevermind (nev), a subset of amacrine and ganglion cells is displaced to the IPL (44), suggesting evolutionarily conserved roles of Cyfip2 in the retina among species. The retinal ganglion cells in zebrafish cyfip2 mutants autonomously exhibit defects in axon sorting in the optic tract and aberrant axonal projections in the tectum (40,44). Mechanistically, CYFIP2’s function in axon sorting requires its interaction with the WRC (40). Impaired OKRs in Cyfip2 CKO mice might be attributed to missorting of retinal ganglion cell axons mediated through compromised WRC function and resulting abnormal projections to the brain regions, including the superior colliculus. Moreover, using RNA-seq analysis, we observed a subset of downregulated or upregulated genes in the Cyfip2 CKO retina. GO analysis revealed that the upregulated and downregulated genes were associated with the extracellular matrix structural constituents. A previous report revealed that the upregulated and downregulated genes in the Cyfip2-deficient cerebral cortex are associated with extracellular matrix-related terms (45) implying a similar function of CYFIP2, in part, in the retina and cerebral cortex. In addition, the upregulated and downregulated genes in the Cyfip2 CKO retina were associated with several molecular functions related to channel and transporter activities, including inorganic cation transmembrane transporter activity. Although we cannot rule out other explanations, dysregulation of ion homeostasis in the retina might underpin alterations in the retinal ganglion cell properties and OKRs in Cyfip2 CKO mice.
In humans, CYFIP2 variants have been reported to be linked to ID (26,27). Notably, visual impairment is frequently observed in individuals with ID (2). Some ID cases harboring CYFIP2 variants exhibit visual impairments (26,27). We found alterations in the retinal ganglion cell properties and impaired OKRs in Cyfip2 CKO mice. Our results shed light on the mechanisms underlying visual impairments associated with human CYFIP2 variants. More broadly, this study implies that visual problems observed in subjects with neurodevelopmental disorders, including ID, are, at least in part, attributed to abnormalities in the retinal circuit function. Further studies would be useful to explore the causes and mechanisms leading to sensory symptoms in neurodevelopmental disorders.
Materials and Methods
Animal care
All procedures conformed to the ARVO Statement for the Use of Animals in Ophthalmic and Vision Research. These procedures were approved by the Institutional Safety Committee on Recombinant DNA Experiments (approval ID 04220-4) and Animal Experimental (approval ID 29-01-3) Committees of Institute for Protein Research at Osaka University and by the Institutional Animal Care and Use Committee of Senshu University’s Department of Psychology (approval ID 2018-3). These procedures were also performed in compliance with the institutional guidelines and conformed to the relevant ethics guidelines for research with animals in Japan. Mice were housed in a temperature-controlled room at 20–26°C with a 12-h light/dark cycle. Fresh water and rodent diet were available at all times.
Generation of Cyfip2 flox mice and Cyfip2 CKO mice
An embryonic stem (ES) clone, Cyfip2tm1a(EUCOMM)Wtsi-EPD0436_2_B03 (JM8A3.N1), in which the LacZ, neomycin-resistant (Neo) gene cassettes and loxP sites were inserted into the genomic region of Cyfip2, was purchased from the European conditional mouse mutagenesis program (EUCOMM). ES cells were microinjected into C57BL/6 blastocysts to generate chimeric mice. These chimeric mice were bred with C57BL/6 mice to generate heterozygous Cyfip2tm1a(EUCOMM)Wtsi mice, which were subsequently crossed with B6-Tg(CAG-FLPe)37 mice (#RBRC01835, RIKEN BRC) to remove the flippase recognition target (FRT)-flanked LacZ and Neo cassettes using flippase (Flp) recombinase. We mated the Cyfip2 flox mouse line with the transgenic mice expressing Cre recombinase under the control of the Dkk3 promoter (Dkk3-Cre) (31).
In situ hybridization
In situ hybridization was performed as described previously (46). Digoxigenin-labeled riboprobes were generated by in vitro transcription using 11-digoxigenin UTPs (Roche, Switzerland). Complementary DNA (cDNA) fragments of mouse Cyfip1, Cyfip2 and Fmr1 for in situ hybridization probes were obtained by PCR using a mouse P6 retinal cDNA library as a template. Primers used for amplification are listed in Supplementary Material, Table S1.
Northern blot analysis
Northern blot analysis was carried out as described previously (47). Total RNAs were extracted from the mouse tissues. Five micrograms of total RNA from the retina or 10 μg of total RNA from other tissues were electrophoresed on a 1.0% agarose formaldehyde gel and transferred to a nylon membrane (Pall, USA). The Cyfip2 cDNA fragment for the in situ hybridization probe was used to synthesize radiolabeled probes.
RT-PCR analysis
RT-PCR analysis was performed as described previously (48). Retinal total RNAs from control and Cyfip2 CKO mice were isolated using TRIzol RNA extraction reagent (Invitrogen, USA). Total RNA of 2 μg was reverse-transcribed into cDNA with random hexamers using SuperscriptII (Invitrogen). The cDNAs were used as templates for PCR reactions by rTaq polymerase (Takara, Kyoto, Japan). Primers used for amplification are listed in Supplementary Material, Table S1. The product sizes of Cyfip2 and β-actin were 78 and 201 bp, respectively.
Toluidine blue staining
Toluidine blue staining of retinal sections was performed as described previously (49). Retinal sections were rinsed with phosphate-buffered saline (PBS) and then stained with 0.1% toluidine blue in PBS for 1 min. After washing with PBS, slides were coverslipped and immediately observed under the microscope.
Immunohistochemistry
Immunohistochemical analysis of retinal sections was performed as described previously (50). Mouse eyecups were fixed with 4% paraformaldehyde in PBS for 30 min. The tissues were then rinsed in PBS, cryoprotected with 30% sucrose in PBS, embedded in TissueTec OCT compound 4583 (Sakura, Japan), frozen and sectioned. Frozen 20 μm sections on slides were dried for 30 min at room temperature, rehydrated in PBS for 5 min, incubated with blocking buffer (5% normal donkey serum, and 0.1% Triton X-100 in PBS) for 1 h and then with primary antibodies at 4°C overnight. Slides were washed with PBS three times for 10 min each time and incubated with secondary antibodies for 2 h at room temperature. We used the following primary antibodies for immunostaining: rabbit anti-Rhodopsin (1:1000, LSL, Japan, LB-5597), goat anti-S-opsin (1:500, Santa Cruz, USA, sc-14 363), rabbit anti-Chx10 (1:400) (51), rabbit anti-Calbindin (Calbiochem, USA, PC253L, 1:2000), mouse anti-Pax6 (DSHB, USA, 1:200), mouse anti-S100β (1:200, Sigma, USA, S-2532), rabbit anti-Ap2α (Novus Biologicals, USA, NBP1-95386, 1:1000), mouse anti-Brn3a (Chemicon, USA, MAB1585, 1:400), rabbit anti-ChAT (Chemicon, AB143, 1:500) and mouse anti-TH (Millipore, USA, MAB5280, 1:500) antibodies. We used Cy3-conjugated secondary antibodies (Jackson ImmunoResearch Laboratories, USA, 1:500) and Alexa Fluor 488-conjugated secondary antibodies (Sigma, 1:500). The specimens were observed under a laser confocal microscope (LSM700, Carl Zeiss, Germany).
RNA-seq and data analysis
RNA-seq analysis was performed as previously described (52), with some modifications. Total retinal RNAs from the control and Cyfip2 CKO mice at P14 were isolated using TRIzol RNA extraction reagent (Invitrogen). Sequencing was performed on an Illumina NovaSeq 6000 platform in the 101-base single-end mode. The raw reads were mapped to the mouse reference genome sequences (mm10) using TopHat ver. 2.0.13, in combination with the Bowtie2 ver. 2.3.5.1, and SAMtools ver. 1.11. The number of fragments per kilobase of exon per million mapped fragments was calculated using Cufflinks ver. 2.2.1. PCA and heatmap visualization were conducted using the web tool ClustVis (53) with default parameters. GO analysis was performed using the ToppGene Suite web tool (54). Cyfip2 and Dkk3 genes were excluded from PCA and GO analyses.
ERG recording
ERGs were recorded with a white LED luminescent electrode placed on the cornea as described previously (PuREC; Mayo, Japan) (55). Mice were dark adapted overnight and anesthetized with an intraperitoneal injection of 100 mg/kg ketamine and 10 mg/kg xylazine and then placed on a heating pad. Pupils were dilated with topical 0.5% tropicamide and 0.5% phenylephrine HCl. The mice were stimulated with an LED flash. Four levels of stimulus intensities ranging from −4.0 to 1.0 log cd-s/m2 were used for the scotopic ERG recordings, and four levels of stimuli ranging from −0.5 to 1.0 log cd-s/m2 were used for the photopic ERG recordings. After mice were light adapted for 10 min, the photopic ERGs were recorded on a rod-suppressing white background of 1.3 log cd/m2. Eight and four responses were averaged for scotopic recordings (−4.0 and −3.0 log cd-s/m2, respectively). Sixteen responses were averaged for photopic recordings.
MEA recording
MEA recordings were conducted as described previously (37,56). Control mice of either sex (two males and three females) and Cyfip2 CKO mice of either sex (one male and five females) were dark-adapted for 1 h and sacrificed. All dissection procedures were conducted under dim red light. The retina was exposed to red light at 5.0 lx for 5–8 min before recording. The eyes were enucleated under a stereomicroscope. The eyeballs were transferred into the dish with the artificial cerebrospinal fluid (ACSF) described below, and the cornea and lens were removed. The retina was carefully isolated from the pigment epithelium and fixed on filter paper with a hole (2 mm in diameter). The retina with the filter paper was placed on a perforated MEA (60pMEA100/30iR-Ti, Multichannel Systems, Germany: 60 electrodes, electrode size 30 × 30 μm, inter-electrode distance 100 μm) with the GCL facing down (57). The retina was continually superfused (4 ml/min) with the bicarbonate-buffered ACSF bubbled with 95% O2/5% CO2 at 32°C. The ACSF contained 117 mm NaCl, 6 mm D-glucose, 3.1 mm KCl, 23 mm NaHCO3, 0.5 mm KH2PO4, 2.0 mm CaCl2, 1 mm MgSO4 and 4 mg/l phenol red.
Spike discharges from the retinal ganglion cells were amplified (MEA 1060-BC, Multichannel Systems) and stored at 20 kHz (PowerLab 16/35, AD Instruments, Australia) on a computer hard disk. Waveforms of each spike were band-pass filtered (200–2000 Hz) and sorted into single-unit activities by PCA and template matching with programs using Spike2 (Version 9, Cambridge Electronic Design, UK). Among several unit activities recorded from each electrode, we selected one to three single units with a good signal-to-noise ratio for further analyses. Only units with clear refractory periods observed in the auto-correlogram with a bin width of 1 ms were included in the analyses in this study.
Light stimulation and cell classification in the MEA recording
Light stimuli were generated by Psychtoolbox 3 (58,59) in MATLAB and presented on a liquid crystal display (CL8801N, refresh rate 60 Hz, 800 × 600 pixels, NEWAY Industrial Limited, China). Images of the display were projected onto the retina using optics. The light stimulus on the retina was a square of 3800 × 2857 μm. The background level was maintained at 1.32 lx. Both spatially uniform positive flash (light intensity = 2.63 lx) and negative flash stimuli (light intensity = 0.01 lx) were presented (duration = 2 s) to the retinas. Both stimuli were presented 11 times (stimulus onset asynchrony = 8 s), and the data obtained from the first trial were omitted from the analyses. Based on the photoresponse properties, we classified all cells into three groups as follows; the ON cell group: cells showed an increase in firing rate following stimulus onset of a positive flash, the OFF cell group: cells showed an increase in firing rate following the stimulus onset of a negative flash and the ON–OFF cell group: cells showed increases in the firing rate following stimulus onset, both positive and negative flashes. No analysis was performed on cells that showed no light response.
OKR recording
OKR recording was performed as described previously (33,35–38,60–64). The mouse right eye was illuminated by infrared light emitting diodes and monitored with CCD camera using image processing software (Geteye, Matsuura-Denko-sha, Japan). The visual stimuli were moving sinusoidal grating patterns of five spatial frequencies selected randomly from a lookup table: 0.0313, 0.0625, 0.125, 0.25 and 0.5 cycle/deg in a given trial. The temporal frequency was selected from 0.1875, 0.375, 0.75, 1.5, 3, 6, 12 or 24 Hz. In initial OKR experiment, the data on six control and six Cyfip2 CKO mice were obtained. In late OKR experiment, the data on five control and seven Cyfip2 CKO mice were obtained.
Statistical analysis
Statistical analysis was performed using unpaired t-test, Mann–Whitney U test or two-way repeated measures ANOVA as indicated in figure legends. A value of P < 0.05 was taken to be statistically significant.
Data availability
All sequencing data are available on GEO (GSE176528).
Supplementary Material
Acknowledgements
We thank M. Kadowaki, A. Tani, A. Ishimaru, T. Nakayama, S. Gion, M. Wakabayashi, H. Abe, M. Nakamura, K. Yoshida, R. Sanuki, S. Irie, S. Watanabe, S. Mikusa and T. Miyata for technical assistance. We acknowledge the NGS core facility of the Genome Information Research Center at the Research Institute for Microbial Diseases of Osaka University for their support with RNA sequencing and data analysis.
Conflict of Interest statement. None declared.
Contributor Information
Taro Chaya, Laboratory for Molecular and Developmental Biology, Institute for Protein Research, Osaka University, Osaka 565-0871, Japan.
Hiroshi Ishikane, Department of Psychology, Faculty of Human Sciences, Senshu University, Kawasaki 214-8580, Japan.
Leah R Varner, Laboratory for Molecular and Developmental Biology, Institute for Protein Research, Osaka University, Osaka 565-0871, Japan.
Yuko Sugita, Laboratory for Molecular and Developmental Biology, Institute for Protein Research, Osaka University, Osaka 565-0871, Japan.
Yamato Maeda, Laboratory for Molecular and Developmental Biology, Institute for Protein Research, Osaka University, Osaka 565-0871, Japan.
Ryotaro Tsutsumi, Laboratory for Molecular and Developmental Biology, Institute for Protein Research, Osaka University, Osaka 565-0871, Japan.
Daisuke Motooka, Genome Information Research Center, Research Institute for Microbial Diseases, Osaka University, Osaka 565-0871, Japan.
Daisuke Okuzaki, Genome Information Research Center, Research Institute for Microbial Diseases, Osaka University, Osaka 565-0871, Japan.
Takahisa Furukawa, Laboratory for Molecular and Developmental Biology, Institute for Protein Research, Osaka University, Osaka 565-0871, Japan.
Funding
Grant-in-Aid for Scientific Research (21H02657, 20K07326) from the Japan Society for the Promotion of Science; Japan Science and Technology Agency Moonshot R&D (JPMJMS2024); The Takeda Science Foundation; The Uehara Memorial Foundation; The Cell Science Research Foundation; Suzuken Memorial Foundation.
References
- 1. Tasse, M.J., Luckasson, R. and Schalock, R.L. (2016) The relation between intellectual functioning and adaptive behavior in the diagnosis of intellectual disability. Intellect. Dev. Disabil., 54, 381–390. [DOI] [PubMed] [Google Scholar]
- 2. Kinnear, D., Rydzewska, E., Dunn, K., Hughes-McCormack, L., Melville, C., Henderson, A. and Cooper, S.A. (2020) The relative influence of intellectual disabilities and autism on sensory impairments and physical disability: a whole-country cohort of 5.3 million children and adults. J. Appl. Res. Intellect. Disabil., 33, 1059–1068. [DOI] [PMC free article] [PubMed] [Google Scholar]
- 3. Durkin, M. (2002) The epidemiology of developmental disabilities in low-income countries. Ment. Retard. Dev. Disabil. Res. Rev., 8, 206–211. [DOI] [PubMed] [Google Scholar]
- 4. Leonard, H. and Wen, X. (2002) The epidemiology of mental retardation: challenges and opportunities in the new millennium. Ment. Retard. Dev. Disabil. Res. Rev., 8, 117–134. [DOI] [PubMed] [Google Scholar]
- 5. Raymond, F.L. (2006) X linked mental retardation: a clinical guide. J. Med. Genet., 43, 193–200. [DOI] [PMC free article] [PubMed] [Google Scholar]
- 6. Maulik, P.K., Mascarenhas, M.N., Mathers, C.D., Dua, T. and Saxena, S. (2011) Prevalence of intellectual disability: a meta-analysis of population-based studies. Res. Dev. Disabil., 32, 419–436. [DOI] [PubMed] [Google Scholar]
- 7. Schenck, A., Bardoni, B., Moro, A., Bagni, C. and Mandel, J.L. (2001) A highly conserved protein family interacting with the fragile X mental retardation protein (FMRP) and displaying selective interactions with FMRP-related proteins FXR1P and FXR2P. Proc. Natl. Acad. Sci. U. S. A., 98, 8844–8849. [DOI] [PMC free article] [PubMed] [Google Scholar]
- 8. Schaefer, G.B. and Mendelsohn, N.J. (2008) Genetics evaluation for the etiologic diagnosis of autism spectrum disorders. Genet. Med., 10, 4–12. [DOI] [PubMed] [Google Scholar]
- 9. Wang, L.W., Berry-Kravis, E. and Hagerman, R.J. (2010) Fragile X: leading the way for targeted treatments in autism. Neurotherapeutics, 7, 264–274. [DOI] [PMC free article] [PubMed] [Google Scholar]
- 10. Richter, J.D. and Zhao, X. (2021) The molecular biology of FMRP: new insights into fragile X syndrome. Nat. Rev. Neurosci., 22, 209–222. [DOI] [PMC free article] [PubMed] [Google Scholar]
- 11. Chen, Z., Borek, D., Padrick, S.B., Gomez, T.S., Metlagel, Z., Ismail, A.M., Umetani, J., Billadeau, D.D., Otwinowski, Z. and Rosen, M.K. (2010) Structure and control of the actin regulatory WAVE complex. Nature, 468, 533–538. [DOI] [PMC free article] [PubMed] [Google Scholar]
- 12. Spence, E.F. and Soderling, S.H. (2015) Actin out: regulation of the synaptic cytoskeleton. J. Biol. Chem., 290, 28613–28622. [DOI] [PMC free article] [PubMed] [Google Scholar]
- 13. Chen, B., Chou, H.T., Brautigam, C.A., Xing, W., Yang, S., Henry, L., Doolittle, L.K., Walz, T. and Rosen, M.K. (2017) Rac1 GTPase activates the WAVE regulatory complex through two distinct binding sites. elife, 6, e29795. [DOI] [PMC free article] [PubMed] [Google Scholar]
- 14. Zhang, Y., Lee, Y. and Han, K. (2019) Neuronal function and dysfunction of CYFIP2: from actin dynamics to early infantile epileptic encephalopathy. BMB Rep., 52, 304–311. [DOI] [PMC free article] [PubMed] [Google Scholar]
- 15. Bonaccorso, C.M., Spatuzza, M., Di Marco, B., Gloria, A., Barrancotto, G., Cupo, A., Musumeci, S.A., D'Antoni, S., Bardoni, B. and Catania, M.V. (2015) Fragile X mental retardation protein (FMRP) interacting proteins exhibit different expression patterns during development. Int. J. Dev. Neurosci., 42, 15–23. [DOI] [PubMed] [Google Scholar]
- 16. Zhang, Y., Kang, H.R. and Han, K. (2019) Differential cell-type-expression of CYFIP1 and CYFIP2 in the adult mouse hippocampus. Anim. Cells Syst. (Seoul), 23, 380–383. [DOI] [PMC free article] [PubMed] [Google Scholar]
- 17. Kumar, V., Kim, K., Joseph, C., Kourrich, S., Yoo, S.H., Huang, H.C., Vitaterna, M.H., Pardo-Manuel de Villena, F., Churchill, G., Bonci, A. and Takahashi, J.S. (2013) C57BL/6N mutation in cytoplasmic FMRP interacting protein 2 regulates cocaine response. Science, 342, 1508–1512. [DOI] [PMC free article] [PubMed] [Google Scholar]
- 18. Han, K., Chen, H., Gennarino, V.A., Richman, R., Lu, H.C. and Zoghbi, H.Y. (2015) Fragile X-like behaviors and abnormal cortical dendritic spines in cytoplasmic FMR1-interacting protein 2-mutant mice. Hum. Mol. Genet., 24, 1813–1823. [DOI] [PMC free article] [PubMed] [Google Scholar]
- 19. Chung, L., Wang, X., Zhu, L., Towers, A.J., Cao, X., Kim, I.H. and Jiang, Y.H. (2015) Parental origin impairment of synaptic functions and behaviors in cytoplasmic FMRP interacting protein 1 (Cyfip1) deficient mice. Brain Res., 1629, 340–350. [DOI] [PMC free article] [PubMed] [Google Scholar]
- 20. Abekhoukh, S. and Bardoni, B. (2014) CYFIP family proteins between autism and intellectual disability: links with fragile X syndrome. Front. Cell. Neurosci., 8, 81. [DOI] [PMC free article] [PubMed] [Google Scholar]
- 21. Yoon, K.J., Nguyen, H.N., Ursini, G., Zhang, F., Kim, N.S., Wen, Z., Makri, G., Nauen, D., Shin, J.H., Park, Y.et al. (2014) Modeling a genetic risk for schizophrenia in iPSCs and mice reveals neural stem cell deficits associated with adherens junctions and polarity. Cell Stem Cell, 15, 79–91. [DOI] [PMC free article] [PubMed] [Google Scholar]
- 22. Oguro-Ando, A., Rosensweig, C., Herman, E., Nishimura, Y., Werling, D., Bill, B.R., Berg, J.M., Gao, F., Coppola, G., Abrahams, B.S.et al. (2015) Increased CYFIP1 dosage alters cellular and dendritic morphology and dysregulates mTOR. Mol. Psychiatry, 20, 1069–1078. [DOI] [PMC free article] [PubMed] [Google Scholar]
- 23. Spranger, S., Rommel, B., Jauch, A., Bodammer, R., Mehl, B. and Bullerdiek, J. (2000) Interstitial deletion of 5q33.3q35.1 in a girl with mild mental retardation. Am. J. Med. Genet., 93, 107–109. [DOI] [PubMed] [Google Scholar]
- 24. Lee, J.H., Kim, H.J., Yoon, J.M., Cheon, E.J., Lim, J.W., Ko, K.O. and Lee, G.M. (2016) Interstitial deletion of 5q33.3q35.1 in a boy with severe mental retardation. Korean J. Pediatr., 59, S19–S24. [DOI] [PMC free article] [PubMed] [Google Scholar]
- 25. Nakashima, M., Kato, M., Aoto, K., Shiina, M., Belal, H., Mukaida, S., Kumada, S., Sato, A., Zerem, A., Lerman-Sagie, T.et al. (2018) De novo hotspot variants in CYFIP2 cause early-onset epileptic encephalopathy. Ann. Neurol., 83, 794–806. [DOI] [PubMed] [Google Scholar]
- 26. Zweier, M., Begemann, A., McWalter, K., Cho, M.T., Abela, L., Banka, S., Behring, B., Berger, A., Brown, C.W., Carneiro, M.et al. (2019) Spatially clustering de novo variants in CYFIP2, encoding the cytoplasmic FMRP interacting protein 2, cause intellectual disability and seizures. Eur. J. Hum. Genet., 27, 747–759. [DOI] [PMC free article] [PubMed] [Google Scholar]
- 27. Begemann, A., Sticht, H., Begtrup, A., Vitobello, A., Faivre, L., Banka, S., Alhaddad, B., Asadollahi, R., Becker, J., Bierhals, T.et al. (2021) New insights into the clinical and molecular spectrum of the novel CYFIP2-related neurodevelopmental disorder and impairment of the WRC-mediated actin dynamics. Genet. Med., 23, 543–554. [DOI] [PMC free article] [PubMed] [Google Scholar]
- 28. Sanuki, R., Onishi, A., Koike, C., Muramatsu, R., Watanabe, S., Muranishi, Y., Irie, S., Uneo, S., Koyasu, T., Matsui, R.et al. (2011) miR-124a is required for hippocampal axogenesis and retinal cone survival through Lhx2 suppression. Nat. Neurosci., 14, 1125–1134. [DOI] [PubMed] [Google Scholar]
- 29. Kozuka, T., Omori, Y., Watanabe, S., Tarusawa, E., Yamamoto, H., Chaya, T., Furuhashi, M., Morita, M., Sato, T., Hirose, S.et al. (2019) miR-124 dosage regulates prefrontal cortex function by dopaminergic modulation. Sci. Rep., 9, 3445. [DOI] [PMC free article] [PubMed] [Google Scholar]
- 30. Xu, X.L., Li, Y., Wang, F. and Gao, F.B. (2008) The steady-state level of the nervous-system-specific microRNA-124a is regulated by dFMR1 in Drosophila. J. Neurosci., 28, 11883–11889. [DOI] [PMC free article] [PubMed] [Google Scholar]
- 31. Sato, S., Inoue, T., Terada, K., Matsuo, I., Aizawa, S., Tano, Y., Fujikado, T. and Furukawa, T. (2007) Dkk3-Cre BAC transgenic mouse line: a tool for highly efficient gene deletion in retinal progenitor cells. Genesis, 45, 502–507. [DOI] [PubMed] [Google Scholar]
- 32. Stahl, J.S. (2004) Using eye movements to assess brain function in mice. Vis. Res., 44, 3401–3410. [DOI] [PubMed] [Google Scholar]
- 33. Tabata, H., Shimizu, N., Wada, Y., Miura, K. and Kawano, K. (2010) Initiation of the optokinetic response (OKR) in mice. J. Vis., 10, 13.1–13.17. [DOI] [PubMed] [Google Scholar]
- 34. Gellman, R.S., Carl, J.R. and Miles, F.A. (1990) Short latency ocular-following responses in man. Vis. Neurosci., 5, 107–122. [DOI] [PubMed] [Google Scholar]
- 35. Sugita, Y., Miura, K., Araki, F., Furukawa, T. and Kawano, K. (2013) Contributions of retinal direction-selective ganglion cells to optokinetic responses in mice. Eur. J. Neurosci., 38, 2823–2831. [DOI] [PubMed] [Google Scholar]
- 36. Sugita, Y., Araki, F., Chaya, T., Kawano, K., Furukawa, T. and Miura, K. (2015) Role of the mouse retinal photoreceptor ribbon synapse in visual motion processing for optokinetic responses. PLoS One, 10, e0124132. [DOI] [PMC free article] [PubMed] [Google Scholar]
- 37. Chaya, T., Matsumoto, A., Sugita, Y., Watanabe, S., Kuwahara, R., Tachibana, M. and Furukawa, T. (2017) Versatile functional roles of horizontal cells in the retinal circuit. Sci. Rep., 7, 5540. [DOI] [PMC free article] [PubMed] [Google Scholar]
- 38. Ueno, A., Omori, Y., Sugita, Y., Watanabe, S., Chaya, T., Kozuka, T., Kon, T., Yoshida, S., Matsushita, K., Kuwahara, R.et al. (2018) Lrit1, a retinal transmembrane protein, regulates selective synapse formation in cone photoreceptor cells and visual acuity. Cell Rep., 22, 3548–3561. [DOI] [PubMed] [Google Scholar]
- 39. Napoli, I., Mercaldo, V., Boyl, P.P., Eleuteri, B., Zalfa, F., De Rubeis, S., Di Marino, D., Mohr, E., Massimi, M., Falconi, M.et al. (2008) The fragile X syndrome protein represses activity-dependent translation through CYFIP1, a new 4E-BP. Cell, 134, 1042–1054. [DOI] [PubMed] [Google Scholar]
- 40. Cioni, J.M., Wong, H.H., Bressan, D., Kodama, L., Harris, W.A. and Holt, C.E. (2018) Axon-axon interactions regulate topographic optic tract sorting via CYFIP2-dependent WAVE complex function. Neuron, 97, 1078–1093.e6. [DOI] [PMC free article] [PubMed] [Google Scholar]
- 41. Korb, E., Herre, M., Zucker-Scharff, I., Gresack, J., Allis, C.D. and Darnell, R.B. (2017) Excess translation of epigenetic regulators contributes to fragile X syndrome and is alleviated by Brd4 inhibition. Cell, 170, 1209–1223.e20. [DOI] [PMC free article] [PubMed] [Google Scholar]
- 42. Rossignol, R., Ranchon-Cole, I., Paris, A., Herzine, A., Perche, A., Laurenceau, D., Bertrand, P., Cercy, C., Pichon, J., Mortaud, S.et al. (2014) Visual sensorial impairments in neurodevelopmental disorders: evidence for a retinal phenotype in fragile X syndrome. PLoS One, 9, e105996. [DOI] [PMC free article] [PubMed] [Google Scholar]
- 43. Perche, O., Felgerolle, C., Ardourel, M., Bazinet, A., Paris, A., Rossignol, R., Meyer-Dilhet, G., Mausset-Bonnefont, A.L., Hebert, B., Laurenceau, D.et al. (2018) Early retinal defects in Fmr1(−/y) mice: toward a critical role of visual dys-sensitivity in the fragile X syndrome phenotype? Front. Cell. Neurosci., 12, 96. [DOI] [PMC free article] [PubMed] [Google Scholar]
- 44. Pittman, A.J., Gaynes, J.A. and Chien, C.B. (2010) nev (cyfip2) is required for retinal lamination and axon guidance in the zebrafish retinotectal system. Dev. Biol., 344, 784–794. [DOI] [PMC free article] [PubMed] [Google Scholar]
- 45. Zhang, Y., Kang, H., Lee, Y., Kim, Y., Lee, B., Kim, J.Y., Jin, C., Kim, S., Kim, H. and Han, K. (2018) Smaller body size, early postnatal lethality, and cortical extracellular matrix-related gene expression changes of Cyfip2-null embryonic mice. Front. Mol. Neurosci., 11, 482. [DOI] [PMC free article] [PubMed] [Google Scholar]
- 46. Tsutsumi, R., Chaya, T. and Furukawa, T. (2018) Enriched expression of the ciliopathy gene ick in cell proliferating regions of adult mice. Gene Expr. Patterns, 29, 18–23. [DOI] [PubMed] [Google Scholar]
- 47. Chaya, T., Omori, Y., Kuwahara, R. and Furukawa, T. (2014) ICK is essential for cell type-specific ciliogenesis and the regulation of ciliary transport. EMBO J., 33, 1227–1242. [DOI] [PMC free article] [PubMed] [Google Scholar]
- 48. Okamoto, S., Chaya, T., Omori, Y., Kuwahara, R., Kubo, S., Sakaguchi, H. and Furukawa, T. (2017) Ick ciliary kinase is essential for planar cell polarity formation in inner ear hair cells and hearing function. J. Neurosci., 37, 2073–2085. [DOI] [PMC free article] [PubMed] [Google Scholar]
- 49. Chaya, T., Tsutsumi, R., Varner, L.R., Maeda, Y., Yoshida, S. and Furukawa, T. (2019) Cul3-Klhl18 ubiquitin ligase modulates rod transducin translocation during light-dark adaptation. EMBO J., 38, e101409. [DOI] [PMC free article] [PubMed] [Google Scholar]
- 50. Omori, Y., Chaya, T., Katoh, K., Kajimura, N., Sato, S., Muraoka, K., Ueno, S., Koyasu, T., Kondo, M. and Furukawa, T. (2010) Negative regulation of ciliary length by ciliary male germ cell-associated kinase (Mak) is required for retinal photoreceptor survival. Proc. Natl. Acad. Sci. U. S. A., 107, 22671–22676. [DOI] [PMC free article] [PubMed] [Google Scholar]
- 51. Koike, C., Nishida, A., Ueno, S., Saito, H., Sanuki, R., Sato, S., Furukawa, A., Aizawa, S., Matsuo, I., Suzuki, N.et al. (2007) Functional roles of Otx2 transcription factor in postnatal mouse retinal development. Mol. Cell. Biol., 27, 8318–8329. [DOI] [PMC free article] [PubMed] [Google Scholar]
- 52. Sugiyama, T., Yamamoto, H., Kon, T., Chaya, T., Omori, Y., Suzuki, Y., Abe, K., Watanabe, D. and Furukawa, T. (2020) The potential role of Arhgef33 RhoGEF in foveal development in the zebra finch retina. Sci. Rep., 10, 21450. [DOI] [PMC free article] [PubMed] [Google Scholar]
- 53. Metsalu, T. and Vilo, J. (2015) ClustVis: a web tool for visualizing clustering of multivariate data using principal component analysis and heatmap. Nucleic Acids Res., 43, W566–W570. [DOI] [PMC free article] [PubMed] [Google Scholar]
- 54. Chen, J., Bardes, E.E., Aronow, B.J. and Jegga, A.G. (2009) ToppGene suite for gene list enrichment analysis and candidate gene prioritization. Nucleic Acids Res., 37, W305–W311. [DOI] [PMC free article] [PubMed] [Google Scholar]
- 55. Irie, S., Sanuki, R., Muranishi, Y., Kato, K., Chaya, T. and Furukawa, T. (2015) Rax homeoprotein regulates photoreceptor cell maturation and survival in association with Crx in the postnatal mouse retina. Mol. Cell. Biol., 35, 2583–2596. [DOI] [PMC free article] [PubMed] [Google Scholar]
- 56. Ishikane, H., Gangi, M., Honda, S. and Tachibana, M. (2005) Synchronized retinal oscillations encode essential information for escape behavior in frogs. Nat. Neurosci., 8, 1087–1095. [DOI] [PubMed] [Google Scholar]
- 57. Reinhard, K., Tikidji-Hamburyan, A., Seitter, H., Idrees, S., Mutter, M., Benkner, B. and Munch, T.A. (2014) Step-by-step instructions for retina recordings with perforated multi electrode arrays. PLoS One, 9, e106148. [DOI] [PMC free article] [PubMed] [Google Scholar]
- 58. Brainard, D.H. (1997) The Psychophysics Toolbox. Spat. Vis., 10, 433–436. [PubMed] [Google Scholar]
- 59. Pelli, D.G. (1997) The VideoToolbox software for visual psychophysics: transforming numbers into movies. Spat. Vis., 10, 437–442. [PubMed] [Google Scholar]
- 60. Sugita, Y., Miura, K. and Kawano, K. (2012) Principal Fourier component of motion stimulus dominates the initial optokinetic response in mice. Neurosci. Res., 73, 133–141. [DOI] [PubMed] [Google Scholar]
- 61. Watanabe, S., Sanuki, R., Sugita, Y., Imai, W., Yamazaki, R., Kozuka, T., Ohsuga, M. and Furukawa, T. (2015) Prdm13 regulates subtype specification of retinal amacrine interneurons and modulates visual sensitivity. J. Neurosci., 35, 8004–8020. [DOI] [PMC free article] [PubMed] [Google Scholar]
- 62. Miura, K., Sugita, Y., Furukawa, T. and Kawano, K. (2018) Two-frame apparent motion presented with an inter-stimulus interval reverses optokinetic responses in mice. Sci. Rep., 8, 17816. [DOI] [PMC free article] [PubMed] [Google Scholar]
- 63. Sugita, Y., Miura, K. and Furukawa, T. (2020) Retinal ON and OFF pathways contribute to initial optokinetic responses with different temporal characteristics. Eur. J. Neurosci., 52, 3160–3165. [DOI] [PubMed] [Google Scholar]
- 64. Sugita, Y., Yamamoto, H., Maeda, Y. and Furukawa, T. (2020) Influence of aging on the retina and visual motion processing for optokinetic responses in mice. Front. Neurosci., 14, 586013. [DOI] [PMC free article] [PubMed] [Google Scholar]
Associated Data
This section collects any data citations, data availability statements, or supplementary materials included in this article.
Supplementary Materials
Data Availability Statement
All sequencing data are available on GEO (GSE176528).