

Abstract
The metabolic needs for postnatal growth of the human nervous system are vast. Recessive loss-of-function mutations in the mitochondrial enzyme glutamate pyruvate transaminase 2 (GPT2) in humans cause postnatal undergrowth of brain, and cognitive and motor disability. We demonstrate that GPT2 governs critical metabolic mechanisms in neurons required for neuronal growth and survival. These metabolic processes include neuronal alanine synthesis and anaplerosis, the replenishment of tricarboxylic acid (TCA) cycle intermediates. We performed metabolomics across postnatal development in Gpt2-null mouse brain to identify the trajectory of dysregulated metabolic pathways: alterations in alanine occur earliest; followed by reduced TCA cycle intermediates and reduced pyruvate; followed by elevations in glycolytic intermediates and amino acids. Neuron-specific deletion of GPT2 in mice is sufficient to cause motor abnormalities and death pre-weaning, a phenotype identical to the germline Gpt2-null mouse. Alanine biosynthesis is profoundly impeded in Gpt2-null neurons. Exogenous alanine is necessary for Gpt2-null neuronal survival in vitro but is not needed for Gpt2-null astrocytes. Dietary alanine supplementation in Gpt2-null mice enhances animal survival and improves the metabolic profile of Gpt2-null brain but does not alone appear to correct motor function. In surviving Gpt2-null animals, we observe smaller upper and lower motor neurons in vivo. We also observe selective death of lower motor neurons in vivo with worsening motor behavior with age. In conclusion, these studies of the pathophysiology of GPT2 Deficiency have identified metabolic mechanisms that are required for neuronal growth and that potentially underlie selective neuronal vulnerabilities in motor neurons.
Introduction
After birth, the human brain and spinal cord continue to increase dramatically in size, reaching near adult proportions by age 6 (1–5). Postnatal growth of the nervous system is largely driven by axonal, dendritic, and synaptic growth, as well as glial development, as processes such as neurogenesis are completed prior to birth. The biosynthetic needs for postnatal nervous system growth are vast, particularly for long-projecting neurons such as in the motor system. The metabolic mechanisms governing this growth have broad significance to nervous system development and disease.
Genetic diseases offer a powerful lens to investigate metabolism in the human brain. Childhood metabolic diseases may also be amenable to treatments via dietary restrictions or supplements (6). We have identified a new childhood neurometabolic disease caused by autosomal recessive, loss-of-function mutations in the mitochondrial enzyme glutamate pyruvate transaminase 2 (GPT2) (7). GPT2 Deficiency is associated with undergrowth of the brain in the postnatal period (i.e. postnatal microcephaly), as well as cognitive and motor disability. Motor disability in GPT2 Deficiency has been diagnosed as progressive spastic paraplegia, a condition preferentially affecting lower limbs and construed to be caused by selective vulnerabilities in long-projecting motor neurons (7,8). Spastic paraplegia has been linked to over 70 genetic loci; however, there are only a limited number of genes reflecting a mitochondrial process (8). Knowledge of GPT2 function, therefore, may contribute uniquely to an understanding of metabolic mechanisms governing neuronal growth, as well as to selective neuronal vulnerabilities in large and long-projecting neurons, such as motor neurons.
GPT2 is one of two transaminases that catalyze the reversible addition of an amino group from glutamate, the major excitatory neurotransmitter in brain, to pyruvate, yielding alanine and α-ketoglutarate, a tricarboxylic acid (TCA) cycle intermediate (9). GPT2-mediated metabolism has been studied in the context of cancer, particularly the role of GPT2 in supporting the TCA cycle (10–14). The TCA cycle enables fuel oxidation, as well as cataplerosis, the process wherein TCA cycle intermediates are consumed for synthesis of macromolecules for cell growth (15). Anaplerosis is the process whereby TCA cycle intermediates are replenished. Homeostatic regulation of anaplerosis and cataplerosis is crucial for times of high biosynthetic need, such as postnatal brain development during which there is a strong upregulation in GPT2 expression (7).
In the current study, we discover GPT2-mediated metabolic processes critical for neuronal growth and motor function. Both germline and conditional pan-neuronal deletion of GPT2 in mice result in motor abnormalities and premature death pre-weaning. Motor abnormalities include wide hind-limb gait, reminiscent of spastic paraplegia in humans. We demonstrate that GPT2-mediated metabolic fluxes into alanine and the TCA cycle are required preferentially for neurons, despite expression in both neurons and glia. We also find metabolic impairments in the Gpt2-null brain starting in the first postnatal week, including reduced levels of alanine and TCA cycle intermediates, followed by abnormalities in amino acid and glucose metabolism. Alanine, a non-essential amino acid, becomes essential for survival and growth of Gpt2-null neurons in vitro, but not for Gpt2-null astrocytes. Treatment of Gpt2-null animals with supplemental dietary alanine extends survival of mutant animals but does not ameliorate motor function. Lifespan extension of Gpt2-null animals on the high-alanine diet permitted us to study the progression of neuropathology and to identify selective death of lower motor neurons in Gpt2-null spinal cords. Overall, our data point to alanine as a potential therapeutic supplement for human patients with GPT2 Deficiency and identify a central role for GPT2-mediated mechanisms in neuronal growth, particularly in long-projecting neurons in motor circuitry.
Results
GPT2 activity is required in neurons in vivo for motor function and animal survival
We observed a motor phenotype in germline Gpt2-null mice, potentially akin to spastic paraplegia that is observed in patients with GPT2 Deficiency. In order to study the neuronal requirements of GPT2 as it may relate to this motor phenotype, we generated a neuron-specific deletion of GPT2. We mated mice carrying a conditional Gpt2 allele, with loxP sites flanking exon 4 (Fig. 1A), to mice expressing Cre-recombinase driven by the rat Synapsin-I promoter, allowing for cell-specific deletion of GPT2 in neurons starting at as early as embryonic day 12 (16). Of the tissues examined, excision of exon 4 by Synapsin-I-Cre–mediated recombination was observed only in the nervous tissue, brain and spinal cord (Fig. 1B). The excised allele was not present in the liver, kidney or hind-limb or fore-limb muscle. The neuronal specificity of the Synapsin-I-Cre line was further confirmed by an Ai14-tdTomato Cre reporter line (Supplementary Material, Fig. S1). We previously reported that Gpt2-null mice demonstrated premature death between postnatal day 18 (P18) and P28 (7). The pan-neuronal deletion of GPT2 (the mice hence named SynI-cKO) resulted in a similar premature death phenotype as observed for Gpt2-null mice (Fig. 1C). All Gpt2-null mice (n = 56) and SynI-cKO mice (n = 34) died by P28. SynI-cKO mice also started showing weight loss at the same time as Gpt2-null mice, at approximately P18 (Fig. 1D).
Figure 1 .
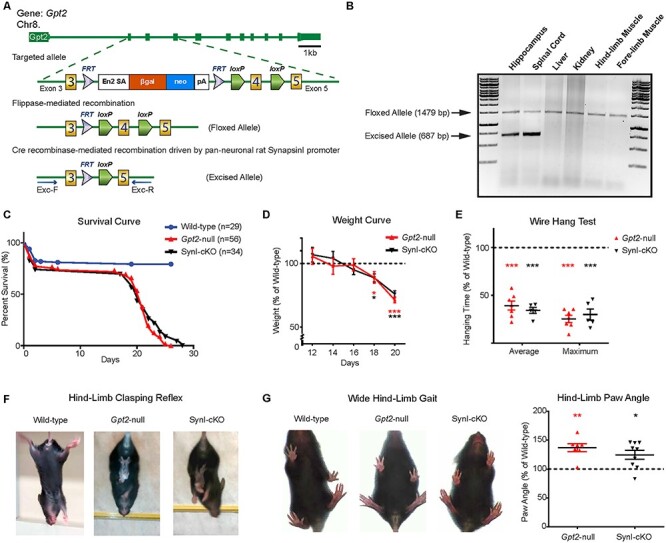
GPT2 activity is required in neurons in vivo for motor function and animal survival. (A) Schematic depicting disruption of the Gpt2 gene at the mouse genomic locus, leading to the germline-null and conditional alleles. The targeted allele consists of flippase recognition sites (FRT) flanking a cassette containing a strong splicing acceptor site (Engrailed 2-SA), β-galactosidase gene, neomycin resistance gene and polyadenylation site between exon 3 and exon 4. After flippase-mediated recombination, the floxed Gpt2-allele is converted to a conditional construct with two loxP sites flanking exon 4 (the floxed allele). Prior to Cre recombinase-mediated excision by a tissue-specific promoter, the floxed allele produces a normal GPT2 protein. The excised allele is detected with primers Exc-F & Exc-R (see Materials and Methods). (B) Validation of the conditional allele in vivo. Cre recombinase driven by the rat Synapsin-I promoter excises exon 4 only in neuronal cells. In PCR genotyping, the floxed allele appears at 1479 bp and the excised allele at 687 bp. The excision of exon 4 is absent in non-neuronal tissues such as liver, kidney and muscle. (C) Similar timelines of postnatal death in germline Gpt2-null and Synapsin-I-Cre conditional mutant (SynI-cKO) animals. Survival curves of wild-type (blue), germline Gpt2-null (red) and SynI-cKO (black) mice. Wild-type n = 29 mice, Gpt2-null n = 56, SynI-cKO n = 34. Log-rank (Mantel-Cox) test was used to determine differences between the curves. P < 0.0001 (wild-type versus Gpt2-null), P < 0.0001 (wild-type versus SynI-cKO), P = 0.5777 (Gpt2-null versus SynI-cKO). (D) Reduction in weight gain in germline Gpt2-null and SynI-cKO animals compared to wild-type. Weight curves of Gpt2-null (red) and SynI-cKO (black) animals expressed as a percentage of their wild-type littermates (n = 7–11). *0.01 < P < 0.05, **0.001 < P < 0.01, ***P < 0.001. (E) Reduced performance on wire hang test by Gpt2-null (red) and SynI-cKO (black) animals. Average and maximum hanging times are expressed as a percentage of their wild-type littermates. ***P < 0.001. (F) Gpt2-null and SynI-cKO mice demonstrate hind-limb clasping reflex. When suspended by the tail, the wild-type mice extend their hind-limbs but the Gpt2-null and SynI-cKO mice bend their hind-limbs toward the body midline and clasp their hind paws. (G) Gpt2-null and SynI-cKO mice stand in a wide stance with hind paws spread further apart. Representative images of wide hind-limb gait in Gpt2-null and SynI-cKO mice and quantification of the absolute paw angle with respect to the midline, expressed as a percentage of their wild-type littermates; Gpt2-null: 136.9 ± 6.8% P = 0.0017, SynI-cKO: 124.7 ± 7.5% P = 0.011. Data were collected and analyzed with DigiGait software.
Gpt2-null and SynI-cKO mice demonstrated a similar motor phenotype, involving motor weakness particularly of hind-limbs, beginning at approximately P18. To measure overall limb grip strength, we performed the wire hang test on Gpt2-null and SynI-cKO mice (Fig. 1E). Both groups displayed average and maximum hanging times less than 50% of their wild-type (WT) littermates’ performances, indicating poor grip strength and weakness (average hanging time WT: 28.1 ± 2.3, Gpt2-null: 12.52 ± 1.5, SynI-cKO: 10.6 ± 0.9 seconds). Both Gpt2-null and SynI-cKO mice had hind-limb clasping reflex (Fig. 1F and Supplementary Material, Videos S1–S3). Furthermore, gait with a wide hind-limb stance was also present in both Gpt2-null and SynI-cKO mice as quantified by DigiGait, a ventral plane videography of rodent gait on a treadmill (Fig. 1G). Further, in the open field arena, animals could be seen dragging their hind-limbs, again reflecting weakness of the hind-limbs (Supplementary Material, Videos S4–S6). Overall, these data indicate the importance of the GPT2 enzyme in motor function and mouse survival. Deletion of GPT2 specifically in neuronal cells was sufficient to cause a similar behavioral phenotype as the germline Gpt2-null, emphasizing the requirement for GPT2 enzyme activity in neurons.
Metabolomics across postnatal development in Gpt2-null brain identifies the trajectory of dysregulated metabolic pathways
In order to investigate the role of GPT2 in postnatal brain growth and to observe the progression of metabolic perturbations during postnatal brain development in Gpt2-null mice, we conducted targeted polar metabolic profiling on acutely dissected hippocampus at P0, P7, P14 and P18 (Fig. 2 and Supplementary Material, Tables S1–S4). We chose hippocampus as the target tissue to monitor metabolic changes, given the high Gpt2 gene expression (7). Notably, alanine was among the first metabolites in the entire metabolome in Gpt2-null hippocampus to show a significant fold change with respect to the WT littermate controls, evident as early as P0 (Fig. 2C and E). Alanine levels were increased at P0, 134 ± 7.9% of WT (P = 0.0035), then gradually reduced to 89 ± 1.7% (P = 0.0024) at P7, then to 74 ± 2.6% (P = 1.16 × 10⁻⁶) at P14 and finally to 72 ± 2.6% of WT at P18 (P = 3.20 × 10⁻⁷). With regard to the other metabolites in the GPT2 reaction (Fig. 2C), pyruvate remained within the range of the WT levels at P0, P7 and P14 but reduced to 60.8 ± 4.9% of the WT at P18 (P = 0.008). Glutamate levels were slightly elevated in the Gpt2-null tissue at P7 (112.3 ± 2.1%, P = 0.0103) but then gradually decreased at P14 (91.2 ± 2.9%, P = 0.0423) and at P18 (69.5 ± 4.4%, P = 0.0001) in comparison to WT. Alpha-ketoglutarate levels in Gpt2-null tissue remained similar to WT levels at P0, P7 and P14 but increased at P18 (134.7 ± 10.6%, P = 0.011).
Figure 2 .
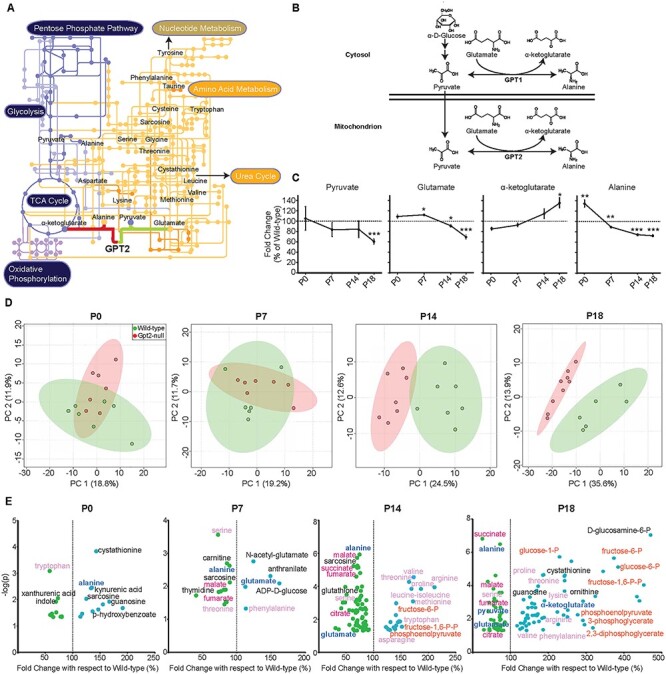
Metabolomics in Gpt2-null hippocampus across postnatal development reveals the trajectories of defective metabolic pathways. (A) GPT2 and the relevant metabolic pathways. The metabolic pathway map was modified from KEGG (Kyoto Encyclopedia of Genes and Genomes) (https://www.kegg.jp/) (48). GPT2 links amino acid metabolism (orange pathways and nodes) to the TCA cycle metabolism and glycolysis (dark purple pathways and nodes). The metabolic network illustrates the interconnection of pathways that GPT2 has an immediate influence on as well as more remote connections such as, nucleotide metabolism, pentose phosphate pathway and the urea cycle. (B) In the mitochondrion, the primary reaction of GPT2 involves a reversible transfer of an amino group from glutamate to pyruvate yielding alanine and α-ketoglutarate. The cytosolic paralog, GPT1, catalyzes the same transaminase reaction. (C) Fold changes of the metabolites in the GPT2 reaction in Gpt2-null hippocampus across postnatal development. The peak intensities obtained from targeted tandem liquid chromatography–mass spectrometry (LC–MS/MS) were normalized to the sample median. At each time point, Gpt2-null (P0: n = 7, P7: n = 6, P14: n = 7, P18: n = 9) was compared to the average of the wild-type (P0: n = 7, P7: n = 7, P14: n = 7, P18: n = 6). One sample t-test was run for each metabolite (*0.01 < P < 0.05, **0.001 < P < 0.01, ***P < 0.001). (D) 2-D Score Plots of PCA in the Gpt2-null hippocampus. The peak intensities obtained from LC–MS/MS were normalized to the sample median and auto-scaled (mean-centered and divided by the standard deviation of each group). Analyses were performed in MetaboAnalyst 4.0 (https://www.metaboanalyst.ca). (E) Volcano plots of significantly changed metabolites in Gpt2-null hippocampus across postnatal development. The fold changes are expressed as a percentage of the wild-type average. Note the greater −log(P) value on the y-axis, the stronger the raw P-value is. The dashed line is positioned at 100% of wild-type, so that any metabolite (green dots) left of the line had a reduced level and any metabolite (blue dots) right of the line had an increased level in Gpt2-null hippocampus. Dark blue metabolites are the GPT2 primary reaction metabolites (alanine, α-ketoglutarate, pyruvate, glutamate), magenta metabolites are TCA cycle intermediates, pale pink metabolites are proteinogenic amino acids and orange metabolites are glycolysis intermediates. The entire metabolomics data sets along with false discovery rates for each metabolite can be found in Supplementary Material, Tables S1–S4.
To investigate how the global metabolic profile changes in the hippocampus during postnatal development, we plotted the 2-D scores of the principal component analysis (PCA) of the metabolomics data (Fig. 2D). The two groups, WT and Gpt2-null, did not separate well at ages P0 and P7. However, consistent with upregulation of the GPT2 protein in the brain postnatally (7), at P14 and P18, the metabolic profile of Gpt2-null hippocampus was distinctly different from WT. The indistinct metabolic profiles seen at P0 and P7 point out that any significant changes happening early during the first postnatal week, such as changes in alanine, likely reflect primary effects of GPT2 Deficiency.
For a more comprehensive view of the metabolome, volcano plots were graphed (Fig. 2E). At P0, alanine and kynurenic acid were elevated, whereas tryptophan and xanthurenic acid were decreased. At P7, the early decrease of alanine was accompanied by reductions in malate (80.7 ± 5.4%, P = 0.0126) and fumarate (86.5 ± 5.4%, P = 0.0286) levels, key metabolites of the TCA cycle, as well as a reduction in serine (74.4 ± 3.5%, P = 2.7 × 10⁻⁴), a major interconvertible precursor of alanine (17).
Subsequent to decreases in alanine and TCA cycle intermediates, we noted elevations in several amino acids. At P14, alanine dropped to 74% of the WT value, along with reductions in TCA cycle intermediates including malate (73.1 ± 3.2%, P = 1.87 × 10⁻⁶), fumarate (78.7 ± 2.2%, P = 1.55 × 10⁻⁵) and succinate (75.5 ± 2%, P = 7.18 × 10⁻⁶). At P14, although glutamate levels were at 91% of the WT, some of the other amino acids were elevated, such as valine, threonine, proline, arginine and leucine–isoleucine. Serine levels were still low in Gpt2-null hippocampus at P14 (70.3 ± 2.7%, P = 8.58 × 10⁻⁴) (Fig. 2E).
At P18, 7 out of 10 essential amino acids had increased levels in the Gpt2-null hippocampus, including valine, leucine–isoleucine, phenylalanine, threonine, lysine and arginine (Fig. 2E). Methionine, tryptophan and histidine remained unchanged. On the other hand, from the non-essential amino acids, only proline showed an increase (181.8 ± 6.6%, P = 2.3 × 10⁻⁵), whereas alanine (72 ± 2.6%, P = 3.2 × 10⁻⁷), glutamate (69.5 ± 4.4%, P = 0.0332), serine (69.8 ± 2.3%, P = 0.0003) and cysteine (67.3 ± 9.9%, P = 0.0478) showed a decrease. The GPT2 gene has been shown to be a target of the stress-induced transcription factor ATF4, which promotes transcription of metabolic enzymes and amino acid transporters at times of metabolic stress such as amino acid limitation (14,18,19). However, we found no increases of ATF4 protein levels in cortex, hippocampus or liver tissue of Gpt2-null mice at P18, suggesting the elevation of amino acids in the Gpt2-null metabolome was not caused by a compensatory increase of ATF4 (Supplementary Material, Fig. S2A).
The overall decline of TCA cycle intermediates at P18 was accompanied by dramatic increases in levels of almost all glycolytic intermediates except pyruvate, including glucose 6-phosphate (380.3 ± 25.8%, P = 7.64 × 10⁻⁶), fructose 1,6-bisphosphate (453.8 ± 65%, P = 9.15 × 10⁻⁵) and phosphoenolpyruvate (244.1 ± 29.6%, P = 0.0075). We searched for protein level increases in glycolytic enzymes such as hexokinase I and pyruvate dehydrogenase, but these proteins were not increased in hippocampus (Supplementary Material, Fig. S2B). These data suggest that the increases in glycolytic intermediate metabolites may be due to regulation of enzyme activities at a substrate level, given that pyruvate levels are particularly reduced in Gpt2-null hippocampus at P18, which would directly promote glycolysis. Overall, the metabolomics data indicate that alanine synthesis is one of the first metabolic pathways that was altered as a result of loss of GPT2 in postnatal brain development. The early decline in alanine levels was followed by reductions in TCA cycle intermediates and subsequent increases in amino acids and glycolytic intermediates in Gpt2-null hippocampus.
GPT2 is enriched in neurons as compared to astrocytes
Brain metabolomics studies indicated that alanine biosynthesis was altered early in postnatal development in the Gpt2-null brain (Fig. 2). One intriguing possibility of a mechanism for pathogenesis is that alanine, normally a non-essential amino acid, has become an essential amino acid in GPT2 Deficiency. Before investigating the role of GPT2 in alanine biosynthesis in neurons and astrocytes, we characterized GPT2 expression in these cells.
We initially confirmed mitochondrial localization of GPT2 in the mouse brain. After subcellular fractionation of the whole mouse brain at P18, GPT2 was enriched in the mitochondrial fraction, whereas the paralog of GPT2, GPT1, remained in the cytosolic fraction (Fig. 3A). Enzyme activity in the mitochondrial fractions of Gpt2-null whole mouse brains revealed almost zero alanine transaminase activity (Fig. 3B), confirming the localization of GPT2 to the mitochondria at the activity level and the absence of GPT1 in mitochondria based on enzyme activity.
Figure 3 .

GPT2 is enriched in neurons and sustains alanine biosynthesis and the TCA cycle in neurons in vitro. (A) Western blotting of GPT2 and GPT1 in subcellular fractions of the mouse brain at P18. GPT2 (58 kDa) was present only in the total homogenate and mitochondrial fractions. GPT1 (55 kDa) was present in the homogenate and other intermediate fractions containing cytosol but not in the mitochondrial fraction. MTCO1: Mitochondrially encoded cytochrome c oxidase subunit 1. (B) GPT enzyme activity assay in the cytosolic and mitochondrial fractions extracted from wild-type and Gpt2-null mouse brain. Wild-type cytosol: 8.15 ± 0.68 mU/mg; Gpt2-null cytosol: 6.57 ± 0.77 mU/mg; wild-type mitochondria: 6.53 ± 1.21 mU/mg; Gpt2-null: 0.95 ± 0.58 mU/mg. **P = 0.0038. (C) GPT2 is enriched in neuronal cultures as compared to GPT1, which is more abundant in astrocytes. Representative images of western blotting of GPT2 and GPT1 in wild-type and Gpt2-null cortical neuronal and astrocyte-enriched cultures. Quantification of the ratio of GPT2 to GPT1 band intensity (right). ***P = 0.009. (D) GPT enzyme activity assay in Gpt2-null cortical neuronal and astrocyte-enriched cultures expressed as percentage of their wild-type littermate cultures. ***P = 0.0006. (E) Primary cortical neurons (top) and astrocyte-enriched cultures (bottom) from wild-type mice demonstrate localization of GPT2 to mitochondria. Confocal microscopy images of GPT2 (green), MitoTracker Red CMXRos (magenta) and MAP2 or GFAP (blue). Scale bar: 10 μm. Regions boxed in white in the images on the left (GPT2) were magnified and are depicted in images on the right to demonstrate co-localization of GPT2 and MitoTracker Red. (F) Metabolic pathways that convert [U-13C]-glucose and [α-15N]-glutamine into alanine. GLS: Glutaminase. The filled circles refer to heavy isotope 13-carbon atoms. The heavy nitrogen isotope is highlighted blue. Molecules with heavy isotopes are designated as ‘m + #’ and the number refers to the number of heavy isotope atoms. (G) GPT2 is required for alanine synthesis from glucose or glutamine in both primary neurons and astrocytes. Fractional enrichment in alanine from [α-15N]-glutamine (left) or [U-13C]-glucose (right) in wild-type and Gpt2-null cortical neuronal cultures (top) at DIV15 and astrocytes (bottom). The culture medium was replaced with Tyrode medium at DIV14 and samples were collected at DIV15. ***P < 0.0001. (H) Prominent decreases in alanine release from Gpt2-null neurons and astrocytes. Medium samples were collected at same time as the cell pellets in G. Neuronal culture: **P = 0.0057; astrocyte culture: **P = 0.0031. (I) Metabolic pathways that convert [U-13C]-glutamine into alanine and the TCA cycle intermediates. (J) GPT2 sustains TCA cycle intermediates in cortical neuronal cultures. Fractional enrichment in succinate or malate from [U-13C]-glutamine in cortical neuronal cultures as processed in G. Mixed model analysis was done to assess statistical significance with genotype as fixed factor and litters used for culture as random factor. *P = 0.0139 **P = 0.0044.
GPT2 expression was more enriched in neurons than astrocytes. We separately cultured cortical neurons and astrocytes from brains of newborn mouse pups and examined GPT2 expression by western blotting. We observed both GPT2 and GPT1 in both cortical neuronal and astrocyte-enriched cultures; however, GPT1 appeared far less abundant in the neuronal culture (Fig. 3C). The ratio of GPT2 to GPT1 band intensities was significantly greater in cortical neuronal cultures (36.15 ± 7.7) than astrocyte cultures (5.98 ± 1.88). Notably, the Gpt2-null cortical neuronal cultures had significantly more reduction in total alanine aminotransferase activity (35 ± 1% of WT) than Gpt2-null astrocytes (52.3 ± 3.1% of WT) as compared to the corresponding WT cultures, confirming the enrichment of GPT2 in neurons (Fig. 3D). Confocal microscopy images of cortical neurons (days in vitro—DIV14) and astrocytes in culture revealed the presence of GPT2 in both cell types co-localizing with the mitochondrial marker MitoTracker Red (Fig. 3E). In addition, we analyzed Gpt1 and Gpt2 gene expression in the adult mouse hippocampus in silico. We curated the number of transcripts from the single-cell RNA sequencing data that are publicly available in DropViz (www.dropviz.org) (20) (Supplementary Material, Fig. S3). We found that mouse neurons preferentially express the Gpt2 isozyme. Gpt1 expression was virtually absent, whereas the astrocytes expressed both isozymes. Overall, these data suggest the enrichment of GPT2 in neuronal cells.
Alanine biosynthesis and glutamine-fueled anaplerosis are diminished in Gpt2-null neurons in vitro
To study alanine biosynthesis in Gpt2-null cells, we investigated the conversion of glutamine or glucose into alanine via isotope tracing experiments with [α-15N]-glutamine and [U-13C]-glucose in cortical neuronal and astrocyte-enriched cultures (Fig. 3F and G). After 24 h in Tyrode medium (artificial cerebrospinal fluid-like, see Materials and Methods), fractional enrichment of labeled alanine in the WT cortical neuronal culture was 28.3 ± 1.9% and 29.6 ± 4.8% with the [α-15N]-glutamine and [U-13C]-glucose precursor, respectively (Fig. 3G, top). In contrast, in Gpt2-null cortical neurons, neither [α-15N]-glutamine nor [U-13C]-glucose precursors resulted in labeling of alanine. In astrocyte-enriched WT cultures (Fig. 3G, bottom), fractional enrichment of labeled alanine was 8.3 ± 0.9% and 5.1 ± 0.8% with the [α-15N]-glutamine and [U-13C]-glucose precursor, respectively, a far lower level of labeling than in WT neurons. As in Gpt2-null neurons, Gpt2-null astrocytes showed no labeling of alanine from either [α-15N]-glutamine or [U-13C]-glucose. Alanine release into the Tyrode medium was also substantially reduced in Gpt2-null cortical neurons and astrocytes (Fig. 3H). Importantly, the reduction in alanine release was more pronounced in cortical neuronal cultures (31.2 ± 5.1% of WT) than in astrocyte cultures (51.2 ± 6.5% of WT). Thus, in the medium conditions tested, Gpt2-null cortical neurons and astrocytes lacked the ability to produce alanine from either glutamine or glucose. The lack of labeling of alanine in Gpt2-null cells, despite the expression of GPT1, indicates that GPT2 is mainly responsible for alanine synthesis. In addition, the greater enrichment of labeled alanine in cortical neuronal cultures compared to astrocyte cultures suggests that the GPT2 reaction is more engaged to synthesize alanine in neurons compared to astrocytes.
Our data indicate that GPT2 supports the TCA cycle in cortical neuronal cultures (Fig. 3I and J). In Gpt2-null neurons, fractional enrichment of TCA cycle intermediates from 13C-glutamine was reduced by approximately 40–50%. Fractional enrichments in labeled succinate from [U-13C]-glutamine precursor were 3.27 ± 0.74% and 1.89 ± 0.72% for the WT and Gpt2-null cortical neuronal cultures, respectively. Similarly, fractional enrichments in labeled malate from [U-13C]-glutamine precursor were 7.91 ± 1.2% and 3.93 ± 1.16% for the WT and Gpt2-null cortical neuronal cultures, respectively. These data indicate that glutamine-fueled anaplerosis in Gpt2-null neurons is significantly diminished.
Exogenous alanine is required for survival of Gpt2-null neurons in vitro and extends lifespan of Gpt2-null animals in vivo
Given the profound decrease in alanine biosynthesis, particularly in neurons, we tested the hypothesis that exogenous alanine may be essential for growth and survival of Gpt2-null cells. To test this hypothesis in neurons, we continuously monitored cell death in these cultures (Fig. 4A). Gpt2-null hippocampal cultures deprived of alanine showed significantly greater apoptotic cell death than Gpt2-null neurons with alanine or WT neurons, as measured by fluorescence of Annexin V Orange Reagent. We also measured neurite length (neurite phase confluence) in hippocampal neuronal cultures with alanine deprivation (Fig. 4B). Growth of neurites as measured by increases in neurite length using the IncuCyte S3 Live-Cell Analysis System came to a halt in Gpt2-null neuronal cultures without alanine. As expected, WT cultures grown in medium with or without alanine showed a similar growth pattern, confirming that alanine is a non-essential amino acid in WT cultures. In a complementary experiment using Opera Phenix High Content Screening Confocal Microscopy, neurons (NeuN+) and apoptotic cells (cleaved Caspase3+, Cas3+) were counted at DIV14 after alanine deprivation in hippocampal neuronal cultures (Fig. 4C). NeuN+ counts for Gpt2-null cultures deprived of alanine were greatly reduced. Gpt2-null cultures with alanine had slightly reduced NeuN+ counts compared to WT cultures, albeit without statistical significance (with alanine, WT: 470 ± 78.5 versus Gpt2-null: 331 ± 59.7, P = 0.2093). Cas3+ to NeuN+ count ratio was greater in Gpt2-null cultures deprived of alanine compared to WT cultures. Therefore, both live-cell analysis (IncuCyte) and high-content imaging (Opera Phenix) experiments showed independently that exogenous alanine needs to be supplied for the survival of Gpt2-null neurons in vitro. To test the reliance of synapse development on exogenous alanine in vitro, we stained Gpt2-null cultures for synaptic vesicle glycoprotein 2 (SV2) and imaged cells using Opera Phenix High Content Screening Confocal Microscopy (Supplementary Material, Fig. S4). Synapse counts (SV2 puncta) per nuclei were greatly reduced in Gpt2-null cultures deprived of alanine. Interestingly, Gpt2-null cultures grown with alanine also had modestly fewer SV2+ puncta compared to WT cultures, indicating loss of GPT2 leads to decreased synaptogenesis that is specifically enhanced by alanine deprivation.
Figure 4 .
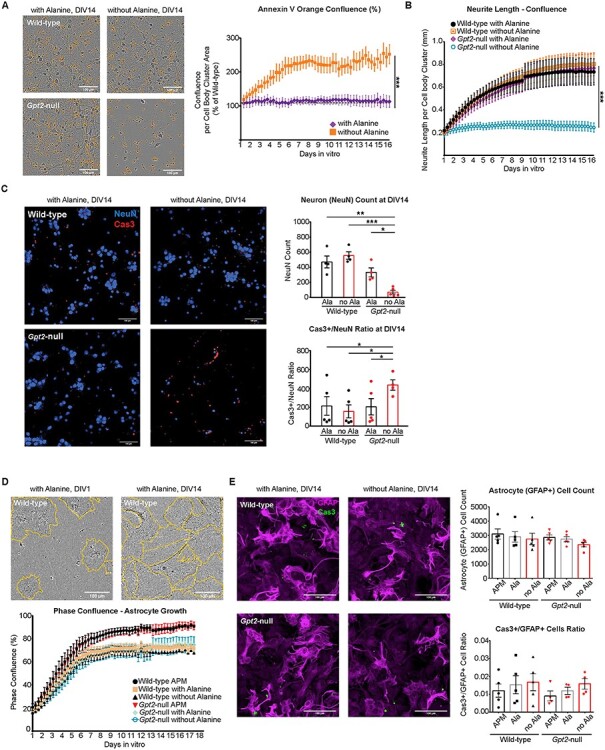
Exogenous alanine is required in Gpt2-null neurons for survival in vitro. (A) Gpt2-null culture deprived of alanine undergoes apoptosis. Representative images of Annexin V Orange Reagent staining in IncuCyte (left). Scale bar: 100 μm. The orange confluence per Cell Body Cluster Area values for Gpt2-null cultures were expressed as a percentage of their wild-type littermate cultures (right). The curves were fit by non-linear regression (one-phase exponential association) and best-fit values were compared (***P < 0.0001). n = 5 cultures. (B) Gpt2-null neurons fail to arborize without exogenous alanine. Graphs based on IncuCyte S3 NeuroTrack continuous analysis of neurite length as detected by phase confluence. The curves were fit by non-linear regression (one-phase exponential association) and best-fit values were compared (P < 0.0001). n = 5–7 cultures. (C) Neuronal cell count is decreased and Cas3+ cell count is increased in Gpt2-null cultures deprived of alanine. Images from Opera Phenix High Content Screening Confocal Microscopy (left) and quantification of NeuN+ cell counts (top) and Cas3+/NeuN+ ratio (bottom). Scale bar: 100 μm. The cells were fixed at DIV14 and the quantification represents the time point DIV14 only. *P < 0.05, **P < 0.005, ***P < 0.0005. (D) Gpt2-null astrocytes do not need exogenous alanine to survive in vitro. IncuCyte S3 phase contrast images from a wild-type astrocyte-enriched culture grown with alanine, at DIV1 (left) and DIV14 (right). Orange lines delineate the cell perimeter. Scale bar: 100 μm. Quantification of phase confluence over time (bottom). Refer to Materials and Methods for composition of Astrocyte Plating Medium (APM). Other media are similar to APM except they have dialyzed fetal bovine serum and 200 mm glutamine (instead of GlutaMAX) with or without 0.02 mm alanine. (E) Opera Phenix High Content Screening Confocal Microscopy (20× water objective) images of GFAP (magenta) and Caspase3 (Cas3, green) in wild-type and Gpt2-null astrocyte-enriched cultures and quantification of GFAP+ cell count (right, top), Cas3+/GFAP+ cell count ratio (right, bottom). Scale bar: 100 μm. GFAP+ cell count for no alanine condition, wild-type: 2750 ± 398.6 versus Gpt2-null: 2362 ± 161.4, P = 0.3936. Cas3+/GFAP+ cell count ratio for no alanine condition, wild-type: 0.0167 ± 0.0047 versus Gpt2-null: 0.0158 ± 0.003, P = 0.8855.
In contrast to Gpt2-null neurons, which required exogenous alanine, Gpt2-null astrocytes deprived of alanine grew comparably to controls in vitro (Fig. 4D). The cell growth of Gpt2-null astrocytes over time, as determined by IncuCyte Live-Cell Analysis, was not impacted by alanine deprivation. It is important to note that WT and Gpt2-null astrocytes grew much better in astrocyte-plating medium (APM), which has regular fetal bovine serum, compared to the cultures that had custom-made media with dialyzed fetal bovine serum. We repeated the alanine deprivation experiment in astrocyte cultures using Opera Phenix High Content Screening Confocal Microscopy (Fig. 4E). Astrocytes were examined 14 days after alanine deprivation. GFAP+ cell count and Cas3+ count to GFAP+ count ratio were similar between WT and Gpt2-null astrocytes. Thus, unlike neurons, Gpt2-null astrocytes were able to grow in alanine-deficient media. To address the role of GPT2 in astrocytes in vivo, we used the GFAP-Cre 77.6 line (21) to delete GPT2 specifically in astrocytes in living animals. Unlike SynI-cKO and conventional germline Gpt2-null mice, GFAP-Cre conditional Gpt2-null mice survived past P30 and into adulthood, indicating that GPT2 expression in astrocytes is dispensable for animal survival (Supplementary Material, Fig. S5). Overall, the need for GPT2 was more apparent in neurons compared to astrocytes both in vitro and in vivo, and there is a requirement for exogenous alanine in Gpt2-null neurons in vitro.
Given the observation that exogenously supplied alanine is required for Gpt2-null neurons in vitro, we set out to test the hypothesis that supplemental dietary alanine would ameliorate the phenotype seen in Gpt2-null animals in vivo (Fig. 5). We increased the alanine content from 1.19% alanine (regular alanine diet, RA) to 5% alanine (high-alanine diet, HA) by weight in the rodent diet given ad libitum. We first investigated the extent to which alanine levels were affected in the serum of Gpt2-null mice. Gpt2-null mice fed RA diet showed substantial reductions in the serum alanine concentration at P18 [WT (RA) 0.776 ± 0.006 mm versus Gpt2-null (RA) 0.652 ± 0.025 mm, P = 0.0007] (Fig. 5A). Importantly, in the Gpt2-null animals, the HA diet normalized serum alanine (Fig. 5A). Overall, there was no statistically significant difference between Gpt2-null (HA) and WT (HA) serum alanine levels, albeit with a trend toward a decrease [WT (HA): 0.775 ± 0.004 mm versus Gpt2-null (HA): 0.687 ± 0.044 mm, P = 0.0703]. Interestingly, in WT mice given HA diet [WT (HA)], alanine levels did not change compared to alanine levels in WT (RA) mice, which is suggestive of normalizing effects due to hepatic metabolism [WT (RA): 0.775 ± 0.006 mm versus WT (HA) 0.775 ± 0.004 mm, P = 0.8980]. The alanine levels in Gpt2-null brain at P18 were also normalized by the HA diet as per targeted metabolomics (Fig. 5B). Importantly, we discovered that Gpt2-null mice fed the HA diet ad libitum have increased survival past P30 (Fig. 5C). Out of a total of 38 Gpt2-null animals fed HA diet, 13 (34%) were able to survive past P30, whereas none of the Gpt2-null mice fed the RA survived (Fig. 5C). WT mice showed no negative effect of HA diet on survival, suggesting good tolerability of high levels of alanine in the diet. However, despite encouraging improvements in survival, Gpt2-null mice on HA diet failed to thrive and stagnated in weight gain (Fig. 5D). Motor defects such as wide gait and clasping reflex in the hind-limbs were present in Gpt2-null (HA) mice at P18, similar to the Gpt2-null (RA) mice (Fig. 5E and Supplementary Material, Videos S7–S10). As Gpt2-null mice aged on HA diet, their walking progressively worsened as evidenced by Open Field Tests performed at P18, P30, P60 and P90 (Fig. 5E, Supplementary Material, Videos S11–S18). At around age P90, they tended to lose the ability to stand on their paws completely and displayed crawling behavior. To determine the extent to which the altered metabolome in the neural tissue was corrected by the HA diet, we performed targeted metabolomics on acutely dissected hippocampal tissue from WT (HA) and Gpt2-null (HA) mice at P18 (Supplementary Material, Fig. S6A–D, Supplementary Material, Tables S5 and S6). The HA diet resulted in marked improvements in the metabolic profile of Gpt2-null hippocampus, particularly for GPT2 reaction metabolites, TCA cycle intermediates and glucose metabolism (Supplementary Material, Fig. S6A–D, Supplementary Material, Tables S5 and S6). In summary, the supplemental dietary alanine improved survival of Gpt2-null mice and the metabolic profile of the Gpt2-null brain but failed to correct growth and motor abnormalities.
Figure 5 .
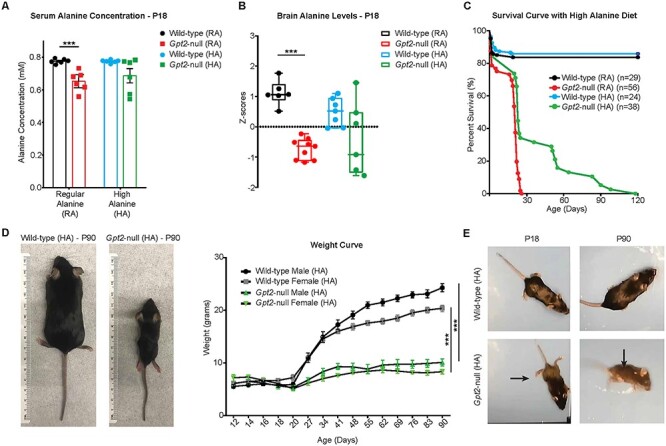
High-alanine diet improves survival and metabolomic profile in the hippocampus of Gpt2-null mice but does not alleviate body weight or motor deficits. (A) Serum alanine levels are normalized by the high-alanine (HA) diet in Gpt2-null mice at P18. Serum alanine concentrations of wild-type and Gpt2-null mice fed either RA or HA diet measured at P18. ***P (wild-type (RA) versus Gpt2-null (RA) < 0.0001); P (wild-type (HA) versus Gpt2-null (HA) = 0.07). (B) Alanine levels are normalized by the HA diet in Gpt2-null hippocampus. Z-scores of alanine levels are shown in the box-and-whisker plot. The peak intensities obtained from targeted tandem liquid chromatography–mass spectrometry (LC–MS/MS) were normalized to the sample median as in Figure 2. ***P < 0.001. (C) Gpt2-null mice on HA diet can survive up to P120. Survival curves of germline Gpt2-null mice and their wild-type littermates given RA diet (1.19% w/w) or HA diet (5% w/w). Log-rank (Mantel-Cox) test was used to determine significant differences between the curves, P (Gpt2-null (RA) versus Gpt2-null (HA)) < 0.0001, P (wild-type (HA) versus Gpt2-null (HA)) < 0.0001. (D) Gpt2-null mice that survive on HA diet do not gain body weight in a manner similar to wild-type mice. Representative images of wild-type (left) and Gpt2-null (right) mice at P90 fed HA diet. Weight curves of wild-type and Gpt2-null mice fed HA diet at ages from P12 to P90. The curves were fit to the Gompertz equation; P (wild-type male (HA) versus Gpt2-null male (HA)) < 0.0001, P (wild-type female (HA) versus Gpt2-null female (HA)) < 0.0001. n = 5–13 mice. (E) Adult Gpt2-null mice that survive on HA diet display worsening motor dysfunction. Pictures of wild-type (HA) (top) and Gpt2-null (HA) (bottom) mice at ages P18 (left) and P90 (right). Note the wide hind-limb gait (horizontal arrow) in the Gpt2-null (HA) mouse at P18 and the crawling behavior at P90 (vertical arrow). Also see Supplementary Material, Videos S11–S18.
Surviving adult Gpt2-null mice on high-alanine diet reveal worsening hypoplasia of the central nervous system and death of lower motor neurons in the spinal cord
Rescue of survival on the HA diet permitted us to examine the progression of neuropathology in surviving Gpt2-null animals. Initially at P18, we examined gross anatomy abnormalities in Gpt2-null mice fed RA diet. From the two representative WT and Gpt2-null images (Fig. 6A), the overall decreased size of the Gpt2-null central nervous system was apparent. Thicknesses of the cervical and lumbar enlargements of the spinal cord in the Gpt2-null mice (RA) were decreased as well. Also at P18, we examined the spinal cord by immunohistochemistry in Gpt2-null (RA) mice. Neuronal numbers were similar; however, motor neurons in the ventral horn, stained for choline acetyltransferase (ChAT), were notably smaller in soma size in the Gpt2-null animals in both cervical and lumbar spinal cords (Fig. 6B and C). Reductions in soma size in Gpt2-null spinal cord appeared relatively selective for ChAT+ cells, as staining for NeuN, a pan-neuronal marker, in the dorsal horn of cervical and lumbar spinal cord yielded similar densities of NeuN+ soma (Fig. 6B and C) and similar soma size across both genotypes (Supplementary Material, Fig. S7A). Calbindin+ interneuron counts in the dorsal horn were also similar between the two genotypes (Supplementary Material, Fig. S7C).
Figure 6 .
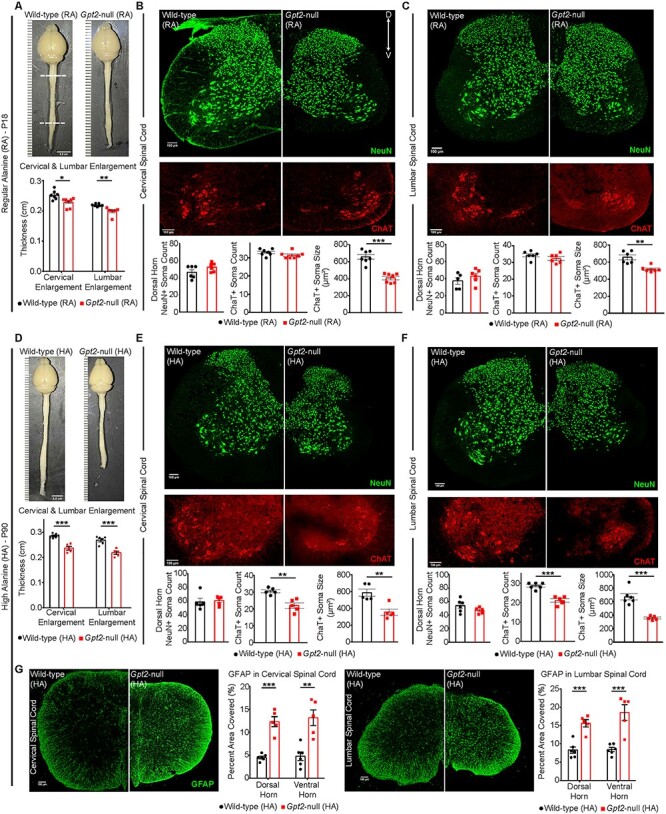
Surviving adult Gpt2-null mice fed high-alanine diet exhibit worsening hypoplasia in the central nervous system and selective death of lower motor neurons in the spinal cord. (A) Images of the gross anatomy of the central nervous system of P18 wild-type and Gpt2-null mice fed RA diet. Top and bottom dashed lines denote cervical and lumbar enlargement, respectively. Quantification of thickness is shown below the images. Scale bar: 0.5 cm. (B) Images of cervical spinal cord sections from wild-type (RA) and Gpt2-null (RA) mice at P18 stained for neurons (top, NeuN, green) and motor neurons (bottom, ChAT, red). Quantification of dorsal horn NeuN+ soma count, ChAT+ soma count and ChAT+ soma size is shown below the images. (C) Images of lumbar spinal cord sections from wild-type (RA) and Gpt2-null (RA) mice at P18 stained for neurons (top, NeuN, green) and motor neurons (bottom, ChAT, red). Quantification of dorsal horn NeuN+ soma count, ChAT+ soma count and ChAT+ soma size is shown below the images. (D) Images of the gross anatomy of the central nervous system of P90 wild-type and Gpt2-null mice fed HA diet. Cervical and lumbar enlargements were identified as in A. Quantification of thickness is shown below the images. Scale bar: 0.5 cm. (E) Images of cervical spinal cord sections from wild-type (HA) and Gpt2-null (HA) mice at P90 stained for neurons (top, NeuN, green) and motor neurons (bottom, ChAT, red). Quantification of dorsal horn NeuN+ soma count, ChAT+ soma count and ChAT+ soma size is shown below the images. (F) Images of lumbar spinal cord sections from wild-type (HA) and Gpt2-null (HA) mice at P90 stained for neurons (top, NeuN, green) and motor neurons (bottom, ChAT, red). Quantification of dorsal horn NeuN+ soma count, ChAT+ soma count and ChAT+ soma size is shown below the images. (G) Images of GFAP staining in cervical (left) and lumbar (right) spinal cord sections from wild-type (HA) and Gpt2-null (HA) mice at P90. Quantification is shown to the right of corresponding images and is represented as percent total area of the dorsal horn or ventral horn covered by GFAP staining. For B, C, E and F, dorsal horn NeuN+ soma were counted in a 100 × 100 μm2 window. ChAT staining belongs to the same section as NeuN but images of the ventral horn were cropped and magnified to better visualize motor neurons. Soma size was measured by the surface area of the cell in the maximum intensity projection image. Scale bar: 100 μm. For all figures: *0.01 < P < 0.05; **0.001 < P < 0.01; ***P < 0.001.
We subsequently investigated progressive neuropathology in surviving Gpt2-null animals on the HA diet at P90. Surviving adult Gpt2-null (HA) mice displayed progressive dysfunction in motor behavior (Fig. 5). The gross anatomy showed worsening on several measurements in the brain and spinal cord of Gpt2-null (HA) mice (Fig. 6D and Supplementary Material, Fig. S8A–G). At P90, there was pronounced difference in size of the enlargements in Gpt2-null (HA) and WT (HA) spinal cords. It is noteworthy that whereas the WT spinal cord had apparently grown from P18 to P90, the Gpt2-null mice stagnated in growth in the spinal cord.
Spinal cords from surviving Gpt2-null mice on the HA diet demonstrated reduced motor neuron count, as well as smaller soma sizes in both the cervical and lumbar spinal cord (Fig. 6E and F). This is in contrast to the spinal cords at P18, which only demonstrated reduced soma size, but not reduced soma count at this earlier time point. Loss of neurons at P90 was selective to ChAT+ motor neurons in the ventral horn, as the NeuN+ soma densities in the dorsal horn of both cervical and lumbar spinal cord were comparable (Fig. 6E and F), as was the soma size between the two genotypes (Supplementary Material, Fig. S7B). Also, Calbindin+ interneuron counts in the dorsal horn were similar between WT (HA) and Gpt2-null (HA) mice (Supplementary Material, Fig. S7D). We did not detect any microgliosis or positive Fluoro-Jade C staining in either Gpt2-null (RA) or Gpt2-null (HA) spinal cord (Supplementary Material, Fig. S9). However, in agreement with motor neuron death, in the Gpt2-null (HA) spinal cord, we observed astrogliosis with enhanced GFAP staining in the gray matter (Fig. 6G). We also examined for any pathology in the primary motor cortex, as dysfunction in upper motor neurons has been implicated in the etiology of hereditary spastic paraplegia (8). As in the lower motor neurons of the spinal cord, reduced soma size was also present in layer 5 neurons of the primary motor cortex of both Gpt2-null (RA) mice at P18 and Gpt2-null (HA) mice at P90 (Supplementary Material, Fig. S10). We did not detect any reduction in NeuN+ count, astrogliosis, microgliosis or positive Fluoro-Jade C staining in layer 5 of the primary motor cortex in either Gpt2-null (RA) mice at P18 or Gpt2-null (HA) mice at P90. Overall, these results indicate that GPT2 regulates processes involved in neuronal growth of both upper and lower motor neurons and that the ventral horn motor neurons in the spinal cord demonstrate selective vulnerability to the loss of GPT2, likely conferring progressive worsening of motor function with age in Gpt2-null animals.
Discussion
In this study, we identify metabolic mechanisms wherein the mitochondrial enzyme GPT2 governs neuronal growth. Evidence from both patients with progressive spastic paraplegia and from mouse here indicates that motor function is vulnerable to defects in GPT2-mediated metabolism. Metabolomics on developing postnatal Gpt2-null brain demonstrated an early defect in alanine synthesis and impairments in anaplerosis of the TCA cycle. Notably, through conditional deletion of GPT2 in neurons, corroborated by studies in primary cultures, our data support a prominent role for GPT2-mediated mechanisms within neurons, as opposed to in astrocytes. Therefore, these studies pinpoint fundamental metabolic processes required for neuronal growth, and that potentially underlie selective vulnerabilities in motor neuron disease.
Our experiments indicate that GPT2 is required particularly for neurons. While we do not know the exact cause of animal death, the neuron-specific deletion of GPT2 in vivo was sufficient to cause motor abnormalities and premature death similar to that seen in the germline Gpt2-null mice. This phenotype was not observed after astrocyte-specific deletion of GPT2. In further support of a role for GPT2 in neurons, our data demonstrated that GPT2 is enriched in neuronal cultures compared to GPT1, which is more abundant in astrocyte cultures. At the mRNA level, Gpt2 is more abundant than Gpt1 in mouse neurons, whereas in astrocytes, expression levels of Gpt1 and Gpt2 are comparable (22). In contrast to the mouse brain, GPT1 mRNA is virtually absent in the human cortex (23,24) wherein there is an abundance of GPT2 mRNA.
During the early postnatal period in which GPT2 expression is upregulated (7), dysregulation of alanine occurs earliest (at P0) shortly preceding reductions in TCA cycle intermediates (at P7). There is also reduced conversion of glutamine into TCA cycle intermediates via pyruvate transamination in Gpt2-null neuronal cultures. In the brain, studies have focused on pyruvate carboxylase as the major anaplerotic enzyme, particularly in astrocytes (25,26). Human patients with deficiencies in mitochondrial pyruvate carboxylase and pyruvate dehydrogenase, enzymes that support the TCA cycle directly, have hyperalaninemia, most likely due to channeling of pyruvate with glutamate to alanine and α-ketoglutarate via GPT2 (27,28). Our study pinpoints the non-redundant function of GPT2 for neuronal TCA cycle maintenance and alanine synthesis.
Subsequent to reductions in TCA cycle intermediates in Gpt2-null brain, we observed prominent increases in almost all glycolytic intermediates, although pyruvate was decreased. Reduced pyruvate may cause decreased substrate inhibition of glycolytic enzymes. Flux analysis in vivo may also address the possibility of pyruvate being consumed more by pyruvate carboxylase to make oxaloacetate, which is one of the few TCA cycle intermediates that did not change in Gpt2-null brain. Surprisingly, α-ketoglutarate too is unchanged or increased in Gpt2-null brain. Metabolites including the TCA cycle intermediates can be efficiently managed by complexes of multiple enzymes (29). To date, the only enzyme that GPT2 is known to form complexes with is glutamate dehydrogenase (30). Glutamate dehydrogenase is another major anaplerotic enzyme in the brain and may be acting in part to upregulate α-ketoglutarate levels in neurons (31).
Following defects in TCA cycle and alanine levels, we saw prominent increases in essential amino acids in the Gpt2-null brain. GPT2 links alanine synthesis and the TCA cycle, thereby supporting both energetics and biosynthesis of macromolecules, particularly proteins. Of note, alanine is the second most frequent amino acid in the primary structure of proteins overall across the domains of Bacteria and Eukarya (32). More studies in vivo are warranted to determine the possibilities of changes in specific transporter levels or increased protein breakdown in a compensatory attempt to support both alanine supply and also the TCA cycle. By removing alanine from medium at DIV1, we observed decline of neuronal arborization, as well as cell death in neurons but not in astrocytes. This indicates that alanine has become an essential amino acid and must be supplied exogenously to Gpt2-null neurons, whereas GPT2 is not required for astrocytes in vitro even without exogenous alanine.
Improvement of animal survival in Gpt2-null mice with HA diet re-asserts the conversion of alanine from being a non-essential amino acid to an essential amino acid and allowed us to observe progression of the motor dysfunction in Gpt2-null mice as they age. The phenotype of premature death in Gpt2-null mice was not completely abolished with HA diet. The variability of the rescue is most likely due to the ad libitum nature of the diet regimen and the Gpt2-null pup may survive better if alanine is continuously force-fed. Surviving Gpt2-null animals on HA diet almost completely lost their ability to walk at around P60 to P90. Neuropathology demonstrated reduced number and soma size of lower motor neurons in the spinal cord, but not of dorsal horn neurons; therefore, we conclude that Gpt2-null animals demonstrate selective loss of lower motor neurons. Smaller soma sizes and loss of spinal cord motor neurons have been observed in other neurological diseases, including amyotrophic lateral sclerosis (ALS) (33). Genetic mutations in SPG11, or spatacsin, a spastic paraplegia gene, also cause spinal cord motor neuron death (34).
Hereditary spastic paraplegia has been attributed to upper motor neuron degeneration due to requirements for long-range axonal projections (8). Although we did not observe any degeneration or cell loss in the primary motor cortex of Gpt2-null mice, the soma sizes of the layer 5 neurons were reduced, suggesting that GPT2 acts on similar mechanisms of neuronal growth in both upper and lower motor neurons. Importantly, a majority of mouse models of spastic paraplegia show motor disability without death of upper motor neurons (8,35). Whether the loss of lower motor neurons in Gpt2-null mice occurs cell autonomously or due to diminished connectivity from other circuits remains to be explored. Interestingly, one recent case report of a patient with GPT2 Deficiency has demonstrated motor neuropathy consistent with our findings of loss of lower motor neurons in the mouse model (36).
Our data suggest that dietary modifications may involve alanine as a potential therapeutic supplement for human patients with GPT2 Deficiency. Supplemental alanine has been shown to be well tolerated in humans (37–39). To date, the only biochemical finding in human patients with GPT2 Deficiency is decreased alanine levels in the plasma (40), a result which is supported by our data here in the Gpt2-null mouse. In our experiments, high alanine supplementation rescued survival and improved metabolic derangements in Gpt2-null brain; however, this dietary supplementation did not prevent progression of motor disability or improve weight gain. Alternative procedures to enhance alanine delivery may be warranted, or alanine supplementation in combination with additional dietary modifications may be needed.
In summary, these studies of GPT2 Deficiency have identified broadly significant metabolic mechanisms critical for neuronal growth and for motor circuitry, which contain some of the largest and longest projecting neurons in the nervous system. We present evidence that GPT2-mediated mechanisms are essential for neuronal alanine synthesis and anaplerotic support of the TCA cycle. We find that the loss of GPT2 in vivo causes selective vulnerability in lower motor neurons. Finally, our data permit evaluation of high alanine supplementation as a potential treatment for GPT2 Deficiency that may be rapidly implemented and has a favorable risk benefit profile in children.
Materials and Methods
Ethics statement
All experiments involving mice were done in accordance with the National Institutes of Health Guide for the Care and Use of Laboratory Animals (41) and approved by the Brown University Institutional Animal Care and Use Committee.
Animals
Gpt2-null animals were obtained as described previously [Knockout Mouse Project at University of California, Davis (MMRRC_047980-UCD)] (7). For generation of the conditional-null ready mouse, the sequence flanked by two FRT sites was excised by mating the Gpt2-heterozygous mouse with a mouse containing the flippase transgene (IMSR_JAX:003946). To obtain a pan-neuronal conditional-null mouse, the animal with Gpt2-flox allele was mated with a mouse having the Cre recombinase transgene driven by the rat Synapsin-I promoter (IMSR_JAX:003966). The excision of exon 4 by Cre recombinase was tested by PCR with the following primers: Exc-F (5′-CTAACTTGTCCTGCATGGTGTCAGC-3′) and Exc-R (5′-GGCTTTCTACCAGGAGGAACAGAGG-3′); the primers detect the floxed allele (1479 bp), the WT allele (1347 bp) and the excised allele (687 bp). To obtain an astrocyte-specific conditional-null mouse, the animal with Gpt2-flox allele was mated with the GFAP-Cre line 77.6 (IMSR_JAX:024098). For both Synapsin-I-Cre and GFAP-Cre lines, only females possessing the Cre transgene were used to mate with male Gpt2 flox/flox due to germline recombination observed in males. Every animal was checked for germline recombination by PCR genotyping in the tail. The Synapsin-I-Cre line was confirmed using a Cre reporter line, Ai14-R26-tdTomato (IMSR_JAX:007914). The background of all mice was C57BL6/J (IMSR_JAX:000664); the mice with a different strain of origin were backcrossed to C57BL6/J at least for six generations.
The mice were maintained under a 12-h light/dark cycle (lights on at 7 a.m./off at 7 p.m.) throughout the year. Feed and water were given ad libitum. Formulations for the regular alanine (RA) diet (1.19% by weight, LabDiet) and high-alanine (HA) diet (5% by weight, Envigo) can be found in Supplementary Material Table S7. The breeding pairs were set up when the Gpt2-heterozygous mice were two months old. As soon as they were set up for breeding, their diet was switched from RA diet to the HA diet and they were fed with the HA diet for the entire duration of collecting samples from their progeny.
Behavioral tests
Open field test
The mice were placed at the center of an empty solid mouse cage (31 cm × 31 cm) and the movement was recorded from an overhead camera.
Wire hang test
The mouse was allowed to grab onto a cage topper. The cage topper was inverted approximately 30 cm above the floor of the cage. The time elapsed before the mouse fell off into the cage was recorded. The inter-trial interval was 1 min with five trials in total. The trial was terminated if the hanging time exceeded 2 min.
Hind-limb clasping reflex
The mouse was suspended from the tail for 10 s and the clasping reflex was noted. Three trials were performed.
DigiGait
DigiGait (MouseSpecifics), a ventral plane videography high-throughput instrument with a treadmill, was used for capturing a variety of motor deficits. The lane length was adjusted to an appropriate length depending on the age (P18) and size of the animal to be tested (approximately 8 cm). The animal was placed on the DigiGait treadmill and allowed to walk or run freely as the belt moved at 8 cm/s. Five seconds of video was captured and analyzed by the DigiGait Analyzer software.
Metabolomics and isotope tracing
Metabolomics
Craniotomies on pups after decapitation or cervical dislocation at designated postnatal ages were performed. Hippocampi were dissected immediately on ice. Wet weight of the tissue was measured, and the tissue was flash frozen in liquid nitrogen to quench metabolism. The tissue was processed as previously described with minor modifications (42). The tissue was immersed in 500 μl of 80% (vol/vol) high-performance liquid chromatography (HPLC)-grade methanol (cooled to −80°C). The tissue was ground with a Kimble pestle, vortexed for 1 min and incubated at −80°C for 4 h. To pellet debris, the sample was centrifuged at 14 000 × g for 10 min at 4°C. While the supernatant was kept at −80°C, 400 μl of 80% (vol/vol) methanol (cooled to −80°C) was added to the pellet, which was then vortexed for 1 min, incubated at −80°C for 30 min and then centrifuged at 14 000 × g for 10 min at 4°C. The supernatants were combined and re-spun at 14 000 × g for 10 min at 4°C. The supernatants were divided equally in 1.5-ml Eppendorf tubes and concentrated using a Savant SpeedVac vacuum concentrator (Thermo Scientific) at ambient temperature. Tandem mass spectrometry (MS) was done at Beth Israel Deaconess Medical Center Mass Spectrometry Facility. The samples were re-suspended in liquid chromatography (LC)/mass spectrometry (MS)-grade water and run in tandem LC–MS/MS. Samples were injected into hydrophilic interaction liquid chromatography (HILIC) at high pH using HPLC coupled to a 5500 QTRAP mass spectrometer (AB/SCIEX). Selected Reaction Monitoring (SRM) mode for 300 transitions with positive/negative polarity switching fragmented precursor ions and selected for product ions. Peak areas for each detected metabolite were integrated using MultiQuant software (AB/SCIEX). The statistical analyses and data visualization were done using MetaboAnalyst 4.0 (43) (RRID:SCR_015539). If half of data for a metabolite was not available, then that metabolite was omitted from analysis. All data were normalized by median normalization and auto-scaled (mean-centered and divided by standard deviation of each variable). Unpaired Student’s t-test assuming equal variance was used to generate a P-value.
Isotope tracing
The cortical neuronal cultures at 14 days in vitro (DIV14) were incubated with Tyrode medium (140 mm NaCl, 4 mm KCl, 2 mm CaCl2, 2 mm MgCl2, 10 mm HEPES) with either 0.5 mm [α-15N]-glutamine (Sigma-Aldrich, 486 809), 0.5 mm [U-13C]-glutamine (Sigma-Aldrich, 605 166) or 4 mm [U-13C]-glucose (Cambridge Isotope Laboratories, CLM-1396-PK) for 24 h. LC–MS analysis for soluble metabolites was achieved on the Q Exactive PLUS Hybrid Quadrupole-Orbitrap Mass Spectrometer (Thermo Scientific) coupled with hydrophilic interaction chromatography (HILIC). To perform the LC separation of cultured cell samples, an XBridge BEH Amide column (150 mm × 2.1 mm, 2.5 μm particle size, Waters, Milford, MA) was used with a gradient of solvent A (95%:5% H2O: acetonitrile with 20 mm ammonium acetate, 20 mm ammonium hydroxide, pH 9.4), and solvent B (100% acetonitrile). The gradient was 0 min, 85% B; 2 min, 85% B; 3 min, 80% B; 5 min, 80% B; 6 min, 75% B; 7 min, 75% B; 8 min, 70% B; 9 min, 70% B; 10 min, 50% B; 12 min, 50% B; 13 min, 25% B; 16 min, 25% B; 18 min, 0% B; 23 min, 0% B; 24 min, 85% B; 30 min, 85% B. The flow rate was 150 μl/min; the injection volume was 10 μl; and the column temperature was 25°C. MS full scans were in negative ion mode with a resolution of 140 000 at m/z 200 and scan range of 75–1000 m/z. The automatic gain control (AGC) target was 1 × 10⁶.
Cell culture
Mouse primary hippocampal neuron culture
Hippocampal neurons were cultured as described previously (44). Hippocampi from pups aged P0-P1 were dissected in Hank’s Balanced Salt Solution (HBSS) (Gibco, 14 170–112) and placed in 500 μl of 20 U/ml papain (Worthington, LK003176) in Earle’s Balanced Salt Solution (EBSS) (Worthington, LK003188). The tube with hippocampi/papain was incubated at 37°C for 15 min. The tissue was triturated with a 1-ml pipette tip for 12 strokes. The tissue was further incubated at 37°C for 15 min and triturated. The remaining bits of tissue were allowed to settle and the overlying solution with dissociated cells was spun in a separate tube at 300 g for 5 min at room temperature. The cell pellet was dissolved gently in Inhibitor Solution (540 μl EBSS, 60 μl Ovomucoid Protease Inhibitor (Worthington Biochemical, LK003182), 30 μl DNase (Worthington Biochemical, LK003170) per hippocampi) and filtered through a 70-μm nylon mesh (Fisher Scientific, 22 363 548). The filtered cell suspension was layered on top of 1 ml Ovomucoid Protease Inhibitor and spun at 70 g for 10 min at room temperature. The supernatant was discarded, and the cell pellet was re-suspended in Neurobasal A+ (NeuroBasal-A (Thermo Fisher Scientific, 10 888 022), 1× B27 Supplement (Thermo Fisher Scientific, 17 504 044), 2 mm GlutaMAX (Thermo Fisher Scientific, 35 050 061)). The full media was changed the next day followed by half media changes every 3 days.
Mouse primary astrocyte-enriched cultures
The culturing protocol was adapted from (45,46). Cortices from pups aged P0-P1 were dissected in HBSS, diced into 6 pieces and transferred to a 15-ml conical tube. The tissue was incubated in 0.25% Trypsin–EDTA in HBSS at 37°C for 30 min. The solution was removed carefully to leave the tissue pieces at the bottom, and 6 ml of Astrocyte Plating Medium (APM) (DMEM (Thermo Fisher Scientific, 10 569–010), 10% fetal bovine serum (Invitrogen, 16 000 044), 1% Penicillin/Streptomycin (Invitrogen, 15 140 122)) was added. The tissue was triturated for 15 strokes with a 10-ml pipette and then 5 strokes more with a 1-ml pipette. The cell suspension was filtered through 70-μm nylon mesh and seeded in a 25-cm2 flask (Corning, 3289). After 2 days, the full medium was changed, and then half medium was changed every 3 days. When the astrocyte layer was confluent (~7 days), the flask was shaken at 225 rpm overnight at 37°C. The full medium was changed to APM with 20 μm cytosine arabinoside (Ara-C) to remove any other contaminating proliferative cell types. After two days, the full medium was changed to APM. The Ara-C treatment was repeated the next day. Mild trypsin (0.0675%) treatment was used to lift off the astrocyte layer as a whole and leave the remaining microglia at the bottom of the flask. The layer was incubated in 1 ml of Accutase (StemCellTechnologies, 07920) in a fresh tube at 37°C for 10 min. The layer was dissociated with a 1-ml pipette tip with five strokes. Two ml APM was added; the solution was mixed and filtered through a 70-μm nylon mesh. Cells were seeded to plates/dishes coated with 5 μg/ml laminin.
Alanine deprivation in vitro and custom-made cell culture medium
For neuronal cultures, the Neurobasal A+ composition can be found in Supplementary Material Table S7. The cells were incubated with custom-made Neurobasal A+ without alanine, along with 1× B27, 1% Penicillin/Streptomycin and 2 mm glutamine. Neurons were seeded in a 96-well plate (Corning 3596, coated with 100 μg/ml poly d-lysine) at a density of 25 000 cells per well. For alanine deprivation in astrocytes, instead of regular fetal bovine serum, dialyzed fetal bovine serum (Invitrogen, 26 400 044) was used to avoid extra alanine coming from the fetal bovine serum. The rest of the medium composition was the same as APM. Astrocytes were seeded in a 96-well plate (Corning, 3596) at a density of 2000 cells per well.
Continuous analysis of cellular growth and death in vitro
Mouse primary hippocampal neurons were seeded in a 96-well plate (Corning, 3596, coated with 100 μg/ml poly d-lysine) at a density of 25 000 cells per well. The plate was imaged continuously using an IncuCyte S3 Live-Cell Analysis System (Essen BioScience) with the 10× objective. The imaging was interrupted only at media changes every 3 days. The neurites were identified with the NeuroTrack module using phase contrast images. The neurites and cell bodies were segmented in the Brightness mode with an adjustment of 0.3. Any cell body cluster smaller than 100 μm2 was excluded. Neurite sensitivity and width were set at 0.75 and 1 μm, respectively. Every data point for Neurite length and Neurite Branch Point was normalized to the cell body cluster of the first time point in order to account for cell density variability. IncuCyte Annexin V Orange Reagent (Essen BioScience, 4759), a specific phosphatidylserine (PS) cyanine dye, was used to detect apoptotic cells over time. The orange fluorescence confluence was normalized to the cell body cluster area at each time point and expressed as a percentage of its paired WT culture. The orange fluorescence was segmented in adaptive mode with a threshold adjustment of 2. Edge Sensitivity was set at −15. Any orange dot with eccentricity greater than 0.95 was excluded or with a mean intensity lower than 4 was excluded. The acquisition time was 400 ms.
Astrocyte-enriched cultures were seeded in a 96-well plate (Corning, 3596) at a density of 2000 cells per well. The plate was imaged continuously using an IncuCyte S3 Live-Cell Analysis System (Essen BioScience) with the 10× objective. The imaging was interrupted only at media changes every 3 days. The phase confluence was determined using the BasicAnalyzer module with segmentation adjustment set at 2 and area filter at minimum 1 μm2.
Immunofluorescence
Cultured cells
The cells were washed with 1× phosphate-buffered saline (PBS) (Fisher Scientific, BP3994) and fixed with 4% paraformaldehyde (PFA) at room temperature for 10 min. The following steps were performed in order: 3 × 5-min 1× PBS washes, 10-min permeabilization in PBS with 0.25% Triton X-100 (T8787, Sigma), 1-h blocking with 10% normal goat serum (NGS) (Jackson ImmunoResearch, 005-000-121) in PBS with 0.1% Triton X-100 (PBST), overnight incubation at 4°C with primary antibody in 2% NGS-PBST, 3 washes with PBST, 1-h incubation with secondary antibody in 2% NGS-PBST, 3 washes with PBST and counterstaining with 300 nM DAPI (Invitrogen, D1306). To visualize mitochondria in vitro, the cells were incubated with 100 nM MitoTracker Red CMXRos (Invitrogen, M7512) for 25 min at 37°C, 5% CO2, prior to performing the immunofluorescence protocol. Coverslips were mounted onto slides with Fluoromount G (SouthernBiotech, 0100-01).
Tissue
The tissues from mice were dissected out after transcardial perfusion with 1× PBS and then with 4% PFA. The tissues were cryoprotected by serially incubating in sucrose solutions of 10%, 20% and 30% overnight at 4°C. The final solution was then changed to half by volume sucrose/OCT (Optimal Cutting Temperature, Fisher Scientific, 23-730-571) and gently shaken for 1 h at 4°C. The tissues were frozen in dry ice/methanol bath and stored at −80°C until the day of sectioning at the cryostat. The sections were cut at 30-μm thickness. The immunofluorescence protocol was as follows, in order: 3-min fixing with 4% PFA, 3 × 5-min 1× PBS washes, 2-h blocking in NGS or normal donkey serum (NDS, Jackson ImmunoResearch, 017-000-121) with 1% (w/v) bovine serum albumin (Fisher Scientific, BP1600) and 0.4% Triton X-100 (Sigma-Aldrich, T8787) (Note: if a mouse-raised antibody was used, a 1-h incubation with 20 μg/ml AffiniPure Fab Fragment Goat Anti-Mouse IgG (H + L) (AB_2338476) or AffiniPure Fab Fragment Donkey Anti-Mouse IgG (H + L) (AB_2307338) in blocking solution was performed), overnight incubation at 4°C with primary antibody in blocking solution, 2 × 4-min washes with blocking solution, 3 × 4-min washes with 0.4% Triton X-100 in PBS, 2-h incubation with secondary antibody in blocking solution, 2 × 4-min washes with blocking solution, 3 × 4-min washes with 0.4% Triton X-100 in PBS, 5-min incubation in DAPI (Invitrogen, D1306) and 3 × 5-min washes with PBS. Coverslips were then mounted onto slides with Fluoromount G (SouthernBiotech, 0100-01). The list of antibodies can be found in the Key Resources Table.
Confocal microscopy
Imaging and quantification of cell death, cell count, synapse count and arborization were done using an Opera Phenix High Content Screening System and Harmony software (PerkinElmer, RRID:SCR_018809). Hippocampal neuronal cultures, astrocyte-enriched cultures or co-cultures were seeded on an Opera Phenix Ultra CellCarrier 96-well plate (PerkinElmer, 6 055 302), and at indicated times, different media conditions were tested. Immunofluorescence as described above was done at DIV14 for all plates. The wells were filled with 1× PBS and imaged immediately after. For confocal microscopy on tissues, Olympus FV3000 confocal laser scanning microscope and FluoView software were used (RRID:SCR_017015). Images were processed and analyzed with ImageJ (RRID:SCR_003070).
Fluoro-Jade C staining
The tissue cryostat sections were mounted on Superfrost Plus microscope slides (Fisher Scientific, 22-230-892) and dried at 50°C for 30 min. The slides were immersed in the following solutions at room temperature in order: 0.2% NaOH in 80% ethanol for 5 min, 70% ethanol for 2 min, distilled water for 2 min, 0.06% potassium permanganate for 10 min, distilled water for 2 min, 0.0001% Fluoro-Jade C (Sigma-Aldrich, AG325) in 0.1% acetic acid for 10 min and 3 times distilled water for 1 min. The slides were dried at 50°C for 10 min, immersed in xylene for 1 min and coverslipped with DPX (Millipore Sigma 06522).
Subcellular fractionation of mouse brain
The protocol was adapted from (47). The brain was immediately removed after cervical dislocation and rinsed in ice-cold 1× brain homogenization buffer (0.320 M sucrose, 1 mm EDTA, 5 mm Tris base, pH 7.4). After decanting, fresh 10 ml/g 1× brain homogenization buffer was added, and the brain was cut into small chunks with surgical scissors. A Kimble pestle was used to homogenize the tissue with 12 strokes each lasting 4 s. The tube was spun at 1300 × g for 3 min at 4°C. The first supernatant was put aside on ice and the pellet was re-suspended in half starting volume with 1× brain homogenization buffer. The pellet was homogenized with a Kimble pestle with eight strokes each lasting 4 s. The tubes were spun at 1300 × g for 3 min at 4°C. The second supernatant was combined with the first and the sample was spun at 10 000 × g for 10 min at 4°C with a Sorvall RC6Plus centrifuge using the SS34 rotor. The pellet was re-suspended in 10 ml/g original tissue of 15% Percoll (Percoll, Cytiva 17 089 102 prepared in 1× brain homogenization buffer). The suspension was carefully layered onto a Percoll gradient (23–40%) and the tube was spun at 22 000 × g for 10 min at 4°C. The bottom layer was considered the mitochondrial fraction. After carefully removing the upper layers, the mitochondria were aspirated and re-spun with 4 volumes of 1× brain homogenization buffer, at 11 600 rpm for 10 min at 4°C. The supernatant was removed, and 4 volumes of Tyrode-like buffer (118 mm NaCl, 5 mm KCl, 1 mm MgCl2, 1.2 mm CaCl2, 0.1 mm Na2HPO4.H2O, 20 mm HEPES, 10 mm glucose, pH 7.4) was added. The tube was spun at 18 000 × g for 10 min at 4°C. After carefully removing the supernatant, the mitochondria were re-suspended in 0.5 ml/g (of original tissue) fatty-acid free bovine serum albumin (10 mg/ml in 1× brain homogenization buffer). The final volume was brought to 3 ml/g (of original tissue) and tube was spun at 6900 × g for 10 min at 4°C with a tabletop centrifuge. The final pellet was re-suspended in the appropriate buffer for the subsequent assay.
Western blotting
Cells were homogenized in NP40 Cell Lysis Buffer (Invitrogen, FNN0021), 1× PhosStop (Roche, 04906837001), 1× Protease inhibitor Cocktail (PIC, Roche 05892970001) and 0.1 mm PMSF (Sigma-Aldrich, 93 482). Tissues were homogenized in RIPA buffer (50 mm Tris, 0.15 M NaCl, 1 mm EDTA, 1% Triton X-100, 0.5 g sodium deoxycholate, 0.1% SDS) with 1× PhosStop and 1× PIC. Twenty-μg protein samples were incubated in NuPage Sample buffer (Invitrogen, NP0007) and NuPage reducing agent (Invitrogen, NP0004) at 70°C for 10 min and immediately placed on ice. The samples were run in NuPage 4–12% Bis-Tris gel (Invitrogen, NP0321) at 175 V until the dye front was at the end of the gel. The gel was transferred to a nitrocellulose membrane (Invitrogen, LC2000) in NuPage Transfer Buffer with 20% methanol at 30 V for 1 h. The blot was blocked with Li-Cor Blocking Buffer (Li-Cor, 927–50 000) for 30 min and then permeabilized for 5 min in TBST (Fisher Scientific, BP2411) with 0.05% Tween20 (Sigma-Aldrich, P7949). The blot was incubated in primary antibodies at 4°C overnight. The blot was washed 3 × 5 min with TBST, incubated with secondary antibodies for 1 h, washed with TBST and finally placed in TBS. The blot was imaged using the Li-Cor Odyssey CLx Imaging System (resolution: 84 μm, background subtraction: median) and analyzed using Image Studio Lite software (RRID:SCR_013715). Protein amount in each sample was determined using the bicinchoninic acid (BCA) assay (Thermo Scientific Pierce, PI23227).
GPT enzyme activity assay
GPT activity assay was performed using the Alanine Aminotransferase (ALT) Assay Kit (Sigma-Aldrich, MAK052) according to the manufacturer’s manual. Five-μg protein sample of cytosolic or mitochondrial fractions were used. Protein amount in each sample was determined using the BCA assay (Thermo Scientific Pierce, PI23227). BioTek Cytation5 plate reader was used to detect fluorescence; Gen5 software was used to analyze the data (RRID:SCR_017317).
Serum alanine concentration
Blood samples were collected from mice by cardiac puncture, clotted in SST-Mini Gold Top tubes for 15 min, and spun at 2500 rpm with a tabletop minicentrifuge for 10 min. The serum samples were deproteinized with a 10-kDa molecular weight cutoff spin filter (Corning, 431 481). Alanine concentration was determined using the Alanine Assay Kit according to the manufacturer’s manual (Sigma-Aldrich, MAK001). BioTek Cytation5 plate reader was used to detect fluorescence; Gen5 software was used to analyze the data (RRID:SCR_017317).
In silico analysis of Gpt1 and Gpt2 gene expression
Gene expression profiles of the mouse hippocampus were extracted from DropViz (www.dropviz.org) (20). Data were visualized using JMP Pro 14 (RRID:SCR_014242).
Statistical analysis
All data presented in the figures and the Results section are presented as average ± standard error of the mean, unless otherwise noted. The statistical test for comparisons of two groups was unpaired two-tailed Student t-test unless otherwise noted or when the data are presented as percentage of the WT average value, in which case one-sample t-test was performed with a hypothetical value of 100. All statistical analyses were compiled using GraphPad Prism software (RRID:SCR_002798). Mixed model analysis was done using JMP Pro 14 (RRID:SCR_014242).
Supplementary Material
Acknowledgements
The authors wish to thank John M. Asara at the Beth Israel Deaconess Medical Center Mass Spectrometry, Proteomics and Metabolomics Core.
Conflict of Interest statement. The authors declare no competing interests.
Contributor Information
Ozan Baytas, Department of Molecular Biology, Cell Biology and Biochemistry, Brown University, Providence, RI 02912, USA; Center for Translational Neuroscience, Carney Institute for Brain Science and Brown Institute for Translational Science, Brown University, Providence, RI 02912, USA; Neuroscience Graduate Program, Brown University, Providence, RI 02912, USA.
Shawn M Davidson, Lewis-Sigler Institute for Integrative Genomics, Princeton University, Princeton, NJ 08540, USA.
Ralph J DeBerardinis, Department of Pediatrics, Children's Medical Center Research Institute, University of Texas Southwestern Medical Center, Dallas, TX 75390, USA; Howard Hughes Medical Institute, UT Southwestern Medical Center, Dallas, TX 75390, USA.
Eric M Morrow, Department of Molecular Biology, Cell Biology and Biochemistry, Brown University, Providence, RI 02912, USA; Center for Translational Neuroscience, Carney Institute for Brain Science and Brown Institute for Translational Science, Brown University, Providence, RI 02912, USA.
Funding
Brain & Behavior Research Foundation NARSAD Independent Investigator (25701, to E.M.M.); a Dr Ralph and Marian Falk Medical Research Trust Catalyst Award (to E.M.M.); a Brown University Research Seed Award (to E.M.M.); National Institute for Neurological Disorders and Stroke (NINDS) (R01NS113141 to E.M.M); National Cancer Institute (R35CA22044901 to R.J.D.); the Carney Institute for Brain Science and Suna Kıraç Fellowship Graduate Award in Brain Science (to O.B.); the Hassenfeld Child Health Innovation Institute at Brown University; The Opera Phenix High Content Screening System in the Center to Advance Predictive Biology at Brown University is supported by National Institutes of Health/National Institute of Environmental Health Sciences (U01 ES028184; National Science Foundation EPSCoR Award (1655221); a generous gift by Donna McGraw Weiss (1989) and Jason Weiss; the Howard Hughes Medical Institute Investigator Program (to R.J.D.).
Author contributions
Conceptualization O.B. and E.M.M.; O.B. conducted all experiments; S.M.D. contributed to studies involving mass spectrometry for isotope tracing; Data Curation and Visualization O.B.; Experimental Design and Data Analysis O.B., S.M.D., R.J.D. and E.M.M.; Formal Analysis and Writing—Original Draft, O.B. and E.M.M.; Writing—Review & Editing, O.B., S.M.D. R.J.D. and E.M.M; Supervision, Project Administration, and Funding Acquisition, E.M.M.
References
- 1. Dekaban, A.S. (1978) Changes in brain weights during the span of human life: relation of brain weights to body heights and body weights. Ann. Neurol., 4, 345–356. [DOI] [PubMed] [Google Scholar]
- 2. Holland, D., Chang, L., Ernst, T.M., Curran, M., Buchthal, S.D., Alicata, D., Skranes, J., Johansen, H., Hernandez, A., Yamakawa, R.et al. (2014) Structural growth trajectories and rates of change in the first 3 months of infant brain development. JAMA Neurol., 71, 1266–1274. [DOI] [PMC free article] [PubMed] [Google Scholar]
- 3. Iwasaki, N., Hamano, K., Okada, Y., Horigome, Y., Nakayama, J., Takeya, T., Takita, H. and Nose, T. (1997) Volumetric quantification of brain development using MRI. Neuroradiology, 39, 841–846. [DOI] [PubMed] [Google Scholar]
- 4. van Dyck, L.I. and Morrow, E.M. (2017) Genetic control of postnatal human brain growth. Curr. Opin. Neurol., 30, 114–124. [DOI] [PMC free article] [PubMed] [Google Scholar]
- 5. Ashwell, K.W.S. (2009) Development of the spinal cord. The Spinal Cord, 8–16. [Google Scholar]
- 6. van Karnebeek, C.D. and Stockler, S. (2012) Treatable inborn errors of metabolism causing intellectual disability: a systematic literature review. Mol. Genet. Metab., 105, 368–381. [DOI] [PubMed] [Google Scholar]
- 7. Ouyang, Q., Nakayama, T., Baytas, O., Davidson, S.M., Yang, C., Schmidt, M., Lizarraga, S.B., Mishra, S., Ei-Quessny, M., Niaz, S.et al. (2016) Mutations in mitochondrial enzyme GPT2 cause metabolic dysfunction and neurological disease with developmental and progressive features. Proc. Natl. Acad. Sci. USA., 113, E5598–E5607. [DOI] [PMC free article] [PubMed] [Google Scholar]
- 8. Blackstone, C. (2018) Hereditary spastic paraplegia. Handb. Clin. Neurol., 148, 633–652. [DOI] [PubMed] [Google Scholar]
- 9. Krebs, H.A. (1953) Equilibria in transamination systems. Biochem. J., 54, 82–86. [DOI] [PMC free article] [PubMed] [Google Scholar]
- 10. Kim, M., Gwak, J., Hwang, S., Yang, S. and Jeong, S.M. (2019) Mitochondrial GPT2 plays a pivotal role in metabolic adaptation to the perturbation of mitochondrial glutamine metabolism. Oncogene, 38, 4729–4738. [DOI] [PubMed] [Google Scholar]
- 11. DeBerardinis, R.J., Lum, J.J., Hatzivassiliou, G. and Thompson, C.B. (2008) The biology of cancer: metabolic reprogramming fuels cell growth and proliferation. Cell Metab., 7, 11–20. [DOI] [PubMed] [Google Scholar]
- 12. Tan, H.W.S., Sim, A.Y.L. and Long, Y.C. (2017) Glutamine metabolism regulates autophagy-dependent mTORC1 reactivation during amino acid starvation. Nat. Commun., 8, 338. [DOI] [PMC free article] [PubMed] [Google Scholar]
- 13. Caiola, E., Colombo, M., Sestito, G., Lupi, M., Marabese, M., Pastorelli, R., Broggini, M. and Brunelli, L. (2020) Glutaminase inhibition on NSCLC depends on extracellular alanine exploitation. Cell, 9. [DOI] [PMC free article] [PubMed] [Google Scholar]
- 14. Hao, Y., Samuels, Y., Li, Q., Krokowski, D., Guan, B.J., Wang, C., Jin, Z., Dong, B., Cao, B., Feng, X.et al. (2016) Oncogenic PIK3CA mutations reprogram glutamine metabolism in colorectal cancer. Nat. Commun., 7, 11971. [DOI] [PMC free article] [PubMed] [Google Scholar]
- 15. Owen, O.E., Kalhan, S.C. and Hanson, R.W. (2002) The key role of anaplerosis and cataplerosis for citric acid cycle function. J. Biol. Chem., 277, 30409–30412. [DOI] [PubMed] [Google Scholar]
- 16. Zhu, Y., Romero, M.I., Ghosh, P., Ye, Z., Charnay, P., Rushing, E.J., Marth, J.D. and Parada, L.F. (2001) Ablation of NF1 function in neurons induces abnormal development of cerebral cortex and reactive gliosis in the brain. Genes Dev., 15, 859–876. [DOI] [PMC free article] [PubMed] [Google Scholar]
- 17. Sallach, H.J. (1956) Formation of serine hydroxypryuvate and L-alanine. J. Biol. Chem., 223, 1101–1108. [PubMed] [Google Scholar]
- 18. Salgado, M.C., Meton, I., Anemaet, I.G. and Baanante, I.V. (2014) Activating transcription factor 4 mediates up-regulation of alanine aminotransferase 2 gene expression under metabolic stress. Biochim. Biophys. Acta, 1839, 288–296. [DOI] [PubMed] [Google Scholar]
- 19. Wortel, I.M.N., van derMeer, L.T., Kilberg, M.S. and vanLeeuwen, F.N. (2017) Surviving stress: modulation of ATF4-mediated stress responses in normal and malignant cells. Trends Endocrinol. Metab., 28, 794–806. [DOI] [PMC free article] [PubMed] [Google Scholar]
- 20. Macosko, E.Z., Basu, A., Satija, R., Nemesh, J., Shekhar, K., Goldman, M., Tirosh, I., Bialas, A.R., Kamitaki, N., Martersteck, E.M.et al. (2015) Highly parallel genome-wide expression profiling of individual cells using nanoliter droplets. Cell, 161, 1202–1214. [DOI] [PMC free article] [PubMed] [Google Scholar]
- 21. Gregorian, C., Nakashima, J., Le Belle, J., Ohab, J., Kim, R., Liu, A., Smith, K.B., Groszer, M., Garcia, A.D., Sofroniew, M.V.et al. (2009) Pten deletion in adult neural stem/progenitor cells enhances constitutive neurogenesis. J. Neurosci., 29, 1874–1886. [DOI] [PMC free article] [PubMed] [Google Scholar]
- 22. Zhang, Y., Chen, K., Sloan, S.A., Bennett, M.L., Scholze, A.R., O'Keeffe, S., Phatnani, H.P., Guarnieri, P., Caneda, C., Ruderisch, N.et al. (2014) An RNA-sequencing transcriptome and splicing database of glia, neurons, and vascular cells of the cerebral cortex. J. Neurosci., 34, 11929–11947. [DOI] [PMC free article] [PubMed] [Google Scholar]
- 23. Zhang, Y., Sloan, S.A., Clarke, L.E., Caneda, C., Plaza, C.A., Blumenthal, P.D., Vogel, H., Steinberg, G.K., Edwards, M.S., Li, G.et al. (2016) Purification and characterization of progenitor and mature human astrocytes reveals transcriptional and functional differences with mouse. Neuron, 89, 37–53. [DOI] [PMC free article] [PubMed] [Google Scholar]
- 24. Hodge, R.D., Bakken, T.E., Miller, J.A., Smith, K.A., Barkan, E.R., Graybuck, L.T., Close, J.L., Long, B., Johansen, N., Penn, O.et al. (2019) Conserved cell types with divergent features in human versus mouse cortex. Nature, 573, 61–68. [DOI] [PMC free article] [PubMed] [Google Scholar]
- 25. Schousboe, A., Scafidi, S., Bak, L.K., Waagepetersen, H.S. and McKenna, M.C. (2014) Glutamate metabolism in the brain focusing on astrocytes. Adv Neurobiol., 11, 13–30. [DOI] [PMC free article] [PubMed] [Google Scholar]
- 26. Cooper, A.J. and Jeitner, T.M. (2016) Central role of glutamate metabolism in the maintenance of nitrogen homeostasis in normal and Hyperammonemic brain. Biomol. Ther., 6. [DOI] [PMC free article] [PubMed] [Google Scholar]
- 27. De Meirleir, L. (2014) Pyruvate carboxylase and pyruvate dehydrogenase deficiency, in Physician's guide to the diagnosis, treatment, and follow-up of inherited metabolic diseases. Physician's guide to the diagnosis, treatment, and follow-up of inherited metabolic diseases, 303–311.
- 28. Shin, H.K., Grahame, G., McCandless, S.E., Kerr, D.S. and Bedoyan, J.K. (2017) Enzymatic testing sensitivity, variability and practical diagnostic algorithm for pyruvate dehydrogenase complex (PDC) deficiency. Mol. Genet. Metab., 122, 61–66. [DOI] [PMC free article] [PubMed] [Google Scholar]
- 29. McKenna, M.C. and Ferreira, G.C. (2016) Enzyme complexes important for the glutamate-glutamine cycle. Adv Neurobiol., 13, 59–98. [DOI] [PubMed] [Google Scholar]
- 30. Fahien, L.A., Hsu, S.L. and Kmiotek, E. (1977) Effect of aspartate on complexes between glutamate dehydrogenase and various aminotransferases. J. Biol. Chem., 252, 1250–1256. [PubMed] [Google Scholar]
- 31. Hohnholt, M.C., Andersen, V.H., Andersen, J.V., Christensen, S.K., Karaca, M., Maechler, P. and Waagepetersen, H.S. (2018) Glutamate dehydrogenase is essential to sustain neuronal oxidative energy metabolism during stimulation. J. Cereb. Blood Flow Metab., 38, 1754–1768. [DOI] [PMC free article] [PubMed] [Google Scholar]
- 32. Fasman, G.D. (1989) Prediction of Protein Structure and the Principles of Protein Conformation. Springer US, Plenum Press, New York.
- 33. Taylor, J.P., Brown, R.H., Jr. and Cleveland, D.W. (2016) Decoding ALS: from genes to mechanism. Nature, 539, 197–206. [DOI] [PMC free article] [PubMed] [Google Scholar]
- 34. Stevanin, G., Azzedine, H., Denora, P., Boukhris, A., Tazir, M., Lossos, A., Rosa, A.L., Lerer, I., Hamri, A., Alegria, P.et al. (2008) Mutations in SPG11 are frequent in autosomal recessive spastic paraplegia with thin corpus callosum, cognitive decline and lower motor neuron degeneration. Brain, 131, 772–784. [DOI] [PubMed] [Google Scholar]
- 35. Salinas, S., Proukakis, C., Crosby, A. and Warner, T.T. (2008) Hereditary spastic paraplegia: clinical features and pathogenetic mechanisms. The Lancet Neurology., 7, 1127–1138. [DOI] [PubMed] [Google Scholar]
- 36. Ruaud, L., Keren, B., Debs, R., Mignot, C. and Mochel, F. (2021) Demyelinating motor neuropathy associated with a homozygous GPT2 pathogenic variant. Muscle Nerve., 63, E41–E44. [DOI] [PubMed] [Google Scholar]
- 37. Bodamer, O.A., Halliday, D. and Leonard, J.V. (2000) The effects of l-alanine supplementation in late-onset glycogen storage disease type II. Neurology, 55, 710–712. [DOI] [PubMed] [Google Scholar]
- 38. Carlin, J.I., Olson, E.B., Jr., Peters, H.A. and Reddan, W.G. (1987) The effects of post-exercise glucose and alanine ingestion on plasma carnitine and ketosis in humans. J. Physiol., 390, 295–303. [DOI] [PMC free article] [PubMed] [Google Scholar]
- 39. Genuth, S.M. and Castro, J. (1974) Effect of oral alanine on blood beta-hydroxybutyrate and plasma glucose, insulin, free fatty acids, and growth hormone in normal and diabetic subjects. Metabolism, 23, 375–386. [DOI] [PubMed] [Google Scholar]
- 40. Celis, K., Shuldiner, S., Haverfield, E.V., Cappell, J., Yang, R., Gong, D.W. and Chung, W.K. (2015) Loss of function mutation in glutamic pyruvate transaminase 2 (GPT2) causes developmental encephalopathy. J. Inherit. Metab. Dis., 38, 941–948. [DOI] [PMC free article] [PubMed] [Google Scholar]
- 41. Council, N.R. (2011) Guide for the Care and Use of Laboratory Animals, 8th edn. The National Academies Press, Washington, DC, p. 246. [Google Scholar]
- 42. Yuan, M., Breitkopf, S.B., Yang, X. and Asara, J.M. (2012) A positive/negative ion-switching, targeted mass spectrometry-based metabolomics platform for bodily fluids, cells, and fresh and fixed tissue. Nat. Protoc., 7, 872–881. [DOI] [PMC free article] [PubMed] [Google Scholar]
- 43. Chong, J., Wishart, D.S. and Xia, J. (2019) Using MetaboAnalyst 4.0 for comprehensive and integrative metabolomics data analysis. Curr. Protoc. Bioinformatics, 68, e86. [DOI] [PubMed] [Google Scholar]
- 44. Ouyang, Q., Lizarraga, S.B., Schmidt, M., Yang, U., Gong, J., Ellisor, D., Kauer, J.A. and Morrow, E.M. (2013) Christianson syndrome protein NHE6 modulates TrkB endosomal signaling required for neuronal circuit development. Neuron, 80, 97–112. [DOI] [PMC free article] [PubMed] [Google Scholar]
- 45. Schildge, S., Bohrer, C., Beck, K. and Schachtrup, C. (2013) Isolation and culture of mouse cortical astrocytes. J. Vis. Exp. [DOI] [PMC free article] [PubMed] [Google Scholar]
- 46. Albuquerque, C., Joseph, D.J., Choudhury, P. and MacDermott, A.B. (2009, 2009) Dissection, plating, and maintenance of cortical astrocyte cultures. Cold Spring Harb Protoc, pdb prot5273. [DOI] [PubMed] [Google Scholar]
- 47. Sims, N.R. and Anderson, M.F. (2008) Isolation of mitochondria from rat brain using Percoll density gradient centrifugation. Nat. Protoc., 3, 1228–1239. [DOI] [PubMed] [Google Scholar]
- 48. Kanehisa, M., Furumichi, M., Sato, Y., Ishiguro-Watanabe, M. and Tanabe, M. (2020) KEGG: integrating viruses and cellular organisms. Nucleic Acids Res., 49, D545–D551. [DOI] [PMC free article] [PubMed] [Google Scholar]
Associated Data
This section collects any data citations, data availability statements, or supplementary materials included in this article.