Abstract
Isogenic cells growing in identical environments show cell-to-cell variations because of the stochasticity in gene expression. High levels of variation or noise can disrupt robust gene expression and result in tremendous consequences for cell behaviors. In this work, we showed evidence from single-cell RNA sequencing data analysis that microRNAs (miRNAs) can reduce gene expression noise at the mRNA level in mouse cells. We identified that the miRNA expression level, number of targets, target pool abundance, and miRNA–target interaction strength are the key features contributing to noise repression. miRNAs tend to work together in cooperative subnetworks to repress target noise synergistically in a cell type-specific manner. By building a physical model of post-transcriptional regulation and observing in synthetic gene circuits, we demonstrated that accelerated degradation with elevated transcriptional activation of the miRNA target provides resistance to extrinsic fluctuations. Together, through the integrated analysis of single-cell RNA and miRNA expression profiles, we demonstrated that miRNAs are important post-transcriptional regulators for reducing gene expression noise and conferring robustness to biological processes.
Keywords: MicroRNA regulation, Gene expression noise, Competing RNA, microRNA regulation network, Single-cell RNA sequencing
Introduction
Variations in gene expression are usually caused by genetic or environmental variability [1]. However, even genetically identical cells growing in the same environment may display diverse phenotypes. Gene expression noise, both intrinsic and extrinsic, has been suggested as a major factor in cell-to-cell variations [1], [2]. Gene expression noise is widespread in cell development and population evolution [1], [3]. Such variability can increase overall fitness in evolution by expanding the range of phenotypes [4], [5]. However, noise can result in nonreproducible coordinating cellular functions during tissue morphogenesis and homeostasis [6], [7]. Maintaining precise and robust gene expression in fluctuating environments is necessary for cells to function physiologically. Interestingly, although stochasticity is inevitable in the process of gene expression, most genes in mammalian cells show inapparent randomness in response to cellular state changes and environmental fluctuations [8], which raises the important question of how cells and organisms can avoid the amplification of noise in multistep processes and maintain the fidelity of gene expression.
As an indispensable element of post-transcriptional regulation, microRNAs (miRNAs) have been considered as important regulators in fundamental cellular pathways and organismal development processes [9]. Each type of miRNA is predicted to regulate tens or hundreds of targets in mammalian cells, but only a small portion of these targets is moderately repressed (rarely exceeding 2-fold) in genetic studies [10]. That is, in most cases, miRNAs do not function as strong repressors under physiological conditions. Why are there so many evolutionarily conserved miRNAs and potential targets if miRNAs are inefficient regulators? One proposal is that miRNAs modulate the variability of gene expression and confer robustness to cell population phenotypes [9], [11], [12], [13]. Several recent studies have investigated the effect of miRNA regulation on gene expression noise at the protein level using synthetic gene circuits [11], [12], [14], [15] and suggested that miRNAs could reduce intrinsic noise in protein expression, but with the potential cost of introducing extra noise of miRNA itself (i.e., miRNA pool noise, the fluctuation caused by the changes in miRNA expression level [11]). However, it is unclear if these conclusions from synthetic gene experiments apply to endogenous genes. Furthermore, gene expression noise at the protein level is significantly different from that at the mRNA level because of translational bursting and the coupling between transcription and translation procedures [16], [17], [18]. The study of miRNA regulation on genome-wide mRNA expression noise is still lacking, and the key features of miRNAs contributing to noise regulation have not yet been fully characterized.
It is difficult to accurately quantify the effect of miRNA regulation on mRNA expression noise. There are dozens or even hundreds of types of miRNAs expressed in a single mammalian cell, and each miRNA can regulate hundreds of target genes, creating a complex regulatory network [19], [20]. It is difficult to characterize such direct or indirect interactions between targets in large, interconnected networks by studying single miRNA–target pairs in isolation. As an alternative, high-throughput quantitative measurements of gene expression at the single-cell level have been developed over the past decade. Both single molecule fluorescence in situ hybridization (smFISH) and fluorescent reporter proteins have been widely used to study gene expression noise [3], [21]. However, these approaches are limited by the number of genes that can be studied simultaneously and thus are not sufficient to provide an understanding of the global scope of miRNA-mediated noise reduction.
Currently, the emerging development of single-cell RNA sequencing (scRNA-seq) has made it possible to evaluate mRNA expression noise across cells genome-wide. To better understand the influence of miRNAs on mRNA noise in mammalian cells, we combined scRNA-seq data with miRNA expression data to reveal pivotal features of miRNAs that impact miRNA-mediated noise reduction but could not be observed by bulk measurements. The results showed that noise reduction by miRNAs is a common property of various types of mouse cells. We found that the miRNA expression level, number of targets, target pool abundance (the sum of target transcript counts), and miRNA–target interaction strength are positively correlated with the strength of noise reduction, and miRNAs usually work together as coregulating de-noising subnetworks to repress target noise synergistically in a cell type-specific manner. Furthermore, a kinetic model was built to interpret the mechanism of miRNA-mediated expression noise reduction, which demonstrated that accelerated degradation rates and elevated transcription rates of miRNA targets could contribute to the resistance of extrinsic fluctuations and that the large competing target pool of miRNAs could buffer miRNA pool noise. We measured the gene expression noise in a synthetic gene circuit and proved that endogenous miRNAs could reduce the noise of gene expression. Our results suggest that miRNAs are crucial for mRNA expression noise reduction and provide a new perspective in understanding the physiological functions of miRNAs and their synergistic networks.
Results
miRNAs can suppress genome-wide gene expression noise
Accurate characterization of the gene expression level is the precondition for studying expression noise. scRNA-seq provides high-throughput measurements for gene expression heterogeneity across cells [22], [23]. However, current scRNA-seq measurements suffer from nonnegligible technical noise from stochastic mRNA loss, nonlinear amplification, and other variations in library preparation and sequencing [24], [25], [26]. Therefore, unique molecular identifiers (UMIs) and spike-ins are recommended to control the level of technical variations [22], [27]. Three scRNA-seq datasets using both external RNA spike-ins and UMIs from different mouse cell types were used in this analysis (see Materials and methods for details). We established a systematic data processing pipeline (Figure S1) to eliminate technical variations and revealed the influence of miRNAs on gene expression noise. First, the true biological variations of UMI-based counts were separated from the high level of technical variations with the help of spike-ins [24]. Second, gene expression noise was quantified by the coefficient of variation (CV). The dependency of CV magnitude on the gene expression level was removed by calculating local CV ranks in a sliding window of genes with similar expression levels. Then, we tested whether the gene set targeted by miRNA had significantly lower expression noise than non-target genes. The disparity between miRNA targets and non-targets was measured by the effect size of the Mann–Whitney U test [28]. Finally, the effect size was corrected, and this adjusted effect size (AES) score was used thereafter to eliminate the influence of sample size (number of targets) and to allow a comparison of the effect levels of different miRNAs on noise reduction (see Materials and methods for details; Figures S2 and S3). An AES score greater than 0 means that miRNA target sets have lower expression noise than non-targets, whereas a negative score means the opposite.
We found that miRNA target genes tended to have lower expression noise than non-target genes in terms of the local rank of mRNA CV (Figure 1A). We identified target sets of 149, 108, and 30 miRNAs with significant positive AES scores in mouse embryonic stem cells (mESCs), intestinal stem cells (ISCs), and dendritic cells (DCs), respectively (Figure 1B), but none had significant negative AES scores in any dataset (Figure 1C). Such disparities were not found when using control samples generated by random sampling (Figure 1D). Moreover, we replaced the background gene set with non-miRNA target genes with longer sequences and lower GC content, which are similar to miRNA targets and cannot introduce background bias. The results are comparable, as shown in Figure S4. Together, the aforementioned results indicated that our noise analysis procedure could reveal true biological differences associated with miRNA regulation but not with random technical variations in scRNA-seq. These observations suggested that miRNA-mediated expression noise reduction is a shared feature across different cell types.
Figure 1.
Gene set noise analysis reveals that miRNAs can suppress gene expression noise
A. Box-violin plots quantifying the relative noise disparity of mmu-miR-184 target genes and its non-target genes. The middle line in the box is the median, and the density represents the distribution of the local rank of noise. The P value is 1.9 × 10⁻⁵, and the AES score is 2.73 for the Mann–Whitney U test. An AES score of mmu-miR-184 larger than 0 indicates that the expression noise of its target genes is lower than that of non-target genes. B. Venn diagram showing the number of overlapping and specific de-nosing miRNAs after multiple test correction (AES score > 0, FDR < 10%) among the three different cell type datasets. C. Noise disparity between the target and non-target genes for shared de-noising miRNAs of three different cell types. Different colors indicate different cell types. D. Noise disparity is absent for randomly chosen gene sets. Points and error bars indicate the mean and standard deviation, respectively, over 100 samplings. miRNA, microRNA; mmu, Mus musculus; AES, adjusted effect size; FDR, false discovery rate; mESC, mouse embryonic stem cell; ISC, intestinal stem cell; DC, dendritic cell.
miRNAs with a large target pool suppress noise better
Although miRNA target genes tended to be less noisy than non-target genes, there were still considerable differences in the noise levels among different miRNA targets (Figure 1C), which raised questions about which properties of miRNAs might influence target mRNA expression noise. Therefore, we tried to explore the major influencing factors related to miRNA-mediated noise reduction. We examined all 317 miRNAs expressed in mESCs [29], and found a significant positive correlation (adjusted R2 = 0.322, P < 2.2 × 10⁻¹⁶) between the number of miRNA target genes and its effect on reducing gene expression noise (Figure 2A). A positive correlation between the abundance of the target pool (the sum of target transcript counts) and AES score was also observed (adjusted R2 = 0.363, P < 2.2 × 10⁻¹⁶) (Figure 2B). A more intuitive statistical measure of the relationship between the high abundance of the target pool and noise reduction efficiency can be obtained by dividing the miRNAs into quadrants by the AES score and target pool abundance (Figure 2B). Strikingly, the fraction of miRNAs with low AES scores in the group of miRNAs with low target pool abundance was 6 times larger than that in the group of miRNAs with high target pool abundance (165/271 = 60.9%, 4/46 = 8.7%; odds ratio = 16.22, Fisher’s exact test P value = 8.9 × 10⁻¹²; Figure 2B). A similar correlation can also be found in the relationship between the high number of targets and the high effect of noise reduction (odds ratio = 4.37, Fisher’s exact test P value = 3.1 × 10⁻⁶; Figure 2A). These observations were also consistent in ISCs (Figure S5) and DCs (Figure S6). In summary, miRNAs with large target pools tend to suppress target gene expression noise better.
Figure 2.
miRNAs with a large target pool are associated with better noise suppression
A. AES score of the Mann–Whitney U test versus the number of targets across all detected miRNAs in mESCs. Curves were fitted to , where , , and were determined by least-squares approximation. The fitted parameters are shown in Table S1. The cut-off for the AES score is 2.0, and the cut-off for the number of targets is 700 in Fisher’s exact test. B. Similar points and fitting curve to those shown in (A) for target pool abundance. The cut-off for the AES score is 2.0, and the cut-off for the target pool abundance is 16,000.
miRNA–target interaction strength influences the noise reduction effect
miRNAs can bind to miRNA response elements (MREs) in their target mRNAs [30]. The binding strength between a miRNA and its target mRNA can be quantified using RNA hybridization free energy in thermodynamics, which is correlated with the ability of miRNA to repress gene expression [31]. To study the relationship between noise reduction and miRNA–target interaction strength, we collected free energy information from miRmap [32] for possible miRNA–mRNA pairs in the mouse. To compare their relative binding energy strength across different miRNA–mRNA pairs, all miRNA–mRNA pairs were ranked in ascending order according to their binding energies [32] and further divided into three sets based on quantiles. The top 40% of pairs (low free energy) represent strong interactions between miRNA and mRNA, while the bottom 40% of pairs (high free energy) represent weak interactions (Figure 3A). The effects of noise reduction for these two sets were compared, and the results showed that strong interactions enhance the effect of noise reduction in terms of the AES score (Figure 3B for mESCs; Figure S7A for ISCs; Figure S7B for DCs), which is concordant with the previous finding that miRNA reduces the intrinsic noise of gene expression at the protein level by miRNA-mediated fold repression [11].
Figure 3.
miRNA–target interaction strength influences the noise reduction effect
A. The binding energy of all miRNA–mRNA pairs is ranked in ascending order. The endogenous miRNA target pool is indicated by wavy lines illustrating the affinity of the targets (red for high affinity, green for low affinity) and their relative abundances. B. Noise disparity between the target and non-target genes of the top 15 abundant miRNAs for strong (red) and weak (purple) interaction strength in mESCs. C. and D. AES score versus weak target pool abundance (C) and strong target pool abundance (D) across all miRNAs expressed in mESCs with strong miRNA–target interactions. Curves were fitted to , where , , and were determined by least-squares approximation. The fitted parameters are shown in Table S1.
Previous studies have suggested that the crosstalk among targets regulated by the same miRNA could enhance the stability of gene expression [15], [33]. We further explored the contribution of the different miRNA–target interaction strengths to the noise reduction effect (Figure 3C and D). As strong interactions between miRNAs and mRNAs may be more likely to modulate gene expression level and noise, here we calculated the AES score by all strong targets of a miRNA and investigated the relationship between the AES score and the competing RNA pools with different interaction strengths. Although the abundances of both the strong and weak competing target pools were positively correlated with the AES score, the predictive power of the weak competing target pool abundance (adjusted R2 = 0.851) was much higher than that of the strong competing target pool abundance (adjusted R2 = 0.521). These observations were consistent with our previous theoretical research on miRNA-mediated noise regulation [34], which showed that an abundant weak competing target mRNA pool has the capacity to buffer gene expression noise. In summary, a gene strongly bound by miRNAs that also has a large weak competing target pool tends to have lower mRNA expression noise.
Gene expression noise is repressed by miRNA coregulation subnetworks
Intuitively, we expected that the miRNA expression level would influence noise reduction. However, we did not find a strong correlation between the miRNA expression level and the AES score (Figure 4A). One possible reason is that each miRNA species can regulate multiple target genes, and each gene can be controlled by multiple miRNAs, which constitute a complex regulatory network. The shared targets of different miRNAs could induce indirect miRNA–miRNA crosstalk [35], which may mask the actual interactions of miRNA with its targets and lead to false-positive and false-negative results in AES score calculations. Moreover, miRNAs seldom regulate cellular processes independently but often form functional miRNA–miRNA cooperation networks by coregulating functional modules [36], [37]. To study miRNA cooperative regulation and analyze the function of miRNA in noise reduction at the subnetwork level, we predicted the miRNA–miRNA cooperation network through their shared target genes. Each miRNA species was regarded as a node in the network, and the weights of the edges between the nodes were calculated by the similarity of their target gene sets. The walktrap clustering algorithm [38], which is suitable for the subnetwork division problem of complex networks, was performed on the 317 expressed miRNAs in mESCs and identified 59 subnetworks (Figure 4B). The AES score of noise reduction was calculated for each subnetwork by taking the targets of the miRNAs in the subnetwork as a union. As shown in Figure 4C–E, the AES scores of the miRNA subnetworks were highly correlated with the miRNA expression level, number of targets, and target pool abundance. Similar results were also obtained in ISCs (Figure S8) and DCs (Figure S9). Importantly, the strong positive correlations were much higher than those measured at the level of individual miRNAs or miRNA families defined by miRNA 5′ end 2–8 nt ‘seed’ similarity (Figure 4F). To reduce the impact of false-positive entries of TargetScan on clustering, we replaced the binary connection between the miRNA and its targets with the weights defined by the miRNA–target ranks retrieved from TargetScan. As shown in Figure S10, the correlation between the AES scores and miRNA expression calculated by the miRNA-weighted clusters was stronger than that calculated by binary clustering. Together, these observations using clustering analysis successfully revealed a biologically significant noise reduction by miRNA subnetworks, as well as a strong correlation between noise reduction and the number of targets, the abundance of the target pool, and the miRNA expression level measured at the subnetwork level.
Figure 4.
Gene expression noise is repressed by the miRNA coregulation subnetwork
A. AES score versus miRNA expression for miRNA individuals. B. Two examples of significant de-noising miRNA subnetworks for mESCs. Each node represents a miRNA species, and edges indicate the connection of miRNAs. Other significant de-noising miRNA subnetworks are shown in Table S2. C. AES score versus miRNA expression for miRNA subnetworks. D. AES score after subnetwork clustering versus the number of targets across all cluster miRNAs in mESCs. E. Similar points and fitting curve to those shown in (C) for target pool abundance. F. Pearson correlation coefficients between miRNA features (log10 transformed) and AES scores for non-clustering, clustering by miRNA family, and clustering by network. Colors indicate different cell types. Curves in (A and C–E) were fitted to where and were determined by least-squares approximation. The fitted parameters are shown in Table S3.
miRNA coregulation subnetworks show cell type specificity
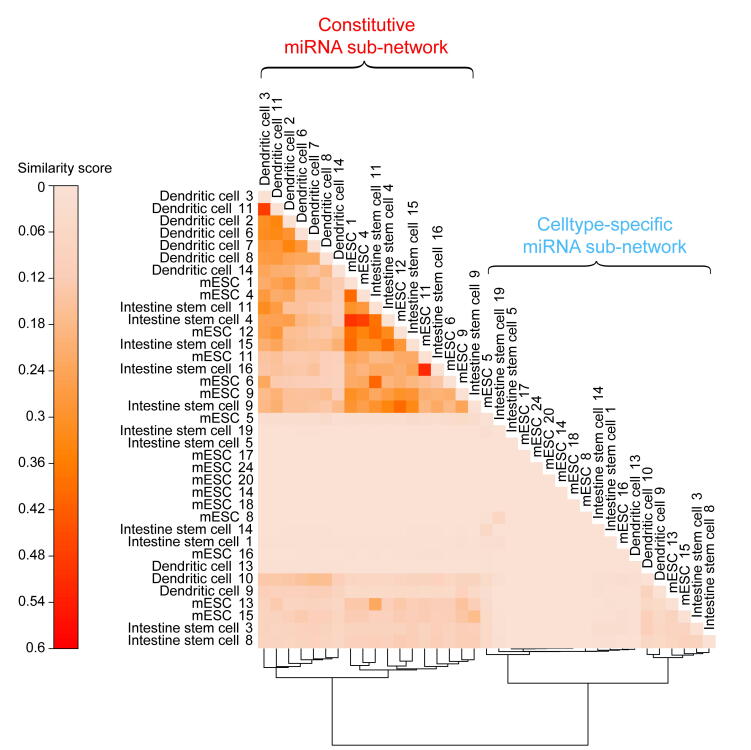
Next, we compared de-noising miRNA subnetworks in different cell types. In total, 37 significant de-noising miRNA subnetworks were identified in three cell types (16 in mESCs, 11 in ISCs, and 10 in DCs). For any two given significant de-noising miRNA subnetworks, we first obtained their target gene sets A and B, and then calculated the subnetwork similarity using the Jaccard similarity coefficient [39] of their target genes (defined as the intersection size divided by the union size of two target gene sets), and finally constructed a similarity matrix for all miRNA subnetworks from three cell types. These subnetworks were divided into constitutive subnetworks and cell type-specific subnetworks by hierarchical clustering of the similarity matrix (Figure S11). The constitutive subnetworks regulate shared target genes across three cell types, and the cell type-specific subnetworks tend to target specific genes in a given cell type. To further investigate the roles of these two types of subnetworks, Gene Ontology (GO) analysis was performed (Figure 5; see Materials and methods for details). The target genes of constitutive de-noising miRNA subnetworks were enriched in GO terms related to essential cellular functions such as “cytoplasmic mRNA processing body assembly”, “ribonucleoprotein complex assembly” and “ribonucleoprotein complex subunit organization”. In contrast, cell type-specific de-noising miRNA subnetworks appeared to regulate more specific biological processes, such as “body morphogenesis” in mESCs, “glycoprotein metabolic process” in mESCs and DCs, “epidermal growth factor receptor signaling pathway” in DCs and ISCs, and “cell cycle phase transition” in ISCs, which implies that cell type-specific de-nosing miRNA subnetworks may contribute to cell state maintenance by repressing cell type-specific gene expression noise. Overall, these observations suggested that de-noising miRNA subnetworks, which correspond to cell types and cell functions, play important roles in gene expression noise reduction.
Figure 5.
De-noising miRNA subnetworks correspond to cell types and cell functions
Top 5 enriched GO terms with their respective P values (ClusterProfiler) for target genes in the constitutive de-noising miRNA subnetworks and cell type-specific de-noising miRNA subnetworks in mESCs, ISCs, and DCs. GO, Gene Ontology.
Accelerated degradation of miRNA targets provides resistance to extrinsic noise
The half-life of an mRNA is known to influence gene expression noise [40], [41]. Due to the integral effect on transcriptional bursts, longer-lived mRNAs generally exhibit lower intrinsic noise. By combining the mRNA degradation rate data [42] with scRNA-seq data, we observed that mRNA half-life was negatively correlated with mRNA expression noise (Figure 6A for mESCs, Figure S12A for ISCs, Figure S12B for DCs). However, miRNAs usually repress gene expression by accelerating target mRNA degradation [11]. The half-life and gene noise of mRNAs targeted by miRNAs exhibited a counterintuitive positive correlation (Figure 6A, Figure S12A and B). Interestingly, the target genes of de-noising miRNAs have a significantly shorter half-life than the targets of non-de-noising miRNAs (Figure 6B for mESCs, Figure S13A for ISCs, Figure S13B for DCs).
Figure 6.
miRNAs accelerate target degradation to resist environmental disturbances
A. Scatterplot of AES scores of gene expression noise versus AES scores of mRNA half-life for random gene sets (gray) and real miRNA target gene sets (color) in mESCs. Random gene sets are constructed with varying sample sizes (100–2000) by weighted sampling of mRNAs according to half-life. The AES score is defined as the adjusted statistic for the Mann–Whitney U test, where a value of 0 corresponds to no difference between the gene sets and the background, while a value larger than 0 corresponds to lower noise and lower half-life of the gene sets than those of the background. The Spearman correlation coefficient between AES scores of half-life and noise for the random sample was − 0.698 but was 0.562 for real miRNA target gene sets in mESCs. The similar results obtained in ISC and DC datasets are shown in Figure S12A and B. B. Targets of de-noising miRNAs have a significantly shorter half-life than those targets of non-de-noising miRNAs in mESCs. C. Total noise (intrinsic and extrinsic noises) of an mRNA as a function of mean mRNA total expression (sum abundance of free mRNA and mRNA–miRNA complex). The shadows indicate 100 repeated simulation trials. D. The extrinsic noise of miRNA-regulated genes decreases as the accelerated degradation increases. The error bars indicate the standard deviation of 100 repeated simulation trials. E. Schematic diagram of the synthetic gene circuits used for observing expression noise modulated by miRNA. F. EYFP intensities of synthetic gene circuits without the regulation of miRNA and with the regulation of hsa-miR-21. Cells were binned by log10 TagBFP in sliding windows with bin width equal to 0.2, and then cells in the bin with mean intensity of EYFP (log10 transformed) nearest to 1 × 103.5 AU were shown. G. Noise levels of synthetic gene circuits with or without the regulation of miRNAs under different mean intensities of EYFP (log10 transformed). Cells were selected by the same method described in (F). Three biological replicates were performed. H. Summary scheme showing accelerated degradation with compensatory elevated transcriptional activation of miRNA targets provides resistance to extrinsic fluctuations. In addition, the large competing target pool with weak binding affinity could buffer miRNA pool noise. Therefore, the miRNA target gene (blue) has lower noise than the non-target gene (green) at equal mRNA expression levels globally. AU, arbitrary unit.
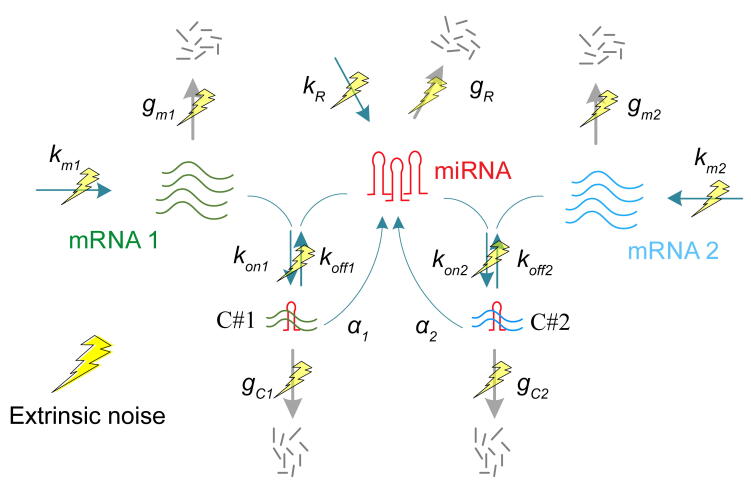
To better understand the mechanism of miRNA-mediated expression noise reduction, we established a coarse-grained physical model in which mRNA expression noise was decomposed into intrinsic noise and extrinsic noise. This model described the main steps of gene expression, including post-transcriptional regulation by miRNA and competing target regulation by miRNA (Figure S14), which was inspired by our previous studies on stochastic gene expression and post-transcriptional regulation by miRNA [11], [43]. The noise in gene expression comes from two major sources: 1) intrinsic noise, which is generated by random biochemical reactions such as production and decay of mRNAs and miRNAs [2], and association and dissociation of free mRNAs with miRNAs, and 2) extrinsic noise, which is modeled as the fluctuation in the reaction kinetic rates generated by variable external environmental factors in cellular components such as the number of RNA polymerases or ribosomes [2], [3], [44]. We defined the strengths of extrinsic noise as Fano factors of reaction kinetic rates introduced in previous studies [44] and extended the chemical Langevin equation to include both intrinsic and extrinsic noises (see File S1). Without loss of generality, we assumed that the extrinsic noise has the same effect on all parameters; that is, all reaction kinetic rates share an equivalent Fano factor.
Model simulation suggested that miRNA could reduce mRNA expression noise in the low expression zone but introduce extra miRNA pool noise in the high level of mRNA expression compared to an unregulated gene at equal mRNA expression levels (Figure 6C, blue line versus red line), which is similar to previous experimental results at the protein level [11]. If keeping the level of miRNA repression to the target gene, the introduction of a large competing target pool with weak binding affinity could significantly buffer the noise introduced by the miRNA pool (Figure 6C, orange line versus blue line). To explore the influence of accelerated degradation on noise, the accelerated degradation ratio was defined as the ratio of the miRNA-induced mRNA degradation rate to the mRNA degradation rate (see File S1). Under the condition of an equal level of mRNA expression, the model predicted that miRNA targets have reduced extrinsic noise when accelerated degradation increases (Figure 6D).
To validate that miRNAs can provide resistance to gene expression noise, we carried out a series of synthetic gene circuits to measure the expression noise with or without the regulation of endogenous miRNAs. As shown in Figure 6E, the synthetic gene circuit, based on a previous study that employed endogenous miRNAs to classify different cell types [45], was composed of two kinds of plasmids. Plasmid A encoded two constitutively expressed proteins, a transcription activator Gal4VP16 and a fluorescent protein TagBFP. Plasmid B encoded another fluorescent protein EYFP, the expression of which was controlled by a promoter that could be activated by Gal4VP16 in the presence of doxycycline. When co-transfecting the two plasmids into cells, the intensity of TagBFP can be used to indicate the mean activation level of the EYFP’s promoter as well as the mean copy number of these plasmids. However, due to randomness during transfection, the copy number of plasmid B was varied in the cell population, which therefore dominated the extrinsic noise that influenced the transcription of EYFP.
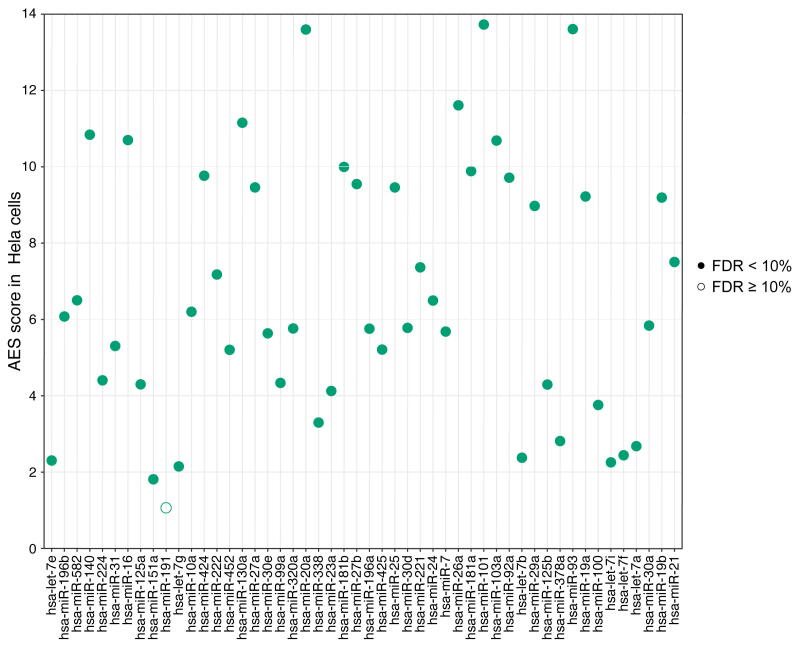
We built a mathematical model to demonstrate the consistency between the noise in EYFP mRNA and protein levels under the influence of extrinsic fluctuation (see File S1), and then used the scRNA-seq [46] and miRNA-seq datasets of HeLa cells to identify de-noising miRNAs. As a result, 49 significant de-noising miRNAs were found among the top 50 expressed miRNAs (Figure S15). Next, we chose the top 8 expressed miRNAs in HeLa cells and constructed their targets in the 3′ UTR of EYFP in the gene circuit. We transfected these circuits into HeLa cells and observed the expression noise level of EYFP by flow cytometry (see Materials and methods). We binned cells according to the logarithmic expression level of TagBFP and then calculated the mean value and CV of EYFP expression of cells within each bin. For instance, as shown in Figure 6F, when the mean EYFP expression levels were the same, EYFP regulated by hsa-miR-21 exhibited lower CV than that without miRNA regulation. The vast majority of other top 8 expressed miRNAs in HeLa cells also showed similar results under different EYFP expression levels (Figure 6G). The results support our notion that many endogenous miRNAs may function to significantly reduce the noise of gene expression.
In conclusion, these observations indicated that accelerated target mRNA degradation with an elevated transcription rate may contribute to the resistance to extrinsic fluctuations, and a large competing target pool with weak binding affinity could buffer miRNA pool noise (Figure 6H).
Discussion
In this work, we revealed the effect of miRNA regulation on the noise in targeted mRNAs via scRNA-seq data in mice. We showed that reducing the expression noise of their targets is an essential feature of miRNAs in various mouse cells. We identified miRNA characteristics that contribute to noise repression, including the number of targets, target pool abundance, miRNA expression level, and miRNA–target interaction strength. Furthermore, we showed that miRNA coregulation subnetworks are significantly correlated with noise reduction, which is helpful to understand the function of the miRNA coregulation network in vivo.
We found that the targets of de-noising miRNAs have a significantly shorter half-life than those targets of non-de-noising miRNAs. Based on these observations, we proposed that miRNAs, as noise suppressors, resist extrinsic fluctuations by increasing target degradation rates with compensatory elevated transcription rates (Figure 6H). In addition, we showed that the buffering role of miRNAs becomes evident with the increase in target degradation rates through a kinetic model. Interestingly, Schmiedel et al. [47] found that the half-lives of miRNA targets decreased with an increase in the number of miRNA binding sites, but the transcription rates of targets increased with an increase in the number of miRNA binding sites. These results support our hypothesis. Furthermore, several pieces of evidence suggest that miRNAs can buffer gene expression noise against extrinsic environmental perturbations. For instance, Xin et al. [48] found that miR-7 is essential in buffering developmental programs against variations and imparts robustness to diverse regulatory networks, which are strongly functionally conserved from annelids to humans. Mehta et al. [49] showed that miRNAs in the hematopoietic system could modulate the balance between self-renewal and differentiation and ensure the appropriate output of immune cells, which confers robustness to immune cell development, especially under conditions of environmental perturbations. Kasper et al. [50] found that miRNA mutant embryos of zebrafish showed greater sensitivity to environmental perturbations and that the loss of miRNAs increased the variance in developing vascular traits. This evidence, consistent with our results, highlights the potential importance of miRNAs in stabilizing gene expression variability and preventing susceptibility to environmental disruptions.
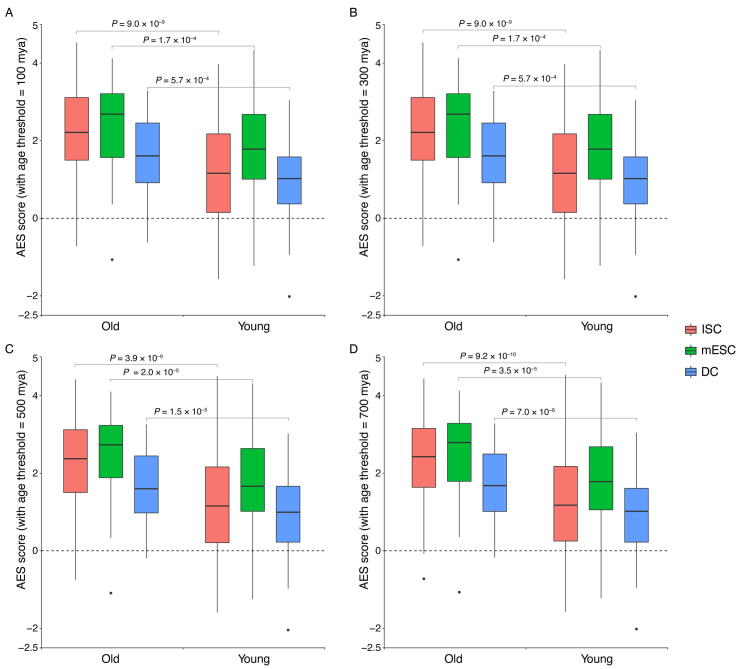
Previous studies have mainly focused on the roles of individual miRNAs but neglected miRNA-mediated crosstalk among competing targets. Recent studies have found that crosstalk among competing targets could enhance the stability of gene expression [15], [33], [51]. Here, we observed a positive correlation between the abundance of the target pool and noise reduction (Figure 2, Figure 4). Interestingly, we found that weak target pools have a much greater capacity to buffer miRNA pool noise than strong target pools. miRNAs are ubiquitous but mysterious regulators; the majority of mRNAs are predicted to be targets for one or more miRNA species, but only a small portion of those targets could be moderately repressed [52]. Most miRNA–target interactions are too weak to have strong phenotypic consequences when knocking down or knocking out the corresponding miRNA. The function of the pervasive and evolutionarily conserved miRNA–target weak interaction pairs is still unclear. Interestingly, a combined analysis with the age of miRNA families [53] reveals a trend in which older miRNA families show a stronger noise reduction effect than younger miRNA families (Figure S16). This result might support the theory that miRNAs have evolved as noise suppressors. Our results provide possible directions to explain the weak repression effects exerted by the majority of known miRNAs. In general, introducing higher level of miRNAs and compensating weak co-regulated targets could enhance the suppression of gene expression noise over a wider range.
This study focused on the integrative analysis of scRNA-seq data and bulk miRNA-seq data in various cell types. We selected the bulk miRNA-seq data corresponding to the cell type of scRNA-seq data from the public Gene Expression Omnibus (GEO) database and performed quality control to exclude the poor-quality miRNAs across different datasets. However, extensive variations in miRNA sequence and expression exist between different cells [54], [55]. Precisely understanding endogenous miRNA functions requires approaches to simultaneously profile miRNAs and their targets with single-cell resolution. Although some new approaches that enable high-throughput sequencing of single-cell miRNAs have been proposed very recently [56], [57], paired high-quality data of miRNAs and their targets in the same single cell are still lacking, thus preventing the discovery of associations between transcriptional and miRNA profile variations. These questions may be further addressed by multi-omics profiling of single cells in the future.
In summary, this work presented genome-wide evidence that miRNAs function as repressors of gene expression noise and that miRNAs function as networks to stabilize mRNA levels and maintain cellular functions.
Conclusion
By combining scRNA-seq data with bulk miRNA-seq data, we found consistent evidence of a role for miRNAs as noise repressors in multiple mouse cell types. We systematically analyzed the key properties of miRNAs associated with noise reduction from individual miRNAs to miRNA coregulation subnetworks. Specifically, we proposed a kinetic model, which revealed that increasing the degradation rate to resist extrinsic fluctuations is the mechanism by which miRNAs decrease mRNA expression noise. Gene expression processes are inherently stochastic under complex and volatile environmental conditions. Our results provide new insights to explain the role of miRNAs in cell responses to environmental disturbances.
Materials and methods
Expression quantification and normalization for scRNA-seq data
To systematically study the influence of miRNA regulation on gene expression noise in mammalian cells, we collected three scRNA-seq datasets employing external RNA spike-ins and UMIs from different cell types in mice, which consist of 41 cells from mESCs (GEO: GSE46980) [58], 90 cells from DCs (GEO: GSE54006) [59], and 100 cells from ISCs (GEO: GSE62270) [60] after removing cells with low sequencing quality. We also collected bulk miRNA-seq data for the corresponding cell types (GEO: GSE45882 for mESCs, GSE76825 for DCs, and GSE75482 for ISCs) [29], [61], [62]. UMIs are composed of tens of thousands of short DNA sequences incorporated in mRNAs before library amplification to account for stochastic RNA loss and nonlinear amplification bias for diversely expressed genes [22]. Spike‑ins are extrinsic molecules that are expected to be similar across all single-cell libraries that can be used to estimate technical variations in sequencing [24]. We collected scRNA-seq datasets that were sequenced using UMIs and spike-ins to reduce technical noise and determine the actual biological signals for use in downstream analysis. These features are very important in removing the strong technical noise of scRNA-seq data to unveil subtle gene expression variations regulated by miRNAs.
To compare expression noise between genes with different expression levels and transcript lengths, the raw scRNA-seq data were processed according to previous work [24]. First, to restore the true biological signals from the high level of technical noise coupling in the sequencing process of scRNA-seq, we estimated the mean value of gene expression and biological variance by accounting for technical noise with the help of spike-ins (Figures S17–S19). The scRNA-seq data analysis procedure based on UMIs and spike-ins provides a reliable estimate of gene expression variation. This step controls various technical variations, such as mRNA stochastic loss, amplification bias, sequencing efficiency variation, sampling variation, and experimental batch effects, before downstream quantitative analyses. Second, we checked whether the cell cycle-related genes contribute substantially to the heterogeneity of gene expression. If so, the cell cycle cofactors would need to be removed to ensure that they do not introduce spurious correlations or inflate the variances [60], [63]. As shown in Figures S20–S22, by comparing the variance distribution of cell cycle-related genes and other genes, we found that cell cycle-related genes do not show increased variability and are thus unlikely to lead to false results in the noise analysis.
Gene expression noise quantification
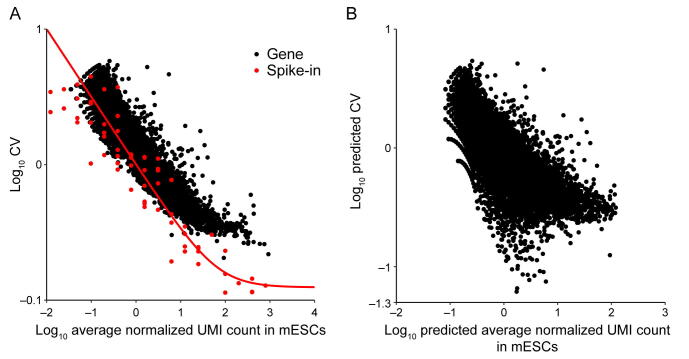
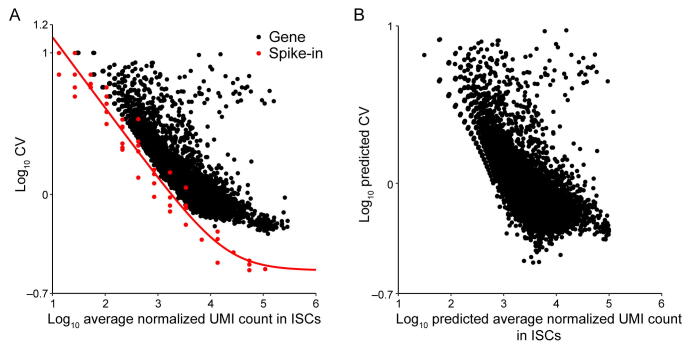
We quantified gene expression noise by CV (standard deviation divided by the mean abundance of mRNA) (Figures S17–S19) as in previous analyses [64], [65]. As the CV is strongly anti-correlated with the expression level of genes (Figures S17B, S18B, and S19B), the local ranks of CV in a sliding window of 100 similarly expressed genes were calculated to remove the dependency of CV on the gene expression level (Figure S1). The local rank of CV is a reliable and robust measurement to compare the relative noise level for gene sets with different expression levels [28].
The definition and selection of miRNA targets
Firstly, the miRNA expression profiles used in this analysis were annotated with miRBase [66]. To reduce the possible false-positive entries of this repository, we mapped miRBase annotations to MirGeneDB annotations [67] and deleted the miRNAs that did not match MirGeneDB annotations. Most of the miRNAs in the datasets can be mapped successfully as indicated in Table S4. Secondly, the target genes of miRNAs were retrieved from the TargetScan predictions [68], [69]. We defined the conserved miRNA target genes across most mammals as the miRNA target genes, and their site types including 7mer-A1, 7mer-m8, and 8mer. According to the website of TargetScan, it is better to choose cumulative weighted context++ score (CWCS) thresholds rather than thresholds for sites [69]. A target with a larger CWCS means a higher degree of confidence. Therefore, we examined the influence of target definition criteria on the noise analysis, and the results showed that the de-noising score of miRNA (AES score) is generally not very sensitive to the confidence of the miRNA target (Figures S23–S25). However, the number of significant de-noising miRNAs is slightly increased when only considering a highly confident target set.
Noise disparity analysis
Referring to previous work [28], we calculated the effect size to compare differences in noise level between miRNA targets and non-targets. First, we retrieved the miRNA expression level from miRNA-seq datasets. Then, we divided all genes into miRNA target genes and non-target genes and compared the local ranks of CV between the sets of miRNA target genes and non-target genes. The significance of each test is determined using a Mann–Whitney U test, which is a nonparametric test that can be used in place of an unpaired t-test [70]. For each test, the null hypothesis is that the CV local ranks of two gene sets come from the same population. In this context, we use the area under the ROC curve (AUC) statistic to measure the effect size of the test [71] (Figure S1). The AUC is equivalent to the Mann–Whitney U statistic in mathematics [72]. An effect size greater than 0.5 corresponds to higher expression noise of miRNA target genes than non-target genes, while an effect size less than 0.5 indicates lower expression noise of miRNA target genes than non-target genes.
The effect size magnitude of the Mann–Whitney U test is correlated with the sample size (Figure S2A). As different miRNAs have different numbers of targets, we need to correct the influence of sample size on the effect size to make them comparable between different miRNAs. Mathematically, the effect size can be approximated as a normal distribution for a large sample size, whose expectation μ is 0.5 and variance σ2 is (Ntest + Nbg + 1)/(12NtestNbg), where Ntest and Nbg represent the sample sizes of the test and background, respectively [72]. To remove the effect of sample size, the AES was calculated: AES = (μ – effect size)/σ. Figure S2B shows the AES score for different test sample sizes. An AES score of less than 0 corresponds to a larger local rank CV of miRNA target genes than non-target genes, and an AES score larger than 0 indicates that the local rank CV of miRNA target genes is smaller than non-targets. Moreover, a larger AES score means better noise reduction for miRNAs.
Gene Ontology analysis
To investigate the roles of constitutive and cell type-specific miRNA subnetworks, we performed GO analysis by genome-wide annotation database org.Mm.eg.db and gene functional annotation clustering tool ClusterProfiler with default settings [73]. We chose the top 5 GO terms of constitutive miRNA subnetworks and cell type-specific miRNA subnetworks for mESCs, ISCs, and DCs, and provided 19 terms in total (Figure 5; the Benjamini-corrected P values of these terms are less than 0.05).
Model to describe how miRNAs de-noise gene expression
A detailed description of the theoretical analysis used in this study is available in File S1. Briefly, we built a physical model to investigate the mechanism of miRNA-mediated gene expression noise reduction at the mRNA level. The parameters are shown in Table S5.
Experimental validations on HeLa cells
We analyzed the miRNA profile of HeLa cells (GSE164080 from GEO) [74] and designed a perfect complementary MRE for each of the top 8 most highly expressed miRNAs. We inserted these MREs into the 3′ UTR of EYFP on plasmid B without MRE (pB0) separately and named them pBn (n = 1–8).
HeLa cells (Catalog No. CCL-2, originally obtained from ATCC, Manassas, VA) were grown in DMEM (Catalog No. 11965092, Gibco, Grand Island, NY) with 10% fetal calf serum (Catalog No. 10270106, Gibco) at 37 °C and 5% CO2. About 1.6 × 10⁵ HeLa cells were seeded in 12-well plates. One day after, we co-transfected plasmid A (pA), pBn (n = 0–8), and pDT7004 (a plasmid without protein-coding sequences) into HeLa cells with Lipofectamine LTX (Catalog No. 15338100, ThermoFisher Scientific, Waltham, MA) according to the manufacturer’s protocol. For a well on the plate, each plasmid was transfected with the amount of 100 ng. We also added doxycycline (Catalog No. 631311, Clontech, San Jose, CA) with the final concertation of 1 μg/ml to induce the expression of EYFP.
Cells were collected 48 h after transfection for flow cytometry (LSRFortessa Cell Analyzer, BD Biosciences, Franklin Lakes, NJ), and intensities of TagBFP and EYFP of each cell were recorded. Cells were binned by log10 TagBFP in sliding windows with bin width equal to 0.2. In each bin, cells with EYFP intensity between the 5% and 95% quantiles were selected. We calculated the mean intensity of EYFP in all bins, and chose the bin whose mean intensity of EYFP (log10 transformed) was nearest to 1 × 10³, 1 × 103.5, or 1 × 10⁴ arbitrary unit (AU) for further analysis. CV was then calculated as the expression noise of EYFP.
Code availability
Our analysis is based on R version 3.4.2. The codes used to perform the data process and analyses are available at https://gitlab.com/ecart18/noise-analysis.
Competing interests
The authors declare that they have no competing interests.
CRediT authorship contribution statement
Tao Hu: Conceptualization, Methodology, Software, Writing – original draft. Lei Wei: Conceptualization, Validation, Writing – original draft. Shuailin Li: Investigation. Tianrun Cheng: Investigation. Xuegong Zhang: Writing – review & editing. Xiaowo Wang: Supervision, Writing – review & editing.
Acknowledgments
This work has been supported by the National Science Foundation of China (Grant Nos. 61773230 and 61721003). XZ is supported in part by the Chan Zuckerberg Initiative (CZI) Human Cell Atlas (HCA) project. We thank Guiying Wu and Xianglin Zhang for their technical assistance. We thank Prof. Jingzhi Lei for critical advice in the kinetic model.
Handled by Andreas Keller
Footnotes
Peer review under responsibility of Beijing Institute of Genomics, Chinese Academy of Sciences/China National Center for Bioinformation and Genetics Society of China
Supplementary data to this article can be found online at https://doi.org/10.1016/j.gpb.2021.05.002.
Supplementary material
The following are the Supplementary data to this article:
Supplementary figure 1.
The workflow of gene expression noise analysis.
Supplementary figure 2.
The correlation between effect size and sample size for the Mann–Whitney U test before correction. A. Validating the correlation between effect size and test sample size by sampling background samples and variable test samples (x-axis) from all genes randomly in three cell types of datasets. The three cell types of datasets are highlighted in different colors. And all tests are not significant in the random experiments (FDR ≥ 10%). This simulation result shows that the effect size is strongly correlated with the test sample size. B. An additional effect size correction step to remove the effect of sample size by calculating the adjusted effect size as z-score according to the distribution of effect size. This plot shows the adjusted effect size after correction.
Supplementary figure 3.
The correlation between effect size and sample size for the Mann–Whitney U test after correction. A. Effect size versus test sample size (the number of targets) for real data. This result shows that there was a noise bias for all three cell line datasets. Effect size less than 0.5 indicates that the local rank CV of miRNA target genes is smaller than non-targets. B. An additional effect size correction step for real data.
Supplementary figure 4.
The number of de-noising miRNAs and AES score are not sensitive to GC content of non-target genes. A. The curves show the number of significant de-noising miRNAs varying with GC content threshold. This is used to select the non-miRNA target genes of lower GC content. The colors indicate different cell types. B. Noise disparity between the target genes and non-target genes for shared de-noising miRNAs of three different cell types. The GC content threshold is 0.5.
Supplementary figure 5.
miRNAs with a large target pool associated with better noise suppression for ISCs. A. AES score of the Mann–Whitney U test versus the number of targets across all detected miRNA in ISCs. Curves were fitted to where a, b, and c were determined by least-squares approximation. Fitted parameters are shown in Table S1. B. Similar fitting curve to those shown in A for targets pool abundance.
Supplementary figure 6.
miRNAs with a large target pool associated with better noise suppression for DCs. A. AES score of the Mann–Whitney U test versus the number of targets across all detected miRNA in DCs. Curves were fitted to where a, b, and c were determined by least-squares approximation. Fitted parameters are shown in Table S1. B. Similar fitting curve to those shown in A for targets pool abundance.
Supplementary figure 7.
Strong interactions will enhance the effect of noise reduction. A. and B. Noise disparity between the target genes of Top15 abundant miRNA for strong (red) and weak interaction strength (purple) in ISCs (left) and DCs (right) respectively.
Supplementary figure 8.
Gene expression noise is repressed by miRNA co-regulation sub-network for ISCs. A. and B. AES score of the Mann–Whitney U test versus miRNA expression for miRNA individuals and sub-network respectively in ISCs. Curves were fitted to where a and b were determined by least-squares approximation. Fitted parameters are shown in Table S3. C. AES score of the Mann–Whitney U test after sub-network clustering versus the number of targets across all cluster miRNA in ISCs. D. Similar fitting curve to those shown in C for targets pool abundance.
Supplementary figure 9.
Gene expression noise is repressed by miRNA co-regulation sub-network for DCs. A. and B. AES score of Mann–Whitney U test versus miRNA expression for miRNA individuals and sub-network respectively in DCs. Curves were fitted to where a and b were determined by least-squares approximation. Fitted parameters are shown in Table S3. C. AES score of the Mann–Whitney U test after sub-network clustering versus the number of targets across all cluster miRNA in DCs. D. Similar fitting curve to those shown in C for targets pool abundance.
Supplementary figure 10.

AES scores of the miRNA coregulation subnetwork for weighted network clustering. A.–C. AES score of Mann–Whitney U test versus miRNA expression for weighted network clustering in mESCs, ISCs, and DCs, respectively. D. Pearson correlation coefficients between miRNA features (log transformed) and AES scores for non-clustering, clustering by miRNA family, clustering by the network, and weighted network clustering. Colors indicate different cell types.
Supplementary figure 11.
Similarity matrix for all miRNA sub-networks from three cell types. Sub-networks were divided into constitutive sub-networks and cell-type-specific sub-networks by hierarchical clustering of the similarity matrix. The sub-network similarity matrix was calculated using the Jaccard similarity of their target genes. The numbers in the network name indicate the sub-networks ID. Details of miRNAs of sub-network are shown in Table S2.
Supplementary figure 12.
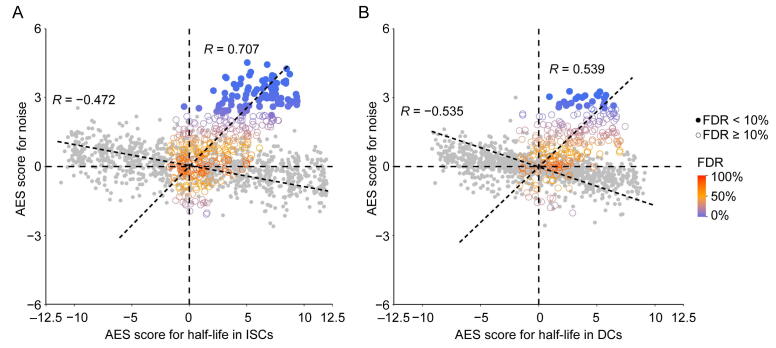
The correlation between noise and mRNA half-life. A. and B. Scatterplots of AES scores of gene expression noise versus AES scores of mRNA half-life for random gene sets (gray) and real miRNA target gene sets (color) for ISC (A) and DC (B) datasets. Random gene sets are constructed with varying sample size (200–2000) by weighted sampling of mRNAs according to half-life. In (A), Spearman correlation coefficient between AES scores of half-life and noise for the random sample was −0.472, but was 0.707 for real miRNA target gene sets in ISCs; in (B), Spearman correlation coefficient between AES scores of half-life and noise for the random sample was −0.535, but was 0.539 for real miRNA target gene sets in DCs.
Supplementary figure 13.
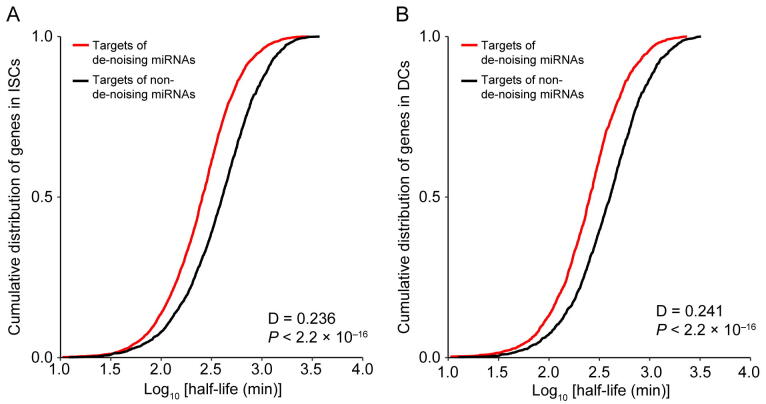
The distribution of mRNA half-life time for miRNA targets. A. and B. Compared to the mean mRNA half-lives cumulative distribution of de-noising miRNAs target genes with target genes of remain miRNAs in ISCs and DCs respectively. We observed that the targets of de-noising miRNAs have a much shorter half-life than those targets of remain miRNAs.
Supplementary figure 14.
A kinetics model for miRNA regulation. A coarse-grained model for expression noise of a miRNA regulated gene. Noise in mRNA expression originates from stochastic biochemical reactions in the production of the mRNA (intrinsic noise) and fluctuation in the reaction kinetic rates caused by variable external factors in the environment (extrinsic noise; yellow lightning symbols).
Supplementary figure 15.
Noise disparity between the target genes and non-target genes for HeLa cells. 49 significant de-nosing miRNAs were found among the top 50 expressed miRNAs in HeLa cells. The miRNAs are arranged left-to-right by expression level (an increasing expression to the right).
Supplementary figure 16.
The older miRNA families have shown a stronger effect in noise reduction than the younger miRNA. Box plots quantifying the ability of de-noising of old and young miRNAs. The unit of miRNA family age is millions of years ago (mya) and the age of the mouse miRNA family is between 37 and 1036 mya. The miRNA families whose age is less than the threshold are defined as the young miRNA families and the remaining miRNA families are defined as the old miRNA families. For different age thresholds, Mann–Whitney U test is used to quantify the difference in noise reduction between young and older miRNA families., and the age threshold is 100, 300, 500, 700 for subplots A, B, C, D respectively.
Supplementary figure 17.
Noise quantification and normalization for transcripts in mESCs. A. CV of transcript counts versus average transcript count for all detected genes in raw data from a scRNA-seq experiment in mESCs. Black dots and red dots indicate true genes and spike-ins, respectively. B. Predicted CV of transcript counts versus predicted average transcript count for all detected genes after removing technical noise with the help of spike-ins.
Supplementary figure 18.
Noise quantification and normalization for transcripts in ISCs. A. CV of transcript counts versus average transcript count for all detected genes in raw data from a scRNA-seq experiment in ISCs. Black dots and red dots indicate true genes and spike-ins, respectively. B. Predicted CV of transcript counts versus predicted average transcript count for all detected genes after removing technical noise with the help of spike-ins.
Supplementary figure 19.
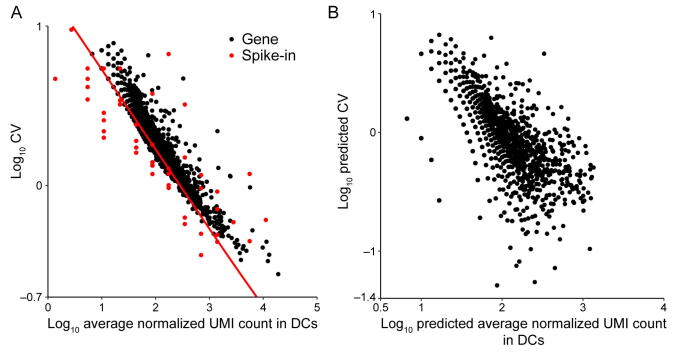
Noise quantification and normalization for transcripts in DCs. A. CV of transcript counts versus average transcript count for all detected genes in raw data from a scRNA-seq experiment in DCs. Black dots and red dots indicate true genes and spike-ins, respectively. B. Predicted CV of transcript counts versus predicted average transcript count for all detected genes after removing technical noise with the help of spike-ins.
Supplementary figure 20.
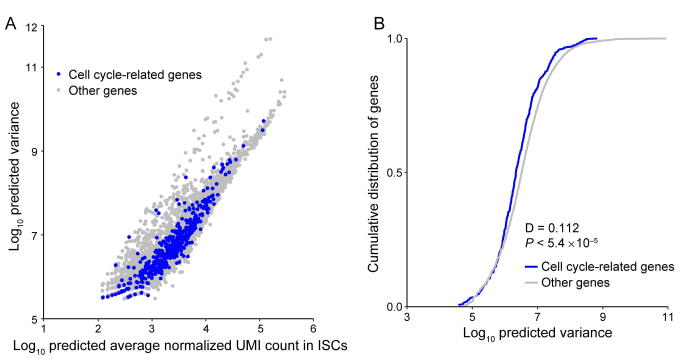
Comparison of variance between cell cycle-related genes and other genes for mouse embryonic stem cells. A. The predicted variance of transcript count versus mean transcript counts across the entire detected genes for mESCs. Cell cycle related genes are highlighted as blue circles. This set of genes consist of all genes containing the “cell cycle” term in whole Gene Ontology terms of “biological process”. B. Compared to the predicted variance cumulative distribution of cell cycle related genes with other genes, cell cycle related genes did not show increased variability and were thus not to lead to false results in the downstream noise analysis.
Supplementary figure 21.
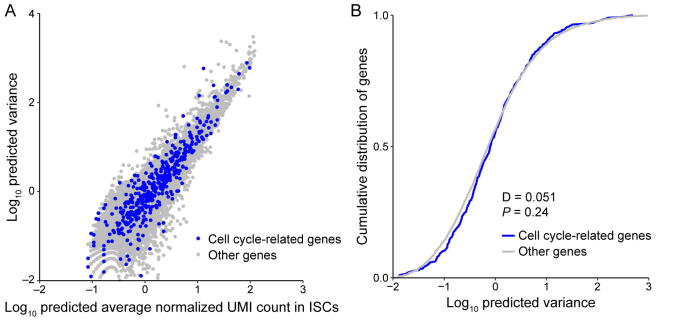
Comparison of variance between cell cycle related genes and other genes for ISCs. A. The predicted variance of transcript count versus mean transcript counts across the entire detected genes for ISCs. Cell cycle related genes are highlighted as blue circles. This set of genes consist of all genes containing the “cell cycle” term in whole Gene Ontology terms of “biological process”. B. Compared to the predicted variance cumulative distribution of cell cycle related genes with other genes, cell cycle related genes did not show increased variability and were thus not to lead to false results in the downstream noise analysis.
Supplementary figure 22.
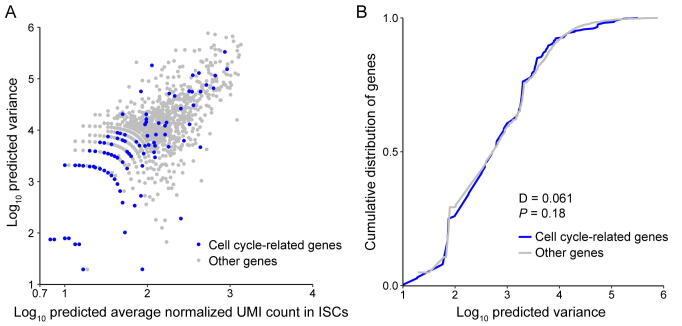
Comparison of variance between cell cycle related genes and other genes for DCs. A. The predicted variance of transcript count versus mean transcript counts across the entire detected genes for DCs. Cell cycle related genes are highlighted as blue circles. This set of genes consist of all genes containing the “cell cycle” term in whole Gene Ontology terms of “biological process”. B. Compared to the predicted variance cumulative distribution of cell cycle related genes with other genes, cell cycle related genes did not show increased variability and were thus not to lead to false results in the downstream noise analysis.
Supplementary figure 23.
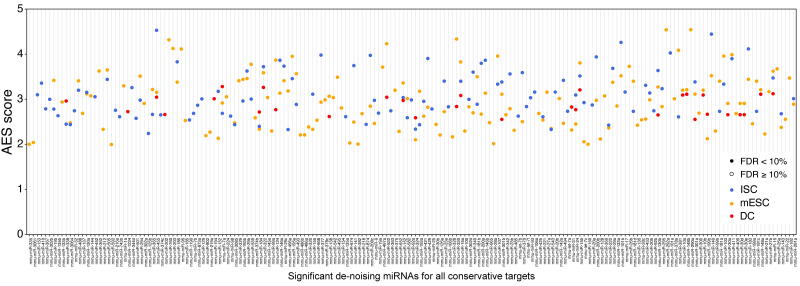
The significant de-noising miRNAs for all conservative targets. Define the miRNA target genes as all conserved miRNA targets; 149, 108, 30 miRNAs with significant positive AES scores were identified in mESCs, ISCs, and DCs, respectively.
Supplementary figure 24.
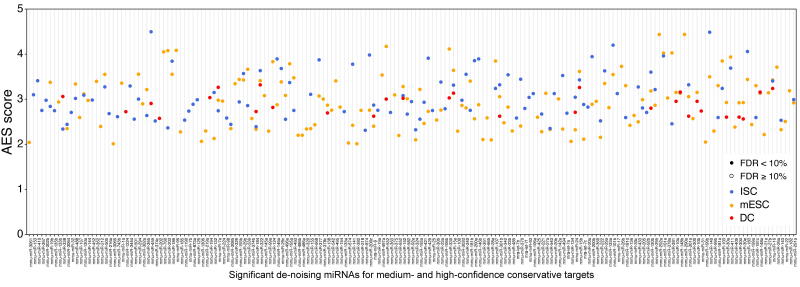
The significant de-noising miRNAs for medium- and high-confidence conservative targets. Define the miRNA target genes as the conserved targets whose cumulative context score ++ larger than 30%; 145, 108, and 29 miRNAs with significant positive AES scores were identified in mESCs, ISCs, and DCs, respectively.
Supplementary figure 25.
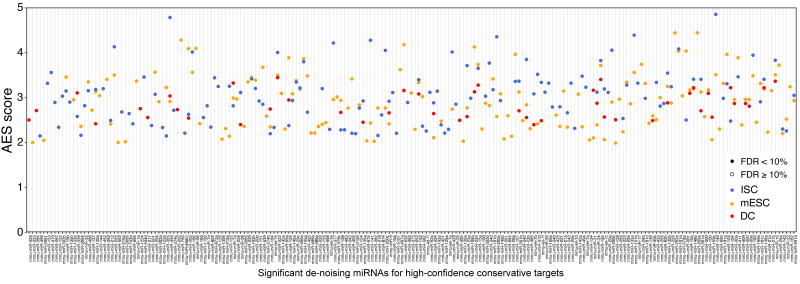
The significant de-noising miRNAs for high-confidence conservative targets. Define the miRNA target genes as conserved miRNA targets whose cumulative context score ++ is larger than 60%; 150, 132, and 46 miRNAs with significant positive AES scores were identified in mESCs, ISCs, and DCs, respectively.
Details of the theoretical analysis.
References
- 1.Munsky B., Neuert G., van Oudenaarden A. Using gene expression noise to understand gene regulation. Science. 2012;336:183–187. doi: 10.1126/science.1216379. [DOI] [PMC free article] [PubMed] [Google Scholar]
- 2.Swain P.S., Elowitz M.B., Siggia E.D. Intrinsic and extrinsic contributions to stochasticity in gene expression. Proc Natl Acad Sci U S A. 2002;99:12795–12800. doi: 10.1073/pnas.162041399. [DOI] [PMC free article] [PubMed] [Google Scholar]
- 3.Elowitz M.B., Levine A.J., Siggia E.D., Swain P.S. Stochastic gene expression in a single cell. Science. 2002;297:1183–1186. doi: 10.1126/science.1070919. [DOI] [PubMed] [Google Scholar]
- 4.Eldar A., Elowitz M.B. Functional roles for noise in genetic circuits. Nature. 2010;467:167–173. doi: 10.1038/nature09326. [DOI] [PMC free article] [PubMed] [Google Scholar]
- 5.Del Giudice M., Bo S., Grigolon S., Bosia C., van Nimwegen E. On the role of extrinsic noise in microRNA-mediated bimodal gene expression. PLoS Comput Biol. 2018;14:e1006063. doi: 10.1371/journal.pcbi.1006063. [DOI] [PMC free article] [PubMed] [Google Scholar]
- 6.Janes K. Cell-to-cell transcript variability: seeing signal in the noise. Cell. 2015;163:1566–1568. doi: 10.1016/j.cell.2015.12.010. [DOI] [PMC free article] [PubMed] [Google Scholar]
- 7.Yang Z., Wu X., Yang N., Liu F. Noise transmission during the dynamic pattern formation in fly embryos. Quant Biol. 2018;6:15–29. [Google Scholar]
- 8.Battich N., Stoeger T., Pelkmans L. Control of transcript variability in single mammalian cells. Cell. 2015;163:1596–1610. doi: 10.1016/j.cell.2015.11.018. [DOI] [PubMed] [Google Scholar]
- 9.Hoffman Y., Pilpel Y. MicroRNAs silence the noisy genome. Science. 2015;348:41–42. doi: 10.1126/science.aaa9841. [DOI] [PubMed] [Google Scholar]
- 10.Seitz H. Redefining microRNA targets. Curr Biol. 2009;19:870–873. doi: 10.1016/j.cub.2009.03.059. [DOI] [PubMed] [Google Scholar]
- 11.Schmiedel J.M., Klemm S.L., Zheng Y., Sahay A., Blüthgen N., Marks D.S., et al. MicroRNA control of protein expression noise. Science. 2015;348:128–132. doi: 10.1126/science.aaa1738. [DOI] [PubMed] [Google Scholar]
- 12.Siciliano V., Garzilli I., Fracassi C., Criscuolo S., Ventre S., di Bernardo D. miRNAs confer phenotypic robustness to gene networks by suppressing biological noise. Nat Commun. 2013;4:1–7. doi: 10.1038/ncomms3364. [DOI] [PMC free article] [PubMed] [Google Scholar]
- 13.Wu W. MicroRNA, noise, and gene expression regulation. Methods Mol Biol. 2018;1699:91–96. doi: 10.1007/978-1-4939-7435-1_7. [DOI] [PubMed] [Google Scholar]
- 14.Ebert M., Sharp P. Roles for microRNAs in conferring robustness to biological processes. Cell. 2012;149:515–524. doi: 10.1016/j.cell.2012.04.005. [DOI] [PMC free article] [PubMed] [Google Scholar]
- 15.Martirosyan A., De Martino A., Pagnani A., Marinari E. ceRNA crosstalk stabilizes protein expression and affects the correlation pattern of interacting proteins. Sci Rep. 2017;7:1–11. doi: 10.1038/srep43673. [DOI] [PMC free article] [PubMed] [Google Scholar]
- 16.Blake W.J., Kaern M., Cantor C.R., Collins J.J. Noise in eukaryotic gene expression. Nature. 2003;422:633–637. doi: 10.1038/nature01546. [DOI] [PubMed] [Google Scholar]
- 17.Kærn M., Elston T.C., Blake W.J., Collins J.J. Stochasticity in gene expression: from theories to phenotypes. Nat Rev Genet. 2005;6:451–464. doi: 10.1038/nrg1615. [DOI] [PubMed] [Google Scholar]
- 18.Thattai M., van Oudenaarden A. Intrinsic noise in gene regulatory networks. Proc Natl Acad Sci U S A. 2001;98:8614–8619. doi: 10.1073/pnas.151588598. [DOI] [PMC free article] [PubMed] [Google Scholar]
- 19.Tay Y., Rinn J., Pandolfi P.P. The multilayered complexity of ceRNA crosstalk and competition. Nature. 2014;505:344–352. doi: 10.1038/nature12986. [DOI] [PMC free article] [PubMed] [Google Scholar]
- 20.Bosson A., Zamudio J., Sharp P. Endogenous miRNA and target concentrations determine susceptibility to potential ceRNA competition. Mol Cell. 2014;56:347–359. doi: 10.1016/j.molcel.2014.09.018. [DOI] [PMC free article] [PubMed] [Google Scholar]
- 21.Raj A., van den Bogaard P., Rifkin S.A., van Oudenaarden A., Tyagi S. Imaging individual mRNA molecules using multiple singly labeled probes. Nat Methods. 2008;5:877–879. doi: 10.1038/nmeth.1253. [DOI] [PMC free article] [PubMed] [Google Scholar]
- 22.Stegle O., Teichmann S.A., Marioni J.C. Computational and analytical challenges in single-cell transcriptomics. Nat Rev Genet. 2015;16:133–145. doi: 10.1038/nrg3833. [DOI] [PubMed] [Google Scholar]
- 23.Li X, Chen W, Chen Y, Zhang X, Gu J, Zhang MQ. Network embedding-based representation learning for single cell RNA-seq data. Nucleic Acids Res 2017;45:e166. [DOI] [PMC free article] [PubMed]
- 24.Kim J.K., Kolodziejczyk A.A., Ilicic T., Teichmann S.A., Marioni J.C. Characterizing noise structure in single-cell RNA-seq distinguishes genuine from technical stochastic allelic expression. Nat Commun. 2015;6:8687. doi: 10.1038/ncomms9687. [DOI] [PMC free article] [PubMed] [Google Scholar]
- 25.Wang J., Huang M.o., Torre E., Dueck H., Shaffer S., Murray J., et al. Gene expression distribution deconvolution in single-cell RNA sequencing. Proc Natl Acad Sci U S A. 2018;115:E6437–E6446. doi: 10.1073/pnas.1721085115. [DOI] [PMC free article] [PubMed] [Google Scholar]
- 26.Miao Z, Deng K, Wang X, Zhang X. DEsingle for detecting three types of differential expression in single-cell RNA-seq data. Bioinformatics 2018;1:3223–4. [DOI] [PubMed]
- 27.Huang M., Wang J., Torre E., Dueck H., Shaffer S., Bonasio R., et al. SAVER: gene expression recovery for single-cell RNA sequencing. Nat Methods. 2018;15:539–542. doi: 10.1038/s41592-018-0033-z. [DOI] [PMC free article] [PubMed] [Google Scholar]
- 28.Faure A.J., Schmiedel J.M., Lehner B. Systematic analysis of the determinants of gene expression noise in embryonic stem cells. Cell Syst. 2017;5:471–484.e4. doi: 10.1016/j.cels.2017.10.003. [DOI] [PubMed] [Google Scholar]
- 29.Li H., Lai P., Jia J., Song Y., Xia Q., Huang K., et al. RNA helicase DDX5 inhibits reprogramming to pluripotency by miRNA-based repression of RYBP and its PRC1-dependent and-independent functions. Cell Stem Cell. 2017;20:462–477.e6. doi: 10.1016/j.stem.2016.12.002. [DOI] [PubMed] [Google Scholar]
- 30.Baek D., Villén J., Shin C., Camargo F.D., Gygi S.P., Bartel D.P. The impact of microRNAs on protein output. Nature. 2008;455:64–71. doi: 10.1038/nature07242. [DOI] [PMC free article] [PubMed] [Google Scholar]
- 31.Krek A., Grün D., Poy M.N., Wolf R., Rosenberg L., Epstein E.J., et al. Combinatorial microRNA target predictions. Nat Genet. 2005;37:495–500. doi: 10.1038/ng1536. [DOI] [PubMed] [Google Scholar]
- 32.Vejnar CE, Zdobnov EM. MiRmap: comprehensive prediction of microRNA target repression strength. Nucleic Acids Res 2012;40:11673–83. [DOI] [PMC free article] [PubMed]
- 33.Bosia C., Sgrò F., Conti L., Baldassi C., Brusa D., Cavallo F., et al. RNAs competing for microRNAs mutually influence their fluctuations in a highly non-linear microRNA-dependent manner in single cells. Genome Biol. 2017;18:37. doi: 10.1186/s13059-017-1162-x. [DOI] [PMC free article] [PubMed] [Google Scholar]
- 34.Wei L., Yuan Y., Hu T., Li S., Cheng T., Lei J., et al. Regulation by competition: a hidden layer of gene regulatory network. Quant Biol. 2019;7:110–121. [Google Scholar]
- 35.Denzler R., McGeary S., Title A., Agarwal V., Bartel D., Stoffel M. Impact of microRNA levels, target-site complementarity, and cooperativity on competing endogenous RNA-regulated gene expression. Mol Cell. 2016;64:565–579. doi: 10.1016/j.molcel.2016.09.027. [DOI] [PMC free article] [PubMed] [Google Scholar]
- 36.Wu B., Li C., Zhang P., Yao Q., Wu J., Han J., et al. Dissection of miRNA–miRNA interaction in esophageal squamous cell carcinoma. PLoS ONE. 2013;8:e73191. doi: 10.1371/journal.pone.0073191. [DOI] [PMC free article] [PubMed] [Google Scholar]
- 37.Xu J, Li CX, Li YS, Lv JY, Ma Y, Shao TT, et al. miRNA–miRNA synergistic network: construction via co-regulating functional modules and disease miRNA topological features. Nucleic Acids Res 2011;39:825–36. [DOI] [PMC free article] [PubMed]
- 38.Pons P, Latapy M. Computing communities in large networks using random walks. International Symposium on Computer and Information Sciences 2005:284–93.
- 39.Heine M.H. Distance between sets as an objective measure of retrieval effectiveness. Inf Stor Ret. 1973;9:181–198. [Google Scholar]
- 40.Pedraza J.M., Paulsson J. Effects of molecular memory and bursting on fluctuations in gene expression. Science. 2008;319:339–343. doi: 10.1126/science.1144331. [DOI] [PubMed] [Google Scholar]
- 41.Raser J.M., O'Shea E.K. Noise in gene expression: origins, consequences, and control. Science. 2005;309:2010–2013. doi: 10.1126/science.1105891. [DOI] [PMC free article] [PubMed] [Google Scholar]
- 42.Friedel CC, Dölken L, Ruzsics Z, Koszinowski UH, Zimmer R. Conserved principles of mammalian transcriptional regulation revealed by RNA half-life. Nucleic Acids Res 2009;37:e115. [DOI] [PMC free article] [PubMed]
- 43.Yuan Y., Liu B., Xie P., Zhang M.Q., Li Y., Xie Z., et al. Model-guided quantitative analysis of microRNA-mediated regulation on competing endogenous RNAs using a synthetic gene circuit. Proc Natl Acad Sci U S A. 2015;112:3158–3163. doi: 10.1073/pnas.1413896112. [DOI] [PMC free article] [PubMed] [Google Scholar]
- 44.Lei J. Stochasticity in single gene expression with both intrinsic noise and fluctuation in kinetic parameters. J Theor Biol. 2009;256:485–492. doi: 10.1016/j.jtbi.2008.10.028. [DOI] [PubMed] [Google Scholar]
- 45.Li Y., Jiang Y., Chen H., Liao W., Li Z., Weiss R., et al. Modular construction of mammalian gene circuits using TALE transcriptional repressors. Nat Chem Biol. 2015;11:207–213. doi: 10.1038/nchembio.1736. [DOI] [PMC free article] [PubMed] [Google Scholar]
- 46.Hu W.E., Zhang X., Guo Q.F., Yang J.W., Yang Y., Wei S.C., et al. HeLa-CCL2 cell heterogeneity studied by single-cell DNA and RNA sequencing. PLoS ONE. 2019;14:e0225466. doi: 10.1371/journal.pone.0225466. [DOI] [PMC free article] [PubMed] [Google Scholar]
- 47.Schmiedel JM, Marks DS, Lehner B, Blüthgen N. Noise control is a primary function of microRNAs and post-transcriptional regulation. bioRxiv 2017;168641.
- 48.Li X., Cassidy J.J., Reinke C.A., Fischboeck S., Carthew R.W. A microRNA imparts robustness against environmental fluctuation during development. Cell. 2009;137:273–282. doi: 10.1016/j.cell.2009.01.058. [DOI] [PMC free article] [PubMed] [Google Scholar]
- 49.Mehta A., Baltimore D. MicroRNAs as regulatory elements in immune system logic. Nat Rev Immunol. 2016;16:279–294. doi: 10.1038/nri.2016.40. [DOI] [PubMed] [Google Scholar]
- 50.Kasper D.M., Moro A., Ristori E., Narayanan A., Hill-Teran G., Fleming E., et al. MicroRNAs establish uniform traits during the architecture of vertebrate embryos. Dev Cell. 2017;40:552–565.e5. doi: 10.1016/j.devcel.2017.02.021. [DOI] [PMC free article] [PubMed] [Google Scholar]
- 51.Chen Y, Shen Y, Lin P, Tong D, Zhao Y, Allesina S, et al. Gene regulatory network stabilized by pervasive weak repressions: microRNA functions revealed by the May–Wigner theory. Nat Sci Rev 2019;16:1176–88. [DOI] [PMC free article] [PubMed]
- 52.Selbach M., Schwanhäusser B., Thierfelder N., Fang Z., Khanin R., Rajewsky N. Widespread changes in protein synthesis induced by microRNAs. Nature. 2008;455:58–63. doi: 10.1038/nature07228. [DOI] [PubMed] [Google Scholar]
- 53.Roux J, Gonzalez-Porta M, Robinson-Rechavi M. Comparative analysis of human and mouse expression data illuminates tissue-specific evolutionary patterns of miRNAs. Nucleic Acids Res 2012;40:5890–900. [DOI] [PMC free article] [PubMed]
- 54.Landgraf P., Rusu M., Sheridan R., Sewer A., Iovino N., Aravin A., et al. A mammalian microRNA expression atlas based on small RNA library sequencing. Cell. 2007;129:1401–1414. doi: 10.1016/j.cell.2007.04.040. [DOI] [PMC free article] [PubMed] [Google Scholar]
- 55.Juzenas S, Venkatesh G, Hübenthal M, Hoeppner MP, Du ZG, Paulsen M, et al. A comprehensive, cell specific microRNA catalogue of human peripheral blood. Nucleic Acids Res 2017;45:9290–301. [DOI] [PMC free article] [PubMed]
- 56.Alberti C., Manzenreither R.A., Sowemimo I., Burkard T.R., Wang J., Mahofsky K., et al. Cell-type specific sequencing of microRNAs from complex animal tissues. Nat Methods. 2018;15:283–289. doi: 10.1038/nmeth.4610. [DOI] [PMC free article] [PubMed] [Google Scholar]
- 57.Hagemann-Jensen M., Abdullayev I., Sandberg R., Faridani O.R. Small-seq for single-cell small-RNA sequencing. Nat Protoc. 2018;13:2407–2424. doi: 10.1038/s41596-018-0049-y. [DOI] [PubMed] [Google Scholar]
- 58.Islam S., Zeisel A., Joost S., La Manno G., Zajac P., Kasper M., et al. Quantitative single-cell RNA-seq with unique molecular identifiers. Nat Methods. 2014;11:163–166. doi: 10.1038/nmeth.2772. [DOI] [PubMed] [Google Scholar]
- 59.Jaitin D.A., Kenigsberg E., Keren-Shaul H., Elefant N., Paul F., Zaretsky I., et al. Massively parallel single-cell RNA-seq for marker-free decomposition of tissues into cell types. Science. 2014;343:776–779. doi: 10.1126/science.1247651. [DOI] [PMC free article] [PubMed] [Google Scholar]
- 60.Grün D., Lyubimova A., Kester L., Wiebrands K., Basak O., Sasaki N., et al. Single-cell messenger RNA sequencing reveals rare intestinal cell types. Nature. 2015;525:251–255. doi: 10.1038/nature14966. [DOI] [PubMed] [Google Scholar]
- 61.Su X., Qian C., Zhang Q., Hou J., Gu Y., Han Y., et al. miRNomes of haematopoietic stem cells and dendritic cells identify miR-30b as a regulator of Notch1. Nat Commun. 2013;4 doi: 10.1038/ncomms3903. [DOI] [PMC free article] [PubMed] [Google Scholar]
- 62.Nakaoka T., Saito Y., Shimamoto Y., Muramatsu T., Kimura M., Kanai Y., et al. Cluster microRNAs miR-194 and miR-215 suppress the tumorigenicity of intestinal tumor organoids. Cancer Sci. 2017;108:678–684. doi: 10.1111/cas.13165. [DOI] [PMC free article] [PubMed] [Google Scholar]
- 63.Guo Y., Nie Q., MacLean A.L., Li Y., Lei J., Li S. Multiscale modeling of inflammation-induced tumorigenesis reveals competing oncogenic and oncoprotective roles for inflammation. Cancer Res. 2017;77:6429–6441. doi: 10.1158/0008-5472.CAN-17-1662. [DOI] [PubMed] [Google Scholar]
- 64.Bar-Even A., Paulsson J., Maheshri N., Carmi M., O'Shea E., Pilpel Y., et al. Noise in protein expression scales with natural protein abundance. Nat Genet. 2006;38:636–643. doi: 10.1038/ng1807. [DOI] [PubMed] [Google Scholar]
- 65.Fan J., Salathia N., Liu R., Kaeser G.E., Yung Y.C., Herman J.L., et al. Characterizing transcriptional heterogeneity through pathway and gene set overdispersion analysis. Nat Methods. 2016;13:241–244. doi: 10.1038/nmeth.3734. [DOI] [PMC free article] [PubMed] [Google Scholar]
- 66.Ambros V., Bartel B., Bartel D.P., Burge C.B., Carrington J.C., Chen X., et al. A uniform system for microRNA annotation. RNA. 2003;9:277–279. doi: 10.1261/rna.2183803. [DOI] [PMC free article] [PubMed] [Google Scholar]
- 67.Fromm B, Domanska D, Høye E, Ovchinnikov V, Kang W, Aparicio-Puerta E, et al. MirGeneDB2.0: the metazoan microRNA complement. Nucleic Acids Res 2020;48: D132–41. [DOI] [PMC free article] [PubMed]
- 68.Lewis B.P., Shih I.-H., Jones-Rhoades M.W., Bartel D.P., Burge C.B. Prediction of mammalian microRNA targets. Cell. 2003;115:787–798. doi: 10.1016/s0092-8674(03)01018-3. [DOI] [PubMed] [Google Scholar]
- 69.Lewis B.P., Burge C.B., Bartel D.P. Conserved seed pairing, often flanked by adenosines, indicates that thousands of human genes are microRNA targets. Cell. 2005;120:15–20. doi: 10.1016/j.cell.2004.12.035. [DOI] [PubMed] [Google Scholar]
- 70.Mann H.B., Whitney D.R. On a test of whether one of two random variables is stochastically larger than the other. Ann Math Statist. 1947;18:50–60. [Google Scholar]
- 71.Kelley K., Preacher K.J. On effect size. Psychol Methods. 2012;17:137–152. doi: 10.1037/a0028086. [DOI] [PubMed] [Google Scholar]
- 72.Mason S.J., Graham N.E. Areas beneath the relative operating characteristics (ROC) and relative operating levels (ROL) curves: statistical significance and interpretation. Q J R Meteorol Soc. 2002;128:2145–2166. [Google Scholar]
- 73.Yu G., Wang L.G., Yan G.R., He Q.Y. DOSE: an R/Bioconductor package for disease ontology semantic and enrichment analysis. Bioinformatics. 2014;31:608–609. doi: 10.1093/bioinformatics/btu684. [DOI] [PubMed] [Google Scholar]
- 74.Wei L., Li S., Zhang P., Hu T., Zhang M.Q., Xie Z., et al. Characterizing microRNA-mediated modulation of gene expression noise and its effect on synthetic gene circuits. Cell Rep. 2021;36:109573. doi: 10.1016/j.celrep.2021.109573. [DOI] [PubMed] [Google Scholar]
Associated Data
This section collects any data citations, data availability statements, or supplementary materials included in this article.
Supplementary Materials
Details of the theoretical analysis.


