Abstract
Purpose:
To understand the differences between two optical coherence tomography (OCT) measures of glaucomatous damage: the Bruch’s membrane opening-minimum rim width (BMO-MRW) and circumpapillary retinal nerve fiber layer (cRNFL) thickness.
Materials and Methods:
OCT circle scans were obtained for an early glaucoma group (EG) of 88 eyes (88 patients) with 24–2 MD better than –6.0dB, and a broader group (BG) of 188 eyes (110 patients) with 24–2 MD from −0.15 to −27.0dB. Based upon a commercial report, the cRNFL and BMO-MRW of each hemidisc was classified as abnormal if either of the two superior (inferior) sectors, TS&NS (TI&NI), was yellow or red (p<5%); and as normal if both were green (p≥5%). In addition, a post-hoc analysis identified the reasons for disagreements based on the presence (or absence) of glaucomatous damage at a hemidisc level (consensus of 4 experts).
Results:
The BMO-MRW and cRNFL measures agreed in 81.9% (BG) and 73.9% (EG) of the hemidiscs. In both groups, an Abnormal-BMO-MRW/Normal-cRNFL disagreement was as common as a Normal-BMO-MRW/Abnormal-cRNFL. Of the 46 EG hemidisc disagreements, the number of “mistakes” for BMO-MRW, 28, was non-significantly higher than for cRNFL, 18 (p=0.15). Primary causes for disagreement were: borderline significance level; a local defect; and aberrant blood vessel location.
Conclusions:
While BMO-MRW and cRNFL measures agreed in the majority of hemidiscs, they still disagreed in over 25% of the EG hemidiscs. These measures may be improved by comparing actual probability levels and accounting for blood vessel locations. However, both can miss information available on RGC/RNFL probability maps.
Keywords: glaucoma, BMO-MRW, optical coherence tomography
Précis:
Bruch’s membrane opening-minimum rim width and circumpapillary retinal nerve fiber layer thickness measures may be improved by comparing probability levels and accounting for blood vessel locations.
Introduction
Glaucoma is a progressive optic neuropathy that involves the degeneration of retinal ganglion cells (RGCs) and their axons, which leads to a thinning of the RGC and retinal nerve fiber layers (RNFL). Optical coherence tomography (OCT) imaging allows for the visualization and quantification of the thinning of these layers. While there is general agreement about the utility of OCT in diagnosing and following glaucoma, there is debate as to the best OCT methods and measures to use.
The circumpapillary (c) RNFL thickness was among the first OCT measures of glaucomatous damage. More recently, Burgoyne, Chauhan, and colleagues have argued for a more anatomical and geometrically accurate measure of the neuroretinal rim, a measure that they have called the Bruch’s membrane opening (BMO) - minimum rim width (MRW).1–4 The BMO-MRW is obtained by measuring the minimum distance from the outer border of the BMO to the internal limiting membrane (ILM).
While some studies have suggested that BMO-MRW has better diagnostic accuracy than cRNFL,1–4 others have reported no significant difference between the two methods for the detection of glaucomatous damage.5–8 More recent studies, however, have suggested that the best method involves some combination of the two measures.9,10
The fact that combining BMO-MRW and cRNFL measures improves sensitivity suggests that these measures, at least in part, are detecting different aspects of glaucomatous damage. In fact, we have observed that the false negatives for these measures are, in general, different.11 To better understand the difference between the BMO-MRW and cRNFL measures, we topographically compared them at the level of the hemidisc and assessed the possible reasons for disagreement between them. The implications for improving detection with these measures are considered in the Discussion.
Materials and Methods
Participants
Structural (OCT) and functional (VF) data were obtained from patients recruited from two longitudinal observational studies.
The early glaucoma group (EG) consisted of 88 eyes from 88 participants whose diagnoses were based upon the referring clinician’s interpretation of all the information available to her/him. They are called “Early” as the mean deviation (MD) of the 24–2 visual field was better than −6.0 dB. All participants had open angles. These eyes were part of Columbia University’s Macular Damage in Early Glaucoma and Progression (ClinicalTrials.gov Identifier: NCT02547740). These 88 eyes were selected from a larger group of 133 eyes, after excluding the healthy controls.
The second group, a broadly inclusive group (BG), consisted of 188 eyes from 110 patients, selected from a larger group of 212 patients referred for research in OCT testing by one of the authors (R.R.). They were diagnosed as glaucomatous or glaucoma suspect based upon the referring physician’s interpretation of all available information. The group was called “Broadly” inclusive since the 24–2 MD of this group ranged from −0.15 to −27.0 dB.7 The 24 eyes excluded had visual acuity worse than 20/40, or other ocular problems that could affect OCT scan quality (e.g., chorioretinal scars, optic head drusen, central retinal vein occlusion, macular drusen).
All EG and BG participants underwent testing that included 24–2 and 10–2 VF tests with SITA-standard protocol (Carl Zeiss Meditec, Inc., Dublin,CA, USA) and high-resolution spectral-domain (Heidelberg Engineering, Inc., Heidelberg, Germany) OCT scans using the Glaucoma Module Premium Edition (GMPE). Prior to imaging, standard keratometry values for each patient were collected using an automated biometry instrument (Zeiss IOL Master, Carl Zeiss Meditec AG., Jena, Germany). The corneal curvature of each eye was then entered into the instrument database, and during imaging, the technician adjusted for axial length, in order to ensure accurate scaling of the measurements. For the purposes of this study, only the circle and radial scans were considered. While all eyes were tested over a period of time, only tests from the baseline visits were used for the primary analysis of agreement. Additionally, though patients were diagnosed by their referring physician, these diagnoses were ultimately not used in the post-hoc assessment of damage on a hemidisc level.
The Institutional Review Boards of Columbia University and the New York Eye and Ear Infirmary of Mount Sinai approved this study, which adhered to the tenets of the Declaration of Helsinki and the Health Insurance Portability and Accountability Act. Written informed consent was obtained from all participants.
Structural (OCT) Imaging
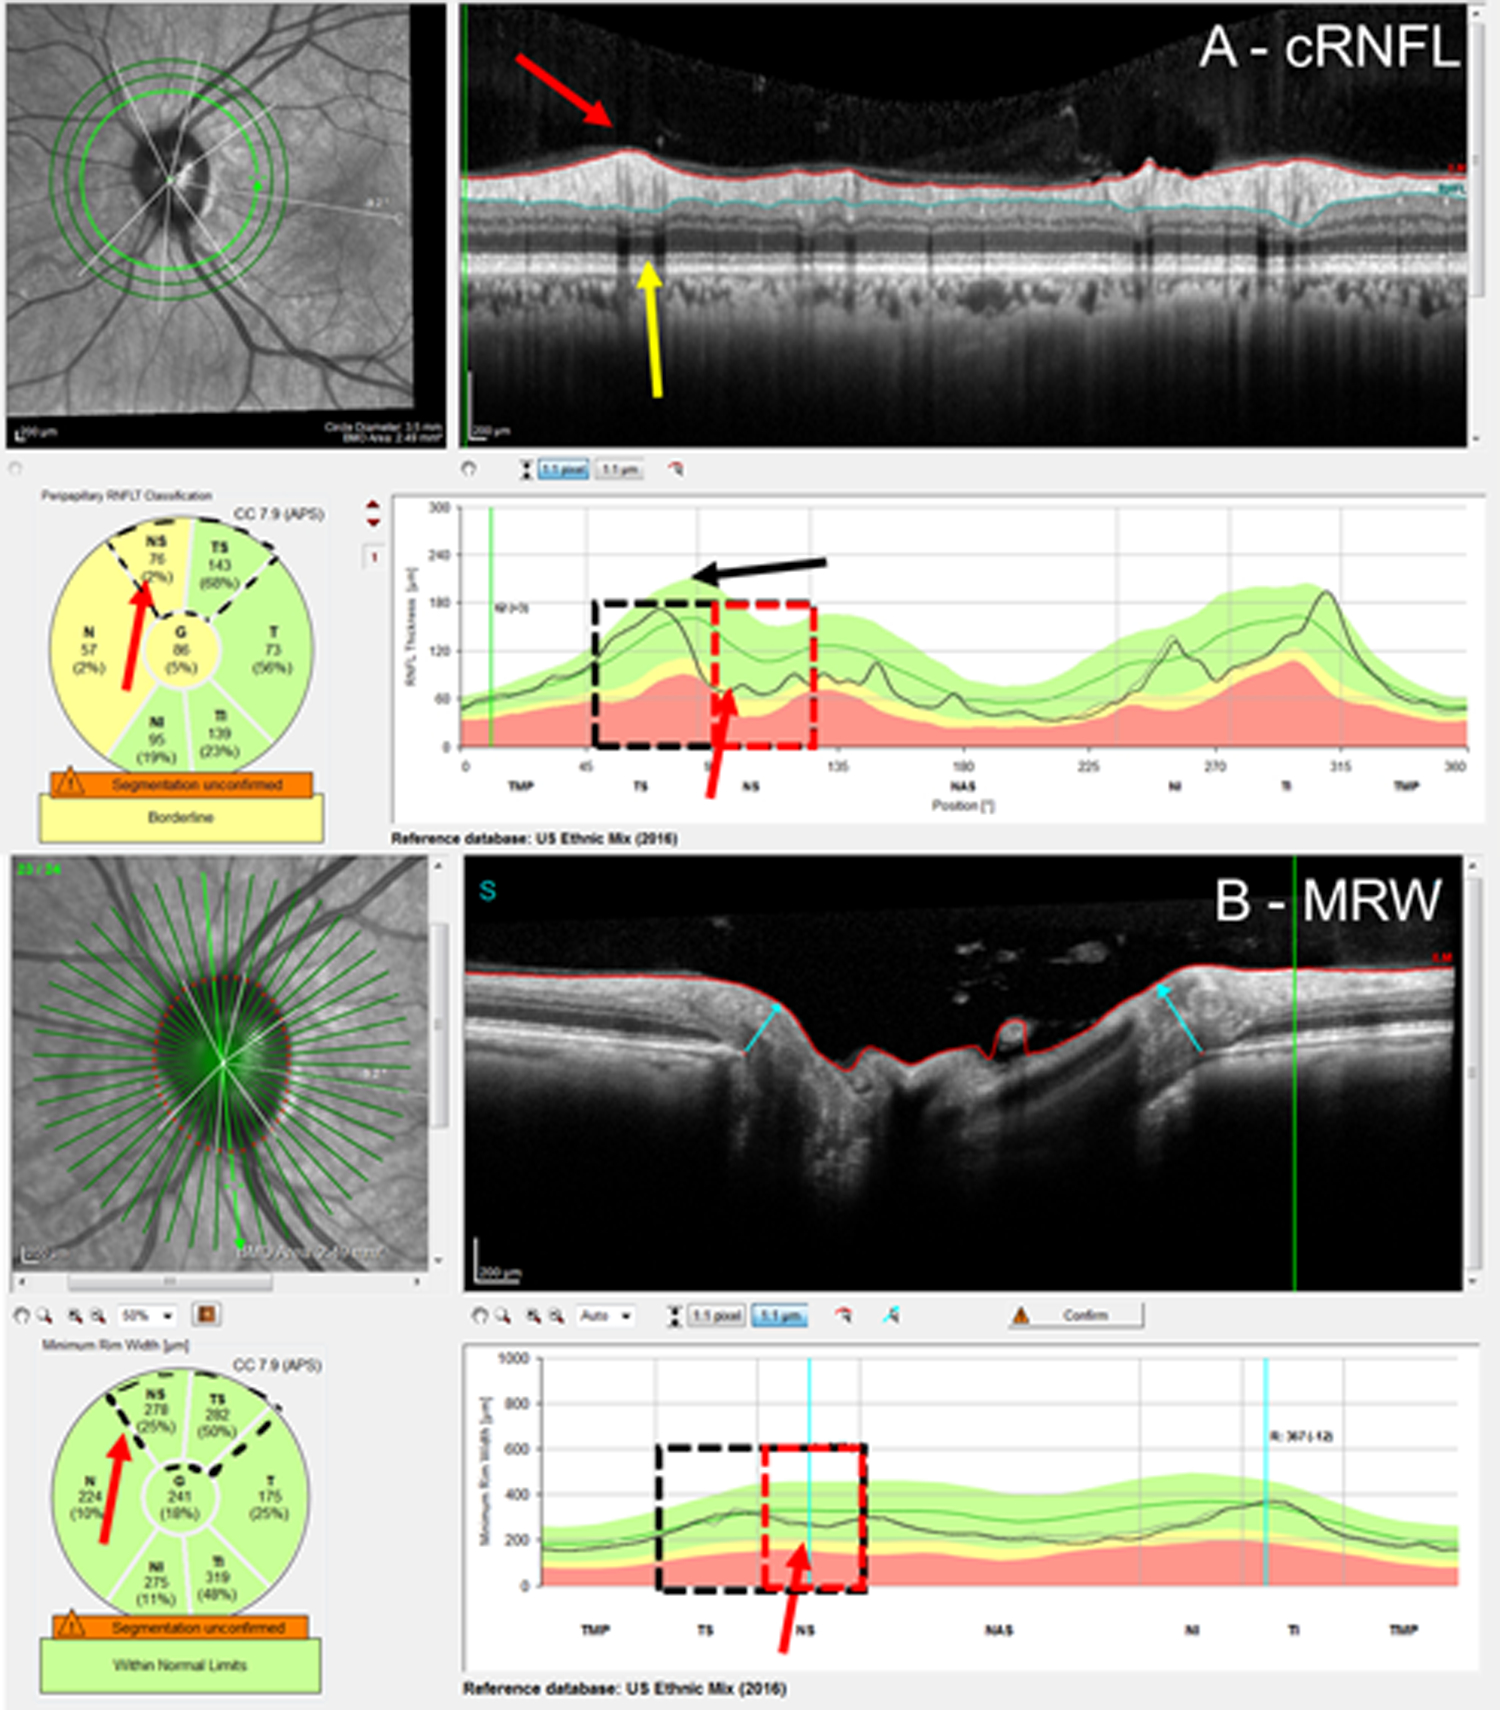
To assess the cRNFL thickness and the BMO-MRW, the pie charts on the commercial reports were used (Figure 1). In particular, the pie chart in the cRNFL report (Fig. 1A, black arrow) depends upon the information derived from the conventional 3.5 mm circle scan and indicates the average thicknesses of the cRNFL in the six sectors around the optic disc. The pie chart in the BMO-MRW report (Fig. 1B, black arrow) is based upon 24 angularly equidistant radial B-scans and indicates the average thicknesses of BMO-MRW in six sectors around the optic disc.
Figure 1:
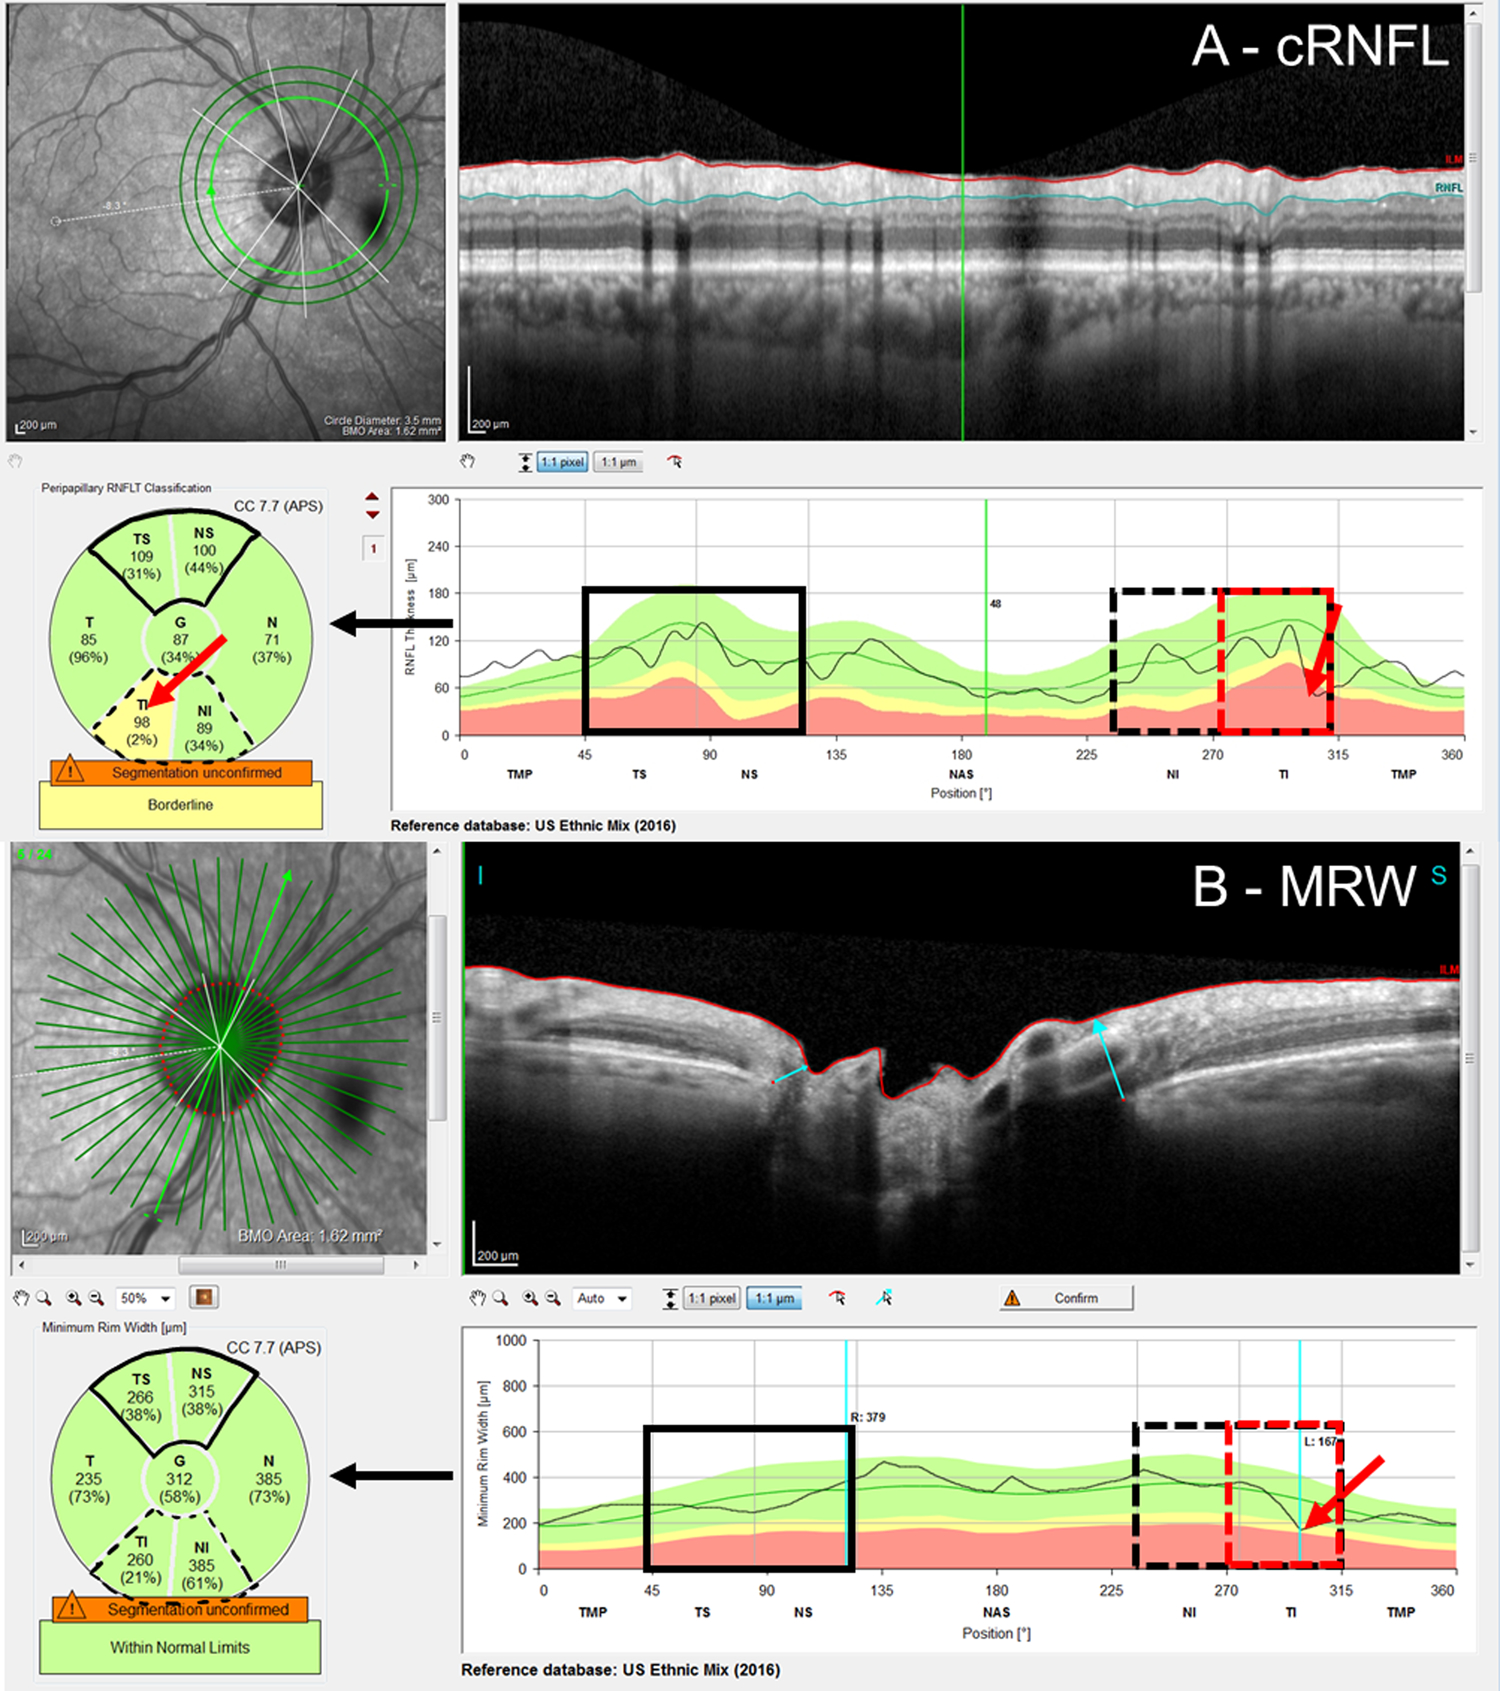
An example of the A) circumpapillary retinal nerve fiber layer (cRNFL) report, and B) Bruch’s membrane opening minimum rim width (BMO-MRW) report for the same eye. The black arrows indicate that the pie charts (lower left of the panels) are based upon the thickness plots in the lower right panels. As eyes were analyzed on a hemidisc basis, the black solid boxes in the superior hemidiscs represent topographic agreement (normal-normal, cRNFL-BMO-MRW), while the black dashed boxes in the inferior hemidisc represent topographic disagreement (abnormal-normal, cRNFL-BMO-MRW). Based upon the reference standard (RS), the inferior hemidisc was abnormal, and the disagreement was then classified as a BMO-MRW false negative (FN) upon post-hoc analysis. The red rectangles indicate the region of disagreement and red arrows, the location of the local defect.
Assessing topographic agreement
The superior hemidisc was defined as the TS and NS sectors (regions marked with solid black in Fig. 1), and the inferior hemidisc was defined as the TI and NI sectors (regions marked with dashed black in Fig. 1). Based upon the pie charts, each superior and inferior hemidisc was classified as abnormal or normal separately for the cRNFL and BMO-MRW measures. For each measure, the superior (or inferior) hemidisc was abnormal if either of the two superior (or inferior) sectors was yellow or red, and as normal if both were green. For the eye in Fig.1, both cRNFL and BMO-MRW were normal for the superior sectors (TS and NS), while the cRNFL was abnormal, but the BMO-MRW was normal, for the inferior sectors (TI and NI).
Further, for each hemidisc, the cRNFL and BMO-MRW measures were said to “topographically agree” if both were abnormal or normal. Therefore, Fig. 1 shows an example of a topographic cRNFL/BMO-MRW agreement (solid black) for the superior hemidisc and disagreement (dashed black) for the inferior hemidisc.
Reference Standard (RS) and post-hoc analysis
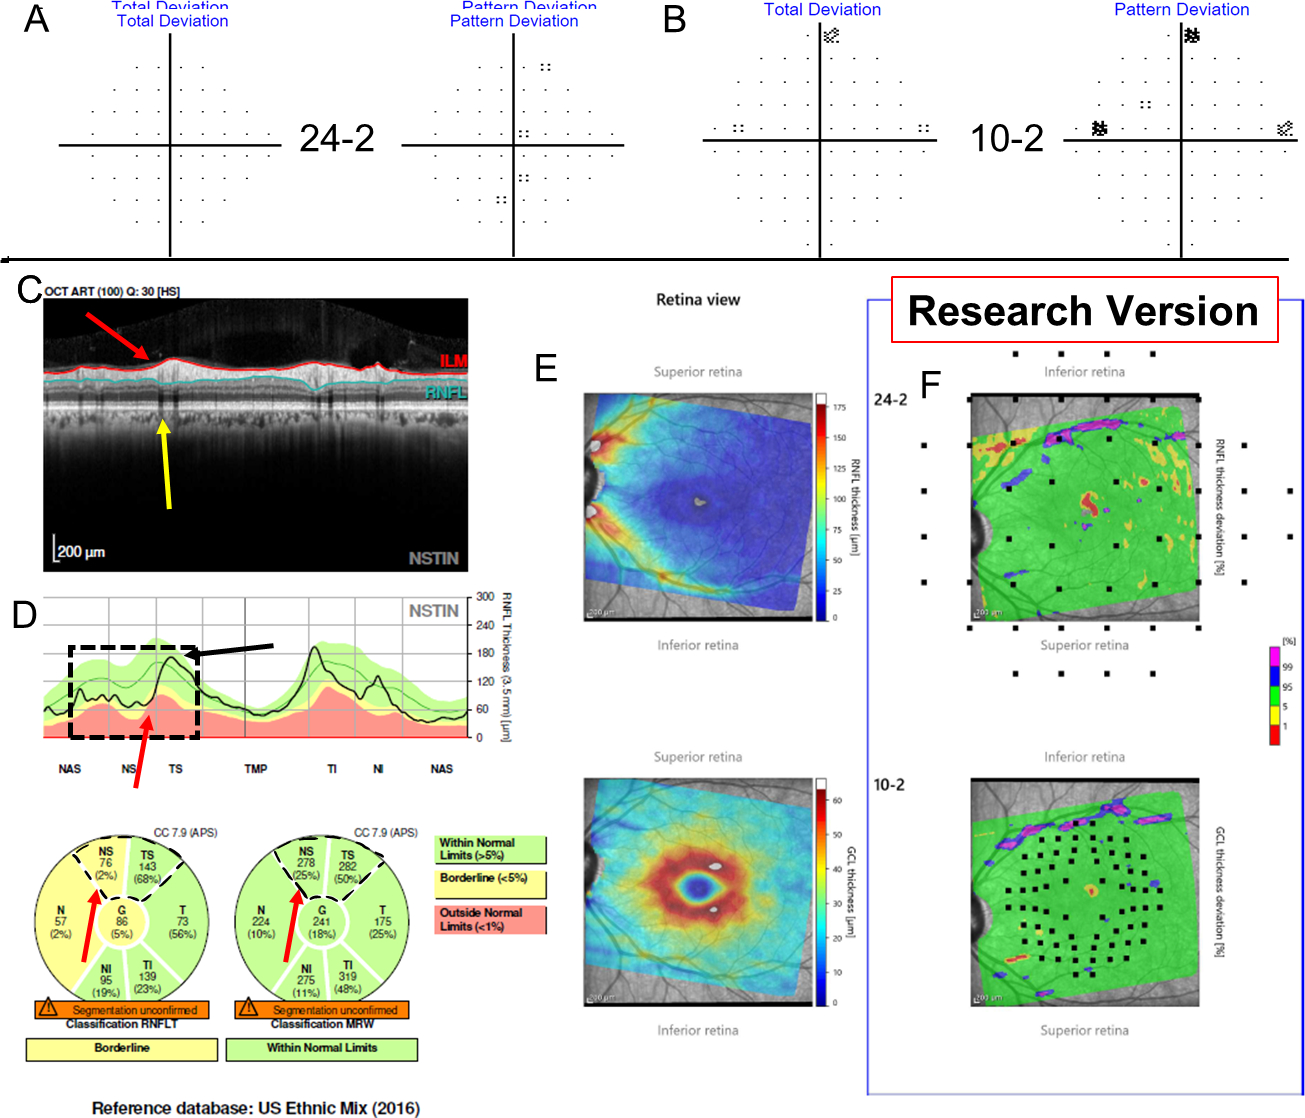
Those EG eyes with topographic disagreement underwent further post-hoc analysis. This analysis made use of the extensive data available for EG eyes and was not restricted to the baseline visit. In particular, for a reference standard (RS) 4 of the authors reviewed the cases together and reached a consensus on the presence (or lack thereof) of glaucomatous damage at a hemidisc level using additional structural (RNFL and RGC thickness and probability maps) and functional (24–2/10–2 visual fields) information, as well as reports of a recently introduced method that combines them (i.e. structure and function) and assesses their agreement.12,13 Based upon this analysis, all hemidiscs for which cRNFL and the BMO-MRW disagreed were classified as either a cRNFL false-positive (FP), a BMO-MRW FP, a cRNFL false-negative (FN), or a BMO-MRW FN. For example, the eye in Fig. 1 was classified as a BMO-MRW FN based upon the information in Fig. 2. Notice that in this case, there is a local defect that was identified by the cRNFL but missed by the BMO-MRW. This defect is easily identified on the thickness (in retina view) and probability maps (in field view) in Fig. 2C.
Figure 2:
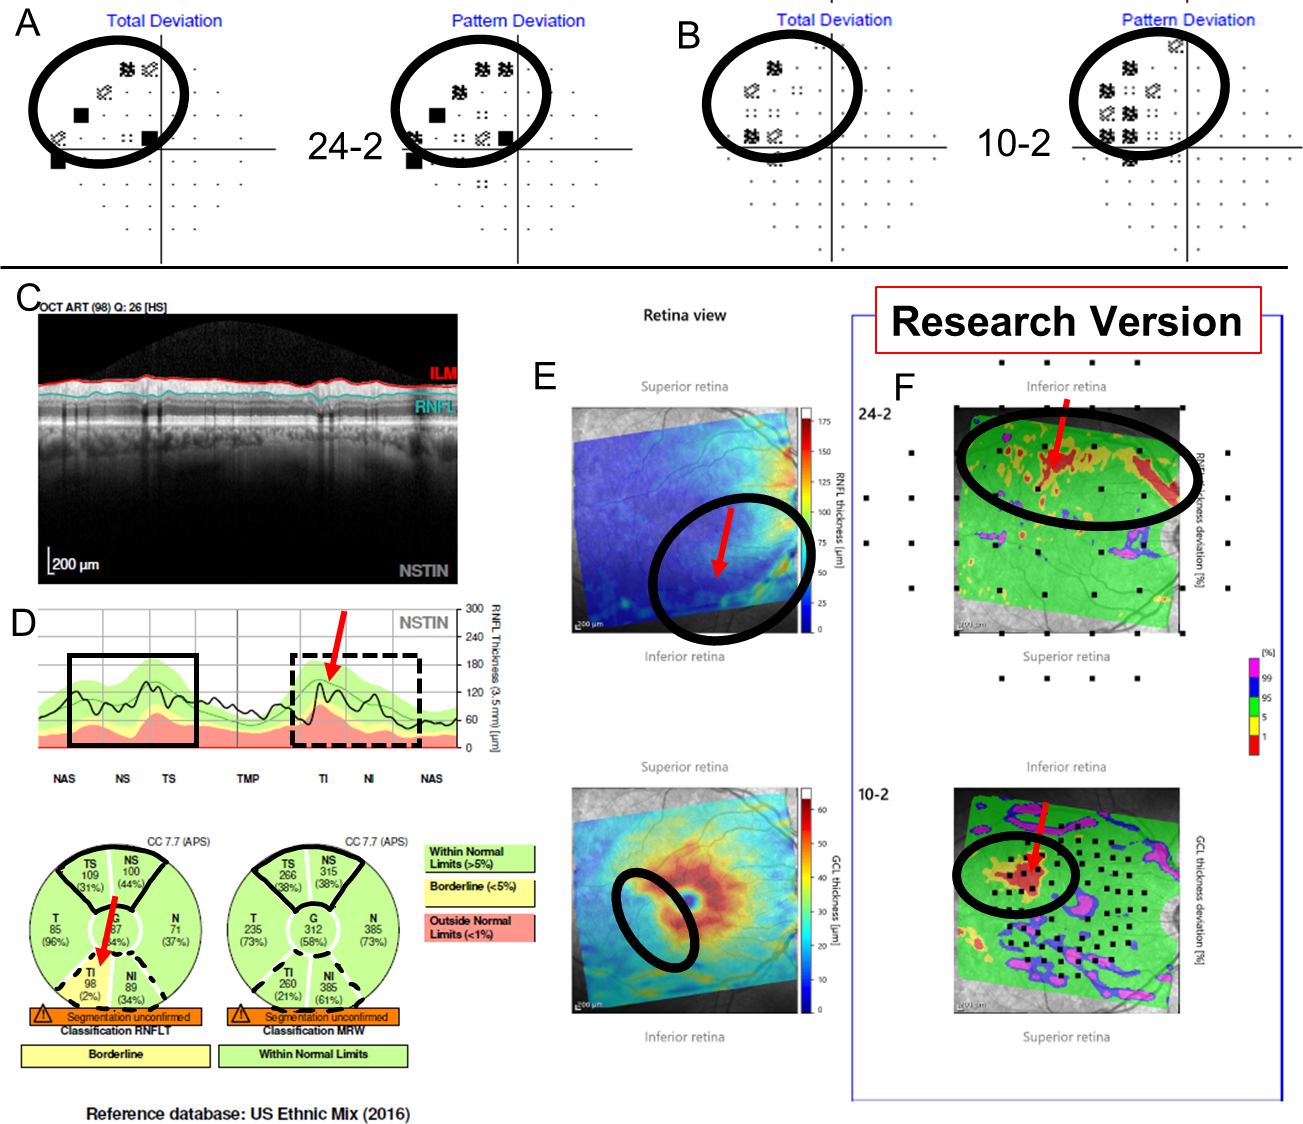
Additional information for Figure 1 shows the Total Deviation (TD) and Pattern Deviation (PD) from the 24–2 (A) and from the 10–2 (B) visual fields (VFs), while (C) shows a research version of a new Spectralis report (Heidelberg Engr. Inc.) that provides the pie charts for the cRNFL and BMO-MRW. Note the cRNFL thickness plot (D) is in the Nasal-Superior-Temporal-Inferior-Nasal (NSTIN) orientation. The thickness maps of the RNFL (E, top) and RGC layer (E, bottom) and their probability maps [RNFL (F, top) and RGC (F, bottom)] in field view are also provided. For more details regarding the structure and benefits of a one-page report, see Ref 16. While the superior hemidisc shows structural agreement, the inferior hemidisc shows structural disagreement. The disagreement was classified as a BMO-MRW FN upon post-hoc analysis, as the RS indicated that the inferior hemidisc was abnormal. Evidence for damage in the inferior hemidisc is outlined in black on the VFs (A and B), as well as on the RGC and RNFL plots (C).
For the FPs and FNs of the EG group, the same four authors then categorized the disagreements based on underlying patterns or reasons for structural discrepancies. All statistical tests mentioned in the Results were performed in R version 3.1.3 (The R Foundation for Statistical Computing, Vienna, Austria).
Results
In general, the agreement between cRNFL and BMO-MRW was good, with 130 (73.9%; Wilson Intervals, 95% CI - lower: 66.9%, upper: 79.8%) of the 176 EG hemidiscs showing cRNFL/BMO-MRW agreement (McNemar’s Test, p=0.88). In the EG group, a Normal-cRNFL/Abnormal-BMO-MRW disagreement was as common as an Abnormal-cRNFL/Normal-BMO-MRW (22 vs. 24 hemidiscs). (Table 1).
Table 1.
The number of EG hemidiscs showing agreement and disagreement for MRW and cRNFL.
| Normal MRW | Abnormal MRW | Total | |
|---|---|---|---|
| Normal cRNFL | 71 agree | 22 disagree | 93 |
| Abnormal cRNFL | 24 disagree | 59 agree | 83 |
| Total | 95 | 81 | 176 |
The BG group was used in order to replicate the results from the EG group. For the BG eyes, cRNFL and BMO-MRW agreed in 308 (81.9%; Wilson Intervals, 95% CI - lower: 77.7%, upper: 85.5%) of the 376 BG hemidiscs. As expected, disagreements were less common in the BG group, as it included a wider range of glaucomatous damage. However, like the EG group, a Normal-cRNFL/Abnormal-BMO-MRW disagreement was as common as an Abnormal-cRNFL/Normal-BMO-MRW disagreement (36 vs. 32 hemidiscs).
Post-hoc analysis of FP and FN (“mistakes”) in EG eyes
To better understand why BMO-MRW and cRNFL disagreed, a reference standard (RS) was used to categorize the hemidiscs as FP or FN, as detailed in the Methods. Of the 46 EG hemidiscs showing disagreements, the number of FP plus FN (i.e., “mistakes”) for BMO-MRW, 28, was higher than that for cRNFL, 18 (Table 2), although the difference was not statistically significant (Fisher’s Exact test, p=0.15). In addition, there were approximately twice as many FNs as there were FPs. To better understand the possible reasons for these FNs/FPs, a post hoc analysis was performed as described in the Methods and three factors were identified.
Table 2.
A summary of the number of FPs and FNs for cRNFL and MRW.
| RNFL | MRW | Total | |
|---|---|---|---|
| FN | 12 | 20 | 32 |
| FP | 6 | 8 | 14 |
| Total | 18 | 28 | 46 |
Significance Level on Border of Normal and Abnormal
For 29 of the 46 hemidiscs, the post hoc analysis indicated that the significance level was borderline in the “wrong” sector. For the purpose of this analysis, we defined borderline as ±3% from the 5% probability. In other words, the cRNFL and BMO-MRW measures would have agreed if there was a minor change (±3%) in percentile ranks for the “wrong” sector. Using this definition, 29 (63.0%) of the 46 disagreements showed a percentile on the “wrong” metric that was on the border of normal and abnormal (FP: 5 cRNFL, 7 BMO-MRW; FN: 6 cRNFL, 11 BMO-MRW).
Local Defect Missed
Local defects can be missed due to averaging over the sector regions. In 14 (30.4%) of the 46 disagreements in the EG group, the post-hoc analysis indicated that a local defect was missed by the summary metrics, leading to false negatives (FN: 8 cRNFL, 6 BMO-MRW). Figure 1 shows an example of a BMO-MRW FN. There is clearly a local defect, which can be seen on the b-scan and cRNFL plots (red arrows in A). This local defect is missed by the BMO-MRW metric (B). (See Fig. 2 for additional evidence.) Figure 3 provides an example of a hemidisc classified as a cRNFL FN. It is clear that the cRNFL missed a local cRNFL defect (red arrow, Fig. 3A). The BMO-MRW was abnormal (red arrow Fig. 3B), although it was borderline and, in the NS, not TS, portion of the superior disc. (see Fig. 4 for additional reports). Local defects missed by one measure but caught by another were nearly as common for the cRNFL, 8 hemidiscs, as they were for the BMO-MRW, 6 hemidiscs.
Figure 3:
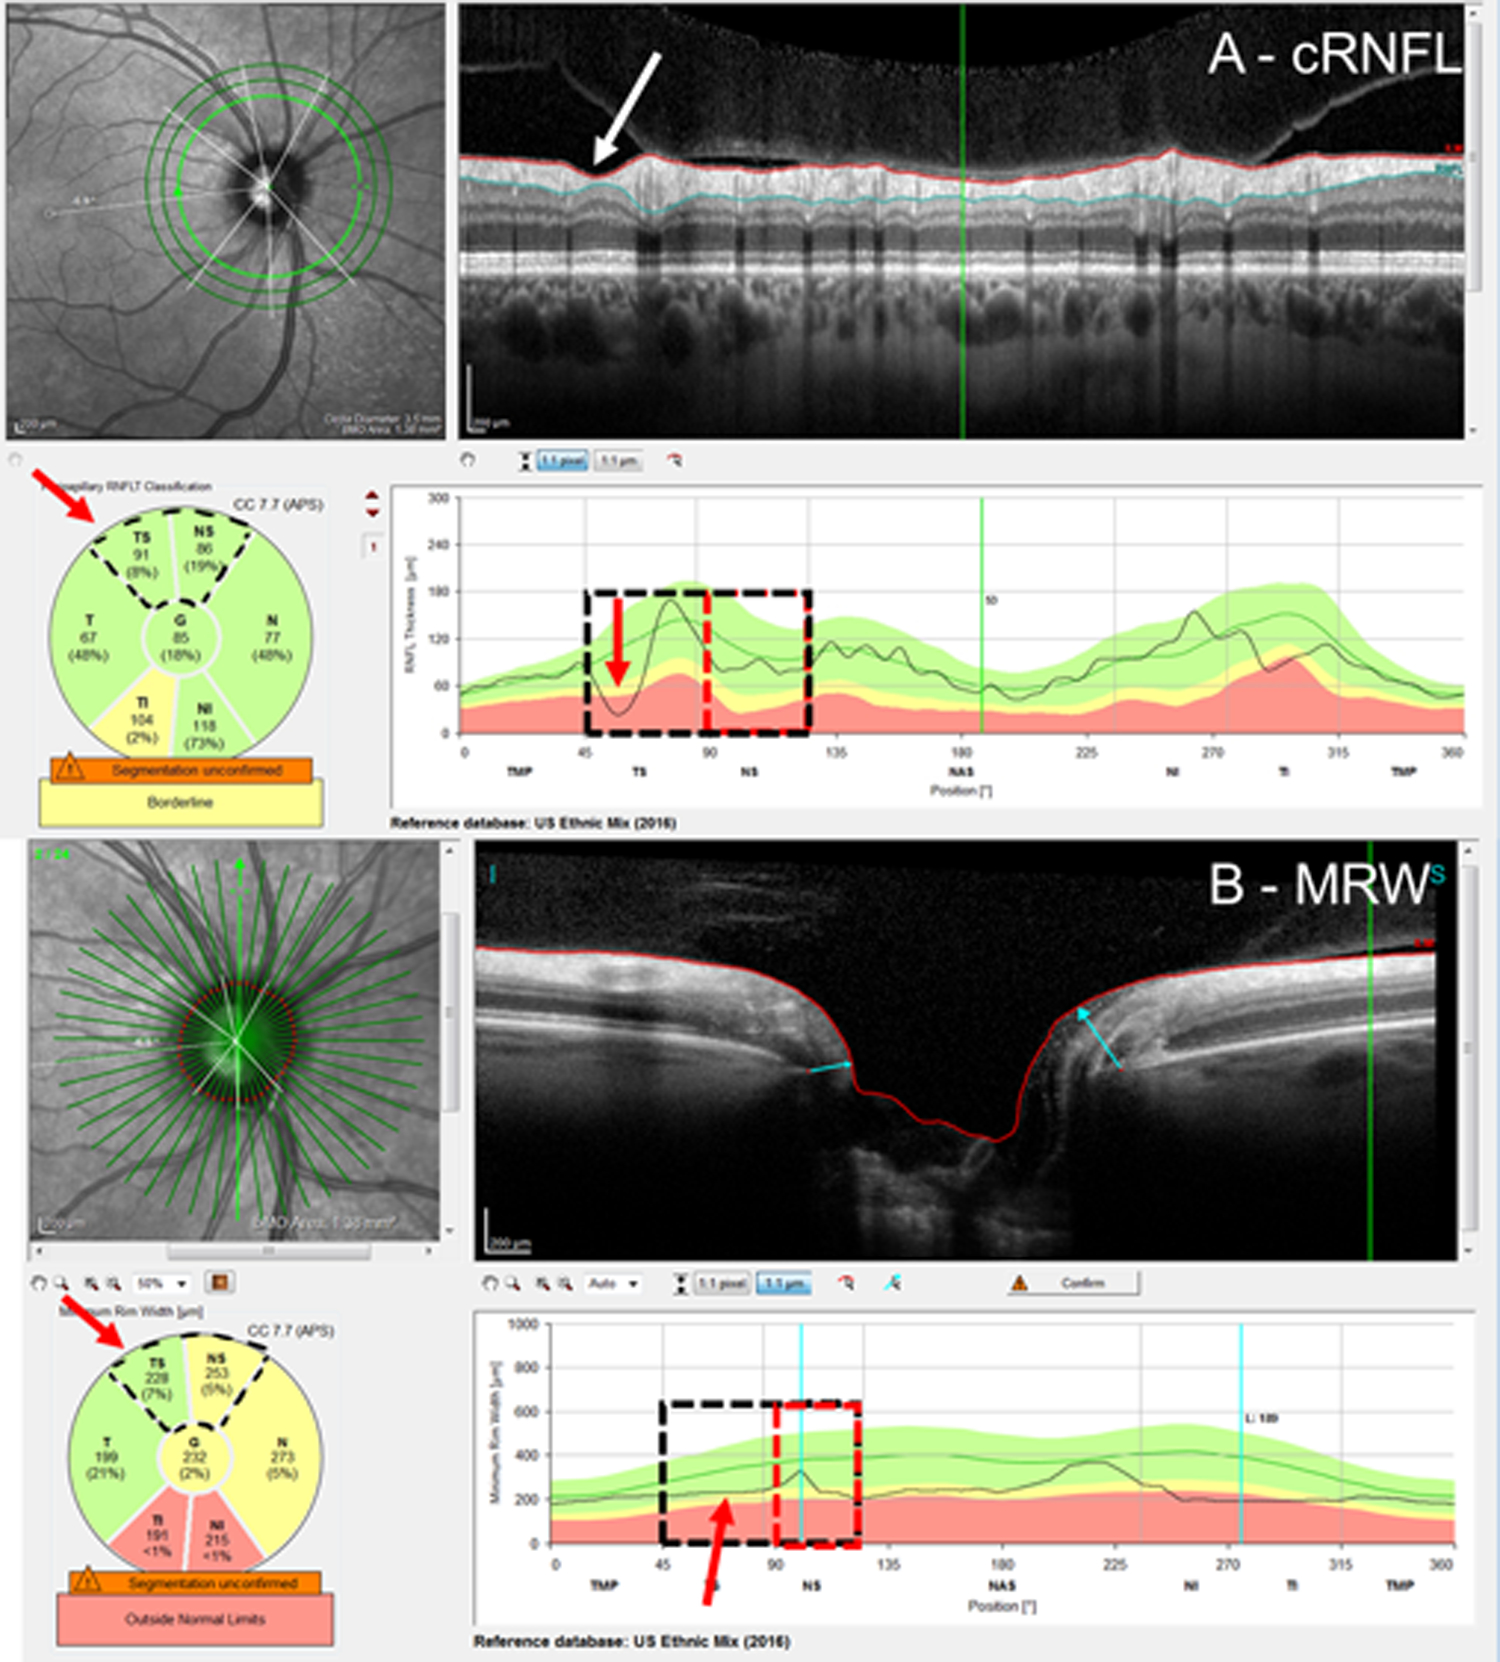
An example of a cRNFL FN attributed to a missed local defect. Based upon the RS, the superior hemidisc was abnormal. The cRNFL report (A) and BMO-MRW report (B) show a clear local defect (red arrows) in the cRNFL and its topographically corresponding region in the BMO-MRW. The red rectangles indicate the region of disagreement and red arrows, the location of the local defect.
Figure 4:
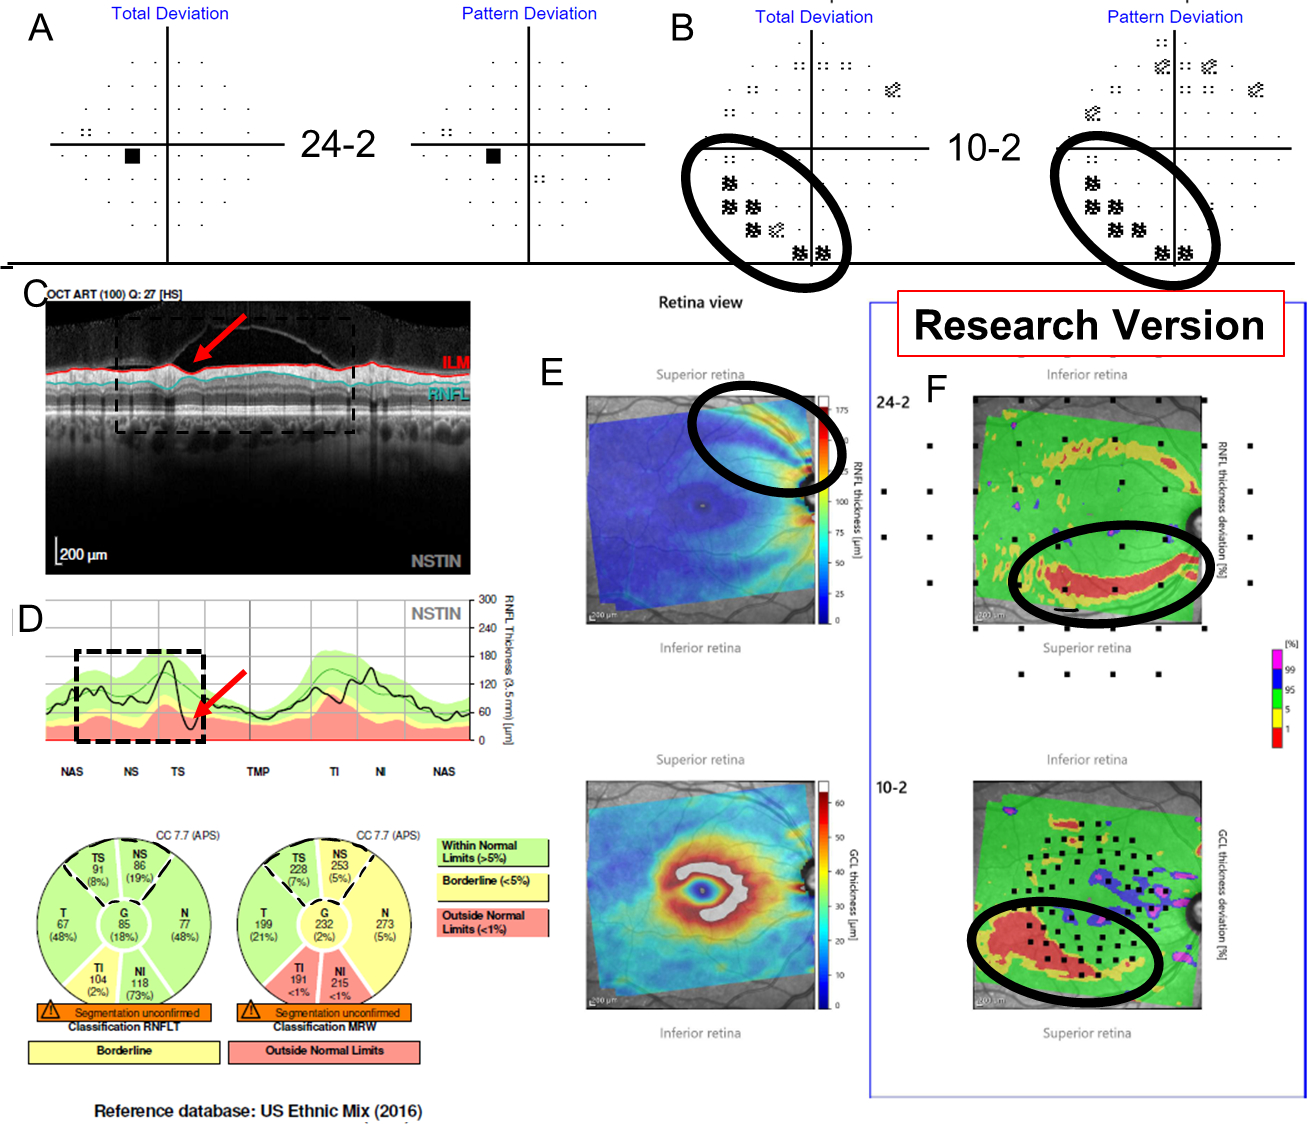
Additional information for Figure 3 shows TD and PD from the 24–2 (A) and from the 10–2 (B), while (C) shows a research version of a new Spectralis report (Heidelberg Engr. Inc.) that provides the pie charts for the cRNFL, BMO-MRW, as well as the thickness probability plots for both the RGC and RNFL. The superior hemidisc shows structural disagreement that was deemed a cRNFL FN upon post-hoc analysis, as the RS classified the superior hemidisc as abnormal. Evidence for this cRNFL FN in the superior hemidisc is outlined in black on the VFs (A and B), as well as on the RGC and RNFL plots (C).
Blood Vessels
Of the 46 disagreements in the EG group, 8 (19.6%) were errors attributed to either extreme BV locations (4 FP cRNFL) or BV contributions to the BMO-MRW measurement (4 FN BMO-MRW). The eye in Figure 5 illustrates a cRNFL FP. (See also Fig. 6.) In Figure 5A, the location of the major superior temporal BVs, indicated by the yellow arrow pointing to their shadows, is more temporal than the average position of the BVs, as indicated by the black arrow. This leftwards shift causes the appearance of relative thinning in the NS (red arrow) despite the lack of such a defect in the b-scan. This is a well-known “red disease” artifact.14 However, this misalignment of the blood vessel did not affect the BMO-MRW report of Fig. 5B (see red arrows). The 4 BMO-MRW FNs were fundamentally different from the mistakes of the cRNFL. In these cases, the BV was included in the measurement, leading to greater thickness than expected based upon the RNFL present in the scan. See Fig. 7, where the red arrows indicate the BV.
Figure 5:
Examples of a cRNFL false-positive (FP) attributed to extreme blood vessel (BV) location. Based upon the RS, the superior hemidisc was normal. The cRNFL report (A) and BMO-MRW report (B) with yellow arrows pointing to the shadow of the superior temporal BVs, and the black arrow indicating their average positions. This leftward shift in BV location causes an apparent defect indicated by the red arrows.
Figure 6:
Additional information for Figure 5A–B shows TD and PD from the 24–2 (A) and from the 10–2 (B), while (C) shows a research version of a new Spectralis report (Heidelberg Engr. Inc.) that provides the pie charts for the cRNFL, BMO-MRW, as well as the thickness probability plots for both the RGC and RNFL. The superior hemidisc shows structural disagreement that was deemed a cRNFL FP upon post-hoc analysis, as, based upon the RS, the superior hemidisc was normal. Lack of any clear damage on either the VFs (i.e., both fields were normal), as well as the lack of any significant damage within the superior retina points to a lack of glaucomatous damage.
Figure 7:

An example of a BMO-MRW FN attributed to BV inclusion in measure. Based upon the RS, the superior hemidisc was abnormal. Red arrows show the location of the BV.
Discussion
Unlike previous studies that compared cRNFL and BMO-MRW measures of glaucoma, we focused on hemidisc agreement to better understand the difference between the BMO-MRW and cRNFL measures. That is, we asked whether the cRNFL and BMO-MRW of each hemidisc agreed and if not, then why not, rather than whether cRNFL or BMO-MRW was better at detecting glaucomatous damage in these eyes. This hemidisc analysis, combined with an extensive database of OCT and VF tests, allowed us to examine the possible causes for the disagreement between the classification based upon cRNFL versus BMO-MRW in the EG group. Overall, agreement between the cRNFL and BMO-MRW measures was good in EG eyes (73.9%) and even better in BG eyes (81.9%). However, this still meant there was disagreement in over 25% of the hemidiscs of the EG group.
Lessons from the cRNFL and BMO-MRW disagreements
Our post-hoc analysis identified three possible causes for the disagreement. First, in some eyes the “mistaken” measure was close to 5%. In about 2/3 of the cases in which BMO-MRW and cRNFL disagreed, it was not because one showed a clear defect in the b-scan that the other missed. Rather, it was often the case that the two measures differed by 2–3% on the commercial pie chart, leading to different classifications [(i.e., normal (green) vs. abnormal (yellow)]. This suggests that continuous probabilities should be used, rather than a classification based upon discrete probabilities, i.e., abnormal as red (1%) or yellow (5%).
Second, both cRNFL and BMO-MRW can miss local defects. In principle, a finer spatial analysis (e.g., clock hours) may improve each measure, but in practice, specificity may suffer. In any case, these defects are often easily identified by visual inspection of probability maps as in Figs. 2, 4, and 6, as has been discussed in other studies.15–17
Third, BV location can lead to FP in the case of cRNFL and FN in the case of BMO-MRW. The sensitivity of each measure would be improved if the BV location/contribution was somehow taken into consideration.
Limitations
A limitation inherent to nearly all studies involving glaucomatous damage is the lack of a gold standard for glaucomatous damage. In this study, we constructed a clinical reference standard from expert opinions using all available information in order to better understand why cRNFL and BMO-MRW can disagree. Second, the EG excluded participants with confounding conditions, such as myopia, and therefore may not be the most representative dataset for clinical practice. However, in order to address this limitation, we replicated our results on the BG dataset, a cohort that included conditions such as myopia, in order to provide a more clinically relevant dataset. Finally, while previous studies adjusted the automated segmentation of the BMO1,4,8,9 or excluded BMO segmentation errors,5 we chose not to in order to provide a better representation of a clinical environment in which there is little to no manual adjustments. A recent study by Yang et al. in which the segmentation was manually corrected reported excellent diagnostic sensitivity for a measure that includes both the BMO-MRW and cRNFL, suggesting that BMO-MRW may be a more useful tool in clinical practice once the accuracy of the automated ONH landmarks are increased.9
However, while correcting segmentation might help, it will not resolve the major issues identified above. Summary measures, in general, and cRNFL and BMO-MRW, in particular, have too many FPs and FNs. While “OR” decision rules that allow either to be abnormal will have better sensitivity than “AND” rules that require both to be abnormal, the opposite is true for specificity.
Conclusions
While BMO-MRW and cRNFL agreed in the majority of hemidiscs, they disagreed in over 25% of the hemidiscs of the EG group. Borderline significance levels, local defects, and aberrant blood vessel location were identified as reasons for these disagreements. Based upon a post-hoc analysis, both measures detected damage missed by the other. These measures may be improved by accounting for BV location and comparing actual probability levels. However, the analysis here should not be seen as an endorsement of cRNFL and BMO-MRW summary metrics, such as those on commercial pie charts in Fig. 1, for identifying glaucomatous damage. Summary measures will often miss glaucomatous damage,16,18 and this damage is often easily seen on RGC/RNFL probability maps.14 On the other hand, the analysis should aid those trying to maximize the usefulness of these measures for screening, as well as those interested in adding summary information as part of AI algorithms.
Funding:
Supported in part by the Joseph and Marilyn Rosen Research Fund of the New York Glaucoma Research Institute, New York, NY, a National Health and Medical Research Council Early Career Fellowship (#1104985), and by National Institutes of Health grants EY-02115 (DCH) and EY-025253 (CGDM).
Footnotes
Disclosure: S. La Bruna, None; E. Tsamis, Topcon, Inc. (R); Z. Zemborain, None; Zhichao Wu, None; C.G. De Moraes, Belite (C), Galimedix (C), Reichert (C), Perfuse Therapeutics (C), Heidelberg Engineering (R), Novartis (C), Carl Zeiss (C), Topcon, Inc. (R), Research to Prevent Blindness (R), National Institutes of Health (R); R. Ritch: None; D. C. Hood: Heidelberg Engineering (F), Topcon, Inc. (R, F), Novartis (C, F).
References
- 1.Chauhan BC, Danthurebandara VM, Sharpe GP, et al. Bruch’s Membrane Opening Minimum Rim Width and Retinal Nerve Fiber Layer Thickness in a Normal White Population: A Multicenter Study. Ophthalmology. 2015;122(9):1786–1794. doi: 10.1016/j.ophtha.2015.06.001 [DOI] [PMC free article] [PubMed] [Google Scholar]
- 2.Danthurebandara VM, Sharpe GP, Hutchison DM, et al. Enhanced structure-function relationship in glaucoma with an anatomically and geometrically accurate neuroretinal rim measurement. Invest Ophthalmol Vis Sci. 2014;56(1):98–105. doi: 10.1167/iovs.14-15375 [DOI] [PubMed] [Google Scholar]
- 3.Enders P, Adler W, Schaub F, et al. Novel Bruch’s Membrane Opening Minimum Rim Area Equalizes Disc Size Dependency and Offers High Diagnostic Power for Glaucoma. Invest Ophthalmol Vis Sci. 2016;57(15):6596–6603. doi: 10.1167/iovs.16-20561 [DOI] [PubMed] [Google Scholar]
- 4.Torres LA, Sharpe GP, Hutchison DM, et al. Influence of Bruch’s Membrane Opening Area in Diagnosing Glaucoma With Neuroretinal Parameters From Optical Coherence Tomography. Am J Ophthalmol. 2019;208:94–102. doi: 10.1016/j.ajo.2019.07.009 [DOI] [PubMed] [Google Scholar]
- 5.Gmeiner JMD, Schrems WA, Mardin CY, Laemmer R, Kruse FE, Schrems-Hoesl LM. Comparison of Bruch’s Membrane Opening Minimum Rim Width and Peripapillary Retinal Nerve Fiber Layer Thickness in Early Glaucoma Assessment. Invest Ophthalmol Vis Sci. 2016;57(9):OCT575–OCT584. doi: 10.1167/iovs.15-18906 [DOI] [PubMed] [Google Scholar]
- 6.Kabbara SW, Zangwill LM, Mundae R, et al. Comparing optical coherence tomography radial and cube scan patterns for measuring Bruch’s membrane opening minimum rim width (BMO-MRW) in glaucoma and healthy eyes: cross-sectional and longitudinal analysis. Br J Ophthalmol. 2018;102(3):344–351. doi: 10.1136/bjophthalmol-2016-310111 [DOI] [PubMed] [Google Scholar]
- 7.Wu Z, Vianna JR, Reis ASC, et al. Qualitative evaluation of neuroretinal rim and retinal nerve fibre layer on optical coherence tomography to detect glaucomatous damage. Br J Ophthalmol. October 2019. doi: 10.1136/bjophthalmol-2019-314611 [DOI] [PubMed] [Google Scholar]
- 8.Zangalli CS, Vianna JR, Reis ASC, et al. Bruch’s membrane opening minimum rim width and retinal nerve fiber layer thickness in a Brazilian population of healthy subjects. PloS One. 2018;13(12):e0206887. doi: 10.1371/journal.pone.0206887 [DOI] [PMC free article] [PubMed] [Google Scholar]
- 9.Yang H, Luo H, Hardin C, et al. OCT Structural Abnormality Detection in Glaucoma using Topographically Correspondent Rim and Retinal Nerve Fiber Layer Criteria. Am J Ophthalmol. December 2019. doi: 10.1016/j.ajo.2019.12.020 [DOI] [PMC free article] [PubMed] [Google Scholar]
- 10.Park K, Kim J, Lee J. The Relationship Between Bruch’s Membrane Opening-Minimum Rim Width and Retinal Nerve Fiber Layer Thickness and a New Index Using a Neural Network. Transl Vis Sci Technol 2018;7(4). doi: 10.1167/tvst.7.4.14 [DOI] [PMC free article] [PubMed] [Google Scholar]
- 11.Lee S, Jarukasetphon R, De Cuir N, et al. A comparison of circumpapillary retinal nerve fiber layer (cpRNFL) thickness and minimum rim width at Bruch’s membrane opening (BMO-MRW) analyses in patients with mild glaucomatous damage. Invest Ophthalmol Vis Sci. 2016;57(12):843–843. [Google Scholar]
- 12.Hood DC, Tsamis E, Bommakanti NK, et al. Structure-Function Agreement Is Better Than Commonly Thought in Eyes With Early Glaucoma. Invest Ophthalmol Vis Sci. 2019;60(13):4241–4248. doi: 10.1167/iovs.19-27920 [DOI] [PMC free article] [PubMed] [Google Scholar]
- 13.Hood DC. Does Retinal Ganglion Cell Loss Precede Visual Field Loss in Glaucoma? J Glaucoma. 2019;28(11):945–951. doi: 10.1097/IJG.0000000000001380 [DOI] [PMC free article] [PubMed] [Google Scholar]
- 14.Hood DC, Raza AS. On Improving the Use of OCT Imaging for Detecting Glaucomatous Damage. Br J Ophthalmol. 2014;(98):ii1–ii-9. [DOI] [PMC free article] [PubMed] [Google Scholar]
- 15.Hood DC, De Moraes CG. Four Questions for Every Clinician Diagnosing and Monitoring Glaucoma. J Glaucoma. 2018;27(8):657–664. doi: 10.1097/IJG.0000000000001010 [DOI] [PMC free article] [PubMed] [Google Scholar]
- 16.Hood DC. Improving our understanding, and detection, of glaucomatous damage: An approach based upon optical coherence tomography (OCT). Prog Retin Eye Res. 2017;57:46–75. doi: 10.1016/j.preteyeres.2016.12.002 [DOI] [PMC free article] [PubMed] [Google Scholar]
- 17.Hood DC, De Moraes CG. Challenges to the Common Clinical Paradigm for Diagnosis of Glaucomatous Damage With OCT and Visual Fields - PubMed. Invest Ophthalmol Vis Sci. 2018;59(2):788–791. [DOI] [PMC free article] [PubMed] [Google Scholar]
- 18.Muhammad H, Fuchs TJ, De Cuir N, et al. Hybrid Deep Learning on Single Wide-field Optical Coherence tomography Scans Accurately Classifies Glaucoma Suspects. J Glaucoma. 2017;26(12):1086–1094. doi: 10.1097/IJG.0000000000000765 [DOI] [PMC free article] [PubMed] [Google Scholar]


