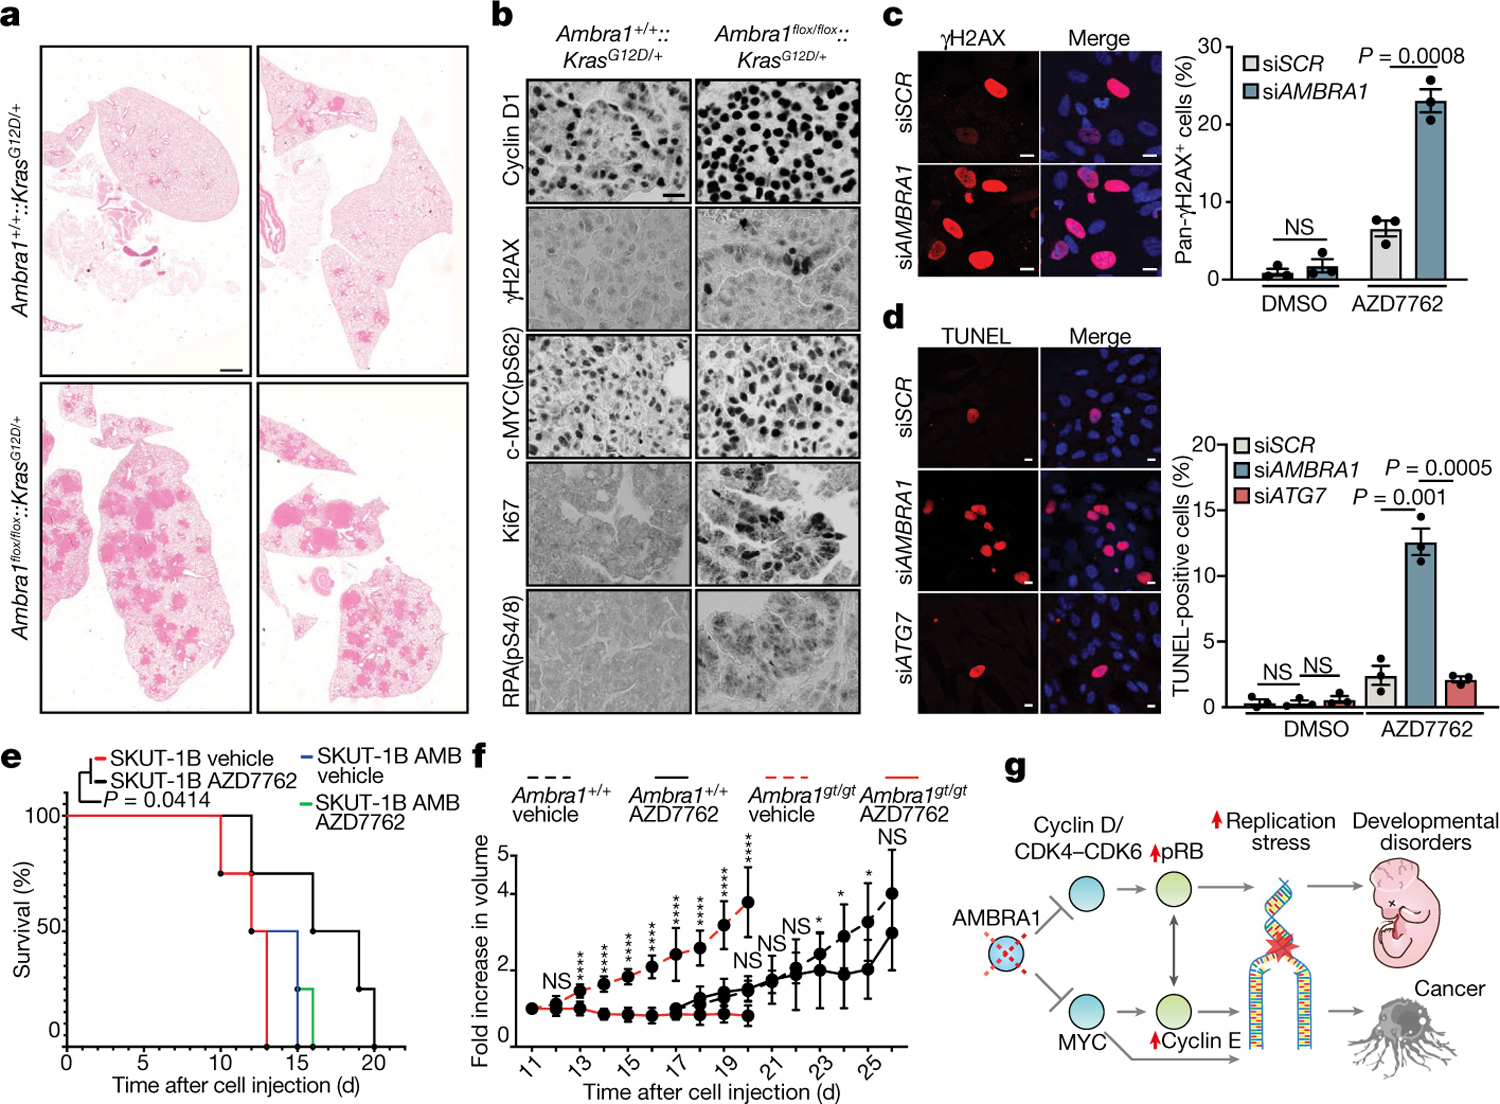
Fig. 3 |. AMBRA1 is a tumour suppressor and its loss is synthetic lethal with CHK1 inhibition.

a, H&E-stained mouse lung sections showing neoplastic lesions in Ambra1-proficient (Ambra1+/+::KrasG12D/+) and Ambra1-deficient (Ambra1flox/flox::KrasG12D/+) lung tissue 20 weeks after adenoviral infection. Four different samples are shown and are representative of four mice. Scale bar, 1 mm. b, Immunohistochemistry analyses of Ki67, γH2AX, RPA(pS4/8), cyclin D1 and c-MYC(pS62) at 20 weeks after infection. Scale bar, 40 μm. c, Left, AMBRA1-silenced and control BJ-hTERT cells were treated with 100 nM AZD7762 for 24 h and immunostained for γH2AX and Hoechst. Scale bars, 5 μm. Right, quantification of pan-γH2AX-positive cells after inhibition of CHK1 by treatment with AZD7762 for 24 h (n = 3 independent experiments). d, Left, the indicated BJ-hTERT cells were treated with AZD7762 for 24 h and stained with TUNEL and Hoechst. Scale bars, 5 μm. Right, quantification of the average percentage of TUNEL-positive cells (n = 3 independent experiments). e, Survival curves of mice xenotransplanted with control sarcoma SKUT-1B cells or SKUT-1B cells reconstituted with AMBRA1 (SKUT-1B AMB). Mice were treated with vehicle or AZD7762 (n = 4 mice). f, Assessment of the volume of Ambra1+/+ and Ambra1gt/gt MEF xenografts in mice treated with AZD7762 or vehicle (Ambra1+/+ + vehicle, n = 8 for days 17–21, n = 7 from day 24; Ambra1+/+ + AZD7762, n = 8; Ambra1gt/gt + vehicle, n = 10; Ambra1gt/gt + AZD7762, n = 11 mice). Data are mean ± s.d. g, AMBRA1 regulates the G1–S-phase transition by mediating the degradation of cyclin D proteins and c-MYC. A defective AMBRA1–cyclin D axis causes a premature entry into S phase, leading to replication stress and genome instability. The increased DNA damage causes faster tumour growth and neurodevelopmental defects. pRB, phosphorylated RB. Quantification of immunohistochemistry is shown in Extended Data Fig. 7e. Unless otherwise stated, data are mean ± s.e.m. Data were analysed using a two-tailed unpaired t-test (c, d, f) or log-rank Mantel–Cox test (e). In f, day 23,*P = 0.0348; day 24, P = 0.0353; day 25, *P = 0.0228; ****P < 0.0001.
