Abstract
Routine identification of thousands of proteins in a single LC/MS experiment has long become the norm. With these vast amounts of data more rigorous treatment of modified forms of peptides becomes possible. “Open search” - a protein database search with a large precursor ion mass tolerance window, is becoming a popular method to evaluate possible sets of post-translational and chemical modifications in samples. Extraction of statistical information about modification from peptide search results requires additional effort and data processing, such as recalibration of masses and accurate detection of precursors in MS1 signals. Here we present a software tool DeltaMass which performs kernel density based estimation of observed mass shifts and allows for detection of poorly resolved mass deltas. The software also maps observed mass shifts to known modifications from public databases such as UniMod and augments it with additionally generated possible chemical changes to the molecule. It’s interactive graphical interface provides an effective option for visual interrogation of the data and identification of potentially interesting mass shifts or unusual artifacts for subsequent analysis. However, the program can also be used in fully automated command-line mode to generate mass-shift peak lists as well.
Introduction
Shotgun proteomics has been the most popular high throughput protein identification technique for over a decade. Previously, tandem mass spectrometers were unable to collect fragmentation spectra in high mass measurement accuracy mode at high enough frequency to make such mode of operation practical for identification of large numbers of peptides in a single run. On a typical liquid chromatography time scale the time it took to measure one high mass accuracy fragmentation spectrum (MS/MS) was too long.
This in turn has led to proliferation of search strategies which did not utilize the high accuracy of measured fragment masses and instead relied on a combination of accurate precursor mass and the not-so-accurate fragment masses to assign spectra to peptides. Such a match requires prior knowledge of possible masses of post-translational biological or chemical modifications. Search engines then use this information when matching the masses of precursors to theoretical calculated values by considering all possible locations of given modifications along a peptides’ backbone. Such a search was informally given the term “closed search” as the mass of precursor needs to be matched tightly, typically within a few ppm (parts per million).
Extensive attempts to augment “closed search” through the use of sequence tags and de-novo sequencing have been made1–9 to make better use of fragment-level information. With these approaches a search engine tries to find series of peaks in spectra that are matching some subsequences of a peptide. The matching sequences are used for filtering the set of candidates for any given MS/MS spectrum. The higher the mass accuracy of an MS/MS spectrum, the more candidates can be filtered out, making the quality of fragmentation spectrum the limiting factor for these approaches.
With recent improvements in instrumentation, a combination of high mass measurement accuracy for fragments and unprecedented speed are now available in instruments such as Thermo Orbitrap QE HF and ABSciex TripleTOF 6600. Wide availability of such instrumentation opened up a new possibility for database searching strategies, namely the “open search”. When masses of fragments are known with a very small error, it is possible to effectively disregard the mass of the precursor and only use the masses of fragments to perform database matching. Unlike traditional “closed” database searching approach, which requires precursor masses to match theoretical values within ppm levels, an “open search” allows precursor mass deviations of hundreds of Daltons (or even no mass constraint at all). As a result, reported PSM (peptide-spectrum match) precursor masses can differ from reported matching peptides by a significant amount, which we will refer to as a “mass shift”. Mass shifts are closely related to peptide modifications. Many shifts can be explained by a single known modification (e.g. + 15.9949 for Oxidation), however this is not necessarily always the case. A mass shift might be caused by a combination of several modifications, neutral losses or any other chemical alterations. Statistical distribution of mass shifts in an experiment or a series of experiments can have several uses. First of all, it allows for comparison of modification profiles across experiments, e.g. different biological conditions. It also makes possible to identify novel modifications. Unexpected shifts, e.g. excessive Sodium adducts or metals, might point to sample preparation issues or sample storage issues.
Open database searches have been used in top-down proteomics10 previously. However, first attempts of application of this strategy to shotgun proteomics11 turned out to be impractical for most users. The main drawback of applying traditional search tools such as SEQUEST12 for open searching has been extremely long computational time, on the order of 10 hours per a typical 3-hour LC/MS run with an average desktop computer. However, with the advent of the fragment indexing strategy13, it is now possible to complete open searches in just several minutes on the same hardware using the new ultrafast database search engine MSFragger. The open search strategy enabled identification of a significant number of additional peptides across a wide range of samples on top of peptides detected by closed search11,13. Many known modifications were detected with sub-ppm accuracy. Not surprisingly, the open search strategy itself, and the possibility of speeding up any searches using fragment indexing, have sparked a lot of discussions and interest in the community. A number of related strategies are also currently under development, including tools for open spectral library searching,14, “multi-notch” PTM searches15, and other new generation unrestricted PTM search tools16,17.
Given the increasing popularity and acceptance of open search strategies, there is a need for new tools that can assist with downstream processing and interpretation of open search results. Here we present a tool called DeltaMass. It detects observed mass shifts in data, and maps them to existing post-translational modification databases (UniMod18, PSI-Mod19) along with theoretical combinations of additions and removals of atoms resulting in observed mass shifts. Most importantly, it presents an interactive view of the results, as shown in Figures 1, 7, allowing manual data exploration.
Figure 1:
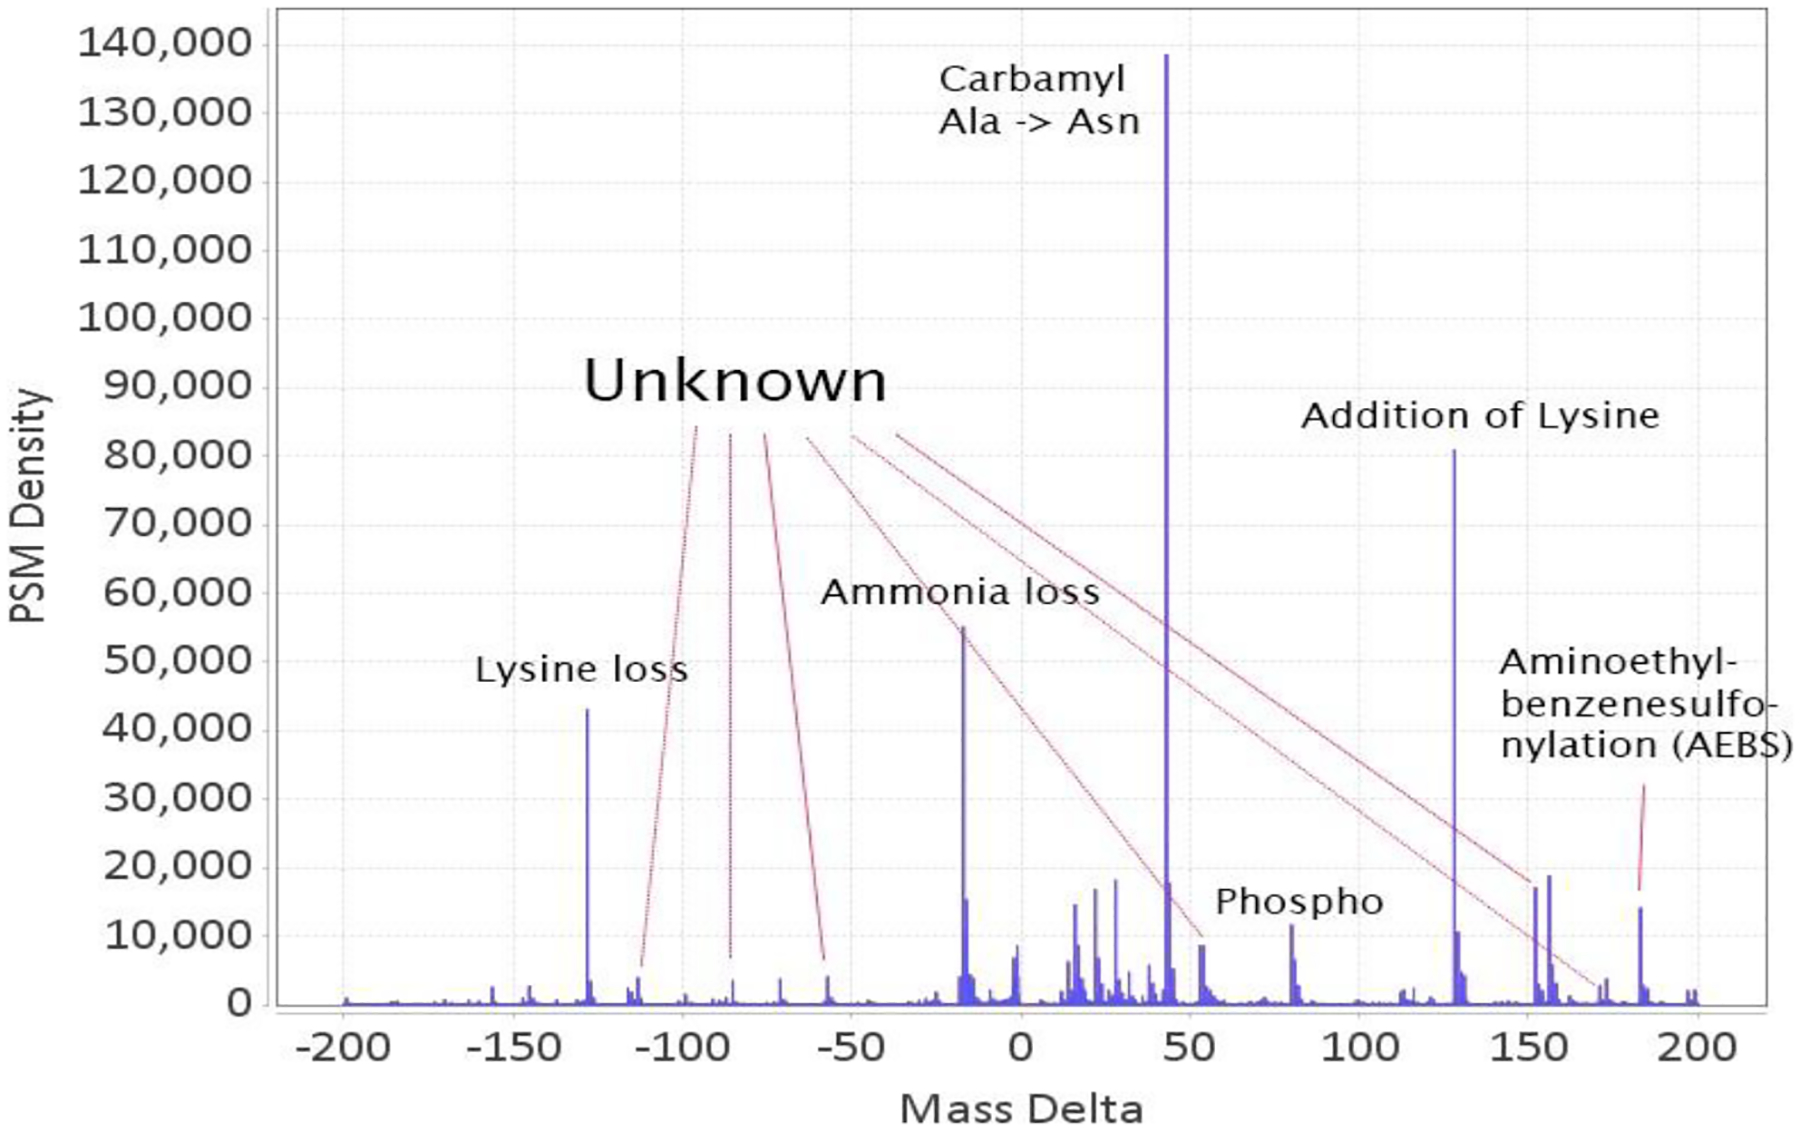
Full profile of delta masses in the range −200 to 200 Da in the data set used in Chick et. al.11, Proteome Exchange id PXD001468. Many well defined peaks have no known mappings in UniMod.
Figure 7:
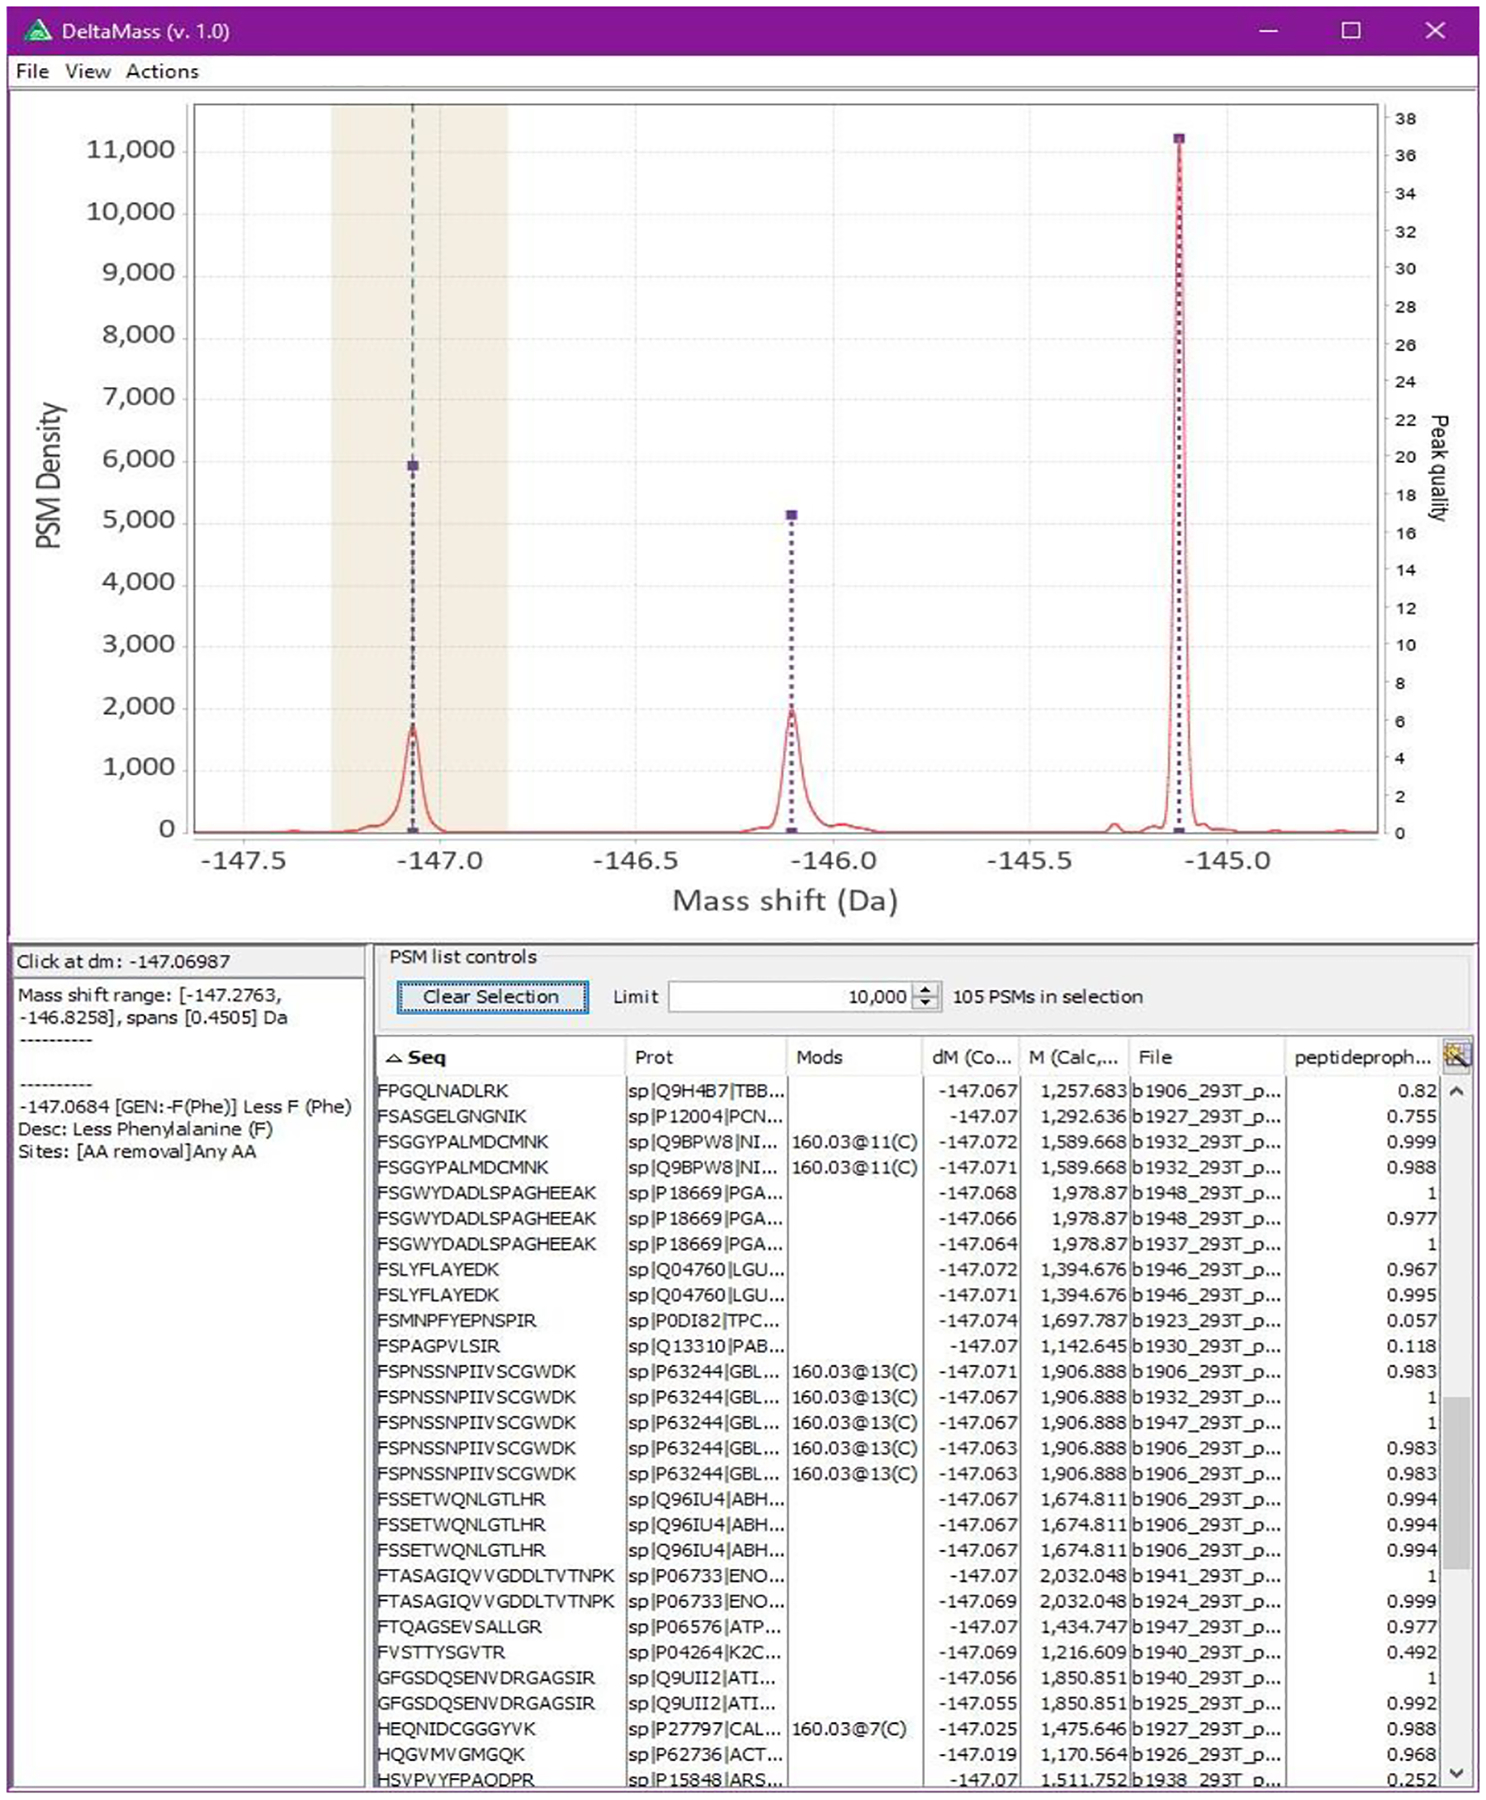
Interactive kernel density function viewer, displaying PSMs and known modifications. PSMs from the selected region (highlighted) are displayed in the table, known modification information is shown on the bottom left. Detected peaks are rendered as purple dotted lines and teal dashed lines running vertically denote locations of known modifications. In this example it can be observed that many sequences have Phenylalanine (symbol ‘F’, monoisotopic mass 147.0684) in the first position suggesting that this peak is likely due to in-source fragmentation. Even though loss of Phe is not listed in UniMod, it is reported by the included automatic annotation generator.
Methods
Database searching
We used the dataset from Chick et al.11 (Proteome Exchange accession number PXD001468) which was measured with a Thermo Q Exactive instrument, consisting of 24 3-hour LC-MS/MS runs. Searching was done with MSFragger13 search engine using UniProt database. Standard Tryptic digestion was specified and peptides in the mass range of 500 to 5000 Da were allowed. Precursor mass tolerance of +/− 500 Da and fragment mass tolerance of 20 ppm was used. Cysteine alkylation (+57.02146) was specified as a fixed modification. The results were filtered to 1% peptide and protein FDR using PeptideProphet and ProteinProphet via Philosopher and its “report” command (https://prvst.github.io/philosopher). We used FragPipe (https://github.com/chhh/FragPipe) to run the complete peptide search and filtration pipeline. DeltaMass was run using the included GUI (Figure 2).
Figure 2:
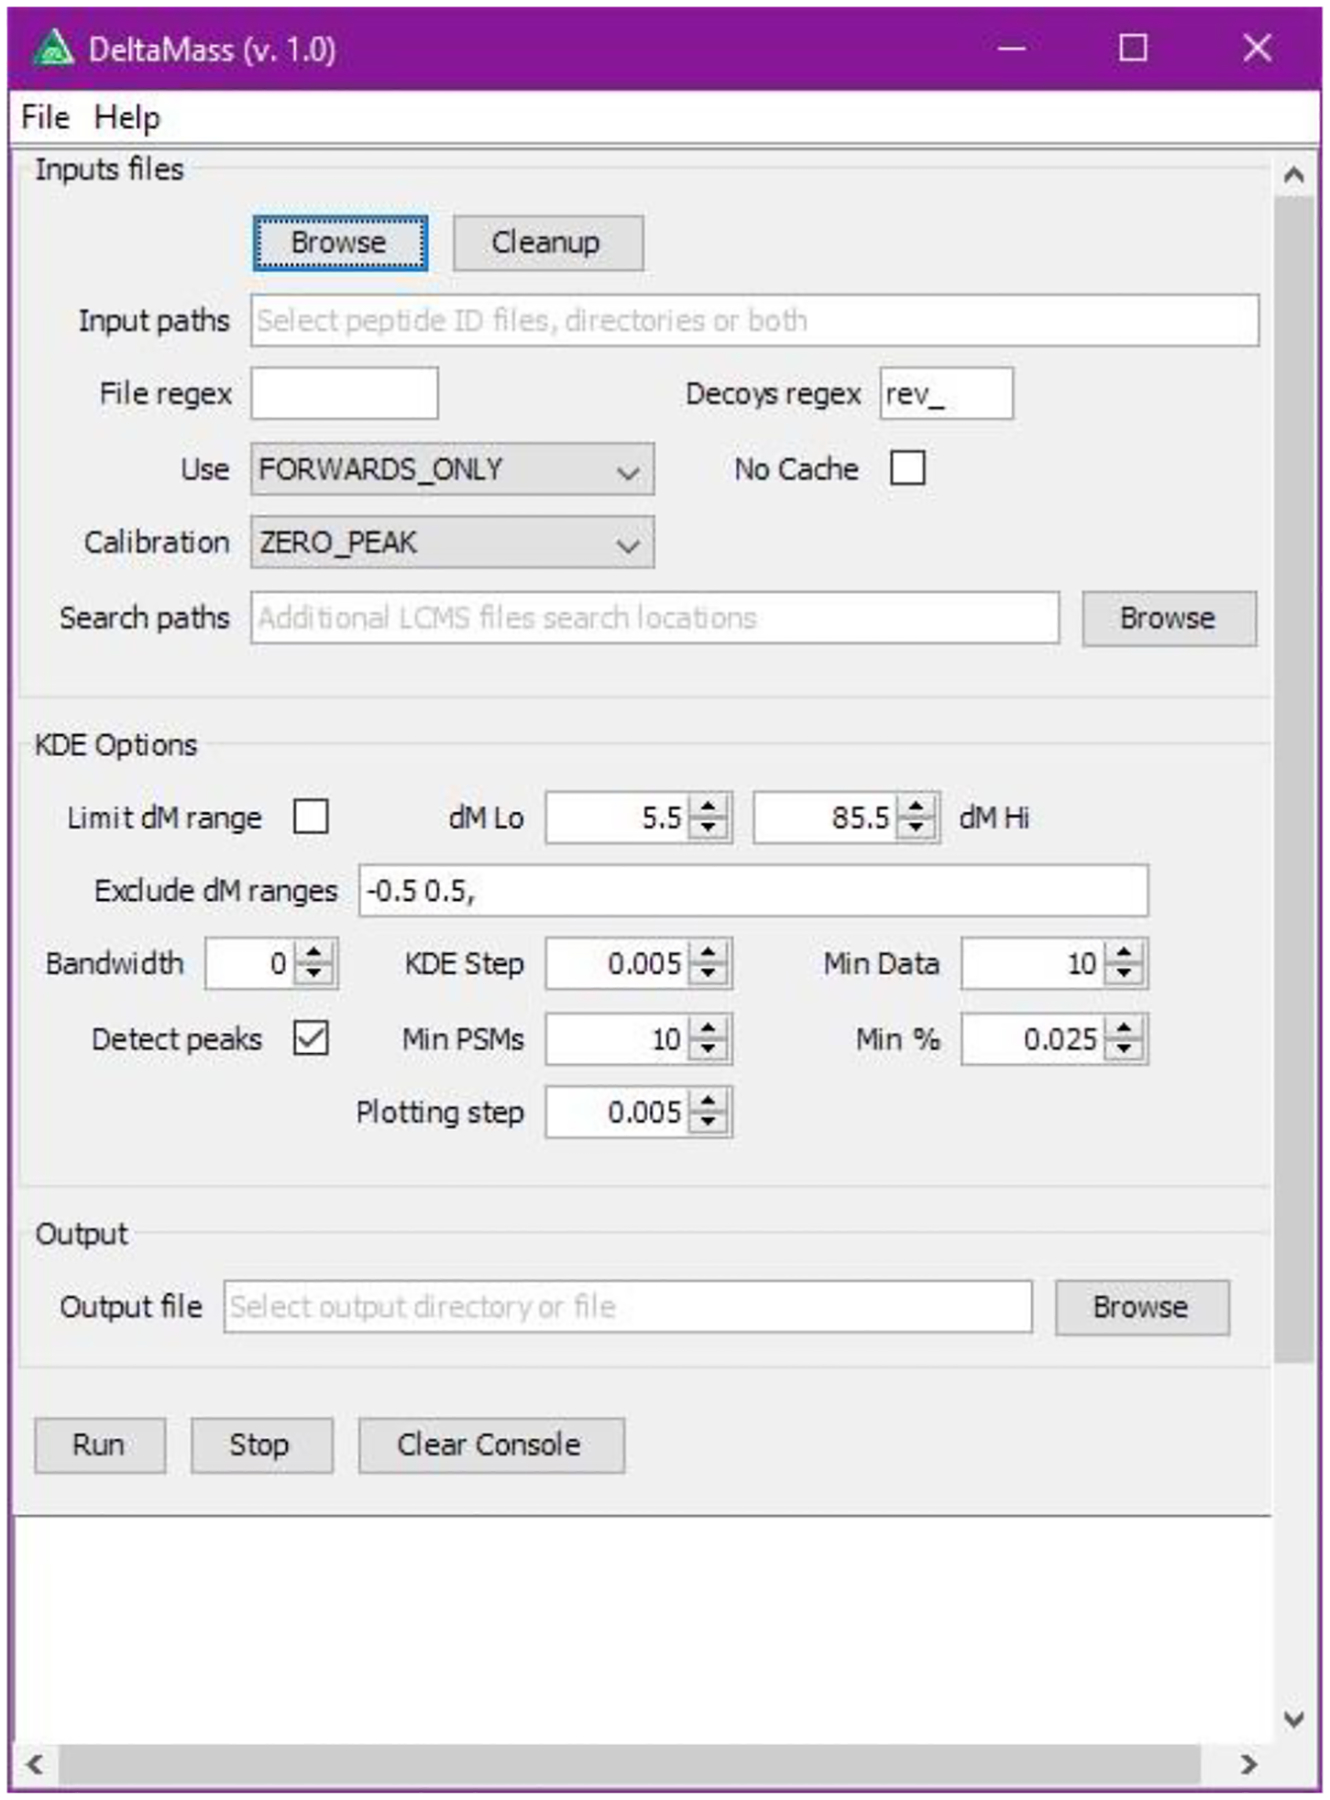
User interface for starting DeltaMass implements the major part of options available through the command line.
Results and discussion
Peak detection
Instead of binning the mass axis and building a histogram of mass differences DeltaMass takes a different approach as there is no universally good way to bin the data as demonstrated in Figure 4. Depending on how one chooses bin widths and locations close peaks might become unresolved or their precise locations become shifted. Kernel density estimation avoids these complications by treating each observation as being probabilistically distributed with the mean of the actual observation. The variance of the distribution associated with each data point can be selected by the user, however DeltaMass provides an option for automatic computation of a suitable value. This is an important difference to methods relying on binning as this allows precise peak location determination even when a smaller peak is completely buried in a larger one.
Figure 4:
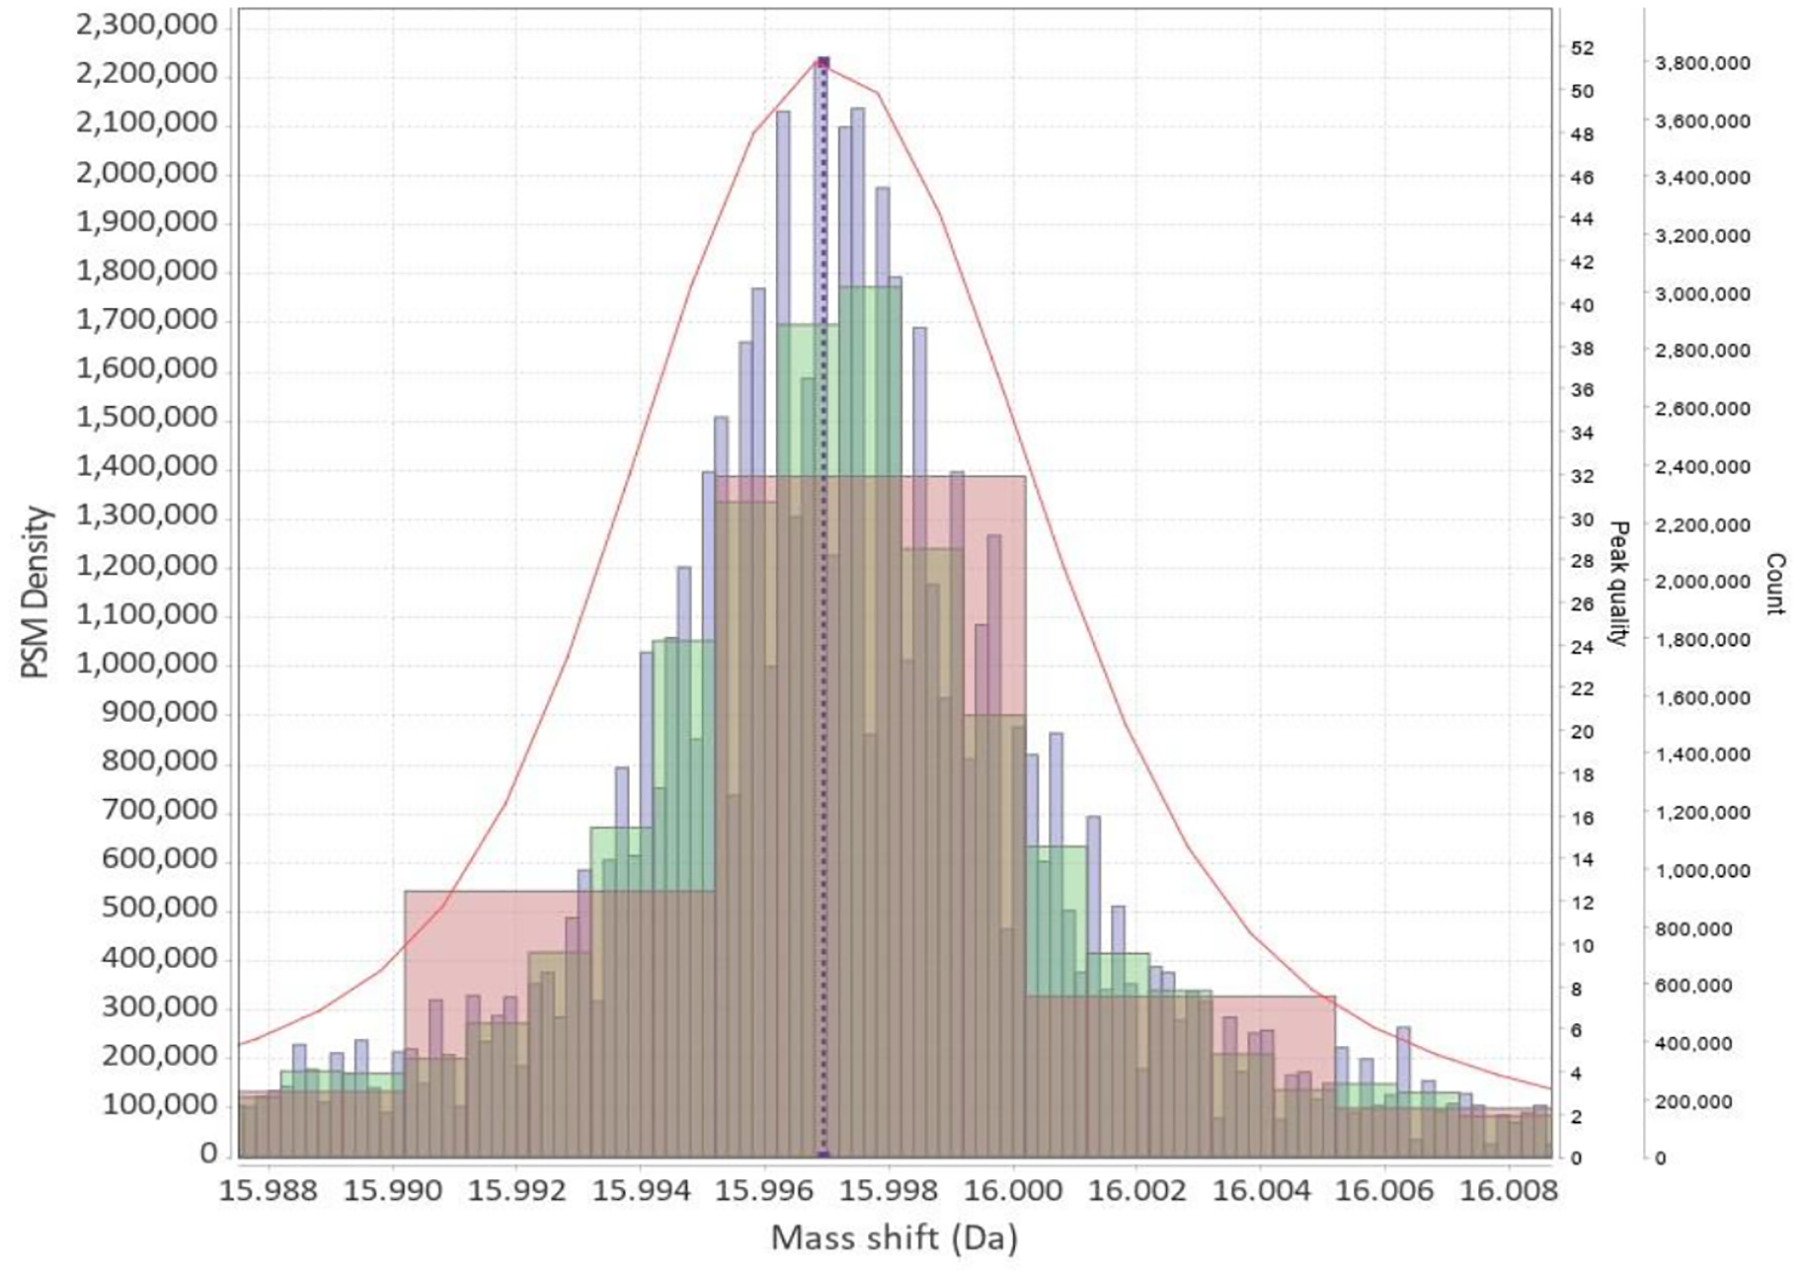
Three histograms of PSM mass shifts with bins of different widths (0.005, 0.001, 0.0002 Da). Kernel density estimate (KDE) is shown as red line. KDE bandwidth, which is roughly analogous to the bin size for histograms, was selected automatically without user intervention. The green histogram (0.001 bin width) looks to be the best fit for data, however this does not yet take into account the problem of selecting the histogram bin offset. Selecting too small a bin width leads to the histogram falling apart (blue). Select too large and loose the accuracy (red). Even for the best one - green - the peak’s location could not be determined to the same level of precision as with KDE.
The input data is split into 1 Da regions centered around each nominal mass and each region is analyzed separately. First the kernel density estimate (KDE) is constructed for the region using the standard Gaussian kernel. This kernel is advantageous in that the derivatives of the KDE can be computed analytically instead of numerical differentiation. The number of local minima of the second derivative is used as the number of components for fitting a Gaussian Mixture Model (GMM) to the KDE of the region by Expectation Maximization (EM) algorithm. We have found this approach superior to other methods of choosing the number of GMM components, like Bayesian information criterion, which tended to underestimate the number of components when peaks in the density function were poorly resolved, but still clearly distinguishable and having known mappings in UniMod.
Mass recalibration
When search results from several LC-MS runs are combined together it is important to align mass scales between them, especially if the runs were performed on different days or LCMS systems. The mass shift calculations involve the absolute measured mass and are thus dependent on mass calibration of the instrument. The more files are combined together the broader the resulting peaks become, making it impossible to resolve nearby ones. DeltaMass provides options for mass recalibration.
In the simplest case, when only peptide identification files are available (pepXML or mzIdentML files), the peak at zero mass shift can be used to adjust all the mass shifts in each search result separately (zero-peak correction). The large peak at zero shift is first detected and fitted precisely, its mass error relative to zero is used to adjust the whole mass difference scale. Refer to Figures 3(left) and 3(middle) for the effect this has on real world data. Zero-peak mass correction option does not account for mass measurement errors being mass range dependent, it also cannot account for variability over the time of an LC run.
Figure 3:

(Left) Kernel density estimate of mass shifts around +1 Da obtained from 24 LC-MS files of Proteome Exchange data set PXD001468. A small bulge near shift of +0.98 Da can be discerned, corresponding to deamidation, but the shape of KDE is very noisy overall. (Middle) Zero-peak correction applied. The KDE now looks like a mixture of two Normal distributions. (Right) Mass recalibration using identified peptides applied to the same data set.
Better results can be achieved when original raw LC-MS data files are available and used in conjunction with search results files to build mass calibration curves for each run using confidently identified peptides. We have incorporated the same algorithm that was for the original MSFragger13 manuscript directly into DeltaMass. It traces precursor ions’ m/z for each MS2 event in retention time (RT) and uses the average of the traced masses (weighted by intensity) as the actual precursor mass. Unmodified identified peptides with mass errors of less than 20 ppm are then used to construct a two-dimensional (m/z, RT) calibration grid at 5 minute spacing in RT and 200 Da spacing in m/z. For each such peptide its mass error is interpolated to the 4 nearest points of the calibration grid. The resulting values at the nodes of the grid, representing the average mass error in that particular region of m/z-RT space, are then extrapolated back to all MS2 events in the run. Compare Figure 3(middle) to 3(right) to estimate the improvement compared to zero-peak correction.
Peak filtration and scoring
When the GMM is fit to a region, DeltaMass estimates the number of PSMs each component of the GMM is supported by. Components with small PSM support can be filtered out based on user preferences. We have found that in high mass accuracy data sets typical peak width at half maximum (FWHM) tends to be below 0.02 Da. It is of course instrument and data dependent, but this value can be used as a guide for removing unnaturally narrow or wide peaks. The values will also differ if the automated bandwidth detection for KDE is used or is set manually. Irrespective of how the data is plotted, the Oxidation peak at +16 can be used as a nice guide to refer to. It is a very common modification that will be present in mostly any proteomic experiment and there are no interferences from other known chemical alterations in the vicinity of the peak. Figure 5 provides a visual comparison to the +18 peak, which is covered by a variety of known mass shifts.
Figure 5:
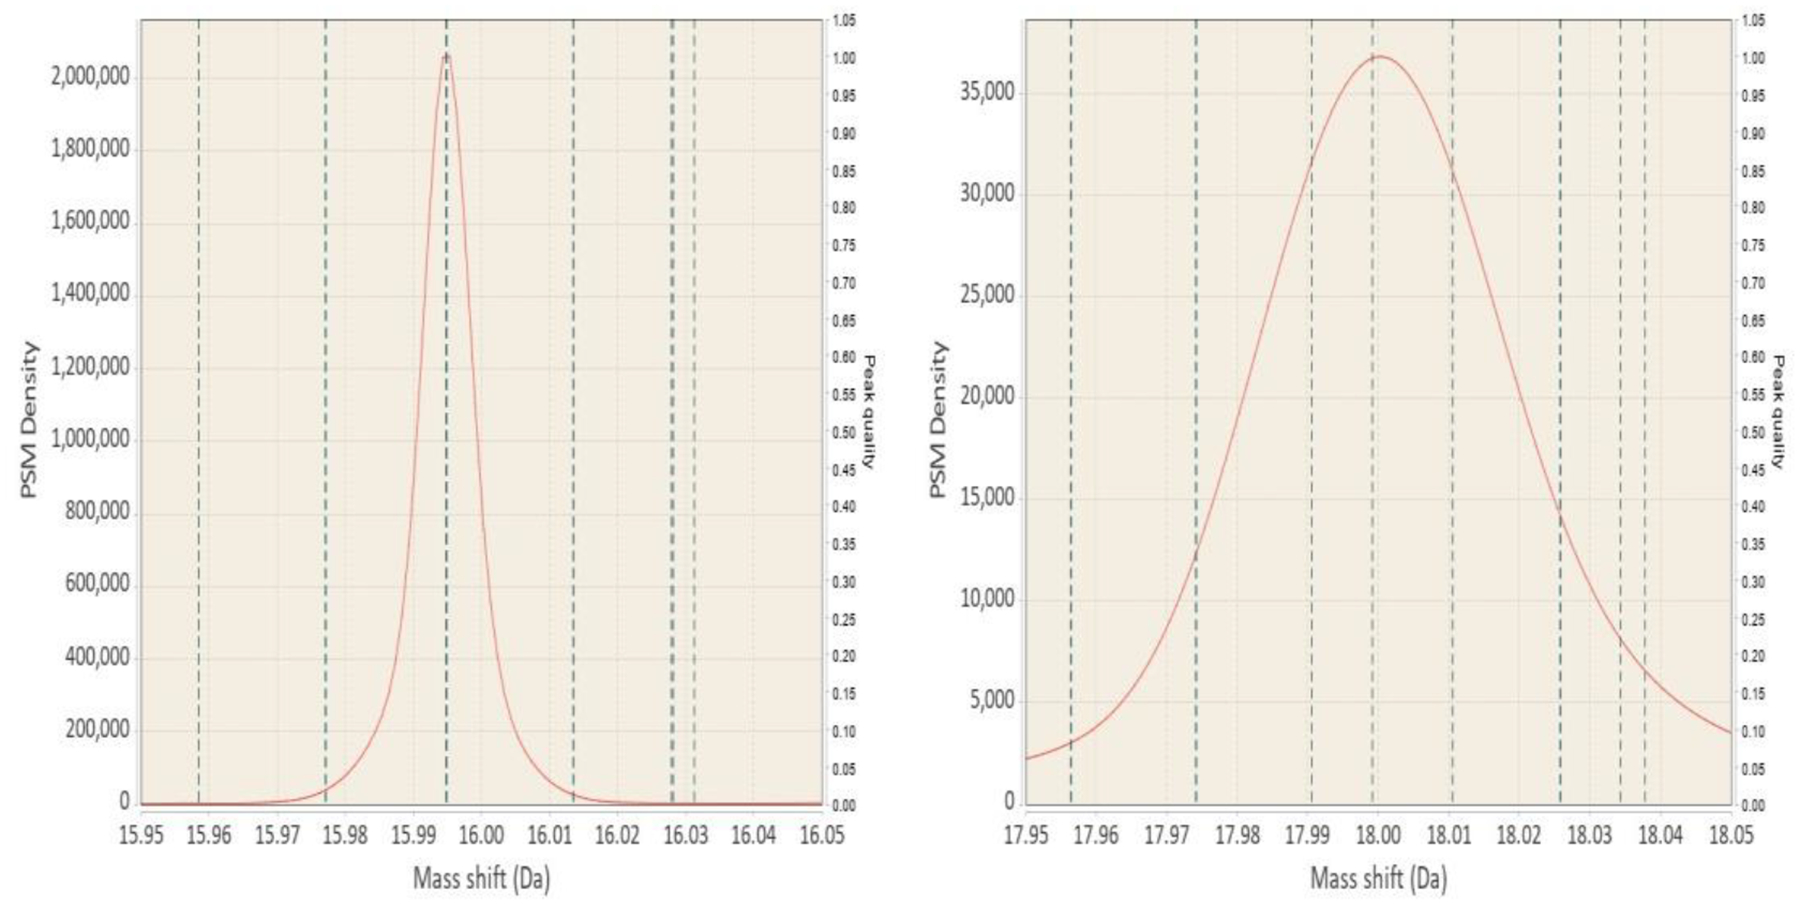
Visual guide to estimating peak width in your data. Vertical lines on the plots mark locations of known modifications. Horizontal scale is the same in both panels. Left panel shows the Oxidation peak, which has no interfering modifications near the main +15.9949 peak. While there are other known mass shifts, they are quite far away and are very uncommon compared to Oxidation. For comparison the +18 region is shown in the right panel. That region corresponds to lots of various aminoacid substitutions, addition of Ammonium and others.
Peaks receive a “quality” value, which is the value of the second derivative of the KDE. When a “peak” is just a bulge on the side lobe of a larger peak, the second derivative value is low, but the more pronounced a peak is, the higher the value, thus higher “quality”. Peaks also get assigned a “score” which is a product of quality and delta mass peak intensity. Both these metrics are useful for sorting the resulting list of detected mass shifts.
Detected peaks are also assigned possible annotations. Chemical and post-translational protein modifications from UniMod and PSIMod are used and augmented with some auto-generated ones, e.g. replacement of Hydrogen atoms and multiple amino acid substitutions, additions or deletions. Annotations up to two standard deviations away from the mean of the corresponding GMM component are reported and ordered by distance from said mean.
We have tested DeltaMass using the data set of Chick et. al. DeltaMass has detected 788 peaks of varying quality supported by at least 20 PSMs compared to 526 peaks in the original report, which is a comparable number. Peak filtration criteria are subjective, however, and dependent on the task at hand. For example, the more runs are thrown into the analysis simultaneously, the more noise is introduced from spurious peptide matches, the more evidence support might be desired for each peak. Requiring support of at least 50 PSMs instead of 20 reduced the number to 438 peaks (184 peaks are left if we filter the original list from Chick et. al. with same criteria).
As we expected peaks without interferences to have width of about 0.02 Da in this dataset, additionally requiring FWHM of less than 0.04 Da (i.e. double the assumed peak width) reduced the number of detected peaks further to 139 peaks (49 in the original report). On the other hand, if the goal is to find any possible evidence of a specific mass shift, e.g. caused by a deliberate chemical modification or a rare but known biological modification, possibly no filtering should be done at all.
Interactive exploration of mass shifts
One of the big advantages of DeltaMass over any solutions that only generate peak lists from the observed mass shift distribution is that it provides an interactive view of the input data. The user would not want to blindly trust a list of numbers and does not need to - the included viewer can plot the kernel density estimate generated from the input peptide identification results and overlay detected peaks on top of it (Figure 6). Selecting a range of mass shifts with the mouse brings up the display of all supporting PSMs and all the known modifications are also plotted on the main chart. All the figures used in the manuscript were generated from the DeltaMass user interface.
Figure 6:
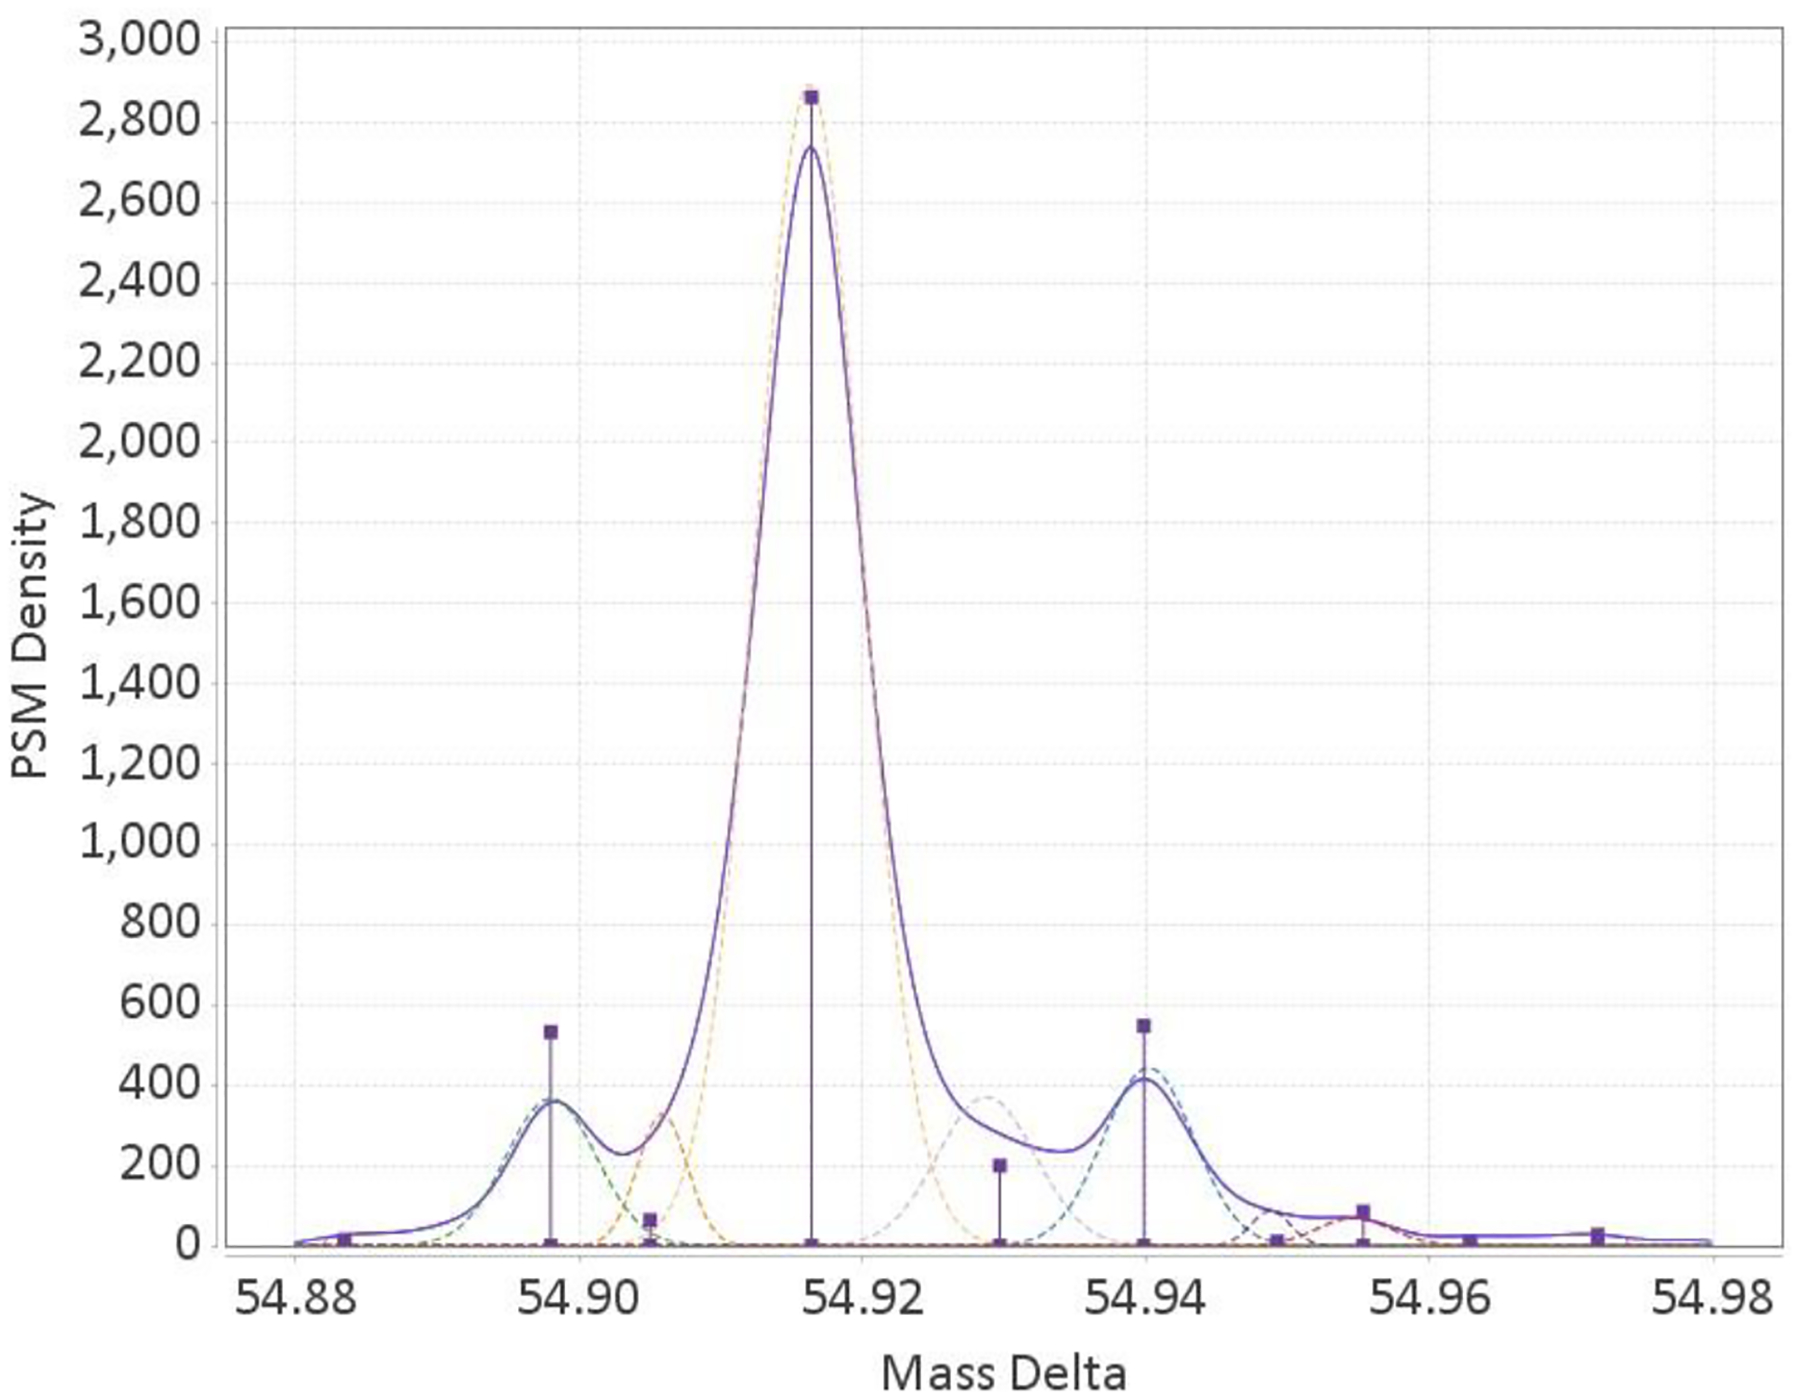
Peaks inferred from the kernel density function plotted over the KDE itself. Peak height represents significance of the peak within the nominal mass region.
The viewer is interactive, and it allows zooming, panning and, most importantly, selecting. Selecting an area reveals the sequences of underlying PSMs that gave rise to the KDE and known annotations for the mass shift range being looked at are reported and overlaid over the plot. Apart from added confidence in reported peaks from the peaklist, visual examination of the KDE sometimes reveals peculiar artifacts the user might not be aware of otherwise, e.g. X-Tandem adding some variable modifications by default. A notable example is pyro-Glu from Q and E on N-terminus which show up with mass differences inverse if X-Tandem is used for “open searching” and this option is not specifically turned off.
Another example is presented in Figure 7 exhibiting a possible in-source fragmentation event occurring with peptides having Phenylalanine at the N-terminus. Figure 8 provides one more example of how the viewer can be used for general data exploration.
Figure 8:
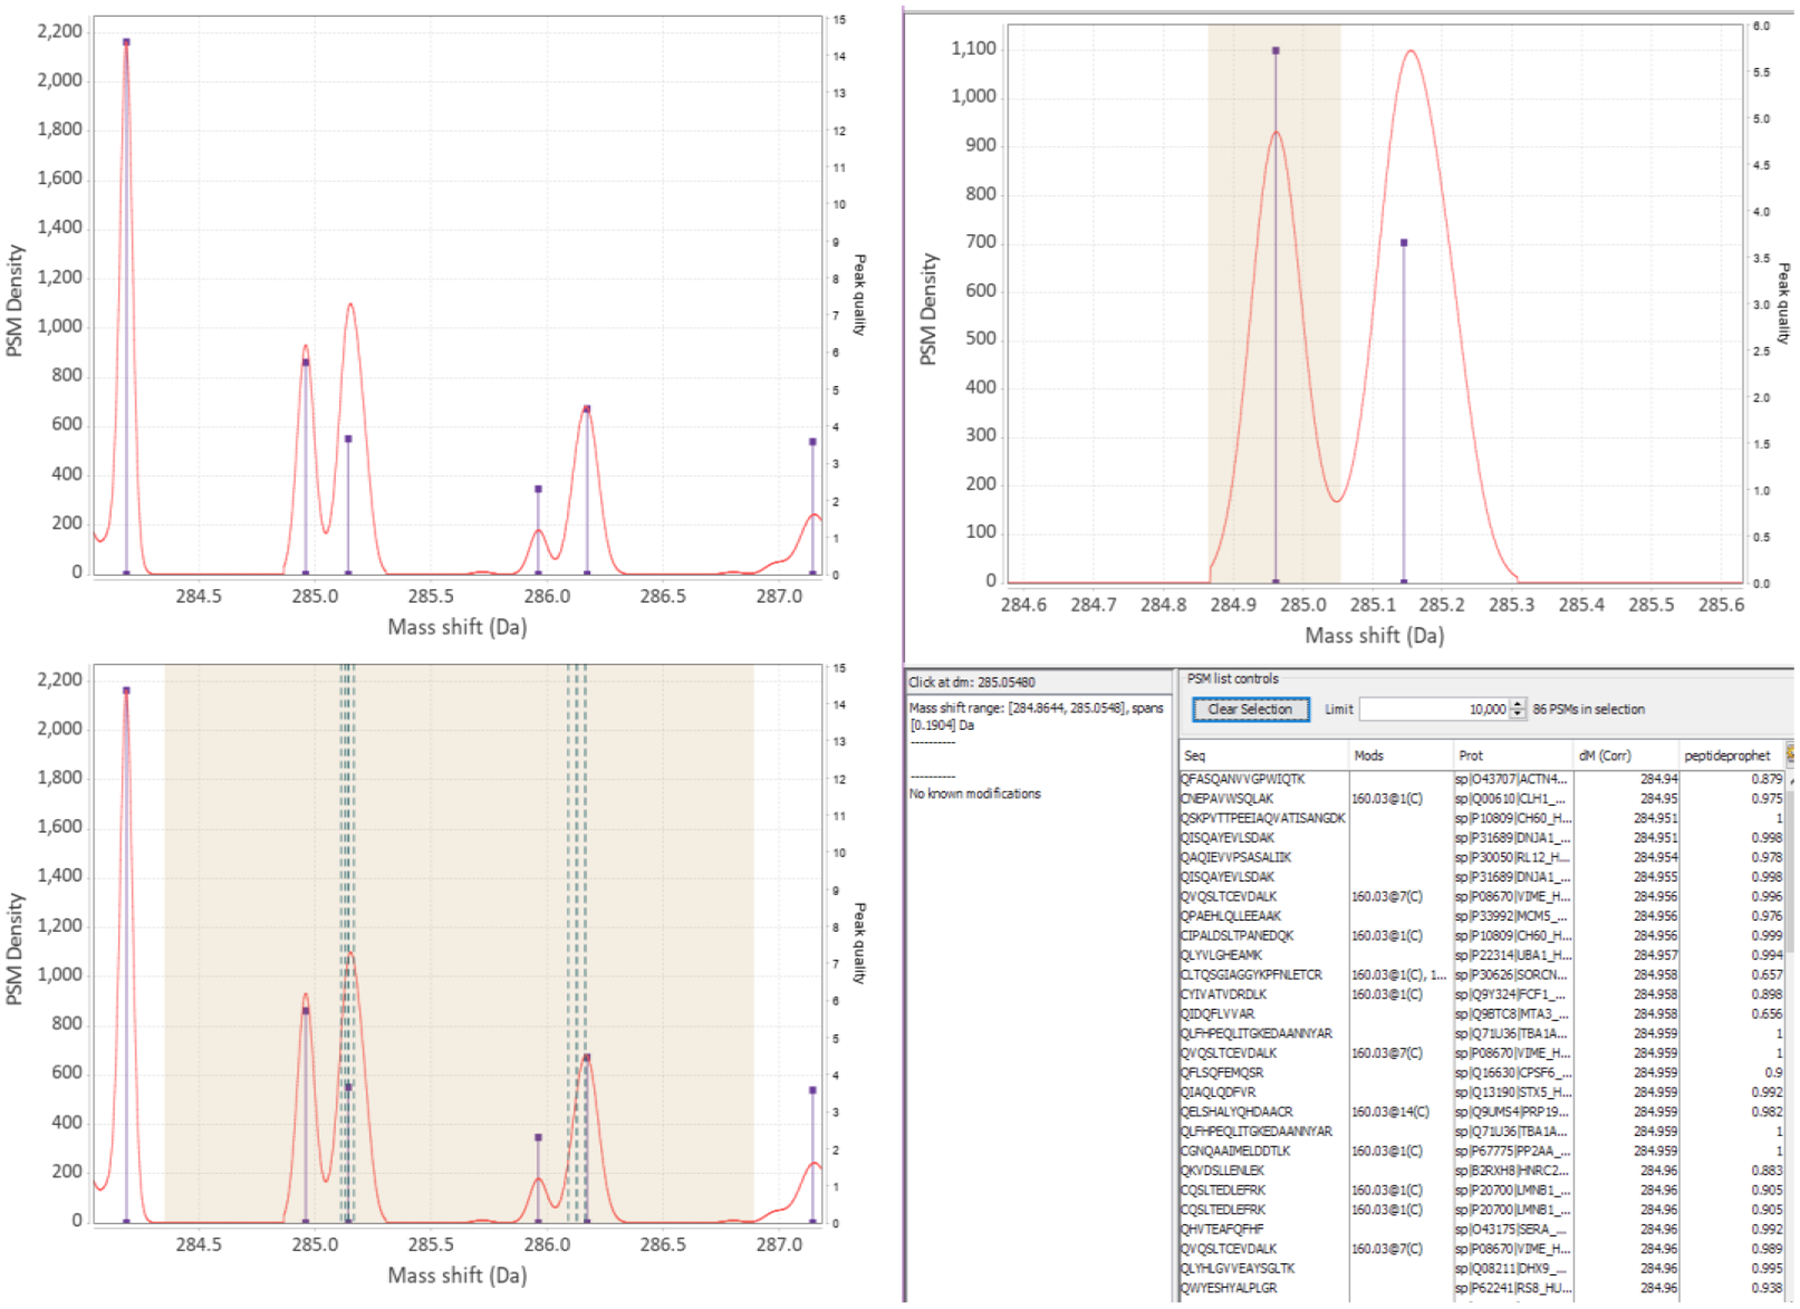
(Top left) Looking at the general KDE profile the user might notice something interesting, like double peaks. (Bottom left) In the viewer the user can select the region of interest and see that the right-leaning peaks do have some possible known mappings - teal dotted vertical lines show known mass shifts. (Right half) The user can then select the left leaning peak, which has no mappings, and the viewer displays PSMs in the table. In this example many of the selected sequences start with ‘Q’. That can be one possibility for subsequent investigation. It can also be noticed that there is another larger peak to the left and that the peaks spaced by 1 Da decrease in intensity, suggesting that this might be attributed to C12/C13 isotope selection errors by the instrument.
Conclusion
DeltaMass should be a useful tool for incorporation into workflows that aim to identify novel modifications. We have also found that it can be used to trace contamination, possibly introduced to samples during preparation, especially unexpected chemical modifications of peptides. Although we have used MSFragger, DeltaMass supports pepXML and mzIdentML files as input of peptide identification results and is thus compatible with any search engine that can write those formats. For mass recalibration based on peptide IDs raw LCMS files are required, supported formats are mzML and mzXML. DeltaMass comes with a graphical interface to simplify running the application, however all the options are available from the command line as well. Interactive plot of KDE and detected mass shifts can display peptide sequences of contributing PSMs and the possible corresponding annotations when clicked. Using the interactive plot one can look for common patterns in peptide sequences with the same mass shift, look for peculiar artifacts produced by search engines, observe in-source fragmentation events, or just in general assess the results of the peak detection algorithm.
There are some limitations to the very generic approach DeltaMass takes at identifying the mass shifts. First of all, the frequency of false positive peaks is unknown and in the absence of a golden standard dataset impossible to assess. Thus, the burden of evaluating the empirical mass shift peak-list is on the user. Also, mass shift peak resolution depends strongly on mass accuracy of MS1 spectra. Some peaks not resolvable with DeltaMass may still be resolved if modification localization information is available. We will be addressing the issue of better localization in upcoming new versions of MSFragger search engine.
It is fascinating to observe how for clean peaks without interferences the accuracy of mass delta measurement gets below one fifth the mass of electron (1/5 of 0.00055 amu). Especially considering that the measurements are performed with heavy, by mass spectrometry standards, peptides.
DeltaMass is available for download at https://github.com/chhh/deltamass.
Acknowledgement
Authors thank Felipe Leprevost for providing the Philosopher software tool that was used to simplify statistical filtering of search results: https://prvst.github.io/philosopher. This work was funded by grants from the NIH: R01GM94231 and U24CA210967 to A.I. Nesvizhskii.
References
- (1).Mann M; Wilm M Error-tolerant identification of peptides in sequence databases by peptide sequence tags. Analytical chemistry 1994, 66, 4390–4399. [DOI] [PubMed] [Google Scholar]
- (2).Dančík V; Addona TA; Clauser KR; Vath JE; Pevzner PA De novo peptide sequencing via tandem mass spectrometry. Journal of computational biology 1999, 6, 327–342. [DOI] [PubMed] [Google Scholar]
- (3).Tabb DL; Saraf A; Yates JR GutenTag: high-throughput sequence tagging via an empirically derived fragmentation model. Analytical chemistry 2003, 75, 6415–6421. [DOI] [PMC free article] [PubMed] [Google Scholar]
- (4).Zhang N; Li X.-j.; Ye M; Pan S; Schwikowski B; Aebersold R ProbIDtree: An automated software program capable of identifying multiple peptides from a single collision-induced dissociation spectrum collected by a tandem mass spectrometer. Proteomics 2005, 5, 4096–4106. [DOI] [PubMed] [Google Scholar]
- (5).Shilov IV; Seymour SL; Patel AA; Loboda A; Tang WH; Keating SP; Hunter CL; Nuwaysir LM; Schaeffer DA The Paragon Algorithm, a next generation search engine that uses sequence temperature values and feature probabilities to identify peptides from tandem mass spectra. Molecular & Cellular Proteomics 2007, 6, 1638–1655. [DOI] [PubMed] [Google Scholar]
- (6).Zhang J; Xin L; Shan B; Chen W; Xie M; Yuen D; Zhang W; Zhang Z; Lajoie GA; Ma B PEAKS DB: de novo sequencing assisted database search for sensitive and accurate peptide identification. Molecular & Cellular Proteomics 2012, 11, M111.010587. [DOI] [PMC free article] [PubMed] [Google Scholar]
- (7).Na S; Bandeira N; Paek E Fast Multiblind Modification Search through Tandem Mass Spectrometry. Molecular & Cellular Proteomics 2012, 11, M111.010199 [DOI] [PMC free article] [PubMed] [Google Scholar]
- (8).Ma B Novor: real-time peptide de novo sequencing software. Journal of the American Society for Mass Spectrometry 2015, 26, 1885–1894. [DOI] [PMC free article] [PubMed] [Google Scholar]
- (9).Tran NH; Zhang X; Xin L; Shan B; Li M De novo peptide sequencing by deep learning. Proceedings of the National Academy of Sciences 2017, 114, 8247–8252. [DOI] [PMC free article] [PubMed] [Google Scholar]
- (10).Zamdborg L; LeDuc RD; Glowacz KJ; Kim Y-B; Viswanathan V; Spaulding IT; Early BP; Bluhm EJ; Babai S; Kelleher NL ProSight PTM 2.0: improved protein identification and characterization for top down mass spectrometry. Nucleic Acids Research 2007, 35, W701–W706. [DOI] [PMC free article] [PubMed] [Google Scholar]
- (11).Chick JM; Kolippakkam D; Nusinow DP; Zhai B; Rad R; Huttlin EL; Gygi SP A mass-tolerant database search identifies a large proportion of unassigned spectra in shotgun proteomics as modified peptides. Nature biotechnology 2015, 33, 743. [DOI] [PMC free article] [PubMed] [Google Scholar]
- (12).Eng JK; McCormack AL; Yates JR An approach to correlate tandem mass spectral data of peptides with amino acid sequences in a protein database. Journal of the American Society for Mass Spectrometry 1994, 5, 976–989. [DOI] [PubMed] [Google Scholar]
- (13).Kong AT; Leprevost FV; Avtonomov DM; Mellacheruvu D; Nesvizhskii AI MSFragger: ultrafast and comprehensive peptide identification in mass spectrometry–based proteomics. Nature methods 2017, 14, 513. [DOI] [PMC free article] [PubMed] [Google Scholar]
- (14).Bittremieux W; Meysman P; Noble WS; Laukens K Fast Open Modification Spectral Library Searching through Approximate Nearest Neighbor Indexing. Journal of Proteome Research 2018, 17, 3463–3474. [DOI] [PMC free article] [PubMed] [Google Scholar]
- (15).Solntsev SK; Shortreed MR; Frey BL; Smith LM Enhanced Global Post-translational Modification Discovery with MetaMorpheus. Journal of Proteome Research 2018, 17, 1844–1851. [DOI] [PubMed] [Google Scholar]
- (16).Yu F; Li N; Yu W PIPI: PTM- Invariant Peptide Identification Using Coding Method. Journal of Proteome Research 2016, 15, 4423–4435 [DOI] [PubMed] [Google Scholar]
- (17).Liu C et al. Comprehensive identification of peptides in tandem mass spectra using an efficient open search engine. Nature Biotechnology 2018, 36, 1059–1061. [DOI] [PubMed] [Google Scholar]
- (18).Creasy DM; Cottrell JS Unimod: Protein modifications for mass spectrometry. Proteomics 2004, 4, 1534–1536. [DOI] [PubMed] [Google Scholar]
- (19).Montecchi-Palazzi L; Beavis R; Binz P-A; Chalkley RJ; Cottrell J; Creasy D; Shofstahl J; Seymour SL; Garavelli JS The PSI-MOD community standard for representation of protein modification data. Nature biotechnology 2008, 26, 864. [DOI] [PubMed] [Google Scholar]


