Abstract
Introduction
As new late‐onset Alzheimer's disease (LOAD) genetic risk loci are identified and brain cell–type specific omics data becomes available, there is an unmet need for a bioinformatics framework to prioritize genes and variants for testing in single‐cell molecular profiling experiments and validation using disease models and gene editing technologies. Prior work has characterized and prioritized active enhancers located in LOAD‐genome‐wide association study (GWAS) regions and their potential interactions with candidate genes. The current study extends this work by focusing on single nucleotide polymorphisms (SNPs) within these LOAD enhancers and their impact on altering transcription factor (TF) binding. The proposed bioinformatics pipeline progresses from SNPs located in LOAD‐GWAS regions to a filtered set of candidate regulatory SNPs that have a predicted strong effect on TF binding.
Methods
Active enhancers within LOAD‐associated regions were identified and SNPs located in the enhancers were catalogued. SNPs that disrupt TF binding sites were prioritized and the respective TFs were filtered to include only those that were expressed in brain tissues relevant to LOAD. The TFs binding to the corresponding sequence was further confirmed by ChIP‐seq signals. Finally, the high‐priority candidate SNPs were evaluated as expression quantitative trait loci (eQTLs) in disease‐relevant tissues.
Results
We catalogued 61 strong enhancers in LOAD‐GWAS regions encompassing 326 SNPs and 104 TF binding sites. Seventy‐seven and 78 of the TFs were expressed in brain and monocytes, respectively, out of which 19 TF‐binding sites showed ChIP‐seq signals. Eleven SNPs were found to interrupt with TF binding out of which three SNPs were also significant eQTL.
Discussion
This study provides a framework to catalogue noncoding variations in enhancers located in LOAD‐GWAS loci and characterize their likelihood to perturb TF binding. The approach integrates multiple data types to characterize and prioritize SNPs for putative regulatory function using single‐cell multi‐omics assays and gene editing.
Keywords: Alzheimer's disease genetics, expression analysis, genetic variant annotation and prioritization, transcription factor binding analysis
1. INTRODUCTION
Large multi‐center genome‐wide association studies (GWAS) have identified associations between numerous genomic loci and late‐onset Alzheimer's disease (LOAD). 1 , 2 , 3 , 4 , 5 , 6 One of the latest published GWAS meta‐analyses reported a total of 25 LOAD‐GWAS regions 7 and the most recent unpublished works have further expanded the number of LOAD associations to 75 loci. 8 The majority of LOAD‐GWAS–associated single nucleotide polymorphisms (SNPs) are located in noncoding regions of the genome, which makes it difficult to assign the causal variants and genes. 9 Indeed, the major challenge in the post‐GWAS era is translating genetic risk of LOAD into causal variants (risk or protective) and their target genes. 9 Resolving this gap will provide mechanistic insights and progress the identification of new drug targets for LOAD.
Disease‐associated noncoding regions are enriched with regulatory elements and thus noncoding genetic variants may mediate their effects through dysregulation of gene expression 10 by mechanisms such as changes in transcription factor binding (gain or loss) or disruption of regulatory element accessibility and function. 11 Consistently, differential gene expression in LOAD versus healthy controls is well established. 12 , 13 , 14 Moreover, expression quantitative trait loci (eQTL) studies in brain tissues from cognitively normal 15 and LOAD 16 , 17 , 18 , 19 samples reported overlap with LOAD‐GWAS loci. Finally, integration of findings from LOAD epigenome‐wide association and GWAS identified a number of shared loci. 20 , 21 , 22 , 23 , 24 , 25 , 26 , 27
The present study builds on our prior work in which we developed a bioinformatics strategy to identify candidate LOAD causal genes in LOAD‐GWAS regions. 28 This previous work, which used publicly available functional genomic datasets, identified active enhancers in ≈1Mb LOAD‐associated regions and inferred their target genes based on 3D interactions between the annotated enhancer and gene promoter. The current study extended this bioinformatics framework to identify candidate LOAD regulatory SNPs. The developed pipeline herein predicts the impact of enhancer SNPs within LOAD‐GWAS regions on transcription factor (TF) binding sites with the goal to catalogue and prioritize candidate LOAD functional SNPs. As shown in Figure 1, we started with defined active enhancers within LOAD‐associated regions 28 and catalogued all SNPs that mapped within the enhancers. We next prioritized the SNPs that disrupt TF binding sites; the respective TFs were filtered to include only those that were expressed in brain tissues relevant to LOAD (frontal cortex, temporal cortex, hippocampus) and/or monocytes and when available the TFs binding to the corresponding sequence were confirmed by ChIP‐seq signals. 29 , 30 The resulting top prioritized SNPs are strong candidates with likely transcriptional regulatory roles and were further evaluated as eQTLs in disease‐relevant tissues (Figure 1).
FIGURE 1.
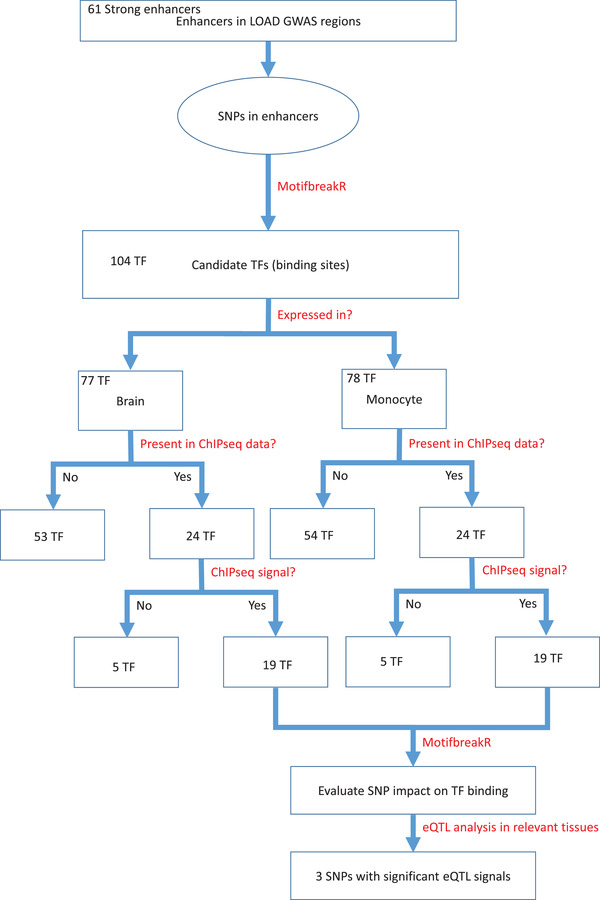
A schematic of the bioinformatics pipeline. Flowchart illustrating the analytical scheme used to progress from SNPs located in enhancers within LOAD GWAS regions to a filtered set of SNPs that have a predictive regulatory effect on transcription in disease relevant tissues. eQTL, expression quantitative trait loci; GWAS, genome‐wide association study; LOAD, late‐onset Alzheimer's disease; SNP, single nucleotide polymorphism; TF, transcription factor
Integration of our bioinformatics tools could pinpoint candidate regulatory SNPs and causal genes with the putative transcription factors that mediate their effect for further validation in laboratory‐based experimentation using in vitro and in vivo model systems.
2. METHODS
2.1. Cataloguing SNPs in LOAD‐defined enhancers
The approach for identifying active enhancers in LOAD GWAS regions is described in detail in Lutz et al. 28 In brief, the region tagged by each LOAD‐SNP was initially defined by anchoring the center of the region on the GWAS SNP and extending 500 kb in each direction to cover a 1Mb locus. Genes on the boundary of the 1Mb region were examined and the locus extended to cover the full length of the gene if the boundary intersects within a gene. Chromatin state segmentation data from the Roadmap Consortium 31 was used to list active enhancers identified in brain regions affected in LOAD: hippocampus middle, inferior temporal lobe, and mid frontal lobe. The chromatin state segmentation was derived from a common set of states across the specific cell types by computationally integrating ChIP‐seq data for six core marks (H3K27me3, H3K36me3, H3K4me1, H3K4me3, H3K9ac, H3K9me3) + H3K27ac using a hidden Markov model (HMM). For the current study, the recent LOAD GWAS data reported by Kunkle et al. 7 defined the LOAD‐associated loci. SNPs located within the enhancers were catalogued using the UCSC Table Browser 32 , 33 to load data for SNPs with global minor allele frequencies > 0.01 from dbSNP version 150 for all genetic enhancer regions identified.
2.2. Predicting TF binding sites affected by SNPs in LOAD enhancers
Prediction of TF binding sites was performed at two different steps in the bioinformatics pipeline. The software package/algorithm motifbreakR 34 was used to estimate or predict whether the sequence surrounding a SNP matches to specific TF binding sites, and how one allele of the SNP relative to the other affects the strength of the TF binding site (gain or loss of the TF binding affinity). MotifbreakR can predict effects for novel or previously described variants in public databases. For our study, we used the information content (ic) algorithm and position weight matrices from Homer, HOCOMOCO, Factorbook, and ENCODE.
In the first step of the bioinformatics pipeline, each SNP from the catalogue we generated for LOAD‐GWAS enhancers was evaluated for the potential to disrupt/gain TF binding sites using a predicted P value < 1 × 10⁻⁴. For the second step, after all filtering steps are completed, the remaining SNPs are evaluated for impact on specific TF binding with calculation of a permutation P value, score for impact on binding, and assessment of loss or gain of a binding site based on the motifbreakR calculations.
2.3. Evaluation of candidate transcription factors and their binding sites in LOAD enhancers
All TF binding sites with a predicted P value < 1 × 10⁻⁴ were further evaluated as follows: (1) all respective TFs were listed and filtered by expression in relevant tissues, that is, brain and monocytes, and (2) confirmation of the TF binding site within the LOAD defined enhancers by ChIP‐seq data.
2.3.1. Expression in brain tissues and monocytes
Expression in brain tissues was interrogated using GTEx Gene V8 (August 2019) GRCh37/hg19. The UCSC Table Browser 33 was used to download the GTEx expression data for the candidate TFs. The analyzed brain tissues included cortex, frontal cortex, and hippocampus. Median expression level in transcripts per million was computed per TF/per tissue. The score was derived from total median of all categories TF/per tissue and was log‐transformed and scaled to a range of 0 to 1000. To quantify whether an expression signal was significant, mean scores for each TF per brain tissue were obtained and the lower quartile was calculated and used as a threshold value. For each TF of interest, if the mean score was greater than this threshold, we noted that the TF was expressed in the specific brain tissue.
RESEARCH‐IN‐CONTEXT
Systematic review: The authors reviewed the Literature using PubMed, meeting abstracts, and presentations and downloaded publicly available datasets. The goal of the work is to link candidate regulatory single nucleotide polymorphisms (SNPs) with putative transcription factors and to pinpoint the causal genes through which they mediate their pathogenic effect for further validation in laboratory‐based experiments.
Interpretation: Our findings supported the concept that late‐onset Alzheimer's disease (LOAD)‐associated variants are likely markers for the actual functional variants and that the interpretation of genome‐wide association study (GWAS) discoveries requires the integration functional genomic datasets and information related to the dysfunction of regulatory elements in the context of LOAD. This study extended prior work with enhancers in LOAD GWAS regions to include the effect on putative transcription factor binding sites. The bioinformatics pipeline is used to characterize several LOAD GWAS loci including apolipoprotein E.
Future directions: Future work will focus on (1) examining non‐SNP variations (deletions, insertions, indels) using a similar bioinformatics pipeline and (2) using cell‐type–specific single nucleus datasets such as parallel snRNA‐seq and snATAC‐seq. Furthermore, alternative approaches for evaluation of transcription factor binding site affinity will be tested.
Expression in monocytes was obtained from the Cardiogenics data. 35 To quantify whether a monocyte expression signal was significant, mean scores for each TF were obtained and the lower quartile was calculated and used as a threshold value. For each TF of interest, if the mean score was greater than this threshold, we noted that the TF was expressed in monocytes.
2.3.2. ChIP‐seq data
ChIP‐seq data from ENCODE 29 , 30 (March 2012 Freeze) was used to confirm the likelihood of each TF to bind at the predicted site within the LOAD‐associated enhancer. TF ChIP‐seq Uniform Peaks from ENCODE/Analysis were downloaded using the UCSC Table Browser. 32 , 33 The data represents peak calls (regions of enrichment) that were generated by the ENCODE Analysis Working Group (AWG) based on a uniform processing pipeline developed for the ENCODE Integrative Analysis effort. 29 ChIP‐seq scores were assigned to peaks by multiplying the input signal values by a normalization factor calculated as the ratio of the maximum score value (1000) to the signal value at 1 standard deviation (SD) from the mean, with values exceeding 1000 capped at 1000. This provided the effect of distributing scores up to the mean plus one 1 SD across the score range but assigning all above to the maximum score. Presence of a TF in the ChIP‐seq data was confirmed if a score was reported for any of the 91 cell types. To quantify whether a ChIP‐seq signal was statistically significant, mean scores for each gene across tissue sources were obtained and the lower quartile was calculated and used as a threshold value. For each TF of interest, if the mean score was greater than this threshold, we noted that a positive ChIP‐seq signal was present.
2.4. eQTL analysis
eQTL analysis was performed using the GTEx Portal 36 , 37 to visualize and quantify eQTLs for specific SNPs. We performed eQTL analysis using GTEx expression data for the following tissues: brain (hippocampus, frontal cortex, cerebellum, cortex, and caudate), tibial nerve, and monocytes. While the primary eQTL analysis was done in these tissues, we also tested for significant eQTL signals in cultured fibroblasts due to the availability of results for many SNPs in GTEx.
2.5. Genome version and coordinates
All genomic data and coordinates are based on the February 2009 version of the genome: hg19, GRCh37.
3. RESULTS
3.1. Bioinformatics pipeline to identify transcriptional regulatory SNPs in genetic enhancers within LOAD GWAS regions in disease relevant tissues
The bioinformatics pipeline illustrated in Figure 1 shows the specific analysis steps to progress from SNPs located in LOAD GWAS regions 7 to a filtered set of SNPs that have a putative regulatory effect on transcription in LOAD‐relevant tissues.
We identified 61 strong enhancers in the 25 LOAD GWAS loci reported by Kunkle et al. 7 (Table S1 in supporting information). This recent GWAS extended the set of LOAD‐associated loci and enhancers from the 2013 International Genomics of Alzheimer's Disease Project LOAD GWAS 1 used in our earlier study 28 by inclusion of five new genome‐wide significant loci. Note that as new LOAD GWAS are completed, the analytical pipeline developed in this study can easily be applied to any set of resulting loci.
We then generated a catalogue of SNPs that mapped to the enhancers and found a total of 323 common variants (minor allele frequency > 0.01 [dbSNP version 150]; Table S2 in supporting information). We filtered the list by applying motifbreakR and found that 11 SNPs are predicted to affect the binding of 104 TFs (threshold P < 1 × 10⁻⁴). Of note, a SNP potentially can interrupt (gain or loss) binding at multiple TF binding sites. The complete list of SNPs, all corresponding TFs, the specific binding sequence matched, the position of the SNP within the motif, and the statistical results for the motifbreakR binding disruption scores for the SNP alternate and reference alleles are provided in Table S3 in supporting information. We examined the expression of these TFs in brain tissues relevant to LOAD pathology (frontal cortex, temporal cortex, hippocampus) and/or monocytes as a surrogate for microglia. Out of 104 TFs, 77 and 78 were expressed in brain and monocytes, respectively, including 34 TFs expressed in both brain tissues and monocytes. Expression plots in brain tissue and monocytes of all TFs considered in the analysis are shown in Figure S1 in supporting information. Next, we used the ChIP‐seq data from ENCODE to confirm evidence for binding of each of these TFs to its putative genomic locus within LOAD enhancer. However, ChIP‐seq data was available only for 24 of the 34 candidate TFs out of which 19 showed a signal above baseline in the ChIP‐Seq data (Table S4 in supporting information). The impact of SNPs overlapping the binding sites of this set of 19 TFs was further evaluated using motifbreakR and resulted in a filtered list of 11 LOAD enhancer regulatory SNPs showing a strong, statistically significant effect on TF binding. We characterized the linkage structure between the alleles of the enhancer SNP and the alleles of the LOAD GWAS SNP to determine the direction of the effect on TF binding (loss or gain) in relation to the LOAD risk allele. The direction (loss or gain) and statistical analysis of the regulatory SNP effect on TF binding affinity, along with the corresponding LOAD GWAS SNP and the linkage disequilibrium (LD) between the regulatory and the GWAS SNPs are summarized in Table 1. For the two apolipoprotein E (APOE) enhancer SNPs (rs1065853 and rs10414043) Table 1 informed the linkage disequilibrium with each of the two coding SNPs that comprise the APOE haplotype (rs7412 and rs429358), that is, four pairs, allowing for the possibility of linkage between each enhancer SNP and each of the two APOE coding SNPs (separated by only 138 bp). The majority (n = 8) of enhancer SNPs were predicted to have loss of TF binding while three enhancer SNPs were predicted to gain TFs binding (Table 1). Comparison of the effect sizes (beta coefficients) between the enhancer SNPs and GWAS SNPs showed similar magnitudes. The bioinformatics pipeline is concluded by eQTL analysis of the candidate LOAD enhancer regulatory SNPs using GTEx data of disease‐relevant tissues and cell types. Out of the 11 predicted LOAD‐enhancer regulatory SNPs we found three significant eQTLs in GTEx tissues including brain caudate, tibial nerve, and cultured fibroblasts (Table S5 in supporting information).
TABLE 1.
Regulatory SNP effects on transcription factor binding affinity
| Enhancer | |||||||||||
|---|---|---|---|---|---|---|---|---|---|---|---|
| SNP | Chr | Location | Effect allele | Non effect allele | Beta | Beta SE | P value | TF | Binding loss or gain | MotifbreakR p value | |
| 1 | rs111378762 | 6 | 32,577,504 | A | G | −0.0744 | 0.0595 | 0.2108 | POU3F1 | – | 1.59E‐02 |
| 2 | rs10795875 | 10 | 11,716,429 | A | G | 0.0055 | 0.0153 | 0.7176 | SPI1 | – | 1.56E‐04 |
| 3 | rs11257243 | 10 | 11,724,372 | A | G | −0.0194 | 0.0187 | 0.2976 | IRF5 | – | 2.74E‐03 |
| 4 | rs10792832 | 11 | 85,867,875 | A | G | −0.1195 | 0.0148 | 7.56E‐16 | SPI1 | – | 1.60E‐02 |
| 5 | rs11234564 | 11 | 85,869,944 | C | G | 0.0494 | 0.0179 | 0.005818 | SP1 | – | 1.66E‐02 |
| 6 | rs11234565 | 11 | 85,870,006 | FOXO1 | – | 1.10E‐02 | |||||
| 7 | rs76292249 | 11 | 59,951,740 | SPI1 | – | 2.45E‐04 | |||||
| 8 | rs116371174 | 11 | 47,421,694 | A | G | −0.4308 | 0.4317 | 0.3182 | RUNX3 | + | 5.83E‐02 |
| 9 | rs10131374 | 14 | 92,927,531 | A | G | −0.0403 | 0.0211 | 0.05672 | E2F1 | + | 1.28E‐02 |
| 10 | rs1065853 | 19 | 45,413,233 | NR2F2, POLR2A, TEAD4, TAL1 | + | 9.99E‐04 | |||||
| 11 | rs10414043 | 19 | 45,415,713 | A | G | 1.1368 | 0.0201 | 0 | ARNT2 | – | 2.13E‐02 |
| 12 | rs1065853 | 19 | 45,413,233 | NR2F2, POLR2A, TEAD4, TAL1 | + | 9.99E‐04 | |||||
| 13 | rs10414043 | 19 | 45,415,713 | A | G | 1.1368 | 0.0201 | 0 | ARNT2 | – | 2.13E‐02 |
| GWAS | Linkage disequilibrium | |||||||||||
|---|---|---|---|---|---|---|---|---|---|---|---|---|
| SNP | Location | Gene | Major/minor allele | Effect allele | Non effect allele | Beta | Beta SE | P value | Distance GWAS SNP to enhancer SNP | R2 GWAS SNP and enhancer SNP | Correlated alleles enhancer‐GWAS | |
| 1 | rs9271058 | 32,575,406 | HLA ‐DRB1 | T/A | A | T | 0.094 | 0.0172 | 5.14E‐08 | 2098 | 0.0334 | |
| 2 | rs7920721 | 11,720,308 | ECHDC3 | A/G | A | G | −0.0782 | 0.015 | 1.94E‐07 | 3879 | 0.28 | G‐G, A‐A |
| 3 | rs7920721 | 11,720,308 | ECHDC3 | A/G | A | G | −0.0782 | 0.015 | 1.94E‐07 | 4064 | 0.055 | |
| 4 | rs3851179 | 85,868,640 | PICALM | C/T | T | C | −0.1198 | 0.0148 | 5.81E‐16 | 765 | 0.987 | A‐T, G‐C |
| 5 | rs3851179 | 85,868,640 | PICALM | C/T | T | C | −0.1198 | 0.0148 | 5.81E‐16 | 1304 | 0.132 | G‐T, C‐C |
| 6 | rs3851179 | 85,868,640 | PICALM | C/T | T | C | −0.1198 | 0.0148 | 5.81E‐16 | 1366 | 0.197 | T‐T, G‐C |
| 7 | rs7933202 | 59,936,926 | MS4A6A | A/C | A | C | 0.1165 | 0.0147 | 2.15E‐15 | 14814 | 0.001 | |
| 8 | rs3740688 | 47,380,340 | SPI1 | T/G | T | G | 0.0935 | 0.0144 | 9.7E‐11 | 41354 | 0.001 | |
| 9 | rs12881735 | 92,932,828 | SLC24A4 | T/C | T | C | 0.088 | 0.0175 | 4.88E‐07 | 5297 | 0.048 | |
| 10 | rs429358 | 45,411,941 | APOE | T/C | T | C | −1.2017 | 0.0189 | 0 | 1292 | 0.012 | |
| 11 | rs429358 | 45,411,941 | APOE | T/C | T | C | −1.2017 | 0.0189 | 0 | 3772 | 0.759 | G‐T, A‐C |
| 12 | rs7412 | 45,412,079 | APOE | C/T | T | C | −0.4673 | 0.0305 | 6.4E‐53 | 1154 | 1 | G‐C, T‐T |
| 13 | rs7412 | 45,412,079 | APOE | C/T | T | C | −0.4673 | 0.0305 | 6.4E‐53 | 3634 | 0.009 | |
Notes: Effect allele, non‐effect allele, beta, standard error for beta, and P value for all SNPs are from the LOAD GWAS reported in Kunkle et al. 7 For binding loss or gain, +/‐ indicates gain or loss of binding function for the effect allele of the enhancer SNP on the specified transcription factor motif. MotifbreakR P value estimates the statistical significance of the effect allele to disrupt (gain or loss of binding function) specific motifs in the transcription factor. Correlated alleles column indicates the specific alleles of the enhancer and GWAS SNPs that are in linkage disequilibrium. All genomic data and coordinates are based on the February 2009 version of the genome: hg19, GRCh37.
Abbreviations: Chr, chromosome; eQTL, expression quantitative trait loci; GWAS, genome‐wide association study; LOAD, late‐onset Alzheimer's disease; SE, standard error; SNP, single nucleotide polymorphism; TF, transcription factor
3.2. Implementation of the bioinformatics pipeline using examples of four LOAD GWAS regions
To demonstrate the utility of the bioinformatics pipeline, we showed here examples for four LOAD GWAS regions.
3.2.1. Identifying enhancer SNPs in LOAD GWAS regions that disrupt TF binding sites
For each of the four LOAD‐GWAS loci presented below (denoted by the gene most proximate to the GWAS SNP), we identified the enhancer proximate to the LOAD GWAS SNP, catalogued all SNPs mapped within the enhancer region, determined the SNPs that are predicted to disrupt TF binding sites, and indicated their corresponding TFs. Figures 2, 3, 4, 5 visualize the LOAD‐GWAS extended regions and depicted the enhancer and the genomic relationships between the SNP that disrupts the TF and the LOAD GWAS SNP.
FIGURE 2.
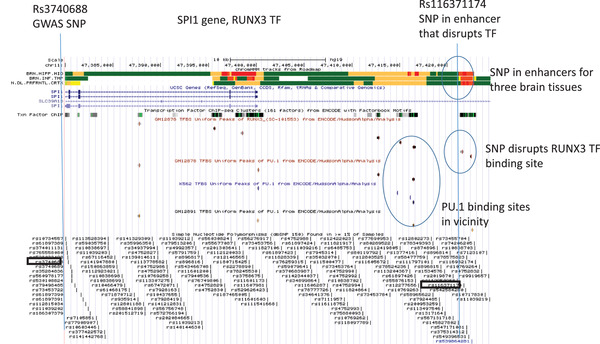
Genome browser view of the SPI1 LOAD GWAS locus. Tracks include (upper to lower): Chromatin state segmentation information for brain tissues (brain hippocampus middle, brain inferior temporal lobe, brain dorsolateral prefrontal cortex), orange shading indicates active enhancers (Roadmap); gene structure (UCSC gene); TFs ChIP‐seq (ENCODE); TF binding sites in cell‐lines; and SNPs position (dbSNP150). The enhancer SNP (rs11637114) disrupts the RUNX3 TF (circled in blue). The locations of PU.1 binding sites are also highlighted on the map. GWAS, genome‐wide association study; LOAD, late‐onset Alzheimer's disease; SNP, single nucleotide polymorphism
FIGURE 3.
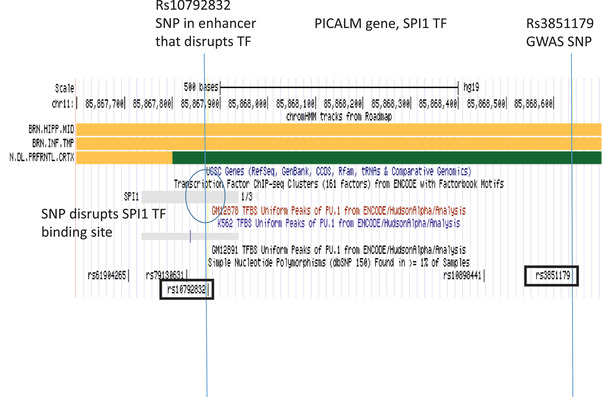
Genome browser view of the PICALM LOAD GWAS locus. Tracks include (upper to lower): Chromatin state segmentation information for brain tissues (brain hippocampus middle, brain inferior temporal lobe, brain dorsolateral prefrontal cortex), orange shading indicates active enhancers (Roadmap); gene structure (UCSC gene); TFs ChIP‐seq (ENCODE); TF binding sites in cell‐lines; and SNP position (dbSNP150). The enhancer SNP (rs10792832) disrupts the SPI1 TF (circled in blue). GWAS, genome‐wide association study; LOAD, late‐onset Alzheimer's disease; SNP, single nucleotide polymorphism; TF, transcription factor
FIGURE 4.
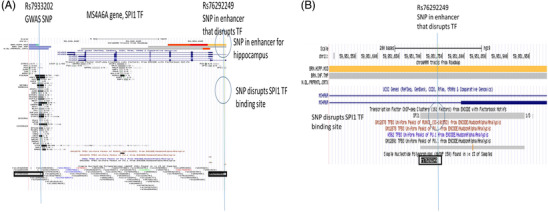
Genome browser view of the MS4A6A LOAD GWAS locus. Tracks include (upper to lower): Chromatin state segmentation information for brain tissues (brain hippocampus middle, brain inferior temporal lobe, brain dorsolateral prefrontal cortex), orange shading indicates active enhancers (Roadmap); gene structure (UCSC gene); TFs ChIP‐seq (ENCODE); TF binding sites in cell‐lines; and SNPs position (dbSNP150). The enhancer SNP (rs76292249) disrupts the SPI1 TF (circled in blue). A, UCSC genome browser plot for MS4A6A locus that includes the GWAS SNP (rs7933202) and the SNP (rs76292249) in the enhancer that disrupts the SPI1 TF. B, Inset shows detail surrounding the enhancer SNP (rs76292249). GWAS, genome‐wide association study; LOAD, late‐onset Alzheimer's disease; SNP, single nucleotide polymorphism; TF, transcription factor
FIGURE 5.
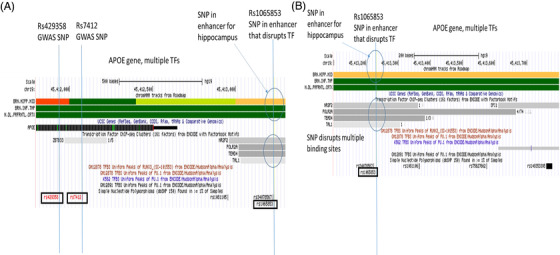
Genome browser view of the of the apolipoprotein E (APOE) locus. The scheme indicated the APOE epsilon haplotype coding SNPs (rs7412, rs429358) and the SNP in genetic enhancer (rs1065853) for the APOE LOAD GWAS locus. Tracks include (upper to lower): Chromatin state segmentation information for brain tissues (brain hippocampus middle, brain inferior temporal lobe, brain dorsolateral prefrontal cortex), orange shading indicates active enhancers (Roadmap); gene structure (UCSC gene); TFs ChIP‐seq (ENCODE); TF binding sites in cell‐lines; and SNPs position (dbSNP150). The enhancer SNP disrupts multiple TFs. A, UCSC genome browser plot for APOE locus that includes the APOE‐haplotype coding SNPs (rs7412, rs429358) and the SNP (rs1065853) in the enhancer that disrupts several TFs including TAL1, TEAD4, POLR2A, and NR2F2. B, Inset shows detail surrounding the enhancer SNP (rs1065853). GWAS, genome‐wide association study; LOAD, late‐onset Alzheimer's disease; SNP, single nucleotide polymorphism; TF, transcription factor
3.2.1.1. SPI1 locus
SNP rs116371174 is located in a predicted active enhancer adjacent to the SPI1 gene for three brain tissues, frontal cortex, temporal cortex, and hippocampus (Figure 2). SNP rs116371174 disrupts the binding site of the TF RUNX3 and is also adjacent to the PU.1 binding site (Figure 2). Although rs116371174 was not predicted to affect PU.1 binding, the proximity of the two TF binding sites suggests a possible interaction between the TFs in this region that may have biological consequences. The GWAS SNP near the SPI1 gene (rs3740688) is located 41,354 bp from the enhancer SNP and the LD between these SNPs is non‐existent to very weak (Figure 2).
3.2.1.2. PICALM locus
The predicted active enhancers in the hippocampus and temporal cortex near the LOAD associated PICALM gene encompassed SNP rs10792832 that disrupts the SPI1 TF binding site (encoded the PU.1 TF; Figure 3). The GWAS SNP rs3851179 is located only 765 bp from the enhancer SNP and there is strong LD (r2 = 0.99) between these SNPs (Figure 3). In addition, two SNPs in this region (rs11234564 and rs11234565) located within putative strong transcriptional elements in hippocampus, temporal cortex, and prefrontal cortex are predicted to disrupt the SP1 and FOXO1 TFs, respectively (Table 1). These SNPs are located 1304 bp and 1366 bp from the GWAS SNP and showed weak LD with the GWAS SNP (r2 = 0.13 and 0.20 respectively).
3.2.1.3. MS4A6A
The diagram for the LOAD GWAS (rs7933202) and enhancer (rs76292249) SNPs that are located near the MS4A6A gene are shown in Figure 4. The enhancer SNP (rs76292249) is located in a predicted active enhancer for the hippocampus and disrupts a SPI1 TF binding site in this gene (Figure 4B). The GWAS SNP (rs7933202) is located 14,814 bp from the enhancer SNP and the LD between these SNPs is very weak (r2 = 0.001).
3.2.1.4. APOE
Two SNPs (rs1065853, rs10414043) located in enhancers in the APOE region are predicted to interrupt the binding sites of multiple TFs with strong effects (Table 1, Table S3). SNP rs1065853, located in an active enhancer for the hippocampus, is predicted to interrupt the binding sites of four TFs including NR2F2, POL2R2A, TEAD4, and TAL1 (Figure 5). This SNP is located 1154 bp and 1292 bp, respectively, from the two APOE coding SNPs, rs7412 (defined the APOE ε2 allele) and rs429358 (APOE ε4 allele). The second enhancer SNP, rs10414043, is located in active enhancers for three brain tissues, frontal cortex, temporal cortex, and hippocampus (data not shown) and is predicted to interrupt the ARNT2 TF. This SNP is located 3634 bp and 3772 bp, respectively, from rs7412 and rs429358. The LD patterns for these enhancer SNPs and the APOE coding SNPs are complex because all are located within 1 to 4 Kb of each other and the results for all pairs of APOE coding SNPs and enhancer SNPs are reported in Table 1. Based on the R2 between the APOE coding SNPs and the enhancer SNPs, the most likely LD pairing would be rs1065853 with rs7412 (R2 = 1) and between rs10414043 and rs429358 (R2 = 0.8).
3.2.2. The expression of the corresponding TFs in brain tissues and monocytes
We examined the TF expression data in specific brain tissues (frontal cortex, temporal cortex, and hippocampus) and monocytes (Figure 6). For the purpose of implementation of the pipeline, we focused on the corresponding TFs identified by the bioinformatics pipeline for the four LOAD GWAS examples (described above), that is, SPI1, RUNX3, ARNT2, NR2F2, POL2R2A, TEAD4, and TAL1. Overall, each of these TFs showed significantly increased expression above baseline using a definition of the first quartile of the data for each tissue as baseline. Note that the expression of ARNT2, corresponding to the enhancer SNP rs10414043 in the APOE region, was extremely high compared to the other examined TFs in all three brain tissues (Figure 6A‐C). In monocytes, the expression levels of SPI1, SP1 RUNX3, and FOXO1 were higher than the other expressed TFs (Figure 6D).
FIGURE 6.
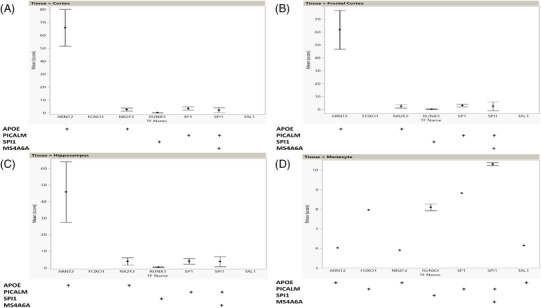
Expression profiles of TFs in specific brain tissues and monocytes. The TFs presented here were identified to have disrupted binding site/s in the four examples of LOAD GWAS genomic loci (APOE, PICALM, SPI1, and MS4A6A). Calculation of score is described in Methods. The matrix under each expression plot identifies each LOAD GWAS locus by the name of the proximal gene. A + symbol in the matrix indicates that the TF labelled on the X axis (column heading) is expressed at each of the loci (row label at left): (A) brain, temporal cortex; (B) brain, frontal cortex; (C) brain, hippocampus; (D) monocytes. GWAS, genome‐wide association study; LOAD, late‐onset Alzheimer's disease; SNP, single nucleotide polymorphism; TF, transcription factor
3.2.3. Evidence of the TFs binding in LOAD enhancers by ChIP‐seq signals
We next evaluated the ChIP‐seq uniform peak signals (ENCODE) for the four LOAD GWAS examples’ loci (Figure 7). The score displayed on the graph is the highest score for any peak contributing to the cluster. Scores were considered significant if they were above the baseline for each of these TFs using a definition of the first quartile of the data as baseline. This step in the analysis pipeline was performed to test for evidence of a TF binding site in a LOAD enhancer in any tissue or cell line. The current ENCODE data were limited in terms of coverage of brain tissue relevant to LOAD. Cell lines highly represented in the data include MCF‐7 and HepG2. Of note, SPI1 showed the highest ChIP‐seq signal scores for LOAD enhancers in both the PICALM and MS4A6A regions.
FIGURE 7.
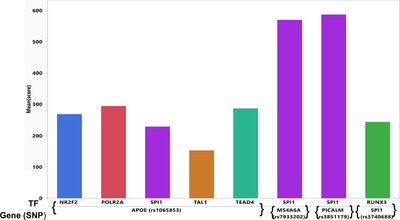
ChIP‐seq uniform peak signals from ENCODE for the four examples of LOAD GWAS genomic loci (APOE, PICALM, SPI1, and MS4A6A). Calculation of score is described in Methods. First row of the X axis indicates transcription factor, second row indicates the LOAD GWAS proximal gene and LOAD GWAS SNP. GWAS, genome‐wide association study; LOAD, late‐onset Alzheimer's disease; SNP, single nucleotide polymorphism; TF, transcription factor
3.2.4. eQTL analysis of cis‐candidate enhancer SNPs
We performed eQTL analysis for the enhancer SNPs from the four examples using GTEx data, and found significant eQTLs for three SNPs. rs10792832 in the PICALM region showed a significant eQTL in cultured fibroblasts (Figure 8A), but did not show statistically significant eQTLs in single brain tissues (Figure 8B). A significant eQTL for rs116371174 in the SPI1 locus was identified in the basal ganglia of the brain (Figure 9A) and in single tissues for other brain regions (cortex, hypothalamus; Figure 9B). A significant eQTL was found for rs111378752 in the tibial nerve (Figure 10).
FIGURE 8.
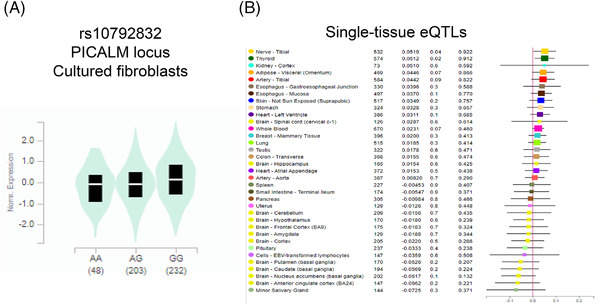
eQTL analysis for rs10792832 in the PICALM LOAD GWAS locus. A, Expression by rs10792832 genotype in cultured fibroblasts. B, Single tissue eQTLs for various tissues including brain. eQTL, expression quantitative trait loci; GWAS, genome‐wide association study; LOAD, late‐onset Alzheimer's disease; TF, transcription factor
FIGURE 9.
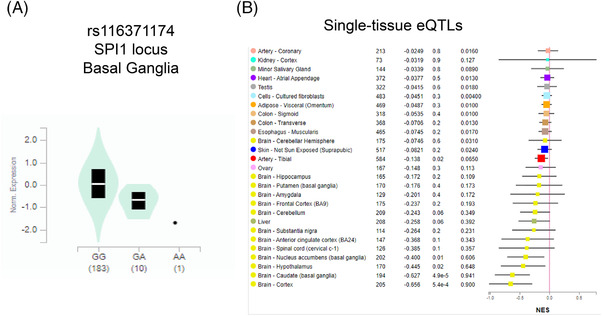
eQTL analysis for rs116371174 in the SPI1 LOAD GWAS locus. A, Expression by rs116371174 genotype in brain basal ganglia. B, Single tissue eQTLs for various tissues including brain. eQTL, expression quantitative trait loci; GWAS, genome‐wide association study; LOAD, late‐onset Alzheimer's disease; TF, transcription factor
FIGURE 10.
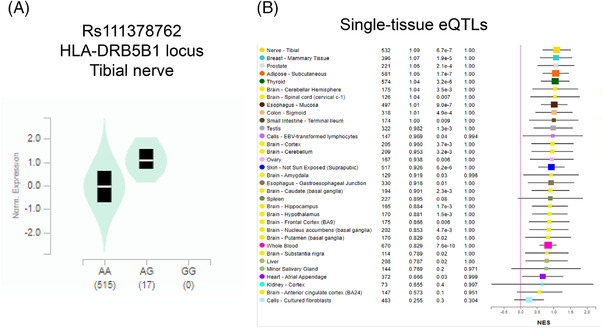
eQTL analysis for rs111378762 in the HLA‐DRB5 LOAD GWAS locus. A, Expression by rs111378762 genotype in tibial nerve. B, Single tissue eQTLs for various tissues including brain. eQTL, expression quantitative trait loci; GWAS, genome‐wide association study; LOAD, late‐onset Alzheimer's disease; SNP, single nucleotide polymorphism; TF, transcription factor
4. DISCUSSION
In this article, we developed a new bioinformatics analysis pipeline to characterize and prioritize SNPs in enhancers located in LOAD GWAS regions based on their predicted effect to alter TF binding sites. Our bioinformatics strategy is based entirely on publicly available genomic datasets including: genotype data (GWAS results) and functional genomic datasets such as annotation of enhancer elements (ENCODE chromatin state), position probability matrices for TF motifs (ENCODE, 29 , 30 HOMER, 38 Factorbook, 39 HOCOMOCO 40 ), gene expression (GTEx portal and Cardiogenetics), and ChIP‐seq data. Here we integrated these datasets and used the motifbreakR algorithm to construct a comprehensive bioinformatics resource for translating well‐replicated LOAD GWAS regions to mechanistic understanding in the context of transcriptional regulation and in particular the interaction between enhancer elements and TFs. We illustrated application of the pipeline using four LOAD‐GWAS regions as examples to show the utility and potential impact of the approach. The exemplars reported in this study cover a range of LOAD GWAS genes and TFs with prior literature support for their role in LOAD. Comprehensive reviews of the GWAS genes and their biological pathways have been published 9 , 41 , 42 , 43 and augment the data reported in the original GWAS studies. 1 , 7 , 44 , 45 A recent computational study examined the effects of 195 LOAD GWAS lead SNPs and 338 proxy SNPs on (1) miRNA binding and protein phosphorylation, (2) RegulomeDB and 3D SNP scores, (3) gene ontology, (4) pathway enrichment, and (5) protein–protein interactions of 126 LOAD‐associated genes. 46 The authors concluded that specific genes (APOE, PICALM, MA4A6A) and TFs (TAL1, POL2RA, TEAD4) likely have functional significance on the development of LOAD pathology. 46 These findings are consistent with our results.
Numerous LOAD genetic risk loci have been identified over the past 12 years via GWAS and the current challenge is to progress to causal genes and variants. These associated loci are based on marker or tagging SNPs that are assayed on the GWAS platforms and are not necessarily the causal variants within the identified risk loci. Here we developed a pipeline to translate LOAD risk loci into regulatory variants. Studies from several other groups have provided functional insights into LOAD GWAS regions. Molecular profiling and integrative multi‐omics approaches are the current focus in LOAD genetic research toward the identification the molecular drivers of LOAD. 47 , 48 , 49 , 50 Several bioinformatics approaches have been described to study the functional role of GWAS‐enhancer elements and variants on gene expression and in turn, development or progression of neurodegenerative diseases including LOAD. These approaches have included fine mapping DNA methylation sites in prefrontal cortex neurons from brains with different degrees of Alzheimer's disease pathology, 51 cataloguing enhancers in LOAD regions and mapping promoter‐enhancer interaction using Circular Chromosomal Conformation Capture (4C) data to prioritize genes for experimental follow‐up, 28 and integrating datasets of enhancer activity, TF binding sites, and eQTL 10 , 52 , 53 to characterize the effects of non‐coding genetic variation associated with LOAD risk. A recent study reported non‐coding LOAD SNPs that affect the function of enhancers and in turn impact the expression of distal genes via chromatin loops. 29 Another group integrating LOAD GWAS results with myeloid epigenomic and transcriptomic datasets identified links among myeloid enhancer activity, target gene expression, and LOAD risk modification. 30 A common objective of these studies with the approach described in this article is to constitute an intermediate step between the genetic association signals and causal biology, whether variants, genes, or pathways. This intermediate step can be balanced between the costs of lab experimental work that will potentially greatly increase confidence that a variant or gene is causal for LOAD pathology and the much lower cost, moderate and testable evidence from bioinformatics analysis based on publicly available data.
Several TFs identified through our bioinformatics pipeline were previously reported in the context of LOAD. In this paragraph, we focus on the analysis of the APOE region. Interpretation of the enhancer SNPs that link to the coding ε4 SNP (Table 1) showed that rs10313043 is predicted to cause a loss of binding for the ARNT2 TF while rs1065853 is predicted to cause a gain of binding function for four TFs—NR2F2, POLR2A, TEAD4, and TAL1. ARNT2 (aryl‐hydrocarbon receptor nuclear translocator 2) encodes the neuroprotective protein, aryl hydrocarbon receptor (AHR) expressed almost exclusively in the central nervous system (CNS). A recent study reported higher serum levels of AHR in the elderly in contrast to young post mortem brain samples and higher serum levels of AHR in LOAD patients than in other participants, 54 suggesting that AHR contributes to the development of LOAD through the response of glial cells to a pro‐inflammatory environment in the CNS. 54 An example of a TF that gains binding strength is NRF2. The expression of NRF2 levels were decreased in LOAD 55 , 56 and it was shown to be involved in the modulation of oxidative stress, neuroinflammation, mitochondrial function, and ferroptosis in LOAD, with the suggstion as a potential target to treat LOAD. 57 NRF2 was shown to regulate the expression of antioxidant genes that could potentially protect neurons from oxidative stress, an early pathophysiological factor for LOAD. 56 , 58 The overall beneficial effect of increased NRF2 expression for LOAD pathophysiology corresponded with our finding of predicted gain of function/binding for NRF2. In addition, a decrease in the level of TEAD and complexes of TEAD and YAP (Yes‐associated protein) was reported in early stage LOAD leading to increases in intracellular amyloid beta and in turn neuronal necrosis. 59 Finally, POLR2A 60 and TAL1 61 were also studied in relation to LOAD.
Our study pointed to a group of TFs that are expressed in microglia and play important roles in the immune system. A prominent example is the SPI1 gene that encodes PU.1, a TF that is critical for myeloid cell development and function and is known to regulate microglial inflammatory response. 62 PU.1 binds to cis‐regulatory elements of multiple LOAD‐associated genes that are expressed in human myeloid cells including ABCA7, CD33, MS4A4A, MS4A6A, TREM2, and TYROBP. 63 Another example is RUNX3, a hematopoietic stem and progenitor TF whose level decreases with age in humans. 64 RUNX3 plays a role in neuroinflammation specifically as a critical determinant in microglial activation. Of note, PU.1, RUNX1 (member of RUNX TF family), and TAL1 were identified as a subnetwork of transcription factors that are master regulators of an age‐dependent microglial module that regulates microglial homeostasis in the human frontal cortex. 61 Our findings support a role for these TFs in the early development of LOAD mechanistically associated with microglial perturbations.
5. LIMITATIONS
The major limitation in the implementation of the bioinformatics pipeline is the lack of large collections of functional genomic datasets from LOAD cases, for example, the limited availability of gene expression data from individuals with LOAD and ChIP‐seq data from LOAD‐relevant brain tissues. The examples presented in this article used gene expression data and epigenomic profiles from bulk brain tissue samples. As more single‐nucleus multi‐omics datasets, such as parallel snRNA‐seq and snATAC‐seq, become available from LOAD patients and matched controls, the bioinformatics pipeline could be used to generate a more accurate catalogue of candidate LOAD genes and variants with an unprecedented cell‐type specific precision. We used ChIP‐seq data from various cell lines to confirm presence of a TF binding site; however, in future studies testing for these sites in LOAD‐relevant tissues would provide additional functional support. A second limitation is that the bioinformatics pipeline is focused on SNP variation. While we presented the utility of the bioinformatics pipelines in prioritizing LOAD functional SNPs for validation studies, the pipeline would be strengthened if it were generalized for other classes of genetic variants including short structural variants such as deletions/insertions and repeat variants. Indeed, inclusion of a recently developed function in the motifbreakR algorithm into our bioinformatics pipeline will enable the evaluation of indels as causal genetic variants in LOAD. Alternative approaches for predicting the effects of SNPs on TF binding affinity which utilize previous knowledge of the binding pattern of transcription factors are available, notably the SNP effect matrix pipeline that estimates TF binding affinity using ChIP‐seq data, providing an estimate of a transcription factor's endogenous binding in the genome. 65 Another approach is based on DNase I hypersensitive site (DNase‐seq) data, which represents regions of open chromatin in which transcription factors are known to function and position weight matrices. 66
6. CONCLUSIONS
In summary, we developed a bioinformatics pipeline to catalogue noncoding variants in enhancers located in LOAD‐GWAS loci and to prioritize them for further validation experiments that will continue to evolve with the generation of new multi‐omics datasets using advanced genomic technologies. To show application of the pipeline, examples were presented of four LOAD‐GWAS regions with corresponding literature, ChIP‐seq, and eQTL evidence for the involvement of specific genes and TFs. Of note, our study identified a group of TFs that are expressed in microglia and play important roles in the immune system with potential involvement in the development of LOAD. We also presented an analysis of TF binding sites that are disrupted by enhancer SNPs in the APOE region that has potentially high significance for translational research in LOAD.
CONFLICTS OF INTEREST
Grant funding for the past 36 months. Ornit Chiba‐Falek: 1. SRA 2020 Chiba‐Falek, Kantor (MPI) 08/26/2020 ‐ 02/25/2022 Seelos Therapeutics, 2. Kahn Neurodegeneration Award (Duke) Chiba‐Falek (PI), 3. 1RF1‐NS113548‐01A1 Chiba‐Falek (PI) National Institutes of Health, 4. R56‐AG062344 Chiba‐Falek (subaward PI) Wang, 5. 1R56‐AG062302 Lutz, Chiba‐Falek, Luo, Williamson National Institutes of Health/NIA, 6. 1R01‐AG057522 Chiba‐Falek, Lutz (MPI) National Institutes of Health/NIH. Michael W. Lutz: 1. R01AG057522 Chiba‐Falek (PI) National Institutes of Health, 2. RF1‐AG057895 Lutz (co‐PI) National Institutes of Health, 3. R01‐AG066184 Badea (PI) National Institutes of Health, 4. R01‐AG064803‐02 Luo (PI) National Institutes of Health, 5. P01‐AG031719 Vaupel (PI) National Institutes of Health, 6. R01‐ES024288 Plassman (PI) National Institutes of Health, 7. R56‐AG062302 Lutz (PI) National Institutes of Health. Dr. Chiba‐Falek is a consultant to Seelos Therapeutics. Dr. Lutz received consulting fees and travel expenses to attend scientific conferences from Zinfandel Pharmaceuticals. Dr. Chiba‐Falek reports filing a patent application: PCT/US2019/028786 entitled “Downregulation of SNCA Expression by Targeted Editing of DNA‐Methylation.”
AUTHOR CONTRIBUTIONS
Ornit Chiba‐Falek: Developed the plan for the study, designed the concept for the bioinformatics pipeline, and interpreted the results. Michael W. Lutz: Performed the bioinformatics analysis and interpreted the results. All authors participating in writing the draft manuscript. All authors read and approved the final manuscript.
Supporting information
Supporting Information
Supporting Information
Supporting Information
Supporting Information
Supporting Information
Supporting Information
ACKNOWLEDGMENTS
This work was funded in part by the National Institutes of Health/National Institute of Neurological Disorders and Stroke—NIH/NIA (R01 AG057522‐01 to Ornit Chiba‐Falek). The funding source did not have a role in the design of the study, collection of data, analysis and interpretation of the , or writing of the manuscript.
Lutz MW, Chiba‐Falek O. Bioinformatics pipeline to guide late‐onset Alzheimer's disease (LOAD) post‐GWAS studies: Prioritizing transcription regulatory variants within LOAD‐associated regions. Alzheimer's Dement. 2022;8: e12244. 10.1002/trc2.12244
REFERENCES
- 1. Lambert J‐C, Ibrahim‐Verbaas CA, Harold D, et al. Meta‐analysis of 74,046 individuals identifies 11 new susceptibility loci for Alzheimer's disease. Nat Genet. 2013;45(12):1452‐1458. [DOI] [PMC free article] [PubMed] [Google Scholar]
- 2. Naj AC, Jun G, Beecham GW, et al. Common variants at MS4A4/MS4A6E, CD2AP, CD33 and EPHA1 are associated with late‐onset Alzheimer's disease. Nat Genet. 2011;43(5):436‐441. [DOI] [PMC free article] [PubMed] [Google Scholar]
- 3. Harold D, Abraham R, Hollingworth P, et al. Genome‐wide association study identifies variants at CLU and PICALM associated with Alzheimer's disease. Nat Genet. 2009;41(10):1088‐1093. [DOI] [PMC free article] [PubMed] [Google Scholar]
- 4. Hollingworth P, Harold D, Sims R, et al. Common variants at ABCA7, MS4A6A/MS4A4E, EPHA1, CD33 and CD2AP are associated with Alzheimer's disease. Nat Genet. 2011;43(5):429‐435. [DOI] [PMC free article] [PubMed] [Google Scholar]
- 5. Jansen IE, Savage JE, Watanabe K, et al. Genome‐wide meta‐analysis identifies new loci and functional pathways influencing Alzheimer's disease risk. Nat Genet. 2019;51(3):404‐413. [DOI] [PMC free article] [PubMed] [Google Scholar]
- 6. Marioni RE, Harris SE, Zhang Q, et al. GWAS on family history of Alzheimer's disease. Translational Psychiatry. 2018;8(1):99–105. [DOI] [PMC free article] [PubMed] [Google Scholar]
- 7. Kunkle BW, Grenier‐Boley B, Sims R, et al. Genetic meta‐analysis of diagnosed Alzheimer's disease identifies new risk loci and implicates Abeta, tau, immunity and lipid processing. Nat Genet. 2019;51(3):414‐430. [DOI] [PMC free article] [PubMed] [Google Scholar]
- 8. Bellenguez C, Küçükali F, Jansen I, et al. New insights on the genetic etiology of Alzheimer's and related dementia. medRxiv. 2020:2020.10.01.20200659.
- 9. Pimenova AA, Raj T, Goate AM. Untangling genetic risk for Alzheimer's Disease. Biol Psychiatry. 2018;83(4):300‐310. [DOI] [PMC free article] [PubMed] [Google Scholar]
- 10. Amlie‐Wolf A, Tang M, Mlynarski EE, et al. INFERNO: inferring the molecular mechanisms of noncoding genetic variants. Nucleic Acids Res. 2018;46(17):8740‐8753. [DOI] [PMC free article] [PubMed] [Google Scholar]
- 11. Gallagher MD, Chen‐Plotkin AS. The post‐GWAS era: from Association to Function. Am J Hum Genet. 2018;102(5):717‐730. [DOI] [PMC free article] [PubMed] [Google Scholar]
- 12. Linnertz C, Anderson L, Gottschalk W, et al. The cis‐regulatory effect of an Alzheimer's disease‐associated poly‐T locus on expression of TOMM40 and apolipoprotein E genes. Alzheimer's & Dementia: J Alzheimer's Assoc. 2014;10(5):541‐551. [DOI] [PMC free article] [PubMed] [Google Scholar]
- 13. Matsui T, Ingelsson M, Fukumoto H, et al. Expression of APP pathway mRNAs and proteins in Alzheimer's disease. Brain Res. 2007;1161:116‐123. [DOI] [PubMed] [Google Scholar]
- 14. Zarow C, Victoroff J. Increased apolipoprotein E mRNA in the hippocampus in Alzheimer disease and in rats after entorhinal cortex lesioning. Exp Neurol. 1998;149(1):79‐86. [DOI] [PubMed] [Google Scholar]
- 15. Gibbs JR, van der Brug MP, Hernandez DG, et al. Abundant quantitative trait loci exist for DNA methylation and gene expression in human brain. PLoS Genet;6(5):e1000952.1–13. [DOI] [PMC free article] [PubMed] [Google Scholar]
- 16. Allen M, Zou F, Chai HS, et al. Novel late‐onset Alzheimer disease loci variants associate with brain gene expression. Neurology. 2012;79(3):221‐228. [DOI] [PMC free article] [PubMed] [Google Scholar]
- 17. Zou F, Chai HS, Younkin CS, et al. Brain expression genome‐wide association study (eGWAS) identifies human disease‐associated variants. PLoS genetics. 2012;8(6):e1002707.1–16. [DOI] [PMC free article] [PubMed] [Google Scholar]
- 18. Karch CM, Jeng AT, Nowotny P, Cady J, Cruchaga C, Goate AM. Expression of novel Alzheimer's disease risk genes in control and Alzheimer's disease brains. PLoS One. 2012;7(11):e50976.1–9. [DOI] [PMC free article] [PubMed] [Google Scholar]
- 19. Karch CM, Ezerskiy LA, Bertelsen S, Goate AM. Alzheimer's disease risk polymorphisms regulate gene expression in the ZCWPW1 and the CELF1 Loci. PloS One. 2016;11(2):e0148717.1–22. [DOI] [PMC free article] [PubMed] [Google Scholar]
- 20. Smith AR, Smith RG, Condliffe D, et al. Increased DNA methylation near TREM2 is consistently seen in the superior temporal gyrus in Alzheimer's disease brain. Neurobiol Aging. 2016;47:35‐40. [DOI] [PMC free article] [PubMed] [Google Scholar]
- 21. Zhao J, Zhu Y, Yang J, et al. A genome‐wide profiling of brain DNA hydroxymethylation in Alzheimer's disease. Alzheimer's & dementia : J Alzheimer's Assoc. 2017;13(6):674‐688. [DOI] [PMC free article] [PubMed] [Google Scholar]
- 22. Lunnon K, Smith R, Hannon E, et al. Methylomic profiling implicates cortical deregulation of ANK1 in Alzheimer's disease. Nat Neurosci. 2014;17(9):1164‐1170. [DOI] [PMC free article] [PubMed] [Google Scholar]
- 23. De Jager PL, Srivastava G, Lunnon K, et al. Alzheimer's disease: early alterations in brain DNA methylation at ANK1, BIN1, RHBDF2 and other loci. Nat Neurosci. 2014;17(9):1156‐1163. [DOI] [PMC free article] [PubMed] [Google Scholar]
- 24. Chibnik LB, Yu L, Eaton ML, et al. Alzheimer's loci: epigenetic associations and interaction with genetic factors. Ann Clin Transl Neurol. 2015;2(6):636‐647. [DOI] [PMC free article] [PubMed] [Google Scholar]
- 25. Yu L, Chibnik LB, Srivastava GP, et al. Association of Brain DNA methylation in SORL1, ABCA7, HLA‐DRB5, SLC24A4, and BIN1 with pathological diagnosis of Alzheimer disease. JAMA Neurol. 2015;72(1):15‐24. [DOI] [PMC free article] [PubMed] [Google Scholar]
- 26. Watson CT, Roussos P, Garg P, et al. Genome‐wide DNA methylation profiling in the superior temporal gyrus reveals epigenetic signatures associated with Alzheimer's disease. Genome Med. 2016;8(1):5–18. [DOI] [PMC free article] [PubMed] [Google Scholar]
- 27. Nativio R, Donahue G, Berson A, et al. Dysregulation of the epigenetic landscape of normal aging in Alzheimer's disease. Nat Neurosci. 2018;21(4):497‐505. [DOI] [PMC free article] [PubMed] [Google Scholar]
- 28. Lutz MW, Sprague D, Chiba‐Falek O. Bioinformatics strategy to advance the interpretation of Alzheimer's disease GWAS discoveries: the roads from association to causation. Alzheimers Dement. 2019;15(8):1048‐1058. [DOI] [PMC free article] [PubMed] [Google Scholar]
- 29. Consortium EP. An integrated encyclopedia of DNA elements in the human genome. Nature. 2012;489(7414):57‐74. [DOI] [PMC free article] [PubMed] [Google Scholar]
- 30. Davis CA, Hitz BC, Sloan CA, et al. The Encyclopedia of DNA elements (ENCODE): data portal update. Nucleic Acids Res. 2018;46(D1):D794‐D801. [DOI] [PMC free article] [PubMed] [Google Scholar]
- 31. Satterlee JS, Chadwick LH, Tyson FL, et al. The NIH Common Fund/Roadmap Epigenomics Program: successes of a comprehensive consortium. Sci Adv. 2019;5(7):eaaw6507. [DOI] [PMC free article] [PubMed] [Google Scholar]
- 32. Karolchik D, Baertsch R, Diekhans M, et al. The UCSC genome browser database. Nucleic Acids Res. 2003;31(1):51‐54. [DOI] [PMC free article] [PubMed] [Google Scholar]
- 33. Karolchik D, Hinrichs AS, Furey TS, et al. The UCSC Table Browser data retrieval tool. Nucleic Acids Res. 2004;32:D493‐6. Database issue. [DOI] [PMC free article] [PubMed] [Google Scholar]
- 34. Coetzee SG, Coetzee GA, Hazelett DJ. motifbreakR: an R/Bioconductor package for predicting variant effects at transcription factor binding sites. Bioinformatics. 2015;31(23):3847‐3849. [DOI] [PMC free article] [PubMed] [Google Scholar]
- 35. Garnier S, Truong V, Brocheton J, et al. Genome‐wide haplotype analysis of cis expression quantitative trait loci in monocytes. PLoS Genet. 2013;9(1):e1003240.1–11. [DOI] [PMC free article] [PubMed] [Google Scholar]
- 36. GTEx . Human genomics. The Genotype‐Tissue Expression (GTEx) pilot analysis: multitissue gene regulation in humans. Science. 2015;348(6235):648‐660. [DOI] [PMC free article] [PubMed] [Google Scholar]
- 37. GTEx , Laboratory DA, et al, GTEx . Genetic effects on gene expression across human tissues. Nature. 2017;550(7675):204‐213. [DOI] [PMC free article] [PubMed] [Google Scholar]
- 38. Heinz S, Benner C, Spann N, et al. Simple combinations of lineage‐determining transcription factors prime cis‐regulatory elements required for macrophage and B cell identities. Mol Cell. 2010;38(4):576‐589. [DOI] [PMC free article] [PubMed] [Google Scholar]
- 39. Wang J, Zhuang J, Iyer S, et al. Sequence features and chromatin structure around the genomic regions bound by 119 human transcription factors. Genome Res. 2012;22(9):1798‐1812. [DOI] [PMC free article] [PubMed] [Google Scholar]
- 40. Kulakovskiy IV, Medvedeva YA, Schaefer U, et al. HOCOMOCO: a comprehensive collection of human transcription factor binding sites models. Nucleic Acids Res. 2013;41:D195‐D202. Database issue. [DOI] [PMC free article] [PubMed] [Google Scholar]
- 41. Karch CM, Cruchaga C, Goate AM. Alzheimer's disease genetics: from the bench to the clinic. Neuron. 2014;83(1):11‐26. [DOI] [PMC free article] [PubMed] [Google Scholar]
- 42. Karch CM, Goate AM. Alzheimer's disease risk genes and mechanisms of disease pathogenesis. Biol Psychiatry. 2015;77(1):43‐51. [DOI] [PMC free article] [PubMed] [Google Scholar]
- 43. Neuner SM, Tcw J, Goate AM. Genetic architecture of Alzheimer's disease. Neurobiol Dis. 2020;143:104976.1–18. [DOI] [PMC free article] [PubMed] [Google Scholar]
- 44. Hollingworth P, Harold D, Sims R, et al. Common variants at ABCA7, MS4A6A/MS4A4E, EPHA1, CD33 and CD2AP are associated with Alzheimer's disease. Nat Genet;43(5):429‐435. [DOI] [PMC free article] [PubMed] [Google Scholar]
- 45. Lambert JC, Heath S, Even G, et al. Genome‐wide association study identifies variants at CLU and CR1 associated with Alzheimer's disease. Nat Genet. 2009;41(10):1094‐1099. [DOI] [PubMed] [Google Scholar]
- 46. Han Z, Huang H, Gao Y, Huang Q. Functional annotation of Alzheimer's disease associated loci revealed by GWASs. PLoS One. 2017;12(6):e0179677.1–14. [DOI] [PMC free article] [PubMed] [Google Scholar]
- 47. Ma Y, Klein HU, De Jager PL. Considerations for integrative multi‐omic approaches to explore Alzheimer's disease mechanisms. Brain Pathol. 2020;30(5):984‐991. [DOI] [PMC free article] [PubMed] [Google Scholar]
- 48. Wingo AP, Liu Y, Gerasimov ES, et al. Integrating human brain proteomes with genome‐wide association data implicates new proteins in Alzheimer's disease pathogenesis. Nat Genet. 2021;53(2):143‐146. [DOI] [PMC free article] [PubMed] [Google Scholar]
- 49. Mangleburg CG, Wu T, Yalamanchili HK, et al. Integrated analysis of the aging brain transcriptome and proteome in tauopathy. Mol Neurodegener. 2020;15(1):56–72. [DOI] [PMC free article] [PubMed] [Google Scholar]
- 50. De Jager PL, Ma Y, McCabe C, et al. A multi‐omic atlas of the human frontal cortex for aging and Alzheimer's disease research. Sci Data. 2018;5:180142.1–13. [DOI] [PMC free article] [PubMed] [Google Scholar]
- 51. Li P, Marshall L, Oh G, et al. Epigenetic dysregulation of enhancers in neurons is associated with Alzheimer's disease pathology and cognitive symptoms. Nat Commun. 2019;10(1):2246–2259. [DOI] [PMC free article] [PubMed] [Google Scholar]
- 52. Amlie‐Wolf A, Tang M, Way J, et al. Inferring the molecular mechanisms of noncoding Alzheimer's disease‐associated genetic variants. J Alzheimers Dis. 2019;72(1):301‐318. [DOI] [PMC free article] [PubMed] [Google Scholar]
- 53. Nativio R, Lan Y, Donahue G, et al. An integrated multi‐omics approach identifies epigenetic alterations associated with Alzheimer's disease. Nat Genet. 2020;52(10):1024‐1035. [DOI] [PMC free article] [PubMed] [Google Scholar]
- 54. Ramos‐Garcia NA, Orozco‐Ibarra M, Estudillo E, et al. Aryl hydrocarbon receptor in post‐mortem hippocampus and in serum from young, elder, and Alzheimer's patients. Int J Mol Sci. 2020;21(6):1983.1–12. [DOI] [PMC free article] [PubMed] [Google Scholar]
- 55. Ramsey CP, Glass CA, Montgomery MB, et al. Expression of Nrf2 in neurodegenerative diseases. J Neuropathol Exp Neurol. 2007;66(1):75‐85. [DOI] [PMC free article] [PubMed] [Google Scholar]
- 56. Brandes MS, Gray NE. NRF2 as a therapeutic target in neurodegenerative diseases. ASN Neuro. 2020;12:1759091419899782. [DOI] [PMC free article] [PubMed] [Google Scholar]
- 57. Qu Z, Sun J, Zhang W, Yu J, Zhuang C. Transcription factor NRF2 as a promising therapeutic target for Alzheimer's disease. Free Radic Biol Med. 2020;159:87‐102. [DOI] [PubMed] [Google Scholar]
- 58. Zweig JA, Caruso M, Brandes MS, Gray NE. Loss of NRF2 leads to impaired mitochondrial function, decreased synaptic density and exacerbated age‐related cognitive deficits. Exp Gerontol. 2020;131:110767.1–10. [DOI] [PMC free article] [PubMed] [Google Scholar]
- 59. Jin J, Zhao X, Fu H, Gao Y. The effects of YAP and its related mechanisms in central nervous system diseases. Front Neurosci. 2020;14:595–608. [DOI] [PMC free article] [PubMed] [Google Scholar]
- 60. Rosenthal SL, Barmada MM, Wang X, Demirci FY, Kamboh MI. Connecting the dots: potential of data integration to identify regulatory SNPs in late‐onset Alzheimer's disease GWAS findings. PLoS One. 2014;9(4):e95152.1–10. [DOI] [PMC free article] [PubMed] [Google Scholar]
- 61. Wehrspaun CC, Haerty W, Ponting CP. Microglia recapitulate a hematopoietic master regulator network in the aging human frontal cortex. Neurobiol Aging. 2015;36(8):2443.e9–2443.e20. [DOI] [PMC free article] [PubMed] [Google Scholar]
- 62. Pimenova AA, Herbinet M, Gupta I, et al. Alzheimer's‐associated PU.1 expression levels regulate microglial inflammatory response. Neurobiol Dis. 2021;148:105217.1–14. [DOI] [PMC free article] [PubMed] [Google Scholar]
- 63. Huang KL, Marcora E, Pimenova AA, et al. A common haplotype lowers PU.1 expression in myeloid cells and delays onset of Alzheimer's disease. Nat Neurosci. 2017;20(8):1052‐1061. [DOI] [PMC free article] [PubMed] [Google Scholar]
- 64. Balogh P, Adelman ER, Pluvinage JV, et al. RUNX3 levels in human hematopoietic progenitors are regulated by aging and dictate erythroid‐myeloid balance. Haematologica. 2020;105(4):905‐913. [DOI] [PMC free article] [PubMed] [Google Scholar]
- 65. Nishizaki SS, Ng N, Dong S, et al. Predicting the effects of SNPs on transcription factor binding affinity. Bioinformatics. 2020;36(2):364‐372. [DOI] [PMC free article] [PubMed] [Google Scholar]
- 66. Kikuchi M, Hara N, Hasegawa M, et al. Enhancer variants associated with Alzheimer's disease affect gene expression via chromatin looping. BMC Med Genomics. 2019;12(1):128–143. [DOI] [PMC free article] [PubMed] [Google Scholar]
Associated Data
This section collects any data citations, data availability statements, or supplementary materials included in this article.
Supplementary Materials
Supporting Information
Supporting Information
Supporting Information
Supporting Information
Supporting Information
Supporting Information


