Abstract
The outbreak of Covid-19 changed the world as well as human behavior. In this article, we study the impact of Covid-19 on smartphone usage. We gather smartphone usage records from a global data collection platform called Carat, including the usage of mobile users in North America from November 2019 to April 2020. We then conduct the first study on the differences in smartphone usage across the outbreak of Covid-19. We discover that Covid-19 leads to a decrease in users’ smartphone engagement and network switches, but an increase in WiFi usage. Also, its outbreak causes new typical diurnal patterns of both memory usage and WiFi usage. Additionally, we investigate the correlations between smartphone usage and daily confirmed cases of Covid-19. The results reveal that memory usage, WiFi usage, and network switches of smartphones have significant correlations, whose absolute values of Pearson coefficients are greater than 0.8. Moreover, smartphone usage behavior has the strongest correlation with the Covid-19 cases occurring after it, which exhibits the potential of inferring outbreak status. By conducting extensive experiments, we demonstrate that for the inference of outbreak stages, both Macro-F1 and Micro-F1 can achieve over 0.8. Our findings explore the values of smartphone usage data for fighting against the epidemic.
Keywords: Correlations, Covid-19, outbreak stage inference, smartphone usage
I. Introduction
At the beginning of 2020, Covid-19 was identified and has spread globally [1]. The outbreak of Covid-19 has changed people’s lives significantly. Countless efforts have been made to study the world after Covid-19 from different perspectives, ranging from world economy [2], personal mental health [3], to human mobility [4]. Meanwhile, since the first iPhone was released in 2007, smartphones have become a necessity in daily lives [5]. The number of smartphone users worldwide today has surpassed three billion [6]. However, up to now, the understanding of the impact of Covid-19 on smartphone usage is still inadequate. Specifically, studying how Covid-19 affects users’ smartphone usage behavior can bring twofold benefits. First, understanding smartphone usage differences across the Covid-19 outbreak is critical for the industry, e.g., smartphone manufacturers and network service providers, to dynamically adjust market strategies and enhance user experience. Second, smartphones are embedded with a set of sensors recording user activities in both cyber and physical spaces [7]. By exploring the impact, we can use such rich behavioral data to infer different Covid-19 outbreak stages and further contribute to the fight against Covid-19.
Meanwhile, some previous studies have introduced mobile sensing data to the public health field. For example, Yarkoni [8] proposed the concept of psychoinformatics, using tools and techniques from information sciences to improve psychological research. Insel [9] and Baumeister and Montag [10] introduced digital phenotyping that leverages digital behavior data logged on smartphone sensors to detect psychological states. Further, Markowetz et al. [11] proposed to explore big data technologies and conduct digital phenotyping on a large scale. The above studies showed the correlation between smartphone usage and the psychological states of users. The Covid-19 pandemic represents a global health crisis, which will severely change the psychological burdens and physical activities of individuals [12]. Such changes may be conveyed to and reflected in smartphone usage [13]. In this way, we are motivated to investigate how the outbreak of Covid-19 affects smartphone usage behavior.
In this work, we make an effort toward understanding the impact of Covid-19 on smartphone usage and explore the potential of smartphone usage data to fight against Covid-19. More specifically, we study the following research problems.
-
1)
Does the outbreak of Covid-19 affect users’ smartphone usage, and how?
-
2)
Can we use smartphone usage data, e.g., CPU usage, memory usage, and network connections, to infer the outbreak stages of Covid-19?
To answer the above two questions, we reveal the correlations between smartphone usage and the outbreak of Covid-19 from both statistical and dynamic patterns. We first collect a large-scale smartphone usage dataset by leveraging a global crowdsourcing platform called Carat. The dataset covers users in North America and their smartphone usage records for six months from November 2019 to April 2020 (Section II). Next, we use the dataset to make a statistical analysis. The results demonstrate that the outbreak of Covid-19 has indeed impacted significantly on users’ smartphone usage behavior in terms of CPU usage, memory usage, WiFi usage, and network switches. In our case, CPU and memory usage describe how much of the processor’s and memory’s capacity is in use, respectively. WiFi usage indicates the percentage of records under WiFi connection. Network switch refers to the change of network connection from WiFi to cellular network and vice versa. Specifically, the CPU usage and memory usage reflect the intensity of smartphone engagement of users. The WiFi usage and network switches reveal users’ mobility intensity. Further, we extend our analysis to dynamic patterns, i.e., diurnal patterns of smartphone usage. The results unveil how the outbreak of Covid-19 affects usage behavior during the time of one day. We also examine the correlations between smartphone usage and daily confirmed cases (Section III). Moreover, we investigate smartphone usage data’s inference ability for Covid-19 outbreak stages using both statistical and deep learning methods. By comparing the performance and conducting importance analysis, we select the most potent smartphone usage features for the outbreak stage inference (Section IV).
Among the many insightful results and observations, the following are the most prominent.
-
1)
The outbreak of Covid-19 causes a decrease in users’ smartphone engagement in terms of both CPU usage and memory usage. However, it has different impacts on CPU and memory usage according to their diurnal patterns. Specifically, it leads to a new typical diurnal pattern of memory usage while it only changes the proportion of existing patterns of CPU usage.
-
2)
The outbreak of Covid-19 makes an increase in WiFi usage and a decrease in network switches, implying that users reduce their mobility intensity. Also, similar to memory usage, a new typical diurnal pattern of WiFi usage has emerged after the outbreak.
-
3)
Memory usage, WiFi usage, and network switches have significant correlations with the number of daily confirmed cases of Covid-19. Also, the correlation between smartphone usage behavior and Covid-19 daily cases has a time delay. Smartphone usage changes earlier than the number of cases. That is because the smartphone data can reflect the outbreak status in real time. However, such reflection cannot be immediately expressed in daily cases due to the diagnosis delay.
-
4)
By using smartphone usage data to infer Covid-19 outbreak stages, we can achieve over 0.8 for both Macro-F1 and Micro-F1, which presents a promising application of smartphone usage data on fighting against Covid-19.
II. Dataset Overview
A. Data Collection
We leverage a crowdsourcing platform called Carat to collect smartphone usage data. Carat is a cross operating system mobile app, including both iOS1 and Android,2 which can record users’ smartphone usage traces automatically. Carat can monitor and record the working status of smartphones in detail. In practice, Carat informs of all data collection items in the end-user license agreement (EULA) when users install Carat to alleviate user privacy concerns. Also, Carat users are anonymized, and the app does not collect any personal information. It is worth noting that Carat is live. Up to now, Carat has been downloaded over 100 thousand times. The number of downloads and installations is increasing every day.
Specifically, Carat applies an event-triggered collection scheme, gathering a data sample every time the battery level changes by 1%. Each data sample contains a list of smartphone hardware status, including CPU, memory, battery, and network. Each sample also has several other features, including a user-specific identifier, timestamp, timezone, and mobile country code (MCC). The MCC is obtained from the cellular network and automatically converted to a two-character country code. Table I presents samples of collected smartphone usage data to show the data format.
TABLE I. Samples of the Collected Smartphone Usage Data, Where LTE and UTMS are Specific Modes of Cellular Network. User IDs Have Been Anonymized.
| User ID | Timestamp | CPU usage (%) | Active memory (KB) | Free memory (KB) | Network | Battery level (%) | Timezone | MCC |
|---|---|---|---|---|---|---|---|---|
| 1 | 2019-11-05 05:48:48 | 0.6992 | 3528 | 1875820 | WiFi | 66 | America/Denver | us |
| 2 | 2019-11-13 07:51:11 | 51.5152 | 429632 | 1746900 | LTE | 79 | America/New_York | us |
| 3 | 2019-11-16 12:31:51 | 53.1807 | 1006248 | 2853892 | UTMS | 94 | Europe/Helsinki | fi |
B. Basic Analysis
Since we focus on studying the impact of Covid-19, we select the records from November 2019 to April 2020. Also, we principally consider samples collected from North America. In total, we have 452 users with over 7 517 494 records. Since users involved may uninstall and reinstall Carat during the data collection period, the number of active users changes over time, i.e., November 2019 (293 users), December 2019 (295 users), January 2020 (251 users), February 2020 (224 users), March 2020 (198 users), and April 2020 (158 users). In our case, we use both timezones and MCC to determine the users’ country, which increases the reliability of detection. Table II summarizes the dataset.
TABLE II. Summary of the Collected Dataset From North America.
| # Users | # Records | Attributes | Date | Area |
|---|---|---|---|---|
| 452 | 7,517,494 | User ID, timestamp, CPU usage, Memory usage, network status, battery level, timezone, MCC | 11/2019 – 04/2020 | North America |
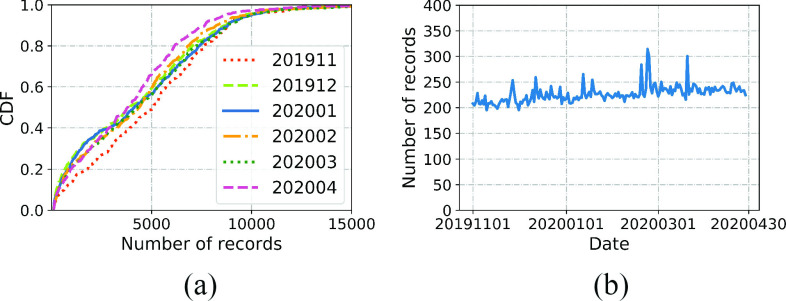
Next, we depict basic statistics to illustrate the quality and representativeness of the collected smartphone usage dataset. Fig. 1(a) presents the cumulative distribution function (CDF) of the number of records per month for each unique user. We observe that the involved users kept a high activeness level during the data collection period. For each month, more than 20% of users have over 1800 records. Moreover, we plot how the average number of users’ records changes every day in Fig. 1(b). We can witness that there are around 220 records every day per user on average. Although there are some fluctuations, the curve is relatively stable. Such a high number of records per user demonstrates our dataset’s effectiveness in capturing the smartphone usage behavior of users involved covering the entire six months, i.e., from November 2019 to April 2020. Also, the continuity of the data collection guarantees the representativeness of our study.
Fig. 1.
(a) CDF of the number of records per month for each unique user. (b) Daily average number of collected records of users.
C. Ethical Considerations
We are very aware of the privacy issues when using the collected data for research. We have taken adequate actions to safeguard the privacy of the involved mobile users. First, we do not collect any personal information from users. A user-specific identifier is randomly generated when the user first installs Carat. We only have users’ country information rather than sensitive location information, like GPS data. Also, the data-gathering part of Carat is open source.3 Users can examine it easily. The users involved are informed of the data collection and management procedures in the EULA and grant their consent from their devices. In the EULA, we also point out that the data we collect may be used to improve products or for research purposes. Second, the dataset is stored in a secure local server protected by strict authentication mechanisms and firewalls. All researchers are regulated by a strict nondisclosure agreement to access the data. Finally, this work has received approval from all the authors’ local institutions.
III. Differences in Smartphone Usage
In this section, we aim to solve the first research problem, i.e., whether and how the outbreak of Covid-19 affects users’ smartphone usage behavior. Specifically, we explore the impact on CPU usage, memory usage, and network status from statistical and dynamic pattern analysis. The data processing and analysis was conducted in Helsinki.
A. Differences in Number and Distributions
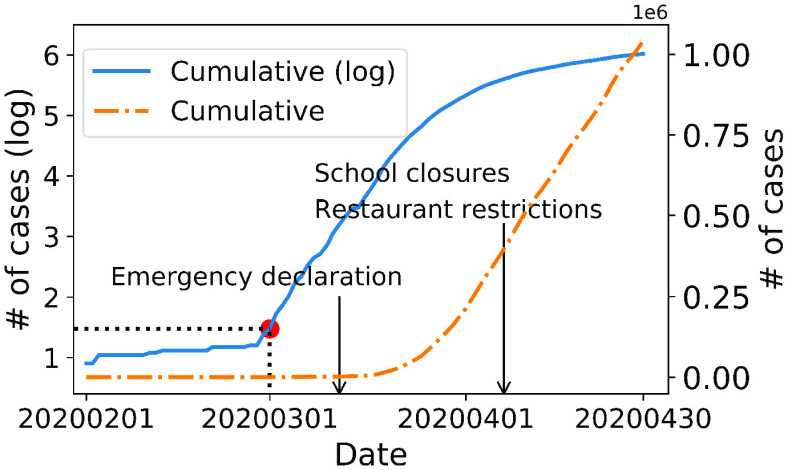
To determine whether the outbreak of Covid-19 changes users’ mobile engagement, first, we need to determine the outbreak date in North America. Fig. 2 shows the cumulative number of confirmed cases in North America from February 2020 to April 2020 and the governmental policies on the same timescale. The dashed curve is in the linear scale, while the solid curve depicts the cumulative number in the logarithmic scale. Notably, the propagation of Covid-19 is in exponential growth. Therefore, using the logarithmic scale curve makes it more accessible to detect the phase change of increase trend and determine the outbreak date accordingly [14]. In terms of Fig. 2, we can observe an apparent step-up around March 1, 2020, as denoted by the red point. Hence, we regard March 1, 2020, as the outbreak date of Covid-19 in North America.
Fig. 2.
Cumulative number of confirmed cases changes over time. The federal government issued an emergency declaration on March 13, 2020. Most states issued school closure rules and restaurant restrictions by April 7, 2020.
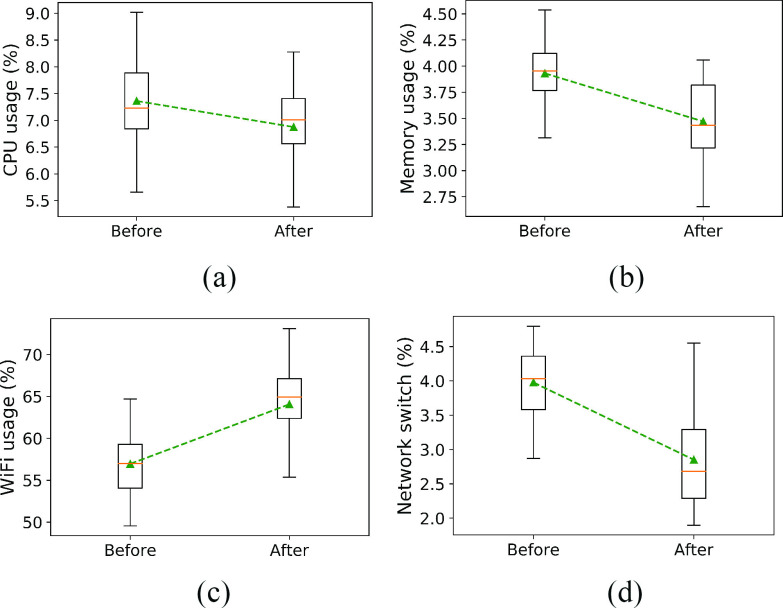
We then begin the analysis by comparing the distributions of smartphone usage variables before and after the outbreak of Covid-19. In Fig. 3, we use box plots to depict the distributions of the percentages of CPU usage, memory usage, WiFi usage, and network switches, respectively. Specifically, the “Before” set contains the samples from November 1, 2019, to February 29, 2020, while the “After” set contains the samples from March 1, 2020, to April 30, 2020. The box plots describe data distribution through quartiles. The candlesticks represent the minimum and the maximum values, while the boxed area contains the values between 25% and 75% quartiles. The horizontal line denotes the median, while the green upper triangle indicates the mean.
Fig. 3.
Differences in smartphone usage before and after the outbreak of Covid-19. (a) Distributions of the percentage of CPU usage,
 . (b) Distributions of the percentage of memory usage,
 . (c) Distributions of the percentage of WiFi usage,
 . (d) Distributions of the percentage of network switches,
 .
.
There is an apparent difference in smartphone usage across the outbreak in terms of all hardware variables. The mean values of CPU and memory usage drop from 7.36% and 3.93% to 6.87% and 3.47%, respectively. Their differences across the outbreak are significant under a two-sided
 -test [15] with
 values of
 and
and
 . The decreases imply that users’ smartphone engagement becomes less active after the outbreak, i.e., March 1, 2020. Meanwhile, the WiFi usage percentage grows dramatically, where the mean value rises from 56.95% to 64.06%. The distribution difference is also significant under a two-sided
 -test with a
 value of
 . Since WiFi access points are usually deployed indoors, we can conclude that people have more time to stay indoors instead of going outside after the outbreak of Covid-19. Moreover, we also notice that the percentage of network switches drops remarkably. The mean value declines from 3.98% to 2.85%, and the distribution difference is significant, with
 value
value
 . Similar to WiFi usage, network switches also reflect the movement of mobile users. Since the WiFi network is commonly deployed indoors and limited by its coverage, network switches usually occur when mobile users go from indoors to outside and from outside to indoors. Consequently, the percentage of network switches can reveal the mobility intensity of smartphone users. In this way, the decreasing trend of network switches suggests users have less mobility after the outbreak.
As a result, based on the differences in number and distributions, we can conclude that the outbreak of Covid-19 causes a decrease in smartphone engagement in terms of both CPU and memory usage. Meanwhile, the outbreak causes an increase in users’ intensity staying indoors in terms of WiFi usage. Further, we depict the correlation between WiFi usage and memory usage to investigate smartphone usage intensity when people stay indoors. Table III shows the correlations across different time periods, i.e., over the complete time windows, before the outbreak, and after the outbreak. As depicted in Table III, WiFi usage and memory usage have a weak positive correlation before the outbreak, which follows the commonly held intuition. However, after the outbreak, the correlation becomes weak negative. We infer that the longer time to stay at home after the outbreak may cause such differences. When people have more time at home, they will prefer to use their computers and laptops for entertainment instead of smartphones.
TABLE III. Correlations Between Memory Usage and WiFi Usage Across Different Time Periods.
| Over complete time window | Before outbreak | After outbreak |
|---|---|---|
| −0.0689 | 0.3205 | −0.3240 |
B. Differences in Diurnal Patterns
In terms of the above statistical analysis, we can conclude that the outbreak of Covid-19 has affected users’ smartphone usage behavior. Next, we delve into the dynamic analysis, i.e., revealing the differences in diurnal patterns. The diurnal pattern depicts how users’ smartphone usage behavior unfolds over the time of the day, which is an essential temporal pattern studied by many previous studies [16], [17].
We define each day’s diurnal pattern by averaging the usage data over the day’s active users. In our case, we evenly divide one day into 48 time slots, where each time slot represents half an hour. Therefore, each diurnal sequence is of 48 dimensions. Next, we compute smartphone usage data for each time slot. In practice, as for CPU usage and memory usage behavior, we take the averages in that time slot. For WiFi usage, we calculate the proportion of WiFi connection records in that time slot. Besides, for network switches, we calculate the proportion of network type changes in the time slot. By doing so, given one day, each type of smartphone usage behavior will have a diurnal sequence with 48 dimensions. In total, we have 728 diurnal sequences, i.e., 182 (# of days)
 (# of usage types).
After obtaining the diurnal sequences, we use the t-SNE transformation [18] to visualize them, as shown in Fig. 4. t-SNE is a commonly used data transformation method that projects high-dimensional data to a low-dimensional space while keeping the similarity across objects. In Fig. 4, blue points represent the dates before the outbreak, while orange points represent the dates after the outbreak. We can observe that excluding CPU usage, the other types of smartphone usage behavior appear to be nicely separated by the outbreak. This shows the existence of differences in diurnal patterns of smartphone usage before and after the outbreak of Covid-19.
Fig. 4.

t-SNE representation of diurnal sequences of smartphone usage, projecting high-dimensional data to a 2-D space while keeping the similarity across objects. t-SNE representation of (a) CPU usage patterns, (b) memory usage patterns, (c) WiFi usage patterns, and (d) network switch patterns.
Based on the t-SNE visualization results, we propose a hypothesis that the outbreak of Covid-19 will lead to a new diurnal pattern for smartphone usage. In our case, the new pattern means that it does not or rarely appears before the outbreak but is popular on the dates after the outbreak. To test the hypothesis, we apply
 -means to cluster diurnal sequences of the entire 182 days for each type of smartphone usage behavior and examine whether the cluster results can be distinguished by the outbreak date of Covid-19. Since there are only two situations for any date, i.e., before or after the outbreak, we set the number of clusters to two. The clustering results are presented in Figs. 5–8, where clusters A and B refer to the two-cluster output of
 -means. Also, we regard the centroid as the typical diurnal pattern of the cluster.
Fig. 5.
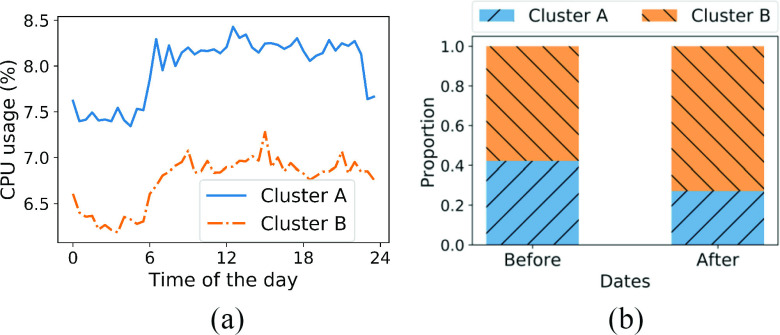
Cluster results of CPU usage diurnal patterns. (a) Centroids of clusters. (b) Proportion of cluster labels.
Fig. 6.
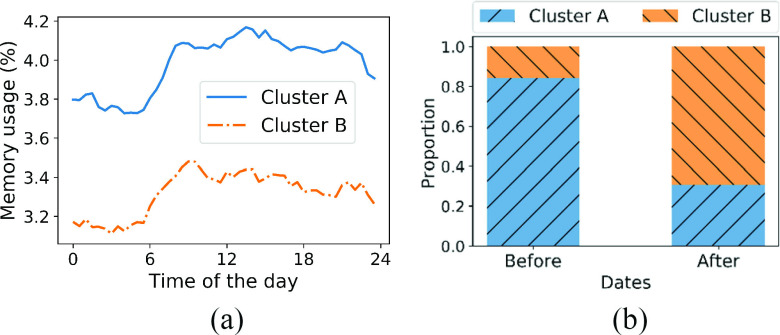
Cluster results of memory usage diurnal patterns. (a) Centroids of clusters. (b) Proportion of cluster labels.
Fig. 7.
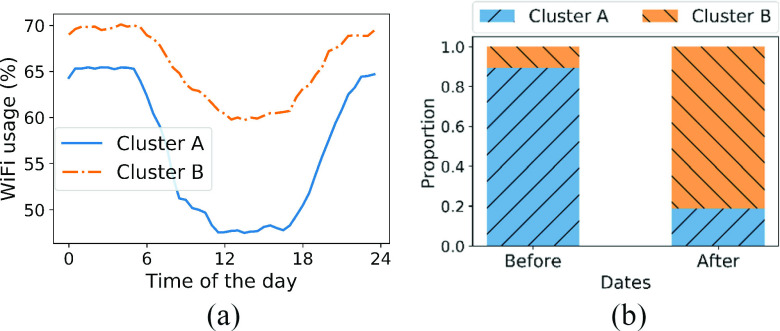
Cluster results of WiFi usage diurnal patterns. (a) Centroids of clusters. (b) Proportion of cluster labels.
Fig. 8.
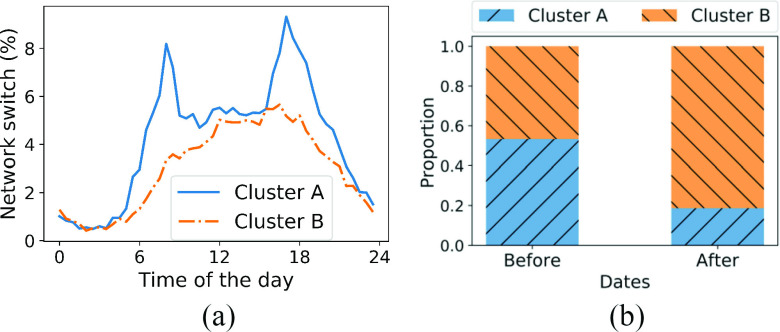
Cluster results of network switch diurnal patterns. (a) Centroids of clusters. (b) Proportion of cluster labels.
Diurnal Patterns of CPU Usage: As shown in Fig. 5(a), the obtained two typical diurnal patterns of CPU usage have the same trend but different values. Both of them decrease during the night and increase during the day, while cluster B’s centroid is of lower numerical values. Fig. 5(b) shows that, compared to cluster A, cluster B accounts for a higher proportion of the dates after the outbreak, consistent with the dropping trend observed in Fig. 3(a). We also observe that Covid-19 only affects the proportion of two cluster labels, and both typical patterns frequently appear on the dates before the outbreak. In other words, the outbreak did not create a new typical diurnal pattern of CPU usage. The t-SNE visualization in Fig. 4(a) also verifies this.
Diurnal Patterns of Memory Usage: As depicted in Fig. 6(a), similar to CPU usage, two typical diurnal patterns obtained are also with the same trend but different numerical values. In terms of Fig. 6(b), over 80% of the dates before the outbreak belong to cluster A. Meanwhile, more than 65% of the dates after the outbreak belong to cluster B. Therefore, we can conclude that the cluster results can be distinguished by the outbreak date. Also, cluster B’s centroid can be regarded as a new typical diurnal pattern because it rarely appears before the outbreak and becomes common after the outbreak. In summary, Covid-19 leads to the appearance of a new typical diurnal pattern of memory usage, corresponding to the t-SNE visualization in Fig. 4(b).
Diurnal Patterns of WiFi Usage: Fig. 7 displays the cluster results of WiFi usage. Unlike CPU and memory usage, apart from numerical differences, the centroids of WiFi usage clusters also have different changing trends. As depicted in Fig. 7(a), the centroid of cluster B has a higher percentage of WiFi usage throughout the day. Instead of a cliff-like drop shown in cluster A, cluster B has a slow down after 6 A.M. This indicates that users need less mobile network support on the dates in cluster B. Moreover, similar to memory usage, the dates after the outbreak have a dominating cluster, i.e., cluster B. Therefore, Covid-19 also brings a new diurnal pattern of WiFi usage, leading users to use more WiFi connections.
Diurnal Patterns of Network Switches: We exhibit the clustering results of network switch patterns in Fig. 8. As discussed in Section III-A, network switches can reflect the mobility intensity of smartphone users. In Fig. 8(a), the centroid of cluster A presents two peaks in the morning and evening rush hours, which verifies the above discussion. We notice that less than 18% of the dates after the outbreak belong to cluster A, indicating that users’ mobility intensity drops significantly. Alternatively, cluster B has fewer network switches throughout the day and without bimodal patterns, indicating that users have less mobility on the dates in that cluster. Although cluster B dominates the dates after the outbreak, it also frequently appears before the outbreak. As a result, similar to CPU usage, Covid-19 only changes the proportion of different network switch patterns but does not trigger the appearance of new patterns.
Consequently, the outbreak of Covid-19 also profoundly affects diurnal patterns of smartphone usage behavior, implying that the diurnal sequences of smartphone usage can be used to reflect the outbreak status.
C. Correlations Between Smartphone Usage and Covid-19 Daily Cases
We then analyze the correlations between smartphone usage and Covid-19 daily cases. Specifically, we take the average over the active users of each day and plot both the daily sequences of smartphone usage and the number of daily confirmed cases of Covid-19 in Fig. 9, from February 1, 2020 to April 30, 2020. For the figures of CPU usage, memory usage, and network switches, we inverse the
 -axis for better visualization. From the results, we can observe that memory usage, WiFi usage, and network switches have strong correlations with both cumulative and new confirmed daily cases. That is because smartphone usage behavior reflects users’ physical activities, e.g., staying at home and mobility intensity. Meanwhile, users’ physical activities will influence and be affected by Covid-19. Therefore, smartphone usage behavior can indirectly reveal Covid-19 trends. Moreover, in Fig. 9(f) and (h), we discover a delay in the changing trends between smartphone usage behavior and new confirmed cases. In other words, smartphone usage changes earlier than the number of cases.
Fig. 9.
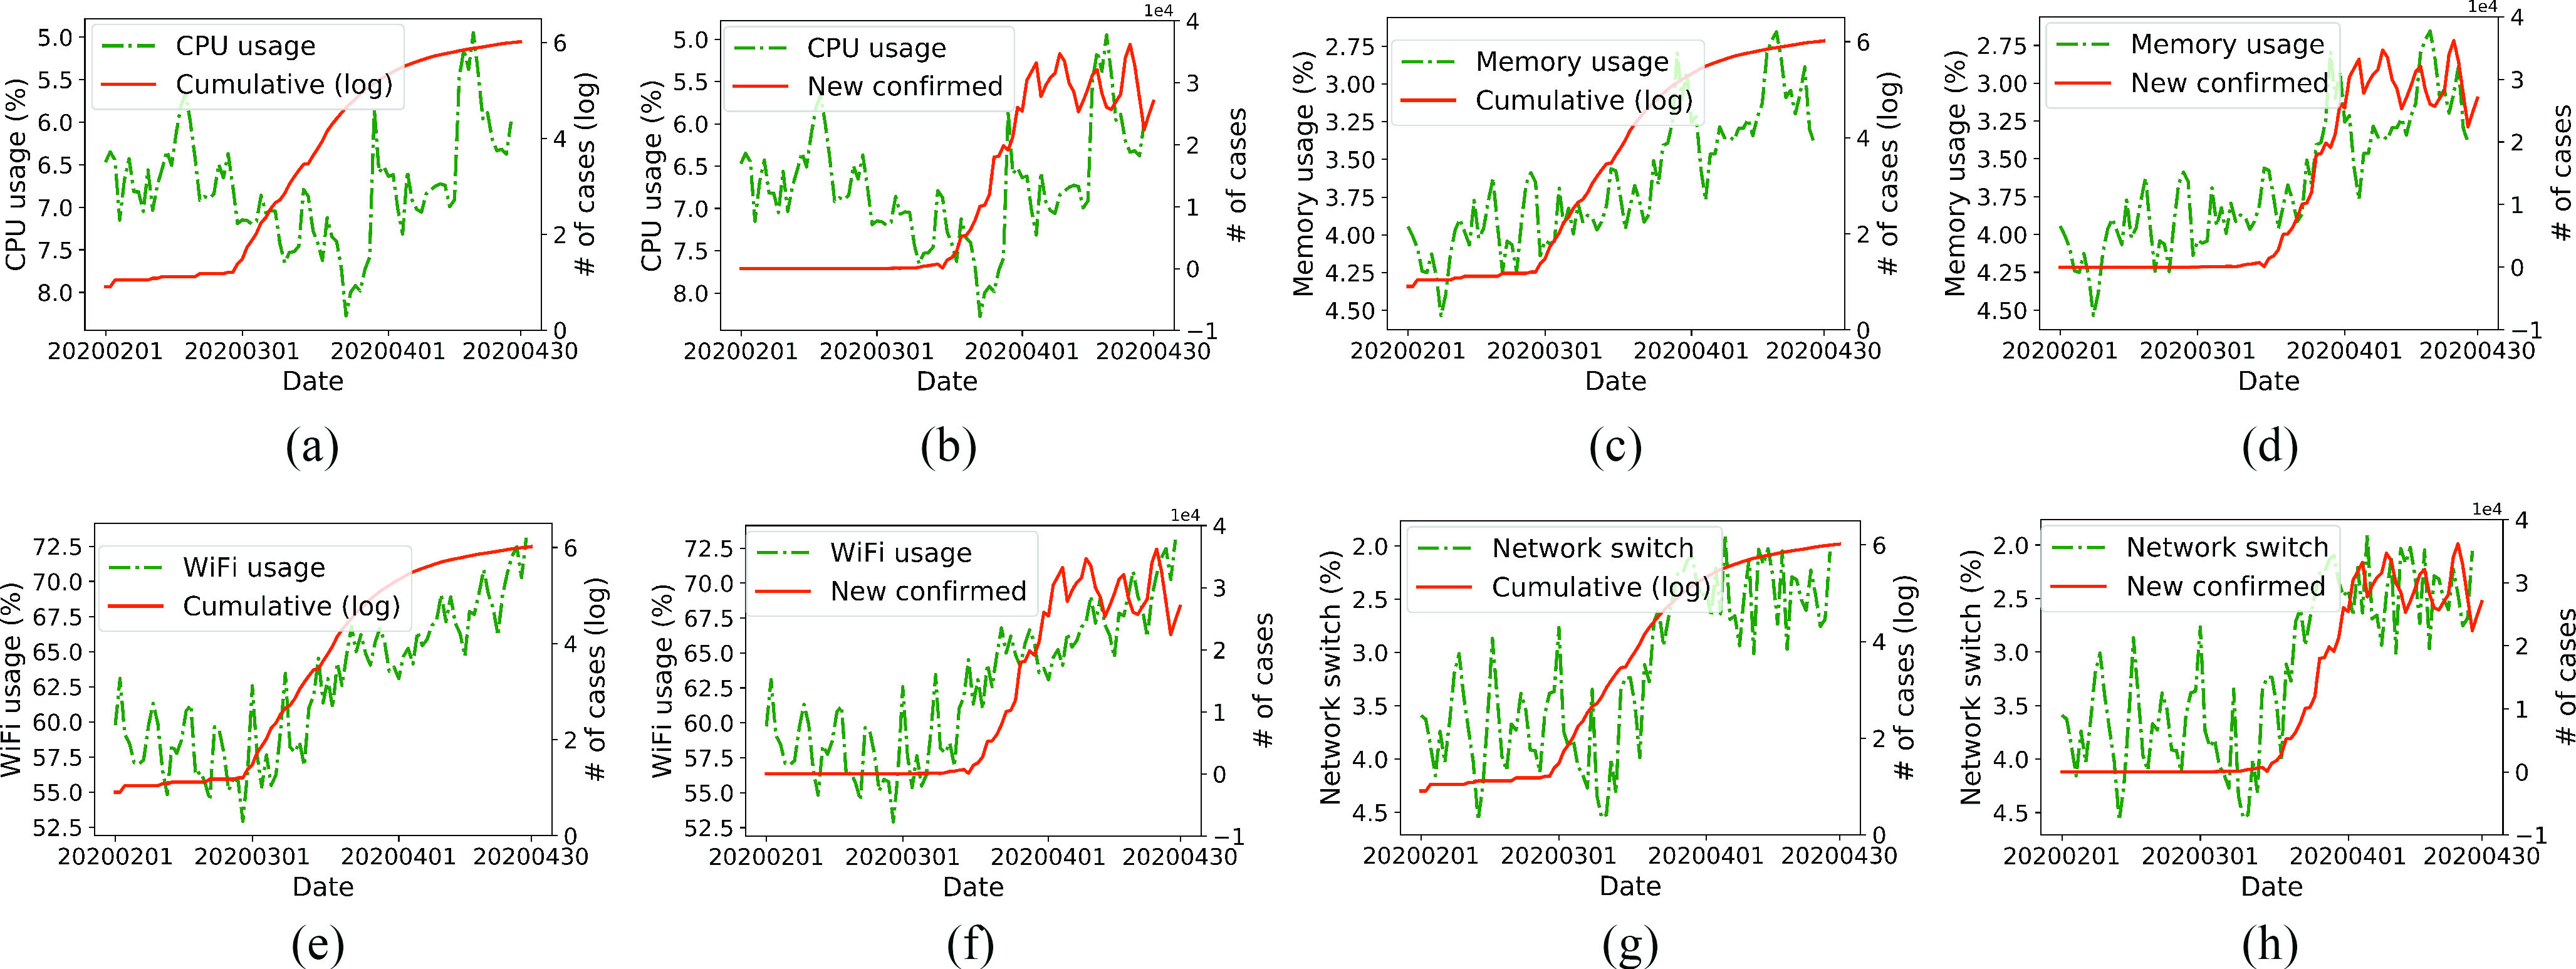
Daily patterns of smartphone usage and the number of daily confirmed cases of Covid-19. (a) CPU usage and cumulative confirmed cases. (b) CPU usage and new confirmed daily cases. (c) Memory usage and cumulative confirmed cases. (d) Memory usage and new confirmed daily cases. (e) WiFi usage and cumulative confirmed cases. (f) WiFi usage and new confirmed daily cases. (g) Network switches and cumulative confirmed cases. (h) Network switches and new confirmed daily cases.
Further, to better explore the delay phenomenon, we put a set of delays on the daily sequences of smartphone usage behavior from 0 to 3 days. Then, we compute the Pearson correlation between shifted smartphone usage and Covid-19 sequences. The results are illustrated in Table IV. From the results, we discover that different smartphone usage features have various correlations with daily confirmed cases. Generally, memory usage, WiFi usage, and network switches have significant linear correlations with Covid-19 daily confirmed cases. The absolute values of their Pearson coefficients are greater than 0.8. However, CPU usage has a weak Pearson correlation, only around −0.26, with new confirmed cases of Covid-19. These observations are consistent with the findings in Section III-B. Moreover, when we delay usage behavior, it will have a higher correlation with Covid-19 cases, which corresponds to the observation that smartphone usage changes earlier than Covid-19 cases. Also, different smartphone usage variables show different typical time delays. In summary, the correlations between smartphone usage behavior and daily confirmed cases present a high potential of using smartphone usage for daily outbreak stage inference of Covid-19.
TABLE IV. Pearson Correlations Between Smartphone Usage and Covid-19 Cases.
| Delay (day) | CPU usage | Memory usage | WiFi usage | Network switch | ||||
|---|---|---|---|---|---|---|---|---|
| Cumulative (log) | New confirmed | Cumulative (log) | New confirmed | Cumulative (log) | New confirmed | Cumulative (log) | New confirmed | |
| 0 | −0.0632 | −0.2670 | −0.8163 | −0.8119 | 0.8364 | 0.8053 | −0.7649 | −0.7809 |
| 1 | −0.0383 | −0.2339 | −0.8119 | −0.8091 | 0.8754 | 0.8253 | −0.7838 | −0.8234 |
| 2 | −0.0541 | −0.2444 | −0.8315 | −0.8369 | 0.8667 | 0.8263 | −0.7830 | −0.8369 |
| 3 | −0.0240 | −0.2081 | −0.8277 | −0.8399 | 0.8523 | 0.8312 | −0.7772 | −0.8430 |
IV. Inference of Outbreak Stages
In this section, we study the second research problem, i.e., whether we can use smartphone usage data, e.g., CPU usage, memory usage, and network connections, to infer the outbreak stages of Covid-19. The outbreak stages reflect different severities of the pandemic. Specifically, we try to determine two points, i.e., the typical time delay of stage inference using smartphone usage data and the performance of different smartphone usage features in Covid-19 stage inference. Also, to further improve inference performance, we propose an embedding mechanism to fuse different smartphone usage behavior features.
A. Inference Settings
Recalling Fig. 2, we can witness that the outbreak of Covid-19 has shown three stages from March 1, 2020 to April 30, 2020. First, the dates from February 1, 2020 to March 1, 2020, are the early stage of Covid-19, with only a few cases appearing. Second, during the dates from March 1, 2020 to April 1, 2020, the daily confirmed cases increased dramatically. Third, on the dates after April 1, 2020, the increasing trend of Covid-19 cases is stable. Therefore, we label Covid-19 outbreak stages with three classes, i.e., early, dramatic, and stable. By doing so, the inference problem is converted into a 3-class classification problem. Specifically, we infer the outbreak stages of one day by using its diurnal sequences of different smartphone usage behavior, including CPU usage, memory usage, WiFi usage, and network switches. Also, to evaluate the performance, we use Macro-F1 and Micro-F1 as metrics. Macro-F1 treats all classes equally, computing the F1-score independently for each class and then taking the average. Alternatively, Micro-F1 aggregates the contributions of all classes to compute the average F1-score. The higher the value of Macro-F1 and Micro-F1, the better the performance. For all experiments, we obtain the results by employing a fivefold cross-validation policy on our dataset.
B. Delay Analysis of Stage Inference
As we have discussed in Section III, users’ smartphone usage behavior can reflect their physical activities and the outbreak stages of Covid-19. However, the reflection may not be immediately expressed by the daily cases of Covid-19 due to the incubation period and diagnosis delay. Hence, we explore the typical time delay of stage inference. Specifically, we infer the outbreak stage of one day by utilizing the smartphone usage features of the days before it. We use inference performance to evaluate the correlations between smartphone usage and Covid-19 trends. In other words, better performance indicates a higher correlation. Notably, different from the Pearson correlation, the task of inference can also reveal nonlinear correlations. In practice, we conduct the inference with the three most commonly used classification algorithms, logistic regression (LR) [19], support vector machine (SVM) [20], and Xgboost [21]. We infer the outbreak stages of one day by concatenating all behavior types’ diurnal sequences, including CPU usage, memory usage, WiFi usage, and network switches.
We show the results in Fig. 10. The LR classifier has poor performance, and F1 scores fluctuate on different delays. That is because the LR classifier only uses a logistic function to model the correlation, which is more susceptible to outliers tampering with the performance. Therefore, it is hard to capture the relations between smartphone usage features and Covid-19 outbreak stages with the LR classifier using the real-word dataset that might have noisy data points. Alternatively, as shown in Fig. 10(b) and (c), SVM and Xgboost classifiers have better performance. Also, we can observe that F1 scores achieve the highest value under a delay of 2 or 3 days. This observation confirms that the reflection of users’ smartphone usage behavior will emerge in Covid-19 trends with a time delay of a few days, further validating our analysis in Section III-C.
Fig. 10.

Covid-19 outbreak stage inferences with different time delays. Performance with (a) LR classifier, (b) SVM classifier, and (c) Xgboost classifier.
C. Performance of Different Usage Features
Next, we evaluate the performance of different smartphone usage features and their combinations for the Covid-19 outbreak stage inference. Specifically, we explore four types of smartphone usage features, i.e., CPU usage (CPU), memory usage (Mem), WiFi usage (WiFi), and network switches (Net). We combine a set of features by concatenating them together. We perform the inference with the Xgboost classifier. The performance of different combinations of features is shown in Table V.
TABLE V. Inference Performance With Different Features.
| Features | Macro-F1 | Micro-F1 |
|---|---|---|
| CPU | 0.590 | 0.584 |
| Mem | 0.702 | 0.697 |
| WiFi | 0.713 | 0.708 |
| Net | 0.757 | 0.753 |
| CPU+Mem | 0.666 | 0.663 |
| CPU+WiFi | 0.722 | 0.719 |
| CPU+Net | 0.609 | 0.685 |
| Mem+WiFi | 0.683 | 0.674 |
| Mem+Net | 0.735 | 0.730 |
| WiFi+Net | 0.707 | 0.696 |
| CPU+Mem+WiFi | 0.716 | 0.708 |
| CPU+WiFi+Net | 0.715 | 0.707 |
| Net+Mem+WiFi | 0.739 | 0.730 |
| CPU+Mem+Net | 0.766 | 0.764 |
| CPU+Mem+Net+WiFi | 0.733 | 0.721 |
For the inference with a single feature, the performance of using network switches is the best, indicating that users’ mobility intensity is most relevant to the Covid-19 status. Meanwhile, WiFi and memory usage achieve relatively good performance, implying that WiFi and memory usage also reflect crucial human behavior related to Covid-19. In contrast, the CPU usage feature is less related and with the lowest inference performance. These inference results are consistent with our findings in Section III. As for the inference with multiple features, the performance is not simply a superposition of single features’ performance. In terms of Table V, the best performance is achieved by using CPU, memory, and WiFi usage. However, it only achieves the F1 score of around 0.76, slightly higher than when merely using network switches. Also, most cases of using multiple features have lower performance than simply using network switches. These results reveal that simple concatenation is insufficient to fuse different behavior data, motivating us to develop a better fusion mechanism to explore different features effectively.
D. Smartphone Usage Behavior Embedding
In this section, we propose an embedding model to fuse different smartphone usage behavior effectively. Given a day, we first construct a diurnal smartphone usage feature sequence
 , where
 is a vector containing all four usage features in the
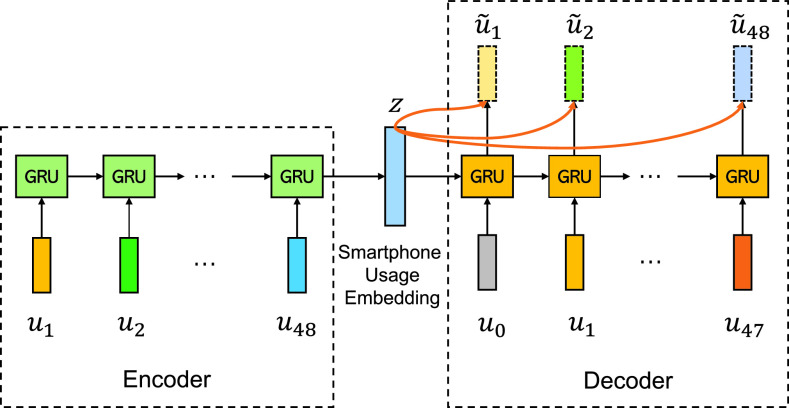
 th time slot of the day. We then utilize a Seq2Seq [22] model to learn an embedding from the diurnal sequence. As shown in Fig. 11, the model consists of an encoder and a decoder, which are implemented with a GRU network [22]. The sequence
 is fed into the encoder to obtain an encoding vector of
 . Then,
 and a shifted usage sequence
 are fed into the decoder to reconstruct the original sequence, where
 is a vector that contains all 1. Moreover, to encode comprehensive information in vector
 , we engage
 in the reconstruction. Formally, the
 th unit of the decoder takes
 as input and outputs hidden state
 , we infer
 as
as
 |
where [,] is the concatenating operation,
 is the sigmoid activating function, and
 and
and
 are trainable parameters. Finally, we train the model by minimizing the reconstruction loss
 |
Fig. 11.
Seq2Seq model for smartphone usage embedding.
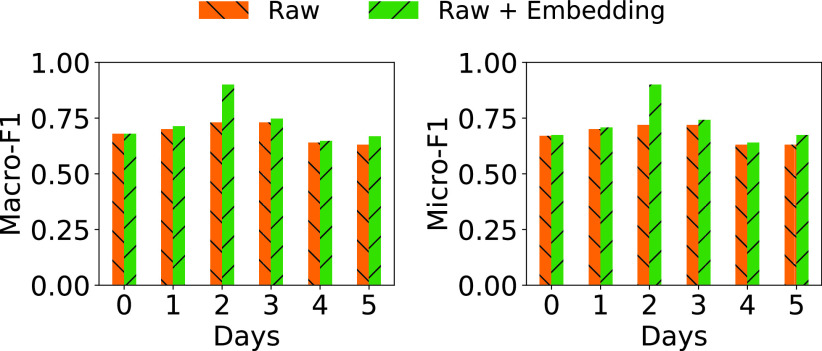
In our experiment, we train the model with the Adam optimizer with a learning rate of 0.0001. The batch size is set as the number of sequences, and we train the model for 200 epochs. By doing so, we obtain a usage embedding vector for each day. To evaluate whether the embedding fuses different usage features better, we conduct the inference on the original features (Raw) and the original features concatenated with the learned embeddings (Raw + Embedding). We again use the Xgboost classifier as the inference model.
We compare the performance with embeddings, as shown in Fig. 12. We can observe that, by combining with embeddings, we improve the entire performance under different delay settings. Especially, when the delay is set as two days, the performance of raw features combined with embeddings reaches around 0.87 for both Macro-F1 and Micro-F1, which has an over 20% improvement compared with the best performance of only using raw features. These results demonstrate that the learned embeddings fuse multiple features more effectively indeed.
Fig. 12.
Outbreak stage inferences with embeddings.
V. Discussion and Limitation
In this article, we have investigated the impact of Covid-19 on smartphone usage based on a real-world dataset. However, the number of users involved in our dataset is not very large, i.e., covering 425 users, which is a limitation of our work. The limited number of users involved may threaten the representativeness of our conclusion. To alleviate the influence caused by a limited number of users, we have taken several adequate measures in our work. For example, we compared the distribution of variables instead of the average and median. We also used the
 -value to verify statistical significance.
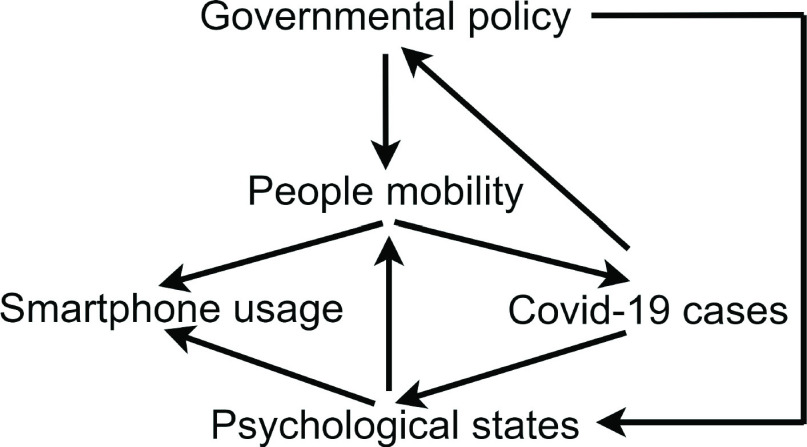
Although we have examined the correlation between smartphone usage behavior and Covid-19 cases, their causality relationship still needs further exploration. In Fig. 13, we depict a potential causality diagram of smartphone usage and Covid-19 cases. People mobility and psychological state serve as a confounder and mediator connecting smartphone usage and Covid-19 cases, respectively. Smartphone usage is directly affected by mobility and can act as a mobility indicator. Also, smartphone usage is still affected by the psychological states of users [13]. Meanwhile, the causation between people mobility and Covid-19 cases is bidirectional. On the one hand, frequent people mobility will trigger new Covid-19 cases. On the other hand, Covid-19 will affect people’s mobility through governmental policies and their psychological states. Therefore, the causation between smartphone usage and Covid-19 cases might be complex. As for checking the potential causality diagram we proposed, we leave it to future work.
Fig. 13.
Potential causality diagram of smartphone usage and Covid-19 cases.
VI. Related Work
Many previous studies have focused on characterizing smartphone usage behavior. Shafiq et al. [23] presented the diurnal pattern of smartphone network usage from various granularities, i.e., bytes, packets, flows, and users. Peltonen et al. [24] collected a one-year smartphone usage dataset from 25 323 users distributed in 44 countries. They then studied how cultural features affect users’ smartphone usage behavior. Srinivasan et al. [25] indicated that smartphone usage behavior profoundly depends on contextual information. For example, users use more WiFi connections at home. Moreover, Van Canneyt et al. [26] exhibited that the occurrence of special events, e.g., New year’s day, UEFA European Championship, will disrupt users’ normal smartphone usage patterns. These existing studies demonstrate that users’ smartphone usage behavior will be sensitively impacted by diverse contextual factors, including time, locations, and big events, which inspired us to investigate how the outbreak of Covid-19 affects the smartphone usage behavior.
Also, some studies pointed out the strong link between smartphone usage behavior and users’ physical attributes and activities. Zhao et al. [27] analyzed one month of smartphone usage data collected from 106 762 users. They then discovered 382 distinct types of users based on their usage behavior. Also, they gave each cluster a meaningful label, such as night communicators, evening learners, and financial users. Do and Gatica-Perez [28] represented users’ smartphone usage traces in one day as a bag of words, where one word refers to a smartphone usage record with time features. They then applied an author-topic model to infer the underlying structure of users’ physical activities. Similarly, Li et al. [29] leveraged smartphone app usage data to identify users’ daily activities. These studies demonstrated that users’ physical activities profoundly shape smartphone usage behavior, which shed light on using smartphone usage data to reflect human activities and further infer Covid-19 outbreak stages.
Smartphone usage behavior is still affected by users’ psychological states. For example, Saeb et al. [30] explored smartphone sensors’ data, like accelerometer, screen, GPS, and WiFi, which help estimate the depression and anxiety of users. Their methods can also be applied to our dataset, allowing us to detect the depression of users. During the Covid-19 crisis, we need to pay more attention to mental health in the population. Covid-19 may trigger psychiatric disorders of people [31]. Elhai et al. analyzed gaming disorder severity [32] and anxiety symptoms [33] during Covid-19. Moreover, Montag et al. [13] pointed out that we can leverage smartphone data to detect population mental states in real time to help fight the Covid-19 pandemic. They also developed an app [34] for social scientists, which tracks smartphone usage data by combining self-report data with objectively recorded data. In practice, conducting population-scale digital phenotyping might be challenging due to the lack of sufficient labeled data. In that case, label-less learning should be a helpful technology. For example, Chen and Hao [35] proposed a label-less learning for emotion cognition on a large scale.
Some studies also analyzed physical activities during Covid-19 by using smartphone app usage and sensory data. Norbury et al. [36] discovered a positive relation between social app usage and total footsteps (obtained from sensory data) during the lockdown due to Covid-19. Couture et al. [37] investigated county-to-county movements based on the GPS data collected from smartphones. Unlike the above studies, our work directly investigates the relation between smartphone usage and the Covid-19 outbreak.
VII. Conclusion
We conduct the first comprehensive study of the impact of Covid-19 on smartphone usage. Specifically, our analysis covers the mobile users in North America with six-month smartphone usage records from November 2019 to April 2020. Overall, our findings indicate that users’ smartphone usage indeed changes across the outbreak of Covid-19. However, the outbreak has different effects on different usage behavior in terms of changing trends, diurnal patterns, and correlations. Also, we demonstrate the potential of using smartphone usage data to infer the outbreak stages, achieving over 0.8 for both Macro-F1 and Micro-F1. Our findings provide a novel application of smartphone usage data and explore their values for fighting against the epidemic.
Biographies

Tong Li (Graduate Student Member, IEEE) received the B.S. and M.S. degrees in communication engineering from Hunan University, Changsha, China, in 2014 and 2017, respectively. He is currently pursuing the dual Ph.D. degree with Hong Kong University of Science and Technology, Hong Kong, and the University of Helsinki, Helsinki, Finland.
His research interests include data mining and machine learning, especially with applications to mobile big data and urban computing.

Mingyang Zhang received the B.S. degree in electronic engineering from Tsinghua University, Beijing, China, in 2018. He is currently pursuing the Ph.D. degree with the System and Media Laboratory, Department of Computer Science and Engineering, Hong Kong University of Science and Technology, Hong Kong.
His research interests include spatiotemporal data mining and urban computing.

Yong Li (Senior Member, IEEE) received the IEEE 2016 ComSoc Asia–Pacific Outstanding Young Researchers, the Young Talent Program of China Association for Science and Technology, and the National Youth Talent Support Program. Among them, ten are ESI Highly Cited Papers in Computer Science, and five receive conference Best Paper (run-up) Awards. He has served as the general chair, a TPC chair, and an SPC/TPC member for several international workshops and conferences, and he is on the editorial board of two IEEE journals.

Eemil Lagerspetz received the Ph.D. degree in computer science from the University of Helsinki, Helsinki, Finland, in 2014.
He is a Postdoctoral Researcher with the Department of Computer Science, University of Helsinki. His research interests include large-scale data analysis (big data), edge computing, ubiquitous computing, and energy efficiency.

Sasu Tarkoma (Senior Member, IEEE) received the M.Sc. and Ph.D. degrees in computer science from the Department of Computer Science, University of Helsinki, Helsinki, Finland, in 2000 and 2006, respectively.
He is a Professor of Computer Science with the University of Helsinki, and the Head of the Department of Computer Science. He has authored four textbooks and has published over 200 scientific articles. He has nine granted U.S. Patents. His research interests are Internet technology, distributed systems, data analytics, and mobile and ubiquitous computing.
Prof. Tarkoma has received several best paper awards and mentions, for example, at IEEE PerCom, IEEE ICDCS, ACM CCR, and ACM OSR. He is a Fellow of IET and EAI.

Pan Hui (Fellow, IEEE) received the bachelor’s and M.Phil. degrees from the University of Hong Kong, Hong Kong, in 2002 and 2004, respectively, and the Ph.D. degree from the Computer Laboratory, University of Cambridge, Cambridge, U.K., in 2007.
He is the Nokia Chair Professor of Data Science and a Professor of Computer Science with the University of Helsinki, Helsinki, Finland. He is also the Director of the HKUST-DT Systems and Media Lab, Hong Kong University of Science and Technology, Hong Kong. He was a Senior Research Scientist and a Distinguished Scientist with Telekom Innovation Laboratories, Berlin, Germany, and an Adjunct Professor of Social Computing and Networking with Aalto University, Espoo, Finland. His industrial profile also includes his research at Intel Research Cambridge, Cambridge, and Thomson Research Paris, Paris, France. He has published more than 300 research papers and with over 17500 citations. He has 30 granted and filed European and U.S. patents in the areas of augmented reality, data science, and mobile computing.
Prof. Hui is an Associate Editor for the leading journals, such as IEEE Tansactions on Mobile Computing and IEEE Transactions on Cloud Computing. He has been serving on the organizing and technical program committee of numerous top international conferences, including ACM SIGCOMM, MobiSys, IEEE Infocom, ICNP, SECON, IJCAI, AAAI, ICWSM, and WWW. He is an ACM Distinguished Scientist and a member of the Academia Europaea.
Funding Statement
This work was supported in part by the Project 16214817 from the Research Grants Council of Hong Kong; in part by Project FP805 from HKUST; in part by the 5GEAR Project, the FIT Project, and the CBAI (Crowdsourced Battery Optimization AI for a Connected World, Grant 1319017) Project from the Academy of Finland; in part by the National Key Research and Development Program of China under Grant 2020YFA0711403; in part by the National Natural Science Foundation of China under Grant U1936217, Grant 61971267, Grant 61972223, Grant 61941117, and Grant 61861136003; in part by the Beijing Natural Science Foundation under Grant L182038; in part by the Beijing National Research Center for Information Science and Technology under Grant 20031887521; and in part by the Research Fund of Tsinghua University-Tencent Joint Laboratory for Internet Innovation Technology.
Footnotes
Contributor Information
Tong Li, Email: t.li@connect.ust.hk.
Mingyang Zhang, Email: mzhangbj@ust.hk.
Yong Li, Email: liyong07@tsinghua.edu.cn.
Eemil Lagerspetz, Email: eemil.lagerspetz@cs.helsinki.fi.
Sasu Tarkoma, Email: sasu.tarkoma@helsinki.fi.
Pan Hui, Email: panhui@cse.ust.hk.
References
- [1].Velavan T. P. and Meyer C. G., “The COVID-19 epidemic,” Trop. Med. Int. Health, vol. 25, no. 3, pp. 278–280, 2020. [DOI] [PMC free article] [PubMed] [Google Scholar]
- [2].McKibbin W. and Fernando R., “The economic impact of COVID-19,” in Economics in the Time of COVID-19, vol. 45, Centre Econ. Policy Res. e-book, London, U.K., 2020. [Google Scholar]
- [3].Li S., Wang Y., Xue J., Zhao N., and Zhu T., “The impact of COVID-19 epidemic declaration on psychological consequences: A study on active weibo users,” Int. J. Environ. Res. Public Health, vol. 17, no. 6, p. 2032, 2020. [DOI] [PMC free article] [PubMed] [Google Scholar]
- [4].Chen M., Li M., Hao Y., Liu Z., Hu L., and Wang L., “The introduction of population migration to SEIAR for COVID-19 epidemic modeling with an efficient intervention strategy,” Inf. Fusion, vol. 64, pp. 252–258, Dec. 2020. [DOI] [PMC free article] [PubMed] [Google Scholar]
- [5].Li T., Zhang M., Cao H., Li Y., Tarkoma S., and Hui P., “‘What apps did you use?’: Understanding the long-term evolution of mobile app usage,” in Proc. Web Conf., 2020, pp. 66–76. [Google Scholar]
- [6].(2020). Statista. [Online]. Available: https://www.statista.com/statistics/330695/number-of-smartphone-users-worldwide/
- [7].Chen M.et al. , “Living with I-Fabric: Smart living powered by intelligent fabric and deep analytics,” IEEE Netw., vol. 34, no. 5, pp. 156–163, Sep./Oct. 2020. [Google Scholar]
- [8].Yarkoni T., “Psychoinformatics: New horizons at the interface of the psychological and computing sciences,” Current Directions Psychol. Sci., vol. 21, no. 6, pp. 391–397, 2012. [Google Scholar]
- [9].Insel T. R., “Digital phenotyping: Technology for a new science of behavior,” J. Amer. Med. Assoc., vol. 318, no. 13, pp. 1215–1216, 2017. [DOI] [PubMed] [Google Scholar]
- [10].Baumeister H. and Montag C., Digital Phenotyping and Mobile Sensing. Cham, Switzerland: Springer, 2019. [Google Scholar]
- [11].Markowetz A., Błaszkiewicz K., Montag C., Switala C., and Schlaepfer T. E., “Psycho-informatics: Big data shaping modern psychometrics,” Med. Hypotheses, vol. 82, no. 4, pp. 405–411, 2014. [DOI] [PubMed] [Google Scholar]
- [12].Van Bavel J. J.et al. , “Using social and behavioural science to support COVID-19 pandemic response,” Nat. Hum. Behav., vol. 4, no. 5, pp. 460–471, 2020. [DOI] [PubMed] [Google Scholar]
- [13].Montag C., Dagum P., and Elhai J. D., “On the need for digital phenotyping to obtain insights into mental states in the COVID-19 pandemic,” Digit. Psychol., vol. 1, no. 2, pp. 40–42, 2020. [Google Scholar]
- [14].Maier B. F. and Brockmann D., “Effective containment explains subexponential growth in recent confirmed COVID-19 cases in China,” Science, vol. 368, no. 6492, pp. 742–746, 2020. [DOI] [PMC free article] [PubMed] [Google Scholar]
- [15].Neyman J. and Pearson E. S., “The testing of statistical hypotheses in relation to probabilities a priori,” in Mathematical Proceedings of the Cambridge Philosophical Society, vol. 29. Cambridge, U.K.: Cambridge Univ. Press, 1933, pp. 492–510. [Google Scholar]
- [16].Shafiq M. Z., Ji L., Liu A. X., Pang J., and Wang J., “Characterizing geospatial dynamics of application usage in a 3G cellular data network,” in Proc. IEEE INFOCOM, Orlando, FL, USA, 2012, pp. 1341–1349. [Google Scholar]
- [17].Ghahramani N. and Brakewood C., “Trends in mobile transit information utilization: An exploratory analysis of transit app in New York city,” J. Public Transport., vol. 19, no. 3, pp. 139–160, 2016. [Google Scholar]
- [18].Maaten L. V. D. and Hinton G., “Visualizing data using t-SNE,” J. Mach. Learn. Res., vol. 9, pp. 2579–2605, Nov. 2008. [Google Scholar]
- [19].Kleinbaum D. G., Dietz K., Gail M., Klein M., and Klein M., Logistic Regression. New York, NY, USA: Springer, 2002. [Google Scholar]
- [20].Suykens J. A. K. and Vandewalle J., “Least squares support vector machine classifiers,” Neural Process. Lett., vol. 9, no. 3, pp. 293–300, 1999. [Google Scholar]
- [21].Chen T. and Guestrin C., “XGBoost: A scalable tree boosting system,” in Proc. 22nd ACM SIGKDD Int. Conf. Knowl. Discov. Data Min., 2016, pp. 785–794. [Google Scholar]
- [22].Cho K.et al. , “Learning phrase representations using RNN encoder-decoder for statistical machine translation,” 2014. [Online]. Available: http://arXiv:1406.1078 [Google Scholar]
- [23].Shafiq M. Z., Ji L., Liu A. X., Pang J., and Wang J., “Geospatial and temporal dynamics of application usage in cellular data networks,” IEEE Trans. Mobile Comput., vol. 14, no. 7, pp. 1369–1381, Jul. 2015. [Google Scholar]
- [24].Peltonen E.et al. , “The hidden image of mobile apps: Geographic, demographic, and cultural factors in mobile usage,” in Proc. 20th Int. Conf. Hum. Comput. Interact. Mobile Devices Serv., 2018, pp. 1–12. [Google Scholar]
- [25].Srinivasan V., Moghaddam S., Mukherji A., Rachuri K. K., Xu C., and Tapia E. M., “MobileMiner: Mining your frequent patterns on your phone,” in Proc. ACM Int. Joint Conf. Pervasive Ubiquitous Comput., 2014, pp. 389–400. [Google Scholar]
- [26].Van Canneyt S., Bron M., Haines A., and Lalmas M., “Describing patterns and disruptions in large scale mobile app usage data,” in Proc. 26th Int. Conf. World Wide Web Companion, 2017, pp. 1579–1584. [Google Scholar]
- [27].Zhao S.et al. , “Discovering different kinds of smartphone users through their application usage behaviors,” in Proc. ACM Int. Joint Conf. Pervasive Ubiquitous Comput., 2016, pp. 498–509. [Google Scholar]
- [28].Do T.-M.-T. and Gatica-Perez D., “By their apps you shall understand them: Mining large-scale patterns of mobile phone usage,” in Proc. 9th Int. Conf. Mobile Ubiquitous Multimedia, 2010, pp. 1–10. [Google Scholar]
- [29].Li T., Li Y., Hoque M. A., Xia T., Tarkoma S., and Hui P., “To what extent we repeat ourselves? Discovering daily activity patterns across mobile app usage,” IEEE Trans. Mobile Comput., early access, Sep. 4, 2020, doi: 10.1109/TMC.2020.3021987. [DOI]
- [30].Saeb S., Lattie E. G., Kording K. P., and Mohr D. C., “Mobile phone detection of semantic location and its relationship to depression and anxiety,” JMIR mHealth uHealth, vol. 5, no. 8, p. e112, 2017. [DOI] [PMC free article] [PubMed] [Google Scholar]
- [31].Schimmenti A., Billieux J., and Starcevic V., “The four horsemen of fear: An integrated model of understanding fear experiences during the COVID-19 pandemic,” Clin. Neuropsychiatry J. Treat. Eval., vol. 17, no. 2, pp. 41–45, 2020. [DOI] [PMC free article] [PubMed] [Google Scholar]
- [32].Elhai J. D., McKay D., Yang H., Minaya C., Montag C., and Asmundson G. J., “Health anxiety related to problematic smartphone use and gaming disorder severity during COVID-19: Fear of missing out as a mediator,” Hum. Behav. Emerg. Technol., vol. 3, no. 1, pp. 137–146, 2021. [DOI] [PMC free article] [PubMed] [Google Scholar]
- [33].Elhai J. D., Yang H., McKay D., and Asmundson G. J., “COVID-19 anxiety symptoms associated with problematic smartphone use severity in Chinese adults,” J. Affect. Disorders, vol. 274, pp. 576–582, Sep. 2020. [DOI] [PMC free article] [PubMed] [Google Scholar]
- [34].Montag C., Baumeister H., Kannen C., Sariyska R., Meßner E.-M., and Brand M., “Concept, possibilities and pilot-testing of a new smartphone application for the social and life sciences to study human behavior including validation data from personality psychology,” J. Multidiscipl. Sci. J., vol. 2, no. 2, pp. 102–115, 2019. [Google Scholar]
- [35].Chen M. and Hao Y., “Label-less learning for emotion cognition,” IEEE Trans. Neural Netw. Learn. Syst., vol. 31, no. 7, pp. 2430–2440, Jul. 2020. [DOI] [PubMed] [Google Scholar]
- [36].Norbury A.et al. , “Social media and smartphone app use predicts maintenance of physical activity during COVID-19 enforced isolation in psychiatric outpatients,” Mol. Psychiatry, vol. 14, pp. 1–11, Dec. 2020. [DOI] [PMC free article] [PubMed] [Google Scholar]
- [37].Couture V., Dingel J. I., Green A. E., Handbury J., and Williams K. R., “Measuring movement and social contact with smartphone data: A real-time application to COVID-19,” Nat. Bureau Econ. Res., Cambridge, MA, USA, Rep. 2241, 2020. [DOI] [PMC free article] [PubMed] [Google Scholar]


