

Abstract
Background
Editor's note: The anti‐inflammatory drug rofecoxib (Vioxx) was withdrawn from the market at the end of September 2004 after it was shown that long‐term use (greater than 18 months) could increase the risk of heart attack and stroke. Further information is available at www.vioxx.com.
Osteoarthritis is a chronic disease of the joints, characterised by joint pain, stiffness and loss of physical function. Its onset is age‐related and occurs usually between the ages of 50 and 60. It is the commonest cause of disability in those aged over 65, with OA of the knee and/or hip affecting over 20 per cent of the elderly population.
Objectives
To establish the efficacy and safety of rofecoxib in the management of OA by systematic review of available evidence.
Search methods
We searched the following databases up to August 2004: MEDLINE, EMBASE, Cochrane Database of Systematic Reviews, Cochrane Controlled Trials Register, National Research Register, NHS Economic Evaluation Database, Health Technology Assessment Database. The bibliographies of retrieved papers and content experts were consulted for additional references.
Selection criteria
All eligible randomised controlled trials (RCTs) were included. No unpublished RCTs were included in this edition of the review.
Data collection and analysis
Data were abstracted independently by two reviewers. A validated checklist was used to score the quality of the RCTs. Comparable trials were pooled using fixed effects model.
Main results
Twenty‐six RCTs were included. The comparators were placebo, diclofenac, ibuprofen, naproxen, nimesulide, nabumetone, paracetamol, celecoxib and Arthrotec. The evidence reviewed indicated that rofecoxib was more effective than placebo (patient global response RR 1.75 95% CI: 1.35, 2.26) but was associated with more adverse events (RR 1.32 95% CI 1.11, 1.56). There were no consistent differences in efficacy between rofecoxib and any of the active comparators at equivalent doses. Endoscopic studies indicated that compared to ibuprofen 800mg three times a day, rofecoxib caused fewer erosions and gastric ulcers at doses of 25mg and 50mg; the difference in duodenal ulcers was evident only at a dose of 25mg. Rofecoxib 50mg also caused more endoscopically observed ulcers greater than rofecoxib 25mg (RR 2.48 CI: 1.21, 5.11). Very few of the trials reported overall rates of GI adverse events although rofecoxib was found to cause fewer GI events than naproxen. Only one of the nine trials comparing rofecoxib to celecoxib reported on the overall rates of GI events and this was a comparison of the higher recommended dose of rofecoxib with the lower recommended dose of celecoxib. Similarly, the three trials in older hypertensive patients that examined the cardiovascular safety of rofecoxib and celecoxib used non‐comparable doses; the results of these studies indicated that rofecoxib caused more patients to have oedema and a clinically significant increase in systolic blood pressure. This difference between rofecoxib and celecoxib was not evident in studies conducted in more general populations.
Authors' conclusions
Rofecoxib was voluntarily withdrawn from global markets in October 2004 therefore there are no implications for practice concerning its use. There remains a number of questions over both the benefits and risks associated with Cox II selective agents and further work is ongoing.
Plain language summary
Rofecoxib for osteoarthritis
Editor's note: The anti‐inflammatory drug rofecoxib (Vioxx) was withdrawn from the market at the end of September 2004 after it was shown that long‐term use (greater than 18 months) could increase the risk of heart attack and stroke. Further information is available at www.vioxx.com.
Does Rofecoxib work for treating osteoarthritis and how safe is it? To answer this question, scientists found and analyzed 26 studies. These studies included over 20 000 people with osteoarthritis and lasted up to 1 year. Studies compared people taking rofecoxib at 12.5, 25 or 50 mg once a day to people taking a placebo (sugar pill) or other NSAIDs such as diclofenac, ibuprofen, naproxen, nimesulide, nabumetone, paracetamol (Tylenol), celecoxib or Arthrotec. These studies provide the best evidence we have today.
What is osteoarthritis and how could rofecoxib help? Osteoarthritis (OA) is the most common form of arthritis that can affect the hands, hips, shoulders and knees. In OA, the cartilage that protects the ends of the bones breaks down and causes pain and swelling. Rofecoxib is often referred to as a 'COX II inhibitor' and is one of the new non‐steroidal anti‐inflammatory drugs (NSAIDs) prescribed to decrease pain and inflammation. Other NSAIDS, such as naproxen (Naprosyn) are also prescribed but they come with warnings that they may cause stomach problems such as ulcers, bleeds and sores that can be serious. Rofecoxib is thought to be safer on the stomach than other NSAIDS.
Rofecoxib was taken off the market in October 2004. A study had shown that people taking rofecoxib to prevent colon cancer had more heart attacks and strokes than people taking a sugar pill.
What did studies testing rofecoxib in OA show? Studies showed people taking rofecoxib improved more than people taking a sugar pill.
Three studies showed that • 29 out of 100 people felt better overall with a sugar pill • 53 out of 100 people felt better overall with rofecoxib at 12.5 mg per day.
Studies also showed that improvements were about the same whether people took rofecoxib or a different NSAID.
How safe was it in the studies? Very few studies recorded and reported stomach problems. When rofecoxib was compared to a sugar pill, more people taking rofecoxib had kidney problems, water retention and high blood pressure but the number of people with stomach problems was about the same.
When compared to other NSAIDs, less people taking 25 or 50 mg rofecoxib had stomach problems than when taking ibuprofen (800 mg three times a day) or naproxen. Rofecoxib also caused less diarrhea than arthrotec.
What is the bottom line? Rofecoxib was withdrawn from the world wide market in October 2004 and is no longer available.
When considering which non‐steroidal anti‐inflammatory drug (NSAID) to use, it must be remembered that the effects and safety of a drug is different among people and depends on the drug. The effect and safety also depends on the dose and how it acts in the body.
There are still questions about the effects and safety of other Cox‐II inhibitors and more research is being done.
Background
Osteoarthritis (OA) is the most common form of arthritis and is caused by degeneration of the joint cartilage and growth of new bone, cartilage and connective tissue. OA is a chronic disease and causes pain, stiffness and loss of physical function. It is often associated with significant disability and impaired quality of life, particularly when the knee and hip joints are affected. The onset of OA is age‐related and occurs usually between the ages of 50 and 60.
OA is not curable therefore management relies on pain control, strategies to reduce stiffness and maintain physical function, and drugs to modify the disease process. Non‐drug management (physiotherapy, occupational therapy, weight loss and exercise) can control some symptoms but invariably drugs are required. Non‐steroidal anti‐inflammatory drugs (NSAIDs) are commonly used to reduce pain and inflammation. These are a diverse group of compounds that share many pharmacological properties and side‐effects, including a propensity to cause damage to the gastro‐intestinal tract. These gastro‐intestinal (GI) effects commonly present as symptoms such as nausea, dyspepsia and gastritis. NSAIDs can however cause more serious GI complications (ulcers, perforations, obstructions and bleeding). Studies have indicated that ulcers that are visible on endoscopy are present in up to 40% of chronic NSAID users (Stalnikowicz 1993) but 85% of them never become clinically apparent. Perforations, obstructions and bleeds can be fatal but are less common with an estimated incidence of approximately 1.5% per year (Silverstein 1995). NSAIDs are weak acids and rapidly penetrate the superficial gastric mucosal lining cells, which can lead to erosion of the cells and cause symptoms. Whilst these local effects are important, they do not automatically result in ulcers; research indicates this is in part due to systemic inhibition of prostaglandins.
NSAIDs primarily act on the cyclo‐oxygenase (Cox) enzyme that converts arachidonic acid into prostaglandins. Prostaglandins are a group of hormone‐like chemicals that are normally present in the body and, amongst other functions, mediate inflammation and pain. Two principal forms of the Cox enzyme have been described; Cox I and Cox II (Vane 1998). Cox I is responsible for the production of prostaglandins that are essential for maintenance of normal endocrine and kidney function, gastric mucosal integrity and the processes that stop bleeding (haemostasis). Cox I is normally present in high concentrations in platelets, vascular endothelial cells, the stomach and kidney collecting tubules. Platelet Cox‐1 mediates the production of thromboxane A2, a prostaglandin that promotes constriction of the blood vessels and activates the platelets causing them to aggregate.
In contrast, Cox II is normally virtually undetectable in most tissues but it is produced in response to inflammatory and mitogenic stimuli; this suggests that it has an important role in the mediation of inflammation (Vane 1998). It has been shown that Cox II is induced in rheumatoid synoviocytes, macrophages and polymorphonuclear leukocytes (Vane 1998). Cox II also is involved in production of prostacylin, a prostaglandin that dilates blood vessels, and inhibits aggregation of the platelets.
Research indicated that the GI adverse events associated with NSAIDs are due, at least in part, to inhibition of Cox I. It was therefore hypothesised that if an NSAID inhibited Cox II alone, whilst having a minimal effect on Cox I, the gastrointestinal adverse effects could be reduced with no impact on effectiveness. This led to the development of the group of NSAIDs known as the coxibs, which currently includes celecoxib, etoricoxib, lumiracoxib, parecoxib, rofecoxib, and valdecoxib. This review examines the safety and efficacy of rofecoxib, which is licensed for OA at a dose of 12.5mg to 25mg/day.
Objectives
To assess the clinical efficacy and safety of rofecoxib in OA by systematic review of available evidence.
Methods
Criteria for considering studies for this review
Types of studies
Published prospective randomised controlled trials (RCTs) of parallel design. Studies published in any language were considered. No unpublished studies were sought for this edition of the review.
Types of participants
Patients with OA of any age and either sex.
Types of interventions
Rofecoxib versus placebo or another active comparator.
Types of outcome measures
Studies were included if any accepted method to assess disease severity or progression was used.
The outcome measures sought were those agreed to at OMERACT III (Bellamy 1997), where the assessment includes at least one validated measure of pain, physical function or global assessment of the patient.
EFFICACY MEASURES: OMERACT outcomes 1) partial or total reduction of pain 2) improvement on the degree of the studied joint movements 3) global assessment by the patient 4) joint imaging for studies of 1 yr or more
In addition to these outcomes: validated outcome measures of physical function were sought, for example the WOMAC, HAQ, and LEQUESNE INDEX, physician global assessment and quality of life.
SAFETY MEASURES: Data were also collected on the number of (incidence and severity of): 1) total withdrawals 2) withdrawals due to adverse events (AEs) 3) withdrawals due to gastro‐intestinal AEs (GI AEs) 4) withdrawals due to lack of efficacy 5) total adverse events (AEs) associated with therapy 6) number of patients with cardiovascular event(s) 7) number of patients with ulcer(s) and/or perforation and/or obstruction and/or GI bleed (PUBs). 8) number of patients with perforation and/or obstruction and/or GI bleed (POBs) 9) deaths
Search methods for identification of studies
We searched MEDLINE (1966 to week 36 2004), EMBASE (1980 to week 36 2004) and the Cochrane Central Register of Controlled Trials (CENTRAL) (Issue 3: 2004) to identify trials of rofecoxib in OA patients. The Cochrane Collaboration trial filter was used for the MEDLINE search. The bibliographies of retrieved reviews were scanned for additional references.
MEDLINE search 1. (cyclooxygenase‐2 or cyclooxygenase 2 or cyclooxygenase‐II or cyclooxygenaseII).ti,ab. 2. (cyclo oxygenase‐2 or cyclo oxygenase2 or cyclo oxygenase‐II or cyclo oxygenaseII).ti,ab. 3. (cox‐2 or cox2 or cox‐II or coxII).ti,ab. 4. (rofecoxib or vioxx or MK‐0966).af 5. Cyclooxygenase inhibitors/ 6. or/1‐5 7. exp *arthritis/ 8. (arthrit$ or osteoarthrit$).ti,ab. 9. 7 or 8 10.6 and 9
EMBASE search 1. (cyclooxygenase‐2 or cyclooxygenase2 or cyclooxygenase‐II or cyclooxygenaseII).ti,ab. 2. (cyclo oxygenase‐2 or cyclo oxygenase2 or cyclo oxygenase‐II or cyclo oxygenaseII).ti,ab. 3. (cox‐2 or cox2 or cox‐II or coxII).ti,ab. 4. (rofecoxib or vioxx or MK‐0966).af. 5. Cyclooxygenase 2 inhibitor/ 6. Cyclooxygenase 2/ 7. Rofecoxib/ 8. or/1‐7 9. (arthrit$ or osteoarthrit$).ti,ab. 10. exp Arthritis/ 11. 9 or 10 12. 8 and 11
Cochrane Library/CENTRAL 1. (CYCLOOXYGENASE* near INHIBITOR* 2. (CYCLO next OXYGENASE*) near INHIBITOR* 3. COX* near INHIBITOR* 4. ROFECOXIB or VIOXX 5. CYCLOOXYGENASE‐INHIBITORS:ME 6. #1 or #2 or #3 or #4 or #5 7. ARTHRITIS or OSTEOARTHRITIS 8. ARTHRITIS*:ME 9. (#7 or #8) 10.(#6 and #9)
The titles and abstracts identified by the searches were assessed by two reviewers (RF, SG) for inclusion.
Data collection and analysis
STUDY SELECTION AND DATA EXTRACTION Two reviewers (SG and DF or RF) independently ascertained whether each study met the inclusion criteria for the review and a double abstraction process was undertaken. Any discrepancies were resolved by discussion and where this was not possible the authors of the study were contacted for clarification. Abstracts were considered in tandem with the full publication.
QUALITY ASSESSMENT The methodological quality of the included studies was assessed by two independent reviewers (SG,LM) on the basis of randomisation, adequate concealment of randomisation, degree of blinding, use of intention to treat analysis and description of dropouts and withdrawals. The Jadad and Schultz assessment tools (Jadad 1996, Schulz 1995) were used to assign the quality scores to each study.
DATA ANALYSIS Where possible data from intention to treat (ITT) analysis were abstracted. Results are presented in both absolute and relative terms and are presented as relative risks (RR) or mean differences (MD) with their 95% confidence intervals (95% CI). A fixed effects model was used throughout. Data on the incidence of ulcers detected on endoscopy were considered separately from those that presented clinically.
Results
Description of studies
A total of 26 RCTs met the inclusion criteria for this review. Five have been published in abstract form only: Moskowitz 2003; CRESCENT (Sowers); Geba (MSD 090); Schnitzer 2001; VACT 2. All but three of the publications acknowledged sponsorship from either Pfizer or MSD Herrera 2003; Bianchi 2003; Niccoli 2002.
The following comparators were used: naproxen ( 3 RCTs (NAPROXEN 901 OC/OF and Advantage 2000); placebo (12 RCTs Ehrich 2001(MSD 029); Ehrich 1999 (pilot); Schnitzer 2001; Day 2000 (MSD 040); Geba (MSD 090); Kivitz 2004(MSD 085); Hawkey 2000(MSD 045); Laine 1999 (MSD 044); Saag 2000 (MSD 034); Truitt 2001(MSD 058); Gibofsky 2003; McKenna 2000; diclofenac (3 RCTs: Cannon 2000(MSD 035); Saag 2000 (MSD 034); Niccoli 2002); ibuprofen (4 RCTs: Day 2000 (MSD 040); Hawkey 2000(MSD 045); Laine 1999 (MSD 044); Saag 1998 (MSD 033)); nabumetone (3 RCTs: Kivitz 2004(MSD 085); Truitt 2001(MSD 058)Geba (MSD 090)); diclofenac/misoprostol (1 RCT Acevedo 2001(MSD902)) nimesulide: (2 RCTs: Bianchi 2003; Herrera 2003) ; celecoxib/paracetamol VACT. VACT 2; AMG Niccoli 2002; celecoxib Geba (MSD 090); McKenna 2000; SUCCESS VI; SUCCESS VII; Bianchi 2003; VACT; VACT 2; Gibofsky 2003; Schnitzer 2001; CRESCENT (Sowers) and valdecoxib Moskowitz 2003.
Of these studies two evaluated GI safety by endoscopic examination of patients Hawkey 2000(MSD 045); Laine 1999 (MSD 044) and the results have therefore been considered separately.
Risk of bias in included studies
The methodological quality of the included studies was assessed using a validated checklist (Jadad 1996) that rates the appropriateness of randomisation (2 points), appropriateness of double blinding (2 points) and description of dropouts and withdrawals (1 point), the total possible score is five. In addition, concealment allocation was assessed and rated as A (blind randomisation), B (unclear methods of randomisation), or C (quasi‐randomisation) (Schulz 1995). Quality was assessed independently by two reviewers (SG, LM). Differences were resolved by consensus.
Quality was not assessed on those trials published in abstract form only. All but one trial were randomised, double blinded trials; Niccoli 2002 was single‐blinded. All trials except for Hawkey 2000(MSD 045) and Laine 1999 (MSD 044) included a description of the reasons for dropouts. The Herrera 2003 and Ehrich 2001(MSD 029) papers received a quality score of three because neither the method of randomisation nor the method of double‐blinding was described. Niccoli 2002 received a quality score of three because it was singled blinded and the method of randomization was not described. Hawkey 2000(MSD 045) did not give the reason for withdrawal, nor the method of randomization and so also scored a three. McKenna 2000 and Bianchi 2003 both had a quality score of four because they did not describe the method of blinding. Laine 1999 (MSD 044) also scored a four because the reason for dropout was not described. The remaining papers all included a description of appropriate randomisation and double blinding so received two additional points and an overall quality score of five out of five. Clear methods of concealment of allocation was stated in five trials (Day 2000 (MSD 040), Ehrich 1999 (pilot), Kivitz 2004(MSD 085), Laine 1999 (MSD 044), SUCCESS VI) and therefore received a concealment rating of A. The remaining trials did not clearly indicate clear methods of concealment of allocation and thus received a concealment rating of B.
Effects of interventions
1. ROFECOXIB versus PLACEBO 13 RCTs were identified that had a rofecoxib arm and a placebo arm; two included only a rofecoxib and a placebo arm Ehrich 2001(MSD 029); Ehrich 1999 (pilot), whilst the other 11 had additional active comparators. The comparators were: ibuprofen (4 RCTs: Day 2000 (MSD 040); Hawkey 2000(MSD 045); Laine 1999 (MSD 044); Saag 1998 (MSD 033)); nabumetone (3 RCTs: Geba (MSD 090); Kivitz 2004(MSD 085); Truitt 2001(MSD 058)) celecoxib (3 RCTs: Gibofsky 2003; McKenna 2000; Schnitzer 2001) and valdecoxib (1 RCT: Moskowitz 2003).
1.1 EFFICACY Meta‐analysis was possible for a number of efficacy outcomes; rofecoxib was consistently found to be superior to placebo across the WOMAC subscales although some heterogeneity was seen in the results due to the findings of Gibofsky 2003. Similarly, all patient/investigator ratings, measured on both continuous and dichotomous scales in both individual trials and the pooled results, indicated rofecoxib to be superior apart from one trial's investigator improved/ not improved 25mg 6 weeks Gibofsky 2003 and another's patient measures of disease status Truitt 2001(MSD 058). The number needed to treat (NNT) with rofecoxib versus placebo to achieve an improvement in patient global assessment was 5 (95% CI: 4, 6)(see Additional tables, Table 1; Table 2) Two studies (Truitt 2001(MSD 058); Day 2000 (MSD 040)) reported on joint tenderness at 6 weeks, which was less in both the 12.5mg and 25mg groups. One study reported SF36 physical component and mental components at 6 weeks; all rofecoxib doses were superior to placebo Ehrich 2001(MSD 029). Four trials reported on paracetamol rescue, which was less in the rofecoxib group apart from in Gibofsky 2003. Rofecoxib also caused statistically significantly fewer withdrawals due to lack of efficacy across all doses and timepoints.
1. Clinical benefit for improvement in patient global assessment.
| Outcome | Dose | Duration | Event rate rofecoxib | Event rate placebo | Relative Risk(95%CI) | Absolute Risk Differ | NNT |
| Patient measured Good or excellent response/improved | 12.5mg | 6 weeks | 552/1033 | 136/473 | 1.85 (1.59, 2.16) | 0.25 (0.19, 0.30) | 5 (4, 6) |
| Patient measured Good or excellent response/improved | 25mg | 6weeks | 220/417 | 48/165 | 1.75 (1.35, 2.26) | 0.22 (0.13, 0.30) | 5 (4, 9) |
2. Adverse Events.
| OUTCOME | DOSE | DURATION | EVENT RATE ROFECOXIB | EVENT RATE PLACEBO | RELATIVE RISK(95%CI) | ABSOLUTE RISK DIFF | NNH (95% CI) |
| Serious Adverse Events | 12.5mg | 6 weeks | 20/932 | 2/456 | 3.95 (1.06, 14.63) | 0.02 (0.01, 0.03) | 78 (17, 3788) |
| Serious Adverse Events | 25mg | 6 weeks | 2/378 | 3/280 | 0.47 (0.11, 2.08) | ‐0.01 (‐0.03, 0.01) | 177 (Not available) |
| GI events | 12.5mg | 6 weeks | 29/424 | 14/208 | 1.02 (0.55, 1.88) | 0.00 (‐0.04, 0.04) | 743 (Not available) |
| GI events | 25mg | 6 weeks | 20/59 | 6/60 | 3.39 (1.47, 7.84) | 0.24 (0.10, 0.38) | 5 (2, 22) |
1.2 SAFETY Meta‐analysis was possible for a number of safety outcomes. Many of the trials did not report total numbers of adverse events. Rofecoxib was found to have a statistically significant greater overall rate of adverse events at the following dose/duration: 12.5mg 6 weeks; 25mg 6 weeks and 50mg 18 weeks. The number of serious adverse events was greater at a dose of 12.5mg at 6 weeks (RR: 3.95 CI: 1.05, 14.63). The event rates were too low in the 25mg trials to allow meaningful comparison. The rates of total GI events were statistically significant over 6 weeks with the 25mg dose (RR: 3.39 CI: 1.47; 7.84). One study showed a statistically significant increase in systolic BP using 25mg at 6 weeks (RR: 2.89 CI: 1.17, 7.84) and rofecoxib 12.5mg caused a greater incidence of lower extremity oedema at 6 weeks (RR: 2.40 CI: 1.05, 5.48). No other differences were observed. Withdrawals due to adverse events were significantly greater in the rofecoxib 12.5mg group over 6/8 weeks (RR: 2.18 CI: 1.34, 3.55) and 50mg at 12 weeks (RR: 2.04 CI: 1.24, 3.36) but not 25mg at 6 weeks (RR: 1.56 CI: 0.94, 2.59). Two trials reported withdrawals due to GI adverse and CV adverse events and found no statistically significant differences McKenna 2000; Saag 1998 (MSD 033). The one trial that reported withdrawals due to CV adverse events found no difference Saag 1998 (MSD 033). Pooled analysis of the two 18 week endoscopy studies indicated that there were no statistically significant differences in the rates of ulcers or erosions apart from rofecoxib causing fewer ulcers greater than or equal to 5mm in diameter (RR: 0.42 CI: 0.20, 0.86).
2. ROFECOXIB versus DICLOFENAC Three published RCTs were identified that compared rofecoxib (12.5mg or 25mg per day) to diclofenac 50mg three times a day. Other than the rates of withdrawals there were no poolable data therefore the results of individual studies are presented below.
The first RCT was an Italian two‐week, single‐blind study that compared the renal tolerability of rofecoxib 25mg per day with that of diclofenac 150 mg per day and amtolmetin guacyl (AMG) in 90 individuals between 60 and 80 years of age Niccoli 2002. The publication was however ambiguous about the methodology used in this study and states that dropouts were replaced by the next eligible patient, who was assigned to the same treatment arm. Six patients were "discounted" (1 AMG; 1 diclofenac; 4 rofecoxib) because they withdrew from the study during the first week of treatment due to intolerance or adverse events. Patients were also withdrawn if any adverse event related to the study drug occurred. The paper does however state that all adverse events statistics (excluding those for renal function) were based on the 96 patients originally enrolled.
The other two RCTs enrolled 693 Saag 2000 (MSD 034) and 784 patients Cannon 2000(MSD 035) over 40 years of age with OA of the knee or hip. Over a one‐year period rofecoxib 12.5mg and 25mg per day was compared under double‐blind conditions to 50mg diclofenac three times per day. Neither of the primary publications states that the trials were of identical design, but data from the two 'replicate' trials have been pooled in a post‐hoc analysis of data collected from liver‐function tests Cannon 2003 and two‐year follow up data have also been published in abstract form Cannon 2003.
There are however a number of ambiguities in the report of MSD 034 which makes it difficult to validate the results (see notes Table of Included Studies). Although it is described as a one‐year study, the publication states that "primary efficacy analyses were based on the average change from baseline over the first 12‐week treatment period. Analyses were also performed at 26 and 52 weeks". No 12‐week data are reported and no measures of dispersion given for the 52 week data. After 26 weeks of treatment topical or systemic analgesics and corticosteroids were permitted for breakthrough OA pain. Figure 4 in the publication indicates "p<0.001 vs. placebo for all active treatments" despite no placebo group being reported in the methods section. There are also some conflicts in the text with regard to the designation of the primary endpoints with Figure 4 and the results section indicating that they were the WOMAC subscales and the methods section which indicates only the WOMAC pain. The methods section states that for clinical comparability two conditions had to be met: in any two of the primary endpoints, the 95% confidence intervals (CIs) of mean differences between treatment groups were to be within predefined comparability bounds (+/‐ 10mm on a 100‐mm VAS and +/‐ 0.5 on a Likert); and all 3 of the posterior probabilities (with noninformative prior distributions) that the true mean differences are within the predefined clinical comparability bounds were p<.05.
2.1 EFFICACY Other than for withdrawals due to lack of efficacy, no pooling of efficacy data was possible and therefore results for individual studies are presented below. Pooled data indicated that over one year fewer individuals taking rofecoxib 25mg per day withdrew due to lack of efficacy compared to those taking diclofenac 50mg three times a day (RR: 1.43 CI 1.05, 1.94). There were no statistically significant differences in the 12.5mg comparison (RR: 1.11 CI: 0.80, 1.54).
After two weeks, the Italian study stated that rofecoxib and diclofenac significantly improved the measures of pain, and according to the patients' and physicians' global assessment of disease activity, the reduction in the diclofenac group was significantly greater (p<0.001) Niccoli 2002. Patient global assessment of pain (WMD ‐6.26 95% CI: ‐10.78, ‐1.74); patient global disease activity (WMD ‐6.39; 95% CI: ‐10.87, ‐1.91); physician disease activity (WMD ‐5.08; 95% CI: ‐9.66, ‐0.50). The results however may be compromised due to the unusual methodology.
In the first of the one year studies, all three groups experienced significant improvement in disease status from baseline, which met the author's pre‐specified criteria for comparable efficacy; comparability stated if for all three primary endpoints, the 95% confidence intervals of the difference in the mean treatment response between two treatments were within + or ‐ 10mm on a 100mm VAS scale or 0.5 on a Likert scale Cannon 2000(MSD 035). There were statistically significant differences in favour of diclofenac for the patients' assessment of response to therapy and the physicians' assessment of disease status, although the paper states that this was only measured up to 26 weeks. The authors report that treatment by factor analysis for the 3 primary endpoints showed that there was no statistically significant interaction with treatment for various subgroups, including location of the study joint (knee or hip), previous OA medication (NSAID/paracetamol), age and gender.
In the second year‐long RCT, only the mean changes were available without any measures of dispersion Saag 2000 (MSD 034). In addition, no 12‐week data were reported, despite this being stated as the primary endpoint. At 52 weeks there were no statistically significant differences between rofecoxib 12.5mg and rofecoxib 25mg, but the 12.5mg dose showed statistically significant less efficacy compared to diclofenac on pain on walking on a flat surface, investigator global assessment of response to therapy, patient global assessment of disease status and increased rescue paracetamol use. None of these endpoints were designated as primary. There is additionally ambiguity concerning the results of rofecoxib 25mg versus diclofenac with the table not indicating any statistically significant differences but the text stating " Efficacy results were consistent for each dose of rofecoxib compared with diclofenac for the endpoints: patient global assessment of response to therapy and investigator global assessment of disease status (p=0.03 vs. 25mg, and p=0.01 vs. 12.5mg respectively). For patient global assessment of disease status rofecoxib was different [less improvement] from diclofenac (p=0.01)." Although the methods section states the grounds for clinical comparability the results state that the 95% confidence intervals for the difference between 12.5mg and 25mg rofecoxib vs. diclofenac were contained within the prespecified comparability grounds for the WOMAC scales, indicating clinical comparability.
2.2 SAFETY The two‐week renal tolerability study stated that both diclofenac and rofecoxib impaired renal function (unlike AMG). The validity of the results may however be compromised by the unusual methodology Niccoli 2002. The authors concluded that rofecoxib caused increased water and salt retention as indicated by a significant increase in body weight, systolic and diastolic blood pressure and serum sodium and uric acid. A significant reduction in diuresis and creatinine clearance also occurred; 6 patients experienced oliguria and mild malleolar oedema and weight gain, 4 patients developed hypertension and an additional 4 patients withdrew from the study due to acute development of marked peripheral oedema and rapid weight gain. In the diclofenac group there was an increase in BUN and serum creatinine, potassium and uric acid, with a decrease in 24‐hour urine volume and creatinine clearance. One patient withdrew due to gastric intolerance and a further 8 experienced gastric pain. AMG treated patients did not show any significant impairment of renal function. The only between group comparison reported was a significant reduction in creatinine clearance in the diclofenac group compared to both the AMG and the rofecoxib group.
The first one‐year RCT, reported no differences in GI events, CV events, oedema or PUBs Cannon 2000(MSD 035). The diclofenac group experienced greater increases in mean alanin and aspartate aminotransferase levels. No episodes of GI bleeding were reported.
The second one‐year RCT only presented data for drug related adverse experiences occurring in >= 5% of patients Saag 2000 (MSD 034). The authors report that the rates of individual adverse experiences were generally similar between the groups for all events occurring at >=5% of individuals except for abdominal pain which occurred at a significantly higher rate in the diclofenac group compared to both the rofecoxib groups 13/230 vs. 2/231 and 2/232(p=0.01). Four deaths were reported in the diclofenac group with none in the rofecoxib group; no death was considered to be drug related by the investigator with all having previous medical history of related disorders. More patients discontinued due to adverse experiences and due to GI adverse experiences in the diclofenac group. No rates of overall GI adverse events are reported as the publication only reports those occurring with an incidence of >= 5%. Discontinuations due to cardiovascular events, including hypertension, palpitation, and Transient Ischaemic Attack (TIA) occurred in 3/231, 4/232 and 3/230 (RR: 1.00; 95% CI: 0.2, 4.9) and (RR: 1.3; 95% CI: 0.3; 5.8) respectively. Diclofenac again was shown to raise transaminase levels 10/230 compared to 1/232 receiving 25 mg rofecoxib.
The ambiguities in the reports not withstanding, the withdrawal data from the two trials one‐year could be pooled: There were fewer withdrawals due to AE in both the 12.5mg rofecoxib (RR: 0.71 CI: 0.52, 0.97) and 25mg (RR: 0.70 CI: 0.51, 0.95) groups respectively. There were no statistically significant differences in the withdrawals due to GI adverse events, total withdrawals and CV adverse events.
The post‐hoc analysis of liver‐function tests indicates that there were statistically significantly less disturbances of liver function in the rofecoxib groups compared to the diclofenac. The number of patients reported is not consistent with the primary papers however and only percentage results are reported with no indication of the numbers in each group Cannon 2003.
3. ROFECOXIB VERSUS IBUPROFEN Four double‐blind RCTs were identified that compared rofecoxib to ibuprofen in patients with OA; Saag 1998 (MSD 033); Day 2000 (MSD 040); Laine 1999 (MSD 044); Hawkey 2000(MSD 045). Two of these RCTs were of identical design and used endoscopy to compare the gastro‐duodenal impact of 16 to 24 weeks treatment with either 25mg or 50 mg rofecoxib once daily, ibuprofen 800mg three times a day or placebo in 775 Hawkey 2000(MSD 045) and 742 Laine 1999 (MSD 044) patients. Neither trial enrolled aspirin users. At 16 weeks "because of an anticipated lack of efficacy in the placebo group, 95% of placebo patients and 5% of patients in the other groups (in a blinded fashion) were randomly discontinued, via a separate set of individually sealed envelopes". Investigations were performed at baseline, 6, 12 and 24 weeks. Only 12‐week endoscopy data are included in this review due to the random discontinuations. The Hawkey paper also states that 89 patients did not undergo treatment‐phase endoscopy. The discussion in the publication also states "the ulcer incidence rates for the rofecoxib groups did not change significantly in the second three months compared to the first three months. This suggests no change in the risk of GI injury with COX‐2 specific inhibition with rofecoxib over 6 months. However without a placebo group for comparison in the second 3 months of the study, this inference cannot be confirmed". Neither publication makes it clear at what time point the trial profiles and the analysis of adverse events and withdrawals relate to. Therefore it is assumed to be 16 weeks. The incidence of events in many cases is given in percentages and, because the denominators are uncertain, the numerators may be incorrect.
The other two RCTs compared rofecoxib (12.5mg or 25mg once daily) to ibuprofen (800mg three times a day) or placebo over a six week period in 1156 Saag 1998 (MSD 033) and 809 adults with OA Day 2000 (MSD 040).
3.1 EFFICACY The endoscopy study patients completed a 5‐point Likert 'Patient Global Assessment of Disease Efficacy' at each visit. Both trials reported that the mean change from baseline was significantly greater in the active treatment groups compared to placebo (p<0.001). Insufficient data were presented to permit statistical combination of the results and rofecoxib and ibuprofen were not statistically compared. There was no statistically significant difference in the pooled estimates of withdrawals due to lack of efficacy Hawkey 2000(MSD 045); Laine 1999 (MSD 044).
Although the two 6‐week trials were of similar design, lack of appropriate data in the publication prevented pooling of the trials for all outcomes apart from withdrawals due to lack of efficacy. The Saag publication states that the treatments had comparable efficacy over the six‐week period, but only presents mean values with no measures of dispersion Saag 1998 (MSD 033). The number of patients reporting a good or excellent global assessment of response to therapy was 126/221 in the ibuprofen group compared to 120/219 in the 12.5mg rofecoxib group (RR: 0.96 95%CI: 0.81, 1.13) and 138/227 in the rofecoxib 25mg group (RR: 1.07 95% CI: 0.91, 1.25). The publication also reports that overall rates of withdrawals due to lack of efficacy (LOE) indicated comparable efficacy with 12.5mg rofecoxib, but that 25 mg was superior i.e. had fewer withdrawals (RR: 0.46 95% CI: 0.21, 1.00). However when the results were pooled with the second RCT Day 2000 (MSD 040), the results did not reach significance: 12.5mg (RR: 0.9; 95% CI: 0.54, 1.52) and 25mg (RR: 0.57; 95% CI: 0.31, 1.03).
The Day publication states that the clinical efficacy of both rofecoxib groups was comparable with that of ibuprofen, using pre‐specified comparability criteria Day 2000 (MSD 040). The effect of 25mg rofecoxib was however statistically significant superior to that of ibuprofen in two of the primary measures; patient global response to therapy (RR: 0.22 CI: 0.06, 0.38) and investigator global disease status (RR: 0.19 CI: 0.06, 0.32). The secondary criterion of patient measured disease status also indicated statistical superiority of 25mg dose (RR: 3.77 CI: 0.09, 7.45). Joint tenderness results were also significantly in favour of rofecoxib 25mg but WOMAC scores did not indicate any significant difference.
3.2 SAFETY Data at 12 weeks from the two identical endoscopy studies Hawkey 2000(MSD 045); Laine 1999 (MSD 044) were pooled; rofecoxib at doses of 25mg and 50mg was associated with fewer gastric ulcers than ibuprofen 800mg three times a day (RR: 0.15 CI: 0.09, 0.25) and (RR: 0.23 CI: 0.14, 0.36). However, although the results indicated that rofecoxib also caused fewer duodenal ulcers at a dose of 25mg (RR: 0.24 CI: 0.09, 0.63), at the 50mg dose, the reduction did not reach significance (RR: 0.55 CI: 0.27, 1.12). Information on the number of erosions on endoscopy was also reported in broad terms but data from the two RCTs could not be combined because Laine and the pooled analysis reported results in graphical form only Hawkey 2001. Results from the Hawkey trial indicated both doses of rofecoxib were associated with fewer erosions (25mg WMD ‐2.98 CI: ‐3.71, ‐2.25) and 50mg WMD ‐2.74 CI: ‐3.48, ‐2.00) Hawkey 2000(MSD 045).
With respect to the number of complicated upper GI events, there is some ambiguity about the number of bleeds experienced. The Laine publication states that three ulcer complications occurred (2 upper GI bleeding episodes in the ibuprofen group and 1 in the 25mg rofecoxib group) and the Hawkey publication that one patient receiving placebo developed an upper GI bleed and 1 receiving ibuprofen. However the publication of the combined analysis states that "sixteen of the clinical presentations with a bleed that were reported during the 12‐ week placebo controlled parts of the studies were confirmed by the adjudication committee" Hawkey 2000(MSD 045)Hawkey 2001. No breakdown by allocated group was presented. Data on the rates of withdrawals due to adverse events could be pooled and the only statistically significant difference was that there were fewer in the 25mg rofecoxib group in the endoscope studies at 16 weeks.
Pooling of data on adverse events was hampered due to poor reporting. The Saag publication only reports on adverse events that occurred with an incidence of >=5%; lower extremity oedema and diarrhoea Saag 1998 (MSD 033). No overall rates of adverse events or GI adverse events were presented. The Day publication also does not report the overall rates of GI events Day 2000 (MSD 040). Pooling of the available data indicated no significant differences at any dose or time‐point. For the 25mg dose of rofecoxib there was some indication that there was more lower‐extremity oedema (RR: 2.34 CI: 0.84, 6.52) in the Saag trial Saag 1998 (MSD 033). The Day publication reports that the incidence of any laboratory adverse events, body weight change, blood pressure change, oedema and hypertension were not significantly different in the active groups, but no data are presented Day 2000 (MSD 040).
4. ROFECOXIB VERSUS NAPROXEN
Three RCTs were identified that enrolled a total of 6501 patients. Two of the RCTs had identical protocols and were therefore combined into a single publication NAPROXEN 901 OC/OF. Rofecoxib 12.5mg once daily was compared to naproxen 500mg twice daily for six weeks in a total of 944 patients aged 40 years or over with OA of the knee or hip. Matching placebos were used to maintain blinding.
The 12‐week double‐blind ADVANTAGE study enrolled 5557 patients and compared rofecoxib 25mg daily with naproxen 500mg twice daily Advantage 2000. Again, matching placebos were used to maintain blinding. Six‐week data were not reported therefore no meta‐analysis could be undertaken. Patients were permitted to take concomitant GI protective medication (PPI, antacids or H2blockers); which were taken in 253/2785 vs 310/2772 individuals (RR: 0.81 CI: 0.69, 0.95).
A fourth study, the Pharmacia sponsored CRESCENT study, examined 24 ambulatory blood pressure in patients with Type II diabetes who were taking ACE inhibitors for hypertension CRESCENT (Sowers). Patients received 25mg rofecoxib (once daily), 200mg celecoxib (once daily) or naproxen 500mg (twice daily) over 12 weeks. Very limited data were available for evaluation as the methods and results have only been published in abstract form.
4.1 EFFICACY No pooling of data could be undertaken and therefore the results of individual studies are discussed.
The publication for the 901 OC/OF studies presents results graphically with tabulated differences in mean changes with no measures of dispersion. The authors however report that one of the studies in the combined analysis found a statistically significant difference in favour of naproxen for the patient global assessment of response to therapy (one of the designated primary endpoints) NAPROXEN 901 OC/OF. This finding was not duplicated in the second study. There were also some significant differences in favour of naproxen in some of the secondary endpoints and in the combined analysis. However the authors reported that all 95% CI's were well within the pre‐stated equivalence boundaries indicating comparable treatment effects. The authors therefore concluded that 12.5mg of rofecoxib once daily was comparable to 500mg naproxen twice daily. However, additional 'rescue' medication was taken by 56% of rofecoxib patients and 53.5% of naproxen patients (RR 1.05 CI: 0.93, 1.18). There were no differences reported in the onset of pain relief (RR 1.11; 95% CI: 0.96, 1.28). Treatment by subgroup interaction tests indicated that the effect was consistent across subgroups.
The ADVANTAGE study permitted rescue medication but no results were reported Advantage 2000. Onset of pain relief was reported to be similar in the two groups and after 12 weeks of therapy there were no statistically significant differences in any of the endpoints between 25mg rofecoxib and 500mg naproxen. Withdrawals due to lack of efficacy were similar 177/2785 vs. 176/2772 (RR: 1.00 CI: 0.82, 1.22).
The abstract for the CRESCENT (Sowers) study reported that the "arthritis assessments demonstrated that changes in total WOMAC were similar for all 3 treatments at week 6 (p=0.4) and week 12 (p=0.39)". No data were provided.
4.2 SAFETY The Naproxen 901 studies indicated that although there was no statistically significant difference in the overall rates of adverse events, fewer patients in the rofecoxib group experienced GI adverse events 63/471 vs. 114/473 (RR: 0.55 CI: 0.42, 0.73) which led to fewer discontinuations (RR: 0.28 CI: 0.10, 0.75) NAPROXEN 901 OC/OF. Seventeen patients in the study had a serious adverse event (RR: 0.70 CI: 0.27, 1.83), of which six were considered by the investigator to be possibly or probably drug related; 1 case of CHF in the rofecoxib group and 5 in the naproxen group (duodenal ulcer, drug overdose, CHF, gastric ulcer and bleeding gastric ulcer). There were no PUBs in the rofecoxib group and 3 in the naproxen (RR: 0.14 CI: 0.01, 2.77). There were similar rates of reno‐vascular events, although numerically more patients discontinued due to hypertension (2/471 vs 0/473 RR: 5.02 CI: 0.24, 104.31) and peripheral/lower extremity oedema (3/471 vs 0/473 RR: 7.03 CI: 0.36, 135.72).
The ADVANTAGE study publication does not present any rates of adverse events other than CV Advantage 2000. There were 5 patients in the rofecoxib group who experienced an MI compared to 1 in the naproxen group (RR: 4.98 CI: 0.58, 42.57). The overall rates of thrombotic events were similar 10/2785 vs. 7/2772 (RR: 1.42 CI: 0.54, 3.73) but more patients experienced a stroke in the naproxen group 0/2785 vs. 6/2772 (RR: 0.08 CI 0.00, 1.36). Numerically more patients in the rofecoxib group experienced hypertension (RR: 1.22 CI: 0.89, 1.68). Subgroup analyses of patients with pre‐existing hypertension indicated that the incidence of CV adverse events was higher in these patients but the difference was not statistically significant.
The overall withdrawals due to adverse events were similar 757/2785 vs. 788/2772 (RR: 0.96 CI: 0.86, 1.10), as were the number of patients withdrawing due to laboratory test adverse events 11/2799 vs 5/2787 (RR: 2.19 CI: 0.76, 6.29). The rofecoxib group experienced fewer discontinuations due to GI adverse events; the survival curve separated at 3 weeks and there were statistically significant differences over whole course of study (RR: 0.74; 95% CI: 0.60, 0.92). The cumulative incidence of concomitant GI medication use was statistically significantly lower in the rofecoxib group both at six weeks (RR: 0.80 CI: 0.66, 0.97) and twelve weeks (RR: 0.81 CI: 0.69, 0.95). There were 2 PUBs reported in the rofecoxib group compared to 9 in the naproxen group (RR: 0.22 CI 0.05, 1.02), although it must be borne in mind that patients could take concomitant GI protective medications (PPI, antacids or H2blockers). An abstract presented at the ACR conference (New Orleans 2002) stated that there were 6 PUBs in the rofecoxib group compared to 12 in the naproxen and that respectively 2 and 9 were confirmed by an independent adjudication committee (Geba 2002). In the 15% of patients who had previously stopped NSAID therapy because of GI intolerance, the results of discontinuation due to GI adverse events also favoured rofecoxib (reported RR: 0.53; 95% CI: 0.34, 0.84).
Sub‐group analyses were conducted for ADVANTAGE patients receiving low dose aspirin Advantage 2000. The authors however state that it was not powered to be conclusive. As with the entire study population, there were fewer withdrawals due to GI events in patients taking rofecoxib but the difference was not statistically significant 17/352 vs. 31/367 (RR: 0.57 CI: 0.32, 1.01). An analysis of interaction by treatment with low‐dose aspirin was also undertaken that indicated no statistically significant modification of effect (p=0.378), which the authors state indicated a consistent risk reduction regardless of aspirin use. Again, there is no analysis of whether these patients were also taking concomitant GI medication but the authors report that there was no statistically significant difference in the reduction in concomitant use of GI medication in the aspirin patients (RR: 0.82 CI: 0.57, 1.18).
The CRESCENT study reported that "at week 6, rofecoxib induced a significant increase in 24‐hour systolic blood pressure (+4.2 mm Hg), whereas celecoxib and naproxen did not (‐0.1 and ‐0.8 mmHg respectively; p=0.005). Week 12 results were comparable to week 6." No further data were presented CRESCENT (Sowers).
5. ROFECOXIB VERSUS NABUMETONE Three 6‐week double‐blind, placebo‐controlled RCTs were identified that compared rofecoxib to nabumetone. Two of the RCTs were identical in design; whilst one has only been published in abstract form Geba (MSD 090), the second has recently been published in full Kivitz 2004(MSD 085). The two RCTs compared rofecoxib 12.5mg daily to nabumetone 1000mg daily and enrolled 978 and 1042 patients with OA of the knee aged 40 or over.
The third RCT was conducted in 341 patients aged 80 years or older (mean age 83) and over six weeks compared rofecoxib 12.5mg and 25mg to nabumetone 1500mg and placebo Truitt 2001(MSD 058). Although the publication does not state that it was double‐blind, double dummies were used and safety evaluations were undertaken by a blinded assessor.
5.1 EFFICACY The RCT conducted in elderly patients indicated similar responses across the patient groups, with no statistically significant differences reported between the active treatment groups in any of the outcome measures. A time‐course analysis of changes indicated that the treatment effects were generally at a constant level Truitt 2001(MSD 058).
With respect to the two six‐week RCTs, the only efficacy results that could be pooled were the number of patients reporting good or excellent response, which was greater in the rofecoxib 12.5mg group (RR: 1.17 CI: 1.05, 1.29).
MSD 085 indicated that patients receiving rofecoxib were more likely to have a good or excellent response over the 6 weeks as assessed by the patient global response to therapy Kivitz 2004(MSD 085). Sensitivity analysis examining the numbers of individuals completing the study rather than using the modified ITT analysis indicated the same. Sub‐group analysis conducted in patients over the age of 65 indicated this was also the case, and the results were compatible with the overall cohort (treatment by age interaction p=0.893). Results were however presented as an average over the whole treatment period with no endpoint results given. Both active groups had mean increases from baseline in each QoL domain on the SF36, which were significant, compared to placebo, for six of the eight domains (not physical function and mental health). Fewer patients taking rofecoxib withdrew due to lack of efficacy (RR: 0.64 CI: 0.41, 0.98).
The publication also presents results on onset of efficacy although both actives were reported to be quicker than placebo, no statistical comparison between rofecoxib and nabumetone was presented. The results also should be treated with caution as this assessment was initiated after the trial had started and was only used in 55.1% of patients. The publication also reported median time to first report of good or excellent PGART response, which was 2 days in the rofecoxib group compared to 4 in the nabumetone (comparison p=0.02) and greater than 5 in the placebo. Overall similar number of patients used paracetamol and the average number of tablets taken was also comparable. The interpretation of the secondary endpoints is uncertain as although there was a statistically significant difference in the walking pain score in favour of rofecoxib, it was based on average of week 2, 4 and 6 scores rather than the endpoint. Again onset of efficacy results were presented, but were only collected in 55.1% of the total cohort. The average onset over the 6 days was statistically significantly greater in the rofecoxib compared to the nabumetone.
The abstract of MSD 090 does not provide sufficient data for analysis of the results Geba (MSD 090). The authors report that rofecoxib was superior to nabumetone in the treatment of OA over six weeks as determined by the PGART and 'relief of pain walking on a flat surface'. They also note that rofecoxib had a more rapid onset of efficacy over the first six days compared to nabumetone. A pooled analysis of the results of the two studies has been presented as posters at conferences.
5.2 SAFETY Pooled analysis of the results from the 6‐week studies, indicated no difference in the rates of withdrawals due to adverse events (RR: 1.24 CI: 0.84, 1.84), total adverse events (RR: 1.09 CI: 0.99, 1.20), serious adverse events (RR: 1.28 CI: 0.57, 2.89), lower extremity oedema (RR: 1.41 CI: 0.72, 2.77) and hypertension (RR: 1.46 CI: 0.53, 4.12). The Kivitz report also states that no patient experienced a gastrointestinal perforation or ulceration Kivitz 2004(MSD 085). Two lower GI bleeds (anorectal haemorrhage and lower GI haemorrhage) occurred but neither was attributed to a study drug. The authors also report that concomitant aspirin use did not appear to increase the rates of adverse events but no sub‐group data were presented.
The Truitt report states that there were no gastro‐duodenal perforations, ulcers or haemorrhages in the study Truitt 2001(MSD 058). There were no data given for either total number of adverse events or total GI adverse events. Conflicting statements state that one or two cases of congestive heart failure occurred in patients taking nabumetone. There were no significant differences in the rates of lower extremity oedema (both overall, and those attributed to drug treatment).
6. ROFECOXIB VERSUS DICLOFENAC/ MISOPROSTOL One RCT was identified that compared the 6‐week tolerability profile of rofecoxib 12.5mg once daily with twice daily diclofenac 50mg/misoprostol 200mcg. The trial enrolled 483 patients aged 40 years or over with OA. Double‐dummy placebo was used to maintain blinding Acevedo 2001(MSD902).
5.1 EFFICACY There were no significant differences in the 6‐week change from baseline of the global disease status as measured by the patient or the investigator Acevedo 2001(MSD902). One patient in each group withdrew due to lack of efficacy.
5.2 SAFETY At 6 weeks in the rofecoxib group there were significantly fewer GI adverse events (70/242 vs. 117/241 RR: 0.60 CI: 0.47, 0.75) and significantly fewer patients with one or more episodes of diarrhoea (15/242 vs. 48/241 RR: 0.31 CI: 0.18, 0.54) Acevedo 2001(MSD902). The cumulative incidence of diarrhoea over the whole study was greater in the Arthrotec group (RR 0.29 CI: 0.16, 0.51). Rates of abdominal pain were numerically lower in the rofecoxib group (21/242 vs. 32/241) RR: 0.65 CI 0.39, 1.10). The overall rates of adverse events were rofecoxib 128/242 vs. Arthrotec 176/241 (RR: 0.72 CI: 0.63, 0.83) and significantly more people in the Arthrotec group withdrew due to adverse events 10/242 v 22/241 (RR: 0.45 95% CI: 0.2, 0.9). The proportion of people experiencing serious adverse events was similar across the two groups; 3/242 vs. 4/241 (RR: 0.75 CI 0.17, 3.30). Five individuals in each group experienced lower extremity oedema and the rates of cardiovascular events were 14/242 in the rofecoxib group and 10/241 in the Arthrotec group (RR: 1.39 CI: 0.63, 3.08). The authors reported that for all safety outcomes, patients with and without a positive GI history (previous GI ulcer or bleed) responded similarly to treatment, as indicated by a non‐significant treatment by stratum interactions. The paper did not report any PUBs.
7. ROFECOXIB VERSUS NIMESULIDE Two double‐blind RCTs were identified that compared rofecoxib to nimesulide in OA of the knee. A Venezuelan RCT compared 30 days treatment with 25mg rofecoxib daily to 300mg nimesulide (slow release formulation) in 114 patients aged over 50 years Herrera 2003. The number of patients in each assessment is not however clear. The second Italian study enrolled 30 patients and had a cross‐over design with patients sequentially receiving 7 days treatment with 25mg rofecoxib, 200mg celecoxib and 100mg nimesulide Bianchi 2003. The order in which they received the drugs was determined by randomisation. However, the paper does not report any wash‐out period between the study arms, which may have compromised the results; although no differences were observed in any of the baseline measurements in each period. For additional pain relief, patients were also allowed 500mg paracetamol 12 hours after the test drug.
Due to the differences in the dose of nimesulide used, the methodology and the timings of data collection, no meta‐analysis of efficacy or safety data could be performed. The results of individual studies are therefore discussed below.
7.1 EFFICACY The Venezuelan study indicated that there was no statistically significant difference between the groups after 15 days, although the nimesulide group had a more favourable response after 30 days of treatment (p=0.009) using the WOMAC scale Herrera 2003. Similar differences were found with the VAS pain score and the evaluation of response by the investigator (RR: 0.77 CI: 0.61, 0.97) and patients (RR: 0.83 CI: 0.67, 1.03). Analgesic rescue medication was similar in both groups. The nimesulide had a faster onset of action (15 minutes versus 45 minutes), which could be attributed to the formulation. Two patients in each group withdrew due to LOE (RR: 1.00 CI: 0.15, 6.86).
The Italian cross‐over study presented data in graphical form only, but reported that as measured by the patient on a 100mm VAS, nimesulide 100mg showed a significantly greater analgesic effect over the first 3 hours of treatment (p<0.001) and at the end of the first and seventh day of treatment (p<0.001) than either rofecoxib 25mg or celecoxib 200mg Bianchi 2003. Nimesulide also had a significantly faster onset of action than either rofecoxib or celecoxib on day 1 and 7, with the reduction in pain from baseline reaching significance after 15 minutes compared to 60 minutes. The pain associated with walking 12 hours after each dose was taken was significantly less in the nimesulide group on day 1 but not on day 7. However, more patients reported paracetamol use at least once during the study when taking nimesulide; 6 patients versus 4 taking paracetamol when taking rofecoxib and celecoxib. Most data were presented in graphical form only apart from the percentage of patients reporting good or very good analgesic efficacy, which was 16/30 in the nimesulide group and 15/30 in the rofecoxib group (RR: 0.94 CI: 0.57, 1.53).
The pooled relative risk for the number of patients taking additional paracetamol was not significantly different between rofecoxib and nimesulide (RR: 0.95 CI: 0.54,1.68).
7.2 SAFETY The Venezuelan study reported that only three adverse events occurred, none of which required withdrawal from treatment; one patient experienced heartburn and dizziness in the nimesulide group and two patients developed pyresis in the rofecoxib group Herrera 2003. Only the patient global assessment of tolerability was reported in the Italian study; when the patients were receiving rofecoxib or nimesulide, 23/30 reported tolerability as being good or excellent compared to 23/30 when they were receiving nimesulide Bianchi 2003. One patient reported poor tolerability when taking nimesulide. The report states that no patients withdrew due to serious adverse events.
8. ROFECOXIB versus CELECOXIB A total of nine double‐blind RCTs were identified that compared rofecoxib 25mg daily to celecoxib 200mg daily (i.e. higher recommended therapeutic dose rofecoxib vs. lower recommended therapeutic dose celecoxib). Seven of the nine RCTs were 6‐week studies (not Bianchi 2003; CRESCENT (Sowers)), which facilitated meta‐analysis. Other comparators included in the trials were rofecoxib 12.5mg (VACT; VACT 2) nimesulide (Bianchi 2003)naproxen (CRESCENT (Sowers)), placebo (Gibofsky 2003; McKenna 2000; Schnitzer 2001) and paracetamol (VACT and VACT 2).
Five of the nine were sponsored by the manufacturers of celecoxib (Pharmacia/Pfizer); four have been published in full Gibofsky 2003; McKenna 2000; SUCCESS VI; SUCCESS VII and one in abstract form CRESCENT (Sowers). Three RCTs; VACT; VACT 2; Schnitzer 2001 were sponsored by the manufacturers of rofecoxib (MSD) and only one has been published in full (VACT). One of the RCTs did not acknowledge any pharmaceutical company sponsorship Bianchi 2003. It had a cross‐over design and compared three seven day periods of treatment with rofecoxib, celecoxib and nimesulide.
Three of the Pharmacia/Pfizer studies were specifically designed to examine cardio‐renal effects and therefore did not collect efficacy data; two have been published in full SUCCESS VI, SUCCESS VII and one only in abstract form CRESCENT (Sowers).
8.1 EFFICACY Pooled analysis of withdrawals due to lack of efficacy found no statistically significant difference between rofecoxib 25mg and celecoxib 200mg after 6 weeks (RR: 0.76 CI: 0.47, 1.24). The VACT trial also found no statistically significant differences between rofecoxib 12.5mg and celecoxib 200mg. Due to lack of reported similar outcome data, no pooling of WOMAC data was possible other than the function subscale results reported in Gibofsky and VACT (RR: 0.12 CI: ‐2.41, 2.66). The VACT trial found rofecoxib to be statistically significant superior on the pain and stiffness subscales and the rest‐pain and night‐pain at the 25mg dose, but not at the 12.5mg dose.
Data on the patient global response to therapy could be pooled, which indicated more patients on 25mg rofecoxib had a good or excellent improvement (RR: 1.14 CI: 1.05, 1.24), but again this difference can be attributed to the higher therapeutic dose used. Pooled data from three trials indicated no difference in the use of paracetamol rescue (RR: 1.07 CI: 0.65, 1.75).
The abstract for the CRESCENT (Sowers) study reported that the "arthritis assessments demonstrated that changes in total WOMAC were similar for all 3 treatments at week 6 (p=0.4) and week 12 (p=0.39)". No data were provided.
8.2 SAFETY Meta‐analysis of safety data could be performed on the number of withdrawals and the incidence of adverse events.
There were no differences in the either the total number of withdrawals (RR: 0.93 CI: 0.76, 1.14) or the number of withdrawals due to adverse events (RR: 1.03 CI: 0.77, 1.39) between 25mg rofecoxib and 200mg celecoxib. Data from two trials on withdrawals due to cardio‐renal adverse effects did not indicate any difference (RR: 1.33, CI: 0.58, 3.07) and neither the SUCCESS VI or Schnitzer 2001 reported any significant difference in the rates of individual withdrawals due to specific cardiovascular events. Only McKenna 2000 reported the number of withdrawals due to GI events (RR: 4.27 CI: 0.49, 37.12).
The total incidence of adverse effects was similar in the rofecoxib 25mg group and the celecoxib 200mg group (RR:1.04 CI: 0.95, 1.14). There were no statistically significant differences in the rates of serious adverse events (RR: 3.51, CI: 0.73, 16.84)
Very few studies reported on the rates of GI events; there were more GI events in the rofecoxib 25mg group in McKenna 2000 (RR: 3.05 CI: 1.39, 6.68). Pooling was possible for the incidence of diarrhoea (RR: 0.79, CI: 0.40, 1.57) and dyspepsia (RR: 1.24 CI: 0.82, 1.89).
The pooled data indicated more cardio‐renal effects in the rofecoxib 25mg group: oedema (RR: 1.77 CI: 1.27, 2.47), systolic blood pressure increase (RR: 1.54 CI:1.24, 1.90) [NB heterogeneous]. The results were non‐significant for diastolic blood pressure increase (RR: 1.55, CI: 0.91, 2.63), CHF (RR: 3.06 CI: 0.73, 12.72), and hypertension (RR: 3.51 CI: 0.73, 16.84). SUCCESS VI also reported a significantly greater increase in systolic blood pressure from baseline (WMD 3.30 CI: 1.89, 4.71). Similarly, CRESCENT (Sowers) reported "at week 6, rofecoxib induced a significant increase in 24‐hour systolic blood pressure (+4.2 mm Hg), whereas celecoxib did not (‐0.1 mmHg p=0.005). Week 12 results were comparable to week 6. " No further data were presented.
The difference between rofecoxib and celecoxib in the numbers of patients experiencing clinically significant systolic blood pressure and oedema was not evident in studies conducted in standard populations Gibofsky 2003; VACT; Schnitzer 2001.
9. ROFECOXIB versus PARACETAMOL Two RCTs (VACT 1 and VACT 2) were identified that compared rofecoxib 12.5mg or 25mg per day to paracetamol 4g/day in a total of 1960 patients. VACT 1 (382 patients) was the pilot study and to date VACT 2 (1579 patients) has only been published in abstract form. No meta‐analysis was possible therefore the results of the two trials are discussed individually.
9.1 EFFICACY In VACT 1 after 6 weeks treatment, there were no statistically significant differences between rofecoxib 12.5mg and paracetamol. However rofecoxib 25mg showed greater efficacy than paracetamol as measured by all WOMAC scales and composite subscales. The Patient Global Response to therapy also indicated that more patients taking rofecoxib (both 12.5 and 25mg per day) had a good or excellent response (RR: 1.44; CI: 1.06, 1.97) and (RR: 1.54; CI: 1.14, 2.08) respectively. More patients in the paracetamol group withdrew than either the rofecoxib groups, which was primarily driven by withdrawals due to lack of efficacy 12.5 mg (RR 0.49 CI: 0.22, 1.09) and 25mg (RR 0.49 CI: 0.22, 1.10). The publication also reported results in the first 6 days; both rofecoxib doses achieved statistically significant differences compared to paracetamol on WOMAC scales (night pain, pain on walking, rest pain and morning stiffness). As VACT 2 has only been published in abstract form, very few data are available. It reported that "improvements in WOMAC subscales over 6 weeks were significantly greater with all coxibs versus ACET (paracetamol) p‐values < or =0.01)". Geba (MSD 090)
9.2 SAFETY No safety data for VACT 2 are available. No patient enrolled in VACT 1 experienced either a PUB or a MI during the trial. However, 2 patients withdrew due to oedema; 1 in the rofecoxib 25mg group and 1 receiving celecoxib. Similar numbers of patients withdrew due to adverse events and there were no statistically significant differences in the rates of individual adverse events. Overall rates of GI adverse events were not reported. Similarly the overall rates of serious adverse events were not reported in the main publication, but the abstract presented at EULAR indicated that 2 patients in each rofecoxib group (12.5 mg and 25mg) experienced a serious adverse event compared to none in the paracetamol group (RR 4.90 CI: 0.24, 100.66).
10. ROFECOXIB DOSE RESPONSE Twelve RCTs included comparisons from different doses of rofecoxib, therefore some meta‐analysis could be undertaken Cannon 2000(MSD 035); Day 2000 (MSD 040); Ehrich 1999 (pilot); Ehrich 2001(MSD 029); Hawkey 2000(MSD 045); Laine 1999 (MSD 044); Moskowitz 2003; Saag 1998 (MSD 033); Saag 2000 (MSD 034); Truitt 2001(MSD 058); VACT; VACT 2.
10.1 EFFICACY
Pooled data from six trials indicated that there were fewer withdrawals due to lack of efficacy (LOE) in the 25mg group but the result was not significant (RR 0.66 CI: 0.42, 1.03).
10.2 SAFETY Rates of adverse events and withdrawals due to adverse events appeared similar across the doses examined. The only statistically significant result was that after one year more patients in the 25mg group had experienced diarrhoea compared to those in the 12.5mg group (RR: 1.74; CI: 1.00, 3.02).
Examination of the two endoscopic studies Hawkey 2000(MSD 045); Laine 1999 (MSD 044) indicated that more people receiving the 50mg dose experienced ulcers compared to those receiving 25mg, although the result was significant only for ulcers of diameter 5mm or more; 3mm (RR 1.67 CI: 0.94, 2.95); 5mm (RR 2.48 CI: 1.21, 5.11); gastric (RR 1.55 CI: 0.80, 3.01) and duodenal (RR 2.27 CI: 0.80, 6.48).
Discussion
In October 2004, Merck voluntarily withdrew rofecoxib after analysis of an ongoing trial of the use of rofecoxib in 2600 patients for the prevention of adenomatous colon polyps indicated that 3.5% of the patients in the rofecoxib group experienced a myocardial infarction or stroke compared to 1.9% of the patients assigned to placebo (p<0.001).
The worldwide withdrawal of rofecoxib was the culmination of growing concern over the adverse renovascular effects of rofecoxib that began after the 1999 publication of the 'Vioxx Gastrointestinal Outcomes Research (VIGOR) trial Bombardier 2000. VIGOR enrolled 658 patients with rheumatoid arthritis and the results indicated that patients receiving rofecoxib were more at risk of experiencing a myocardial infarction than those receiving naproxen. There was much debate as to whether this was a result of detrimental effects of rofecoxib or an aspirin‐like cardio‐protective effect of naproxen Garner 2004 . The ensuing controversy prompted a number of pooled analyses and epidemiological studies that came to various conclusions Gertz 2002; Konstam 2001; Reicin 2002; Mamdani 2002; Mamdani 2004; Weir 2003; Ray 2002; Solomon 2004; Layton 2003.
The FDA Arthritis Advisory Committee met to discuss the cardiovascular risks of rofecoxib in February 2001 and requested that a warning be included in the information for patients. A subsequent large epidemiological study was sponsored Mamdani 2002Mamdani 2004. In July 2002, the European regulatory authority (EMEA), undertook a review of the safety of the five then available coxibs (celecoxib, etoricoxib, parecoxib, rofecoxib and valdecoxib), which was completed in late 2003. It broadly concluded that the "the benefit/risk balance of medicinal products containing celecoxib, etoricoxib, parecoxib, rofecoxib and valdecoxib remains favourable" and that "available data indicated that a significant and consistent gastrointestinal benefit of Cox‐2 inhibitors compared with conventional NSAIDs had not been demonstrated". It was also recommended that each Summary of Product characteristics should be updated with warnings relating to the GI safety, the risk of myocardial infarction and the observed or potential serious skin effects and hypersensitivity. A further review of the safety, prompted by the withdrawal of rofecoxib, is ongoing at the time this Cochrane review was written.
Although rofecoxib has been withdrawn, there is much ongoing debate as to whether the adverse cardio‐vascular effects are specific to rofecoxib or whether it is a class effect. This requires an understanding of the pharmacology of the individual drugs and the causes of the adverse events associated with all NSAIDs. In broad terms, the toxicity of NSAIDs is variable amongst patients and drugs and it tends to be dose related and associated with variation in the mode of action, absorption, distribution and metabolism. It is accepted that NSAID inhibition of the prostaglandin pathway causes alterations in renal function. A number of mechanisms have been suggested including salt and water retention, increased total peripheral vascular resistance due to inhibition of PGE2 and PGI2, and increased endothelin‐1 secretion. The most commonly reported renal effect is fluid retention and it is estimated that overall approximately 5% of individuals taking NSAIDs will have clinically detectable fluid retention Whelton 1991. A number of studies have also examined the effect of NSAIDs on blood pressure and blood pressure control in hypertensives. It has been estimated that NSAID treatment increases blood pressure by 3‐5mmHg, but there are variations amongst individual NSAIDs, with drugs with an increased half‐life presenting an increased risk .
Although the mechanism by which renal function is affected is not fully understood, research has indicated that Cox plays a role. Although it was thought initially that Cox II was produced only as a result of inflammation, further research indicated that under normal circumstances it is found in the kidney and plays and important role in maintaining renal haemodynamics and the regulation of sodium and water excretion. Inhibition of Cox II has been shown to cause sodium retention, hyperkaliemia and water intoxication. Therefore whilst selective Cox II inhibition reduces the incidence of GI events (which would be caused by Cox I inhibition) because it plays a role in reducing aggregation of platelets, there is a theoretical possibility that the resultant suppression of prostacylin production and unopposed thromboxane production, leads to an increases the risk of cardiovascular thrombotic events. Therefore the risk‐benefit profile of individual NSAIDs will depend on both the relative Cox I to Cox II inhibition and the absolute inhibition of Cox I.
A number of studies have examined the Cox inhibitory profiles of individual NSAIDs using surrogate markers Van Hecken 2000; Simon 1996; Glaser 1995; Kawai 1998; Reindeau 1997; Warner 1999; Brooks 1999. The findings of individual studies vary, which can be attributed to differences in the experimental methodology; this makes comparisons and the resultant 'rankings' difficult to interpret. Whilst most studies concentrated on the relative inhibitory activity against Cox I and II, some examined absolute levels of inhibition. Warner et al separated rofecoxib into the category of drug that strongly inhibited Cox II with weak activity against Cox I (>50‐fold Cox II selective), whilst other Cox II selective agents (celecoxib, etodolac, meloxicam and nimesulide) were classed as compounds that were capable of producing full inhibition of Cox I and Cox II with preference toward Cox II (5 to 50 fold Cox II selective) Warner 1999. The authors also stressed that because all of the drugs in this latter group are capable of inhibition of Cox I, therefore increasing dose could increase GI toxicity Warner 1999.
With respect to the discussion of the findings of this systematic review, it is worthwhile noting that meta‐analysis was hampered by the inadequate reporting of outcomes in some trials. Of particular concern, in drugs that are purported to have GI benefits, is the absence of GI event data. Across the studies, a wide range of efficacy outcome measures were used, and the lack of standardisation of outcome assessment reporting (i.e. pre‐ and post‐treatment scores, change with treatment and percentage change with treatment) and inadequacy of reporting of outcomes (i.e. measure of variance was often not provided), meant that in many instances, it was not possible to statistically pool efficacy results. The focus of the discussions in the publications also tended to be on the statistical significance of the results rather than on the clinical significance. When interpreting the results it must be borne in mind that it has been estimated that moderate improvement in OA is defined as a 10‐20 point reduction on a 0‐100 interval scale Ehrich 2000.
In this review the data for different doses of drugs and for different types of NSAID in the comparator arm have been separated, as there is evidence to suggest that individual NSAIDs have different toxicity profiles. Meta‐analyses of NSAID associated toxicity have demonstrated that low dose ibuprofen carries the lowest risk of GI complications with comparative relative risks of 2 for fenoprofen, aspirin and diclofenac and 2‐3 for sulindac, diflusinal, naproxen, indomethacin and tolmetin and above 3 by piroxicam, ketoprofen and azopropazone Henry 1996. Another study conducted using the GPRD database found that ibuprofen again was associated with the lowest relative risk of upper GI bleeding 2.9 (95% CI: 1.7, 5.0) with naproxen 3.1 (95% CI:1.7, 5.9) and diclofenac 3.9 (95% CI: 2.3, 6.5) Lanes 2000.
The use of different doses may similarly affect the outcomes of comparisons and they have therefore been considered separately. Epidemiological studies have shown that GI toxicity varies by a factor of 3 to 10 over the ranges of recommended doses, depending on the NSAID under investigation Lanes 2000; Langman 1994. High doses are more toxic than lower doses with the odds ratio for NSAID associated ulcer complications ranging from 2.5 on low to 8.5 on high Langman 1994 ibuprofen and indomethacin, independent of duration of exposure Lanes 2000.
As expected, in the placebo‐controlled trials, rofecoxib showed consistently superior efficacy to placebo and higher doses were effective in more people than lower doses. Rofecoxib in general caused more adverse events than placebo, although there was a lot of variability in the results of individual trials and some of the results were not statistically significant. The rates of overall GI events were not well recorded, but in general the risk of symptoms was not statistically different, although one trial reported rofecoxib 25mg to cause more GI events Kivitz 2004(MSD 085) (RR 3.39 CI: 1.47, 7.84). Only two PUBs were reported in the trials; one in a rofecoxib group and one in a placebo group. The reporting of serious events varied considerably between the trials; meta‐analysis of data from four trials using a 12.5mg dose indicated an increased risk of serious adverse events (RR 3.95 CI: 1.05, 14.63). The reno‐vascular events were evident, but as previously mentioned are common to all NSAIDs; few trials reported such data. Rofecoxib (25mg) caused statistically significantly more patients with an increase in systolic blood pressure after 6 weeks (RR 2.89 CI: 1.17, 7.14) and the 12.5 mg dose patients experienced more lower‐ extremity oedema (RR 2.40 CI: 1.05, 5.48). There was heterogeneity in the results of the endoscopic studies; with one study consistently showing more ulcers in the placebo group Laine 1999 (MSD 044) and one in the rofecoxib group Hawkey 2000(MSD 045). Dose comparisons indicated that rofecoxib 50mg caused more endoscopic ulcers than rofecoxib 25mg and additional analyses indicated that there was an increased risk of gastric ulcers compared to duodenal. Very few PUBs were reported.
There were no consistent differences in efficacy between rofecoxib and any of the comparators, including celecoxib. Although there were some statistically significant results, in general these could be attributed to the dosages of the drugs that were compared. For example rofecoxib 25mg was found to be more effective than paracetamol 4g/day, but 12.5mg rofecoxib was not.
With respect to GI symptoms, considering this is the key benefit of these drugs, it was surprising that very few of the trials reported event data to allow adequate consideration of the results. The only statistically significant results were that rofecoxib caused less GI pain than diclofenac in two RCTs. Naproxen, the most GI toxic of the NSAID comparators, caused more withdrawals due to GI events, total GI events and fewer PUBS, and fewer patients used concomitant GI medication. There was insufficient data presented in the publications of the trials that compared rofecoxib to nimesulide or nabumetone to enable any discussion. Rofecoxib 25mg caused more withdrawals due to GI events (RR 4.27 CI: 0.49, 37.12) and GI events (RR 3.05 CI 1.39, 6.68) than 200mg celecoxib after 6 weeks, but this comparison was based on high dose rofecoxib versus low dose celecoxib. Rofecoxib caused less diarrhoea than misoprostol/diclofenac, but again this is to be expected as diarrhoea is a common side‐effect of misoprostol Acevedo 2001(MSD902). The two endoscopic trials indicated that rofecoxib 25mg and 50 mg was associated with statistically significant fewer gastric ulcers than ibuprofen, and 25mg rofecoxib caused fewer duodenal ulcers Hawkey 2000(MSD 045); Laine 1999 (MSD 044). Similarly rofecoxib was found to cause fewer erosions. In interpreting the data from these endoscopic studies, consideration must be given to the fact that the link between endoscopically detected ulcers and clinical symptoms has not been fully described and gastrointestinal symptoms are often poorly correlated with endoscopic findings Singh 1996; Larkai 1989.
Analysis of other adverse event data found that there was no statistically significant difference in the number of patients experiencing an adverse event between rofecoxib and any other active comparator, other than Arthrotec, which as previously mentioned is associated with diarrhoea. Again only a few of the trials reported this outcome. There were more withdrawals due to adverse events compared to placebo and 50mg rofecoxib caused more than 25mg. Rofecoxib patients had fewer adverse events than diclofenac after one year and fewer than ibuprofen at 16 weeks. Fewer trials reported on the number of serious adverse events, and this outcome was not reported in any of the diclofenac, ibuprofen or nimesulide comparisons. As expected there were more in the placebo trials, although it was only significant at 12.5mg dose. There were no difference in the reported rates of serious adverse events of rofecoxib compared to naproxen, nabumetone, paracetamol and celecoxib.
Four studies were identified that specifically examined the cardiorenal safety of rofecoxib; three were comparisons of high dose rofecoxib (25mg) and low dose celecoxib (200mg) and were sponsored by Pharmacia/Pfizer. The fourth study did not acknowledge any sponsorship and examined rofecoxib vs. diclofenac or AMG in elderly patients Niccoli 2002. The CRESCENT (Sowers) study examined 24‐hour ambulatory blood pressure in treated hypertensive patients with OA and type II diabetes. Results are only available in abstract form; "at week 6, rofecoxib induced a significant increase in 24‐hour systolic blood pressure (+4.2 mm Hg), whereas celecoxib and naproxen did not (‐0.1 mmHg and ‐0.8mmHg p=0.005). Week 12 results were comparable to week 6". No further data were presented. The two SUCCESS trials were also conducted in older hypertensive OA patients; clinically significant systolic blood pressure increase (more than 20mmHg) occurred in 83/960 of patients taking celecoxib and 147/942 patients taking rofecoxib (RR 1.81 CI: 1.40, 2.33); this difference was statistically significant SUCCESS VI; SUCCESS VII. Increased rates of oedema also occurred and it was more common in women. There was no statistically significant difference in the numbers of patients experiencing diastolic BP change. Sub‐group analysis indicated these changes occurred in patients taking angiotensin converting enzyme inhibitors and beta‐blocker therapy (with or without diuretics), but not those taking calcium channel antagonists or diuretic monotherapy. The difference between rofecoxib and celecoxib in the numbers of patients experiencing clinically significant systolic blood pressure and oedema was not evident in studies conducted in standard populations (Gibofsky 2003; VACT; Schnitzer 2001). There is some question of the treatment of dropouts in the independent study Niccoli 2002, but again indicated that after 2 weeks treatment, compared to diclofenac rofecoxib 25mg daily caused an increase in systolic blood pressure (mean 10mm Hg (SD 11.81) vs 2mmHg (SD 7.45) (WMD 8.00 CI 3.00, 13.00) and diastolic blood pressure mean 9.00 mmHg (SD 7.66 vs 2.00 mmHg (SD6.23) (WMD 8.00 CI: 4.47, 11.53). More patients also experienced oedema (10/34 vs 0/31 (RR 19.20 CI: 1.17, 314.55), hypertension 8/34 vs 0/31(RR 15.54 CI: 0.93, 258. 58) and weight gain 10/34 vs 0/31(RR 19.20 CI: 1.17, 314.55). In the other RCTs that reported cardiorenal adverse events, whilst in some cases there was a trend towards more cardio‐renal adverse events, there were no significant differences between rofecoxib and an active comparator in any of the individual studies or pooled analyses. This held true for both the smaller studies and those that included up to 5000 patients.
A key question mark remains over the risk‐benefit ratio of the coxibs. Whilst this review provides important information on the relative risks of adverse events, it must be acknowledged that RCTs are not sufficient on their own to provide information on the risk of rare adverse events. The likelihood of detecting an adverse drug reaction (ADR) is dependent on its severity, frequency and occurrence relative to exposure. Although the RCT is the gold‐standard of clinical trial designs, the numbers of patients used and the short duration mean that they will only identify the most common and acutely occurring ADRs within the specified subgroup of included patients. Many RCTs will not powered sufficiently to detect differences in rare events such PUBs, POBs and myocardial infarctions. Moreover, trial protocols exclude patients from 'at risk' groups which are not generalisable to the population who will inevitably be exposed to the drug (i.e. people with co‐morbidities). Although an exhaustive investigation of all adverse event data is outside the remit of this Cochrane review, a number of additional sources could be used to collate information on ADRs.
A number of such studies of rofecoxib have been conducted and the results have been conflicting and difficult to interpret because drug exposure and confounding factors will vary over the length of a long‐term observational study. The usefulness of the information derived from computerised databases is also highly dependent on the accuracy and completeness of data collection and entry, which needs to be rigorously controlled and monitored. The effect of 'channelling bias' must also be taken into account, whereby physicians are more likely to have prescribed Cox II selective drugs to higher risk patients, who are by definition at greater risk. Spontaneous reporting systems such as the Yellow Card system and the MedWatch system in the United States suffer from similar disadvantages in that the number of adverse events that are recorded are a function of the length of time that a drug has been on the market, the amount it is prescribed, the seriousness of the event and the attending publicity. Neither method can be used to calculate incidences or relative safety, as the size of exposed population is generally not known and must be estimated from prescription data.
Authors' conclusions
Implications for practice.
Rofecoxib was voluntarily withdrawn from global markets in October 2004 and therefore there are no implications for practice concerning its use. None the less when considering which NSAID to use, it must be borne in mind that the toxicity of NSAIDs is variable amongst patients and drugs, and it tends to be dose related and associated with variation in the mode of action, absorption, distribution and metabolism.
Implications for research.
There remains a number of questions over both the benefits and risks associated with Cox II selective agents and further work is ongoing. It is likely that this issue will not be resolved until research has enabled a fuller understanding of the complex mechanism by which the Cox system operates.
What's new
| Date | Event | Description |
|---|---|---|
| 19 May 2008 | Amended | Converted to new review format. CMSG ID C073‐R |
History
Review first published: Issue 1, 2005
| Date | Event | Description |
|---|---|---|
| 17 November 2004 | New citation required and conclusions have changed | Substantive amendment |
Data and analyses
Comparison 1. rofecoxib versus placebo.
| Outcome or subgroup title | No. of studies | No. of participants | Statistical method | Effect size |
|---|---|---|---|---|
| 1 ADVERSE EVENTS* | 13 | Risk Ratio (M‐H, Fixed, 95% CI) | Subtotals only | |
| 1.1 TOTAL 12.5mg 6 weeks | 3 | 1536 | Risk Ratio (M‐H, Fixed, 95% CI) | 1.15 [1.03, 1.29] |
| 1.2 TOTAL 25mg 6 weeks | 4 | 866 | Risk Ratio (M‐H, Fixed, 95% CI) | 1.32 [1.11, 1.56] |
| 1.3 TOTAL 25mg 18 weeks | 2 | 761 | Risk Ratio (M‐H, Fixed, 95% CI) | 1.05 [0.98, 1.14] |
| 1.4 TOTAL 50mg 18 weeks | 2 | 750 | Risk Ratio (M‐H, Fixed, 95% CI) | 1.07 [0.99, 1.15] |
| 1.5 TOTAL 125mg 6 weeks | 1 | 146 | Risk Ratio (M‐H, Fixed, 95% CI) | 1.28 [0.92, 1.77] |
| 1.7 aged >65: TOTAL 12.5mg 6 weeks | 1 | 632 | Risk Ratio (M‐H, Fixed, 95% CI) | 1.02 [0.85, 1.21] |
| 1.8 Serious 12.5mg 6 weeks | 3 | 1388 | Risk Ratio (M‐H, Fixed, 95% CI) | 3.95 [1.06, 14.63] |
| 1.9 Serious 25mg 6 weeks | 4 | 658 | Risk Ratio (M‐H, Fixed, 95% CI) | 0.47 [0.11, 2.08] |
| 1.10 Serious 125mg 6 weeks | 1 | 146 | Risk Ratio (M‐H, Fixed, 95% CI) | 6.81 [0.36, 129.61] |
| 1.11 GI 12.5mg 6 weeks | 1 | 632 | Risk Ratio (M‐H, Fixed, 95% CI) | 1.02 [0.55, 1.88] |
| 1.12 GI 25mg 6 weeks | 1 | 119 | Risk Ratio (M‐H, Fixed, 95% CI) | 3.39 [1.47, 7.84] |
| 1.13 Diarrhoea 12.5mg 6 weeks | 4 | 1408 | Risk Ratio (M‐H, Fixed, 95% CI) | 0.86 [0.52, 1.43] |
| 1.14 Diarrhoea 25mg 6 weeks | 6 | 1270 | Risk Ratio (M‐H, Fixed, 95% CI) | 1.22 [0.67, 2.22] |
| 1.15 Diarrhoea 25mg 18 weeks | 2 | 761 | Risk Ratio (M‐H, Fixed, 95% CI) | 1.31 [0.85, 2.02] |
| 1.16 Diarrhoea 50mg 18 weeks | 2 | 750 | Risk Ratio (M‐H, Fixed, 95% CI) | 1.16 [0.74, 1.82] |
| 1.17 Diarrhoea 125mg 6 weeks | 1 | 146 | Risk Ratio (M‐H, Fixed, 95% CI) | 1.46 [0.25, 8.48] |
| 1.18 Dyspepsia 12.5 mg 6 weeks | 2 | 1218 | Risk Ratio (M‐H, Fixed, 95% CI) | 1.00 [0.34, 2.90] |
| 1.19 Dyspepsia 25mg 6 weeks | 2 | 264 | Risk Ratio (M‐H, Fixed, 95% CI) | 1.18 [0.41, 3.37] |
| 1.20 Dyspepsia 125mg 6 weeks | 1 | 146 | Risk Ratio (M‐H, Fixed, 95% CI) | 1.95 [0.37, 10.30] |
| 1.21 PUBS 12.5mg 6 weeks | 5 | 1697 | Risk Ratio (M‐H, Fixed, 95% CI) | 0.0 [0.0, 0.0] |
| 1.22 PUBS 25mg 6 weeks | 6 | 1433 | Risk Ratio (M‐H, Fixed, 95% CI) | 0.17 [0.01, 4.12] |
| 1.23 PUBS 50mg 6 weeks | 1 | 242 | Risk Ratio (M‐H, Fixed, 95% CI) | 0.0 [0.0, 0.0] |
| 1.24 PUBS 125mg 6 weeks | 1 | 146 | Risk Ratio (M‐H, Fixed, 95% CI) | 2.92 [0.12, 70.52] |
| 1.29 Blood pressure increase 12.5mg 6 weeks | 1 | 586 | Risk Ratio (M‐H, Fixed, 95% CI) | 1.51 [0.06, 36.93] |
| 1.30 Hypertension 12.5 mg 6 weeks | 2 | 1218 | Risk Ratio (M‐H, Fixed, 95% CI) | 1.12 [0.35, 3.61] |
| 1.31 Hypertension 25mg 6 weeks | 1 | 286 | Risk Ratio (M‐H, Fixed, 95% CI) | 6.60 [0.38, 115.98] |
| 1.32 Systolic BP increase 25mg 6 weeks | 1 | 622 | Risk Ratio (M‐H, Fixed, 95% CI) | 2.89 [1.17, 7.14] |
| 1.33 Diastolic BP increase 25mg 6 weeks | 1 | 622 | Risk Ratio (M‐H, Fixed, 95% CI) | 1.39 [0.40, 4.81] |
| 1.34 MI 12.5mg 6 weeks | 1 | 632 | Risk Ratio (M‐H, Fixed, 95% CI) | 1.48 [0.06, 36.06] |
| 1.35 Headache 25mg 6 weeks | 2 | 264 | Risk Ratio (M‐H, Fixed, 95% CI) | 0.47 [0.20, 1.11] |
| 1.38 OEDEMA 12.5mg 6 weeks | 1 | 586 | Risk Ratio (M‐H, Fixed, 95% CI) | 0.50 [0.03, 7.99] |
| 1.39 OEDEMA 25mg 6 weeks | 2 | 431 | Risk Ratio (M‐H, Fixed, 95% CI) | 2.48 [0.65, 9.52] |
| 1.40 OEDEMA 125mg 6 weeks | 1 | 146 | Risk Ratio (M‐H, Fixed, 95% CI) | 8.76 [0.48, 159.83] |
| 1.41 Lower extremity oedema 12.5mg 6 weeks | 4 | 1676 | Risk Ratio (M‐H, Fixed, 95% CI) | 2.40 [1.05, 5.48] |
| 1.42 Lower extremity oedema 25mg 6 weeks | 3 | 549 | Risk Ratio (M‐H, Fixed, 95% CI) | 2.57 [0.79, 8.37] |
| 1.44 Lower extremity oedema 125mg 6 weeks | 1 | 146 | Risk Ratio (M‐H, Fixed, 95% CI) | 10.71 [0.60, 190.17] |
| 2 WITHDRAWALS* | 12 | Risk Ratio (M‐H, Fixed, 95% CI) | Subtotals only | |
| 2.1 TOTAL 12.5mg 6 weeks | 4 | 1408 | Risk Ratio (M‐H, Fixed, 95% CI) | 0.74 [0.62, 0.89] |
| 2.3 Total 25mg 6 weeks | 5 | 954 | Risk Ratio (M‐H, Fixed, 95% CI) | 0.45 [0.35, 0.58] |
| 2.5 TOTAL 25mg 18/24 weeks | 2 | 761 | Risk Ratio (M‐H, Fixed, 95% CI) | 1.10 [0.88, 1.38] |
| 2.6 TOTAL 50mg 18/24 weeks | 2 | 750 | Risk Ratio (M‐H, Fixed, 95% CI) | 1.27 [1.02, 1.58] |
| 2.8 Total 125mg 6 weeks | 1 | 146 | Risk Ratio (M‐H, Fixed, 95% CI) | 0.53 [0.33, 0.87] |
| 2.10 due to AE 5mg 6 weeks | 1 | 294 | Risk Ratio (M‐H, Fixed, 95% CI) | 2.92 [0.60, 14.23] |
| 2.11 due to AE 12.5mg 6/8 weeks | 6 | 2283 | Risk Ratio (M‐H, Fixed, 95% CI) | 2.18 [1.34, 3.55] |
| 2.12 due to AE 25mg 6 weeks | 7 | 1552 | Risk Ratio (M‐H, Fixed, 95% CI) | 1.56 [0.94, 2.59] |
| 2.13 due to AE 25mg 18/24 weeks | 2 | 761 | Risk Ratio (M‐H, Fixed, 95% CI) | 1.38 [0.81, 2.36] |
| 2.14 due to AE 50mg 6 weeks | 1 | 242 | Risk Ratio (M‐H, Fixed, 95% CI) | 3.74 [0.74, 18.88] |
| 2.15 due to AE 50mg 18/24 weeks | 2 | 750 | Risk Ratio (M‐H, Fixed, 95% CI) | 2.04 [1.24, 3.36] |
| 2.19 due to AE 125mg 6 weeks | 1 | 146 | Risk Ratio (M‐H, Fixed, 95% CI) | 1.78 [0.70, 4.57] |
| 2.35 due to CV AE 12.5 mg 6 weeks | 1 | 288 | Risk Ratio (M‐H, Fixed, 95% CI) | 0.32 [0.02, 4.97] |
| 2.36 due to CV AE 25 mg 6 weeks | 1 | 296 | Risk Ratio (M‐H, Fixed, 95% CI) | 0.61 [0.06, 6.60] |
| 2.39 due to LOE 5mg 6 weeks | 1 | 294 | Risk Ratio (M‐H, Fixed, 95% CI) | 0.52 [0.29, 0.93] |
| 2.40 due to LOE 12.5mg 6 weeks | 4 | 1065 | Risk Ratio (M‐H, Fixed, 95% CI) | 0.36 [0.24, 0.54] |
| 2.41 due to LOE 25mg 6 weeks | 8 | 2184 | Risk Ratio (M‐H, Fixed, 95% CI) | 0.24 [0.18, 0.32] |
| 2.42 due to LOE 25mg 18 weeks | 2 | 761 | Risk Ratio (M‐H, Fixed, 95% CI) | 0.49 [0.25, 0.97] |
| 2.43 due to LOE 50mg 6 weeks | 1 | 242 | Risk Ratio (M‐H, Fixed, 95% CI) | 0.16 [0.05, 0.51] |
| 2.44 due to LOE 50mg 18 weeks | 2 | 750 | Risk Ratio (M‐H, Fixed, 95% CI) | 0.30 [0.13, 0.68] |
| 2.45 due to LOE 125mg 6 weeks | 1 | 146 | Risk Ratio (M‐H, Fixed, 95% CI) | 0.05 [0.01, 0.34] |
| 2.46 due to GI AE 12.5 mg 6 weeks | 1 | 288 | Risk Ratio (M‐H, Fixed, 95% CI) | 0.79 [0.16, 3.97] |
| 2.47 due to GI AE 25 mg 6 weeks | 2 | 415 | Risk Ratio (M‐H, Fixed, 95% CI) | 2.32 [0.67, 8.05] |
| 2.49 due to hypertension | 1 | 622 | Risk Ratio (M‐H, Fixed, 95% CI) | 0.97 [0.04, 23.59] |
| 2.50 due to lower extremity oedema AE 12.5 mg 6 weeks | 1 | 288 | Risk Ratio (M‐H, Fixed, 95% CI) | 0.95 [0.04, 23.17] |
| 2.51 due to lower extremity oedema 25 mg 6 weeks | 1 | 296 | Risk Ratio (M‐H, Fixed, 95% CI) | 0.92 [0.04, 22.36] |
| 3 Erosions (endoscoped)‐change from baseline | 1 | Mean Difference (IV, Fixed, 95% CI) | Subtotals only | |
| 3.1 25mg 12 weeks | 1 | 369 | Mean Difference (IV, Fixed, 95% CI) | 0.29 [‐0.45, 1.03] |
| 3.2 50mg 12 weeks | 1 | 364 | Mean Difference (IV, Fixed, 95% CI) | 0.53 [‐0.22, 1.28] |
| 4 Ulcer 12 weeks (endoscoped) | 2 | Risk Ratio (M‐H, Fixed, 95% CI) | Subtotals only | |
| 4.1 Ulcer >= 3mm rofecoxib 25mg | 2 | 713 | Risk Ratio (M‐H, Fixed, 95% CI) | 0.65 [0.36, 1.17] |
| 4.2 Ulcer >= 3mm rofecoxib 50mg | 2 | 700 | Risk Ratio (M‐H, Fixed, 95% CI) | 1.09 [0.65, 1.81] |
| 4.3 Ulcer >= 5mm rofecoxib 25mg | 2 | 713 | Risk Ratio (M‐H, Fixed, 95% CI) | 0.42 [0.20, 0.86] |
| 4.4 Ulcer >=5mm rofecoxib 50mg | 2 | 700 | Risk Ratio (M‐H, Fixed, 95% CI) | 1.03 [0.59, 1.79] |
| 4.5 Gastric Ulcer >= 3mm rofecoxib 25mg | 2 | 713 | Risk Ratio (M‐H, Fixed, 95% CI) | 0.61 [0.31, 1.17] |
| 4.6 Gastric Ulcer >= 3mm rofecoxib 50mg | 2 | 700 | Risk Ratio (M‐H, Fixed, 95% CI) | 0.94 [0.52, 1.68] |
| 4.7 Duodenal Ulcer >= 3mm rofecoxib 25mg | 2 | 713 | Risk Ratio (M‐H, Fixed, 95% CI) | 0.89 [0.28, 2.83] |
| 4.8 Duodenal Ulcer >= 3mm rofecoxib 50mg | 2 | 700 | Risk Ratio (M‐H, Fixed, 95% CI) | 1.95 [0.73, 5.26] |
| 5 EFFICACY ‐ WOMAC scales | 4 | Mean Difference (IV, Fixed, 95% CI) | Subtotals only | |
| 5.1 pain 12.5mg 6 weeks | 2 | 488 | Mean Difference (IV, Fixed, 95% CI) | 10.97 [6.80, 15.14] |
| 5.2 pain 25mg 6 weeks | 4 | 855 | Mean Difference (IV, Fixed, 95% CI) | 2.83 [1.88, 3.77] |
| 5.3 pain 125mg 6 weeks | 1 | 146 | Mean Difference (IV, Fixed, 95% CI) | 20.93 [14.65, 27.21] |
| 5.4 pain on walking flat surface 12.5mg 6 weeks | 1 | 318 | Mean Difference (IV, Fixed, 95% CI) | 15.40 [9.88, 20.92] |
| 5.5 pain on walking flat surface 25mg 6 weeks | 1 | 316 | Mean Difference (IV, Fixed, 95% CI) | 16.15 [10.62, 21.68] |
| 5.6 physical function 12.5mg 6 weeks | 2 | 488 | Mean Difference (IV, Fixed, 95% CI) | 9.60 [5.62, 13.58] |
| 5.7 physical function 25mg 6 weeks | 4 | 855 | Mean Difference (IV, Fixed, 95% CI) | 8.67 [6.61, 10.73] |
| 5.8 physical function 125mg 6 weeks | 1 | 146 | Mean Difference (IV, Fixed, 95% CI) | 20.11 [14.27, 25.95] |
| 5.9 stiffness 12.5mg 6 weeks | 2 | 488 | Mean Difference (IV, Fixed, 95% CI) | 12.09 [7.52, 16.66] |
| 5.10 stiffness 25mg 6 weeks | 4 | 855 | Mean Difference (IV, Fixed, 95% CI) | 0.77 [0.33, 1.20] |
| 5.11 stiffness 125mg 6 weeks | 1 | 146 | Mean Difference (IV, Fixed, 95% CI) | 24.42 [17.24, 31.60] |
| 6 EFFICACY‐ patient/investigator measures ‐ continuous | 4 | Mean Difference (IV, Fixed, 95% CI) | Subtotals only | |
| 6.1 patient global response 12.5mg 6 weeks | 1 | 318 | Mean Difference (IV, Fixed, 95% CI) | 0.72 [0.48, 0.96] |
| 6.2 patient global response 25mg 6 weeks | 2 | 461 | Mean Difference (IV, Fixed, 95% CI) | 1.01 [0.82, 1.21] |
| 6.3 patient global response 125mg 6 weeks | 1 | 146 | Mean Difference (IV, Fixed, 95% CI) | 1.48 [1.15, 1.81] |
| 6.4 patient pain 25mg 6 weeks | 1 | 145 | Mean Difference (IV, Fixed, 95% CI) | 20.63 [13.69, 27.57] |
| 6.5 patient pain 125mg 6 weeks | 1 | 146 | Mean Difference (IV, Fixed, 95% CI) | 22.6 [16.10, 29.10] |
| 6.6 patient disease status 12.5mg 6 weeks | 2 | 488 | Mean Difference (IV, Fixed, 95% CI) | 15.63 [10.93, 20.34] |
| 6.7 patient disease status 25mg 6 weeks | 3 | 569 | Mean Difference (IV, Fixed, 95% CI) | 19.06 [15.12, 23.00] |
| 6.8 patient disease status 125mg 6 weeks | 1 | 146 | Mean Difference (IV, Fixed, 95% CI) | 23.68 [17.37, 29.99] |
| 6.9 patient pain on walking 25mg 6 weeks | 1 | 286 | Mean Difference (IV, Fixed, 95% CI) | 10.0 [3.41, 16.59] |
| 6.10 investigator global disease status 12.5mg 6 weeks | 2 | 488 | Mean Difference (IV, Fixed, 95% CI) | 0.47 [0.30, 0.65] |
| 6.11 investigator global disease status 25mg 6 weeks | 3 | 569 | Mean Difference (IV, Fixed, 95% CI) | 0.70 [0.54, 0.85] |
| 6.12 investigator global disease status 125mg 6 weeks | 1 | 146 | Mean Difference (IV, Fixed, 95% CI) | 1.05 [0.78, 1.32] |
| 6.13 investigator global response 12.5mg 6 weeks | 1 | 318 | Mean Difference (IV, Fixed, 95% CI) | 0.74 [0.50, 0.98] |
| 6.14 investigator global response 25mg 6 weeks | 2 | 461 | Mean Difference (IV, Fixed, 95% CI) | 0.98 [0.77, 1.18] |
| 6.15 investigator global response 125mg 6 weeks | 1 | 146 | Mean Difference (IV, Fixed, 95% CI) | 1.30 [0.95, 1.65] |
| 7 EFFICACY‐ patient/investigator measures‐ dichotomous | 5 | Risk Ratio (M‐H, Fixed, 95% CI) | Subtotals only | |
| 7.1 patient global‐ good or excellent reponse/improved 12.5 mg 6 weeks | 3 | 1506 | Risk Ratio (M‐H, Fixed, 95% CI) | 1.85 [1.59, 2.16] |
| 7.2 patient global‐ good or excellent response 25 mg 6 weeks | 2 | 582 | Risk Ratio (M‐H, Fixed, 95% CI) | 1.75 [1.35, 2.26] |
| 7.3 patient global‐ improved pain 12.5 mg 6 weeks | 0 | 0 | Risk Ratio (M‐H, Fixed, 95% CI) | 0.0 [0.0, 0.0] |
| 7.4 patient global‐improved pain 25 mg 6 weeks | 1 | 119 | Risk Ratio (M‐H, Fixed, 95% CI) | 1.56 [1.17, 2.08] |
| 7.5 investigator global improved‐ 25mg 6weeks | 1 | 286 | Risk Ratio (M‐H, Fixed, 95% CI) | 1.34 [0.96, 1.86] |
| 7.6 investigator global‐ good or excellent reponse/improved 12.5 mg 6 weeks | 1 | 632 | Risk Ratio (M‐H, Fixed, 95% CI) | 1.87 [1.50, 2.33] |
| 8 SF 36 PHYSICAL COMPONENT: CHANGE FROM BASELINE | 1 | Mean Difference (IV, Fixed, 95% CI) | Subtotals only | |
| 8.1 5mg | 1 | 264 | Mean Difference (IV, Fixed, 95% CI) | 2.89 [0.87, 4.91] |
| 8.2 12.5mg | 1 | 254 | Mean Difference (IV, Fixed, 95% CI) | 3.17 [1.12, 5.22] |
| 8.3 25mg | 1 | 256 | Mean Difference (IV, Fixed, 95% CI) | 3.15 [1.10, 5.20] |
| 8.4 50mg | 1 | 218 | Mean Difference (IV, Fixed, 95% CI) | 4.77 [2.52, 7.02] |
| 9 SF 36 MENTALCOMPONENT: CHANGE FROM BASELINE | 1 | Mean Difference (IV, Fixed, 95% CI) | Subtotals only | |
| 9.1 5mg | 1 | 264 | Mean Difference (IV, Fixed, 95% CI) | 2.45 [0.27, 4.63] |
| 9.2 12.5mg | 1 | 254 | Mean Difference (IV, Fixed, 95% CI) | 3.08 [0.86, 5.30] |
| 9.3 25mg | 1 | 256 | Mean Difference (IV, Fixed, 95% CI) | 4.01 [1.79, 6.23] |
| 9.4 50mg | 1 | 218 | Mean Difference (IV, Fixed, 95% CI) | 4.12 [1.68, 6.56] |
| 10 Use of paracetamol rescue | 2 | Risk Ratio (M‐H, Fixed, 95% CI) | Subtotals only | |
| 10.1 25mg 6 weeks | 1 | 286 | Risk Ratio (M‐H, Fixed, 95% CI) | 0.66 [0.30, 1.44] |
| 10.2 12.5mg 6 weeks | 1 | 632 | Risk Ratio (M‐H, Fixed, 95% CI) | 0.83 [0.77, 0.90] |
| 11 Study joint tenderness (0‐3) | 2 | Mean Difference (IV, Fixed, 95% CI) | Subtotals only | |
| 11.1 12.5mg 6 weeks | 2 | 488 | Mean Difference (IV, Fixed, 95% CI) | 0.31 [0.16, 0.45] |
| 11.2 25mg 6 weeks | 2 | 424 | Mean Difference (IV, Fixed, 95% CI) | 0.38 [0.23, 0.53] |
| 12 Paracetamol use‐ tablets per day | 2 | Mean Difference (IV, Fixed, 95% CI) | Subtotals only | |
| 12.1 12.5mg 6 weeks | 2 | 488 | Mean Difference (IV, Fixed, 95% CI) | ‐0.48 [‐0.70, ‐0.26] |
| 12.2 25mg 6 weeks | 2 | 424 | Mean Difference (IV, Fixed, 95% CI) | ‐0.53 [‐0.75, ‐0.30] |
1.1. Analysis.
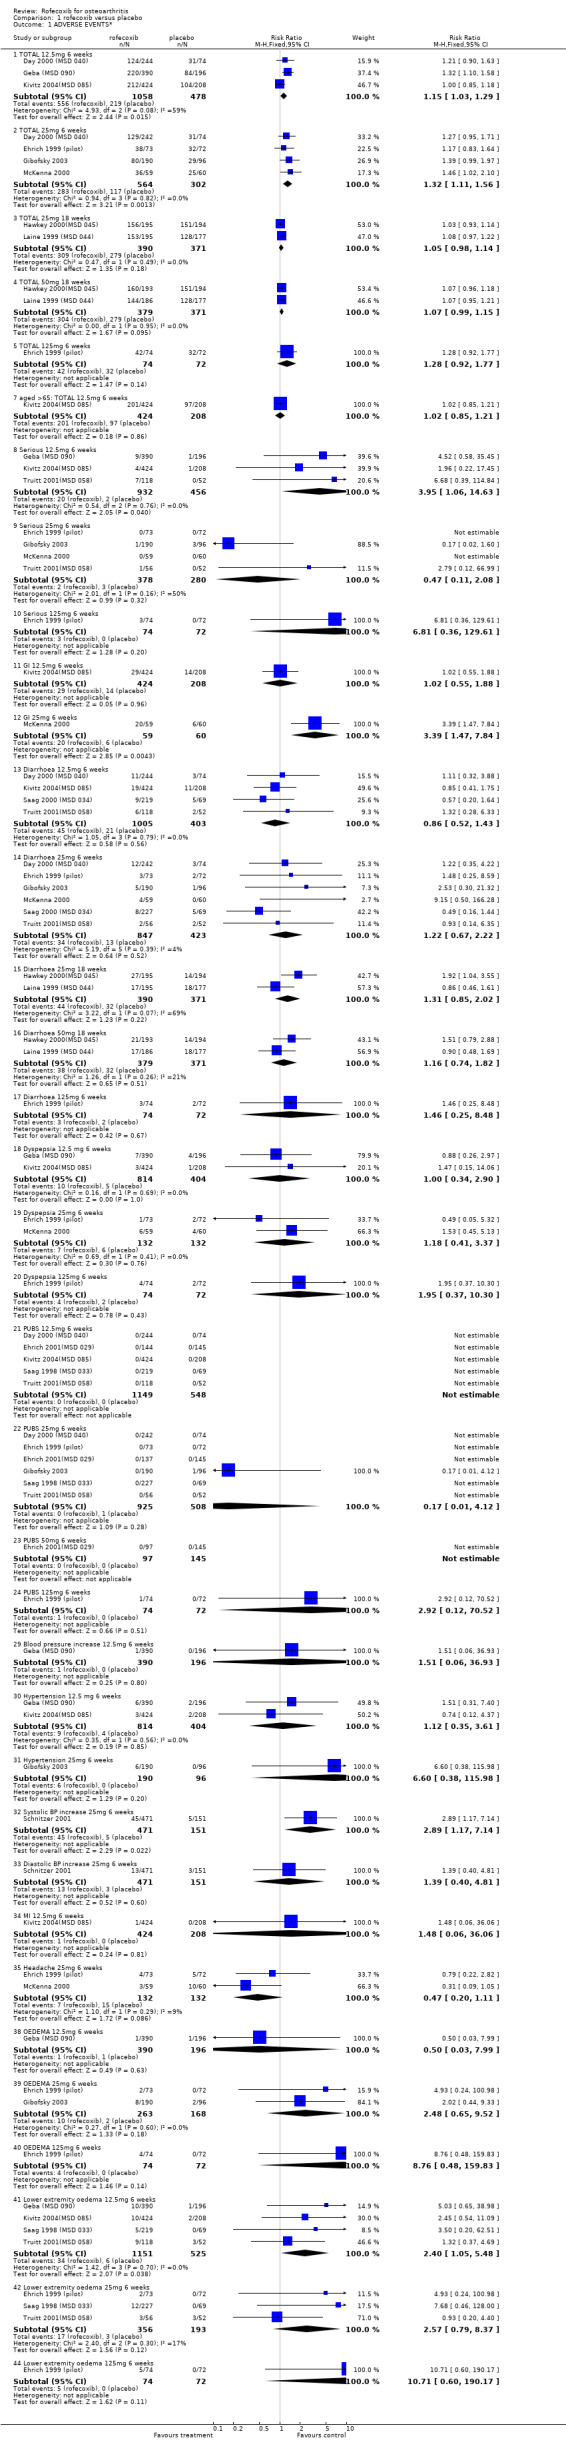
Comparison 1 rofecoxib versus placebo, Outcome 1 ADVERSE EVENTS*.
1.2. Analysis.
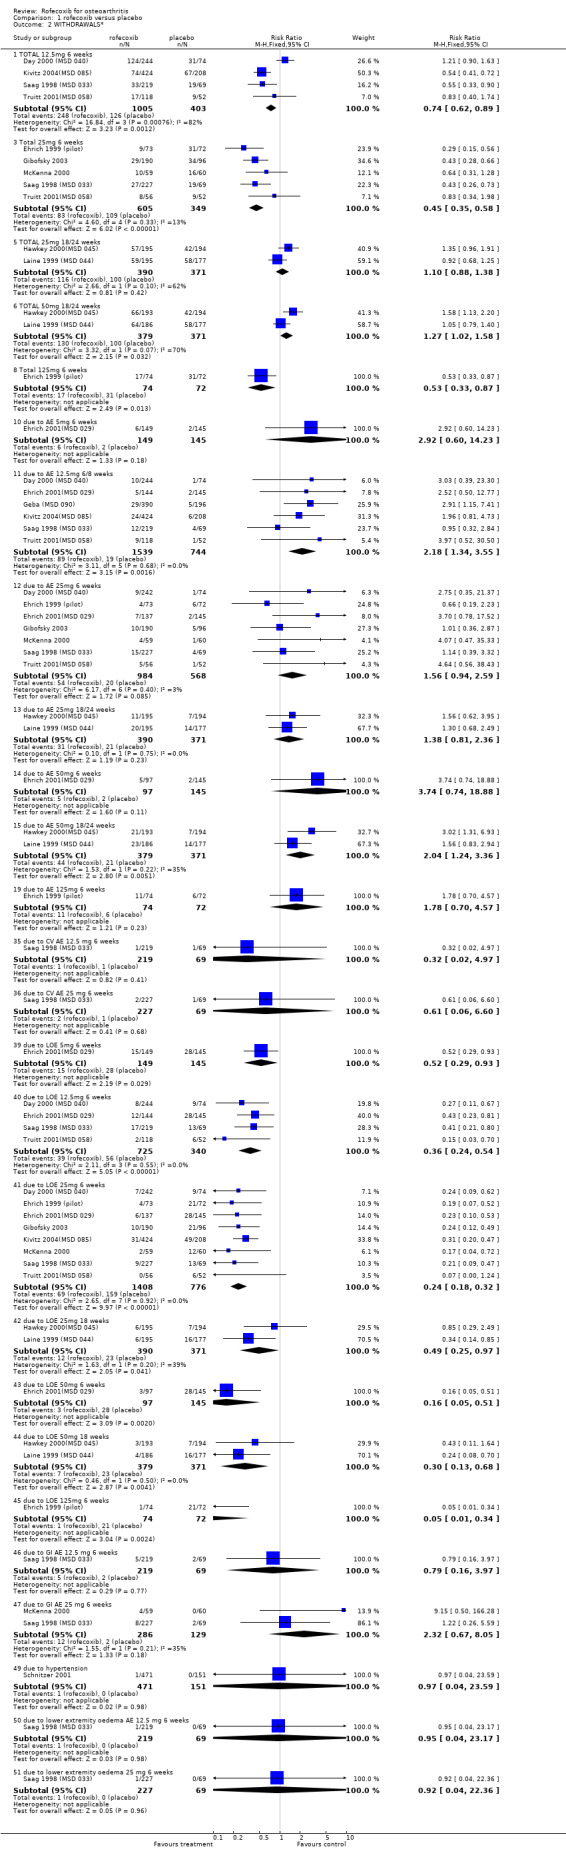
Comparison 1 rofecoxib versus placebo, Outcome 2 WITHDRAWALS*.
1.3. Analysis.
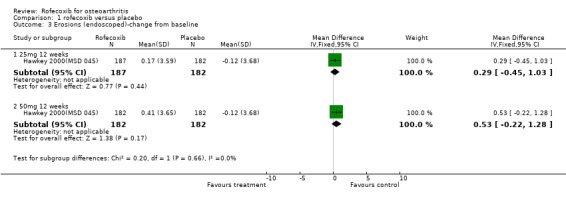
Comparison 1 rofecoxib versus placebo, Outcome 3 Erosions (endoscoped)‐change from baseline.
1.4. Analysis.
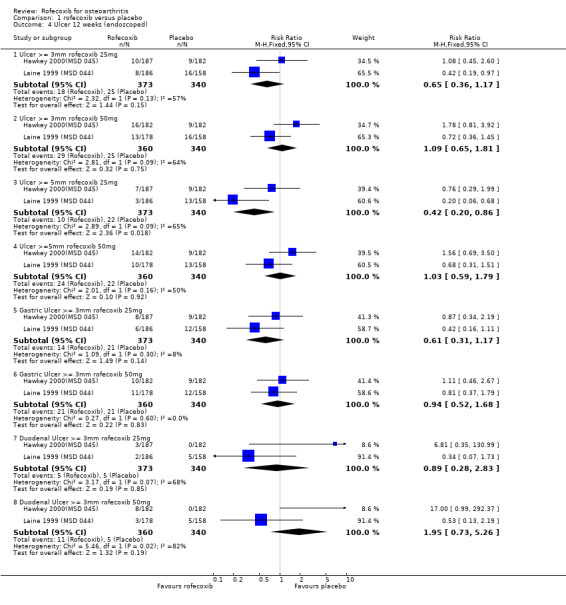
Comparison 1 rofecoxib versus placebo, Outcome 4 Ulcer 12 weeks (endoscoped).
1.5. Analysis.
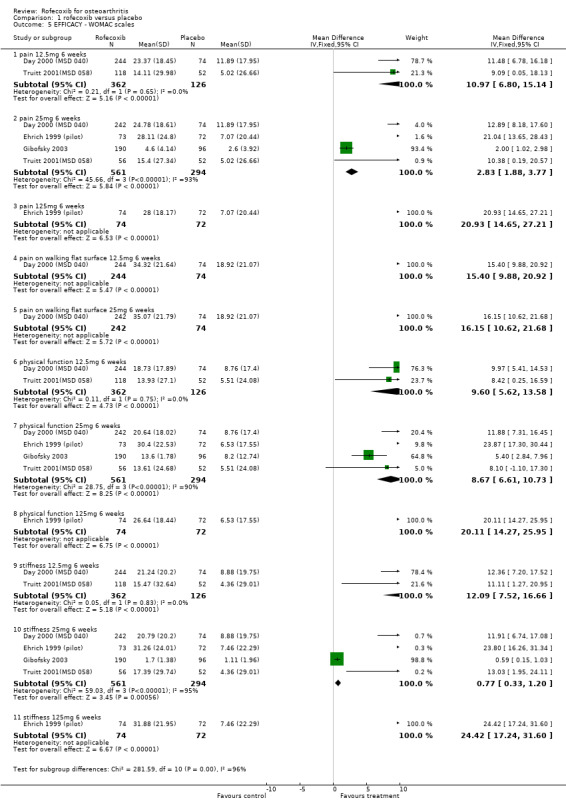
Comparison 1 rofecoxib versus placebo, Outcome 5 EFFICACY ‐ WOMAC scales.
1.6. Analysis.
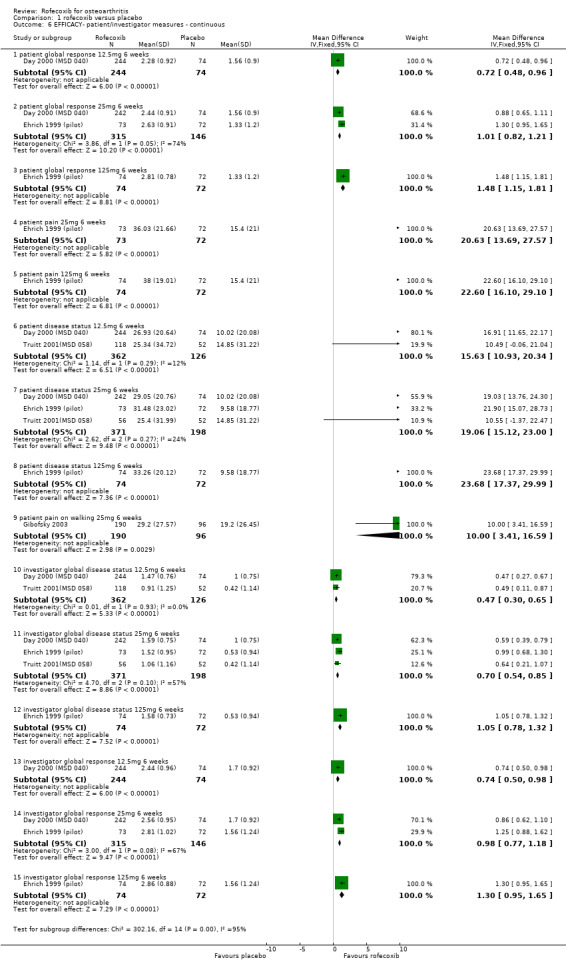
Comparison 1 rofecoxib versus placebo, Outcome 6 EFFICACY‐ patient/investigator measures ‐ continuous.
1.7. Analysis.
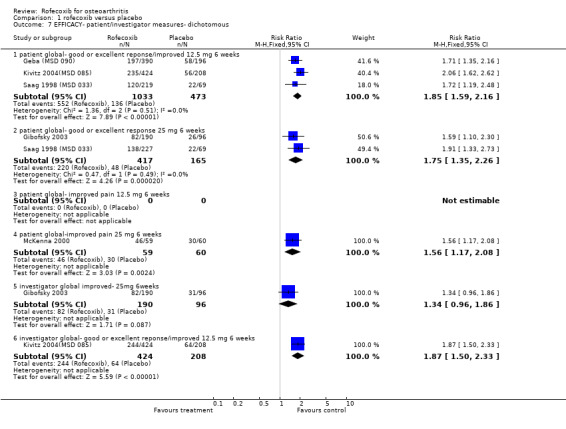
Comparison 1 rofecoxib versus placebo, Outcome 7 EFFICACY‐ patient/investigator measures‐ dichotomous.
1.8. Analysis.
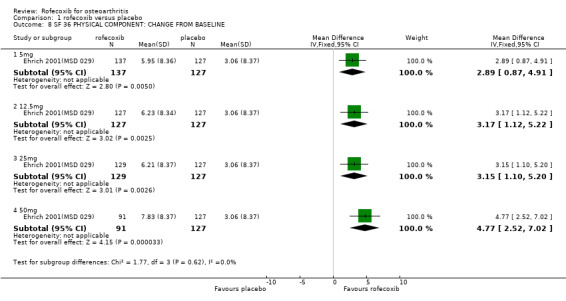
Comparison 1 rofecoxib versus placebo, Outcome 8 SF 36 PHYSICAL COMPONENT: CHANGE FROM BASELINE.
1.9. Analysis.
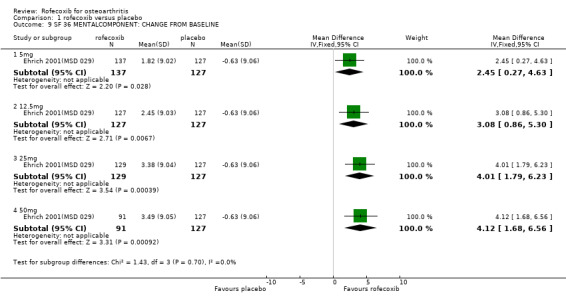
Comparison 1 rofecoxib versus placebo, Outcome 9 SF 36 MENTALCOMPONENT: CHANGE FROM BASELINE.
1.10. Analysis.
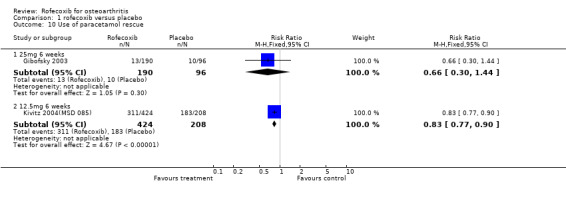
Comparison 1 rofecoxib versus placebo, Outcome 10 Use of paracetamol rescue.
1.11. Analysis.
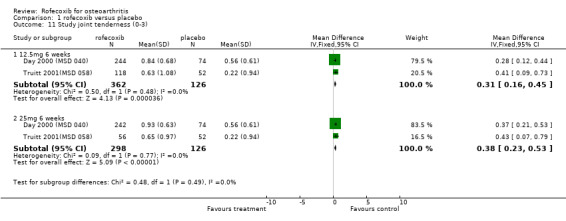
Comparison 1 rofecoxib versus placebo, Outcome 11 Study joint tenderness (0‐3).
1.12. Analysis.
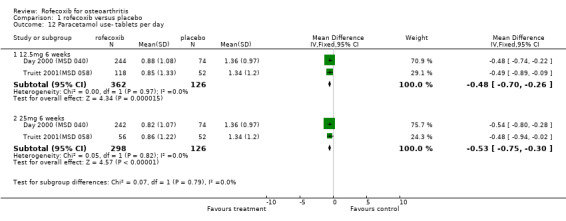
Comparison 1 rofecoxib versus placebo, Outcome 12 Paracetamol use‐ tablets per day.
Comparison 2. rofecoxib dose comparison.
| Outcome or subgroup title | No. of studies | No. of participants | Statistical method | Effect size |
|---|---|---|---|---|
| 1 ADVERSE EVENTS* | 9 | Risk Ratio (M‐H, Fixed, 95% CI) | Subtotals only | |
| 1.1 TOTAL 25 mg v 12.5mg 6 weeks | 2 | 677 | Risk Ratio (M‐H, Fixed, 95% CI) | 0.98 [0.85, 1.13] |
| 1.2 TOTAL 25mg v 50mg 18 weeks | 2 | 769 | Risk Ratio (M‐H, Fixed, 95% CI) | 1.01 [0.94, 1.09] |
| 1.4 TOTAL 25mg v 12.5mg 52 weeks | 1 | 516 | Risk Ratio (M‐H, Fixed, 95% CI) | 0.97 [0.90, 1.04] |
| 1.5 TOTAL 125mg v 25mg 6 weeks | 1 | 147 | Risk Ratio (M‐H, Fixed, 95% CI) | 1.09 [0.81, 1.47] |
| 1.7 Serious 25mg v 12.5 mg 6 weeks | 2 | 365 | Risk Ratio (M‐H, Fixed, 95% CI) | 0.52 [0.13, 2.05] |
| 1.10 CV 25mg v 12.5mg 52 weeks | 1 | 516 | Risk Ratio (M‐H, Fixed, 95% CI) | 1.51 [0.43, 5.29] |
| 1.11 Serious 125mg v 25mg 6 weeks | 1 | 147 | Risk Ratio (M‐H, Fixed, 95% CI) | 6.91 [0.36, 131.40] |
| 1.13 Diarrhoea 25mg v 12.5mg 6 weeks | 4 | 1297 | Risk Ratio (M‐H, Fixed, 95% CI) | 0.84 [0.51, 1.38] |
| 1.15 Diarrhoea 25mg v 50mg 18 weeks | 2 | 769 | Risk Ratio (M‐H, Fixed, 95% CI) | 0.89 [0.59, 1.33] |
| 1.16 Diarrhoea 25mg v 12.5mg 52 weeks | 1 | 516 | Risk Ratio (M‐H, Fixed, 95% CI) | 1.74 [1.00, 3.02] |
| 1.17 Diarrhoea 125mg v 25mg 6 weeks | 1 | 147 | Risk Ratio (M‐H, Fixed, 95% CI) | 0.99 [0.21, 4.73] |
| 1.18 Dyspepsia 25mg v 12.5 mg 6 weeks | 1 | 191 | Risk Ratio (M‐H, Fixed, 95% CI) | 0.20 [0.01, 4.15] |
| 1.19 Dyspepsia 25mg v 12.5mg 52 weeks | 1 | 463 | Risk Ratio (M‐H, Fixed, 95% CI) | 4.98 [0.24, 103.14] |
| 1.20 Dyspepsia 125mg v 25mg 6 weeks | 1 | 147 | Risk Ratio (M‐H, Fixed, 95% CI) | 3.95 [0.45, 34.47] |
| 1.21 PUBS 25mg v 12.5mg 6 weeks | 2 | 677 | Risk Ratio (M‐H, Fixed, 95% CI) | 0.0 [0.0, 0.0] |
| 1.22 PUBS 25mg v 12.5 mg 52 weeks | 1 | 516 | Risk Ratio (M‐H, Fixed, 95% CI) | 1.01 [0.14, 7.10] |
| 1.25 Thromboembolic CV events 25mg v 12.5mg 52 weeks | 1 | 516 | Risk Ratio (M‐H, Fixed, 95% CI) | 1.51 [0.43, 5.29] |
| 1.31 Hypertension 25mg v 12.5mg 6 weeks | 1 | 191 | Risk Ratio (M‐H, Fixed, 95% CI) | 0.51 [0.05, 5.48] |
| 1.39 OEDEMA 25mg v 12.5 mg 52 weeks | 1 | 516 | Risk Ratio (M‐H, Fixed, 95% CI) | 0.50 [0.17, 1.45] |
| 1.41 Lower extremity oedema 25mg v 12.5mg 52 weeks | 1 | 516 | Risk Ratio (M‐H, Fixed, 95% CI) | 0.50 [0.17, 1.45] |
| 1.42 Lower extremity oedema 25mg v 12.5mg 6 weeks | 3 | 811 | Risk Ratio (M‐H, Fixed, 95% CI) | 1.22 [0.60, 2.46] |
| 1.44 Lower extremity oedema 125mg v 25mg 6 weeks | 1 | 147 | Risk Ratio (M‐H, Fixed, 95% CI) | 2.47 [0.49, 12.31] |
| 1.45 MI 25mg v 12.5mg 52 weeks | 1 | 516 | Risk Ratio (M‐H, Fixed, 95% CI) | 1.01 [0.06, 16.03] |
| 2 WITHDRAWALS* | 10 | Risk Ratio (M‐H, Fixed, 95% CI) | Subtotals only | |
| 2.1 TOTAL 25mg v 12.5mg 6 weeks | 4 | 813 | Risk Ratio (M‐H, Fixed, 95% CI) | 0.90 [0.65, 1.26] |
| 2.2 Total 12.5mg v 5mg 6 weeks | 0 | 0 | Risk Ratio (M‐H, Fixed, 95% CI) | 0.0 [0.0, 0.0] |
| 2.3 Total 125mg v 25mg 6 weeks | 1 | 147 | Risk Ratio (M‐H, Fixed, 95% CI) | 1.86 [0.89, 3.91] |
| 2.5 TOTAL 50mg v 25mg 18 weeks | 2 | 769 | Risk Ratio (M‐H, Fixed, 95% CI) | 1.15 [0.94, 1.42] |
| 2.7 Total 25mg v 12.5mg 52 weeks | 2 | 979 | Risk Ratio (M‐H, Fixed, 95% CI) | 1.05 [0.90, 1.24] |
| 2.9 due to AE 50mg v 25mg 18 weeks | 2 | 769 | Risk Ratio (M‐H, Fixed, 95% CI) | 1.47 [0.95, 2.27] |
| 2.10 due to AE 12.5mg v 5mg 6 weeks | 1 | 293 | Risk Ratio (M‐H, Fixed, 95% CI) | 0.86 [0.27, 2.76] |
| 2.11 due to AE 25mg v 12.5mg 6 weeks | 5 | 1578 | Risk Ratio (M‐H, Fixed, 95% CI) | 1.10 [0.73, 1.67] |
| 2.12 due to AE 25mg v 5mg 6 weeks | 1 | 286 | Risk Ratio (M‐H, Fixed, 95% CI) | 1.27 [0.44, 3.68] |
| 2.13 due to AE 50mg v 25mg 6 weeks | 1 | 234 | Risk Ratio (M‐H, Fixed, 95% CI) | 1.01 [0.33, 3.09] |
| 2.14 due to AE 50mg v 5mg 6 weeks | 1 | 246 | Risk Ratio (M‐H, Fixed, 95% CI) | 1.28 [0.40, 4.08] |
| 2.15 due to AE 50mg v 12.5 mg 6 weeks | 1 | 241 | Risk Ratio (M‐H, Fixed, 95% CI) | 1.48 [0.44, 4.99] |
| 2.18 due to AE 25mg v 12.5mg 52 weeks | 2 | 979 | Risk Ratio (M‐H, Fixed, 95% CI) | 0.99 [0.70, 1.39] |
| 2.19 due to AE 125mg v 25mg 6 weeks | 1 | 147 | Risk Ratio (M‐H, Fixed, 95% CI) | 2.71 [0.91, 8.13] |
| 2.37 due to LOE 12.5mg v 5mg 6 weeks | 1 | 293 | Risk Ratio (M‐H, Fixed, 95% CI) | 0.83 [0.40, 1.71] |
| 2.38 due to LOE 25mg v 5mg 6 weeks | 1 | 286 | Risk Ratio (M‐H, Fixed, 95% CI) | 0.44 [0.17, 1.09] |
| 2.39 due to LOE 50mg v 5mg 6 weeks | 1 | 246 | Risk Ratio (M‐H, Fixed, 95% CI) | 0.31 [0.09, 1.03] |
| 2.40 due to LOE 25mg v 12.5mg 6 weeks | 5 | 1578 | Risk Ratio (M‐H, Fixed, 95% CI) | 0.66 [0.42, 1.03] |
| 2.41 due to LOE 50mg v 12.5 mg 6 weeks | 1 | 241 | Risk Ratio (M‐H, Fixed, 95% CI) | 0.37 [0.11, 1.28] |
| 2.42 due to LOE 50mg v 25mg 6 weeks | 1 | 234 | Risk Ratio (M‐H, Fixed, 95% CI) | 0.71 [0.18, 2.75] |
| 2.43 due to LOE 25mg v 12.5mg 52 weeks | 2 | 979 | Risk Ratio (M‐H, Fixed, 95% CI) | 1.29 [0.95, 1.74] |
| 2.45 due to LOE 125mg v 25mg 6 weeks | 1 | 147 | Risk Ratio (M‐H, Fixed, 95% CI) | 0.25 [0.03, 2.15] |
| 2.46 due to LOE 50mg v 25mg 18 weeks | 2 | 769 | Risk Ratio (M‐H, Fixed, 95% CI) | 0.60 [0.24, 1.51] |
| 2.48 due to GI AE 25mg v 12.5 mg 6 weeks | 1 | 446 | Risk Ratio (M‐H, Fixed, 95% CI) | 1.54 [0.51, 4.65] |
| 2.49 due to GI AE 25mg v 12.5mg 52 weeks | 2 | 979 | Risk Ratio (M‐H, Fixed, 95% CI) | 0.95 [0.52, 1.74] |
| 2.50 due to lower extremity oedema 25mg v 12.5 mg 6 weeks | 2 | 637 | Risk Ratio (M‐H, Fixed, 95% CI) | 1.64 [0.22, 12.28] |
| 2.51 due to lower extremity oedema 125 mg v 25 mg 6 weeks | 1 | 147 | Risk Ratio (M‐H, Fixed, 95% CI) | 6.91 [0.36, 131.40] |
| 2.52 due to lower extremity oedema 25mg v 12.5mg 52 weeks | 1 | 463 | Risk Ratio (M‐H, Fixed, 95% CI) | 0.33 [0.01, 8.11] |
| 2.53 due to MI 25mg v 12.5 mg 52 weeks | 1 | 516 | Risk Ratio (M‐H, Fixed, 95% CI) | 1.01 [0.06, 16.03] |
| 2.54 due to CV AE 25mg v 12.5 mg 52 weeks | 2 | 979 | Risk Ratio (M‐H, Fixed, 95% CI) | 1.34 [0.57, 3.15] |
| 2.55 due to CV AE 25mg v12.5mg 6 weeks | 1 | 446 | Risk Ratio (M‐H, Fixed, 95% CI) | 1.93 [0.18, 21.13] |
| 3 Ulcer 12 weeks (endoscoped) 50mg vs 25mg 6 weeks | 2 | Risk Ratio (M‐H, Fixed, 95% CI) | Subtotals only | |
| 3.1 Ulcer >= 3mm rofecoxib | 2 | 733 | Risk Ratio (M‐H, Fixed, 95% CI) | 1.67 [0.94, 2.95] |
| 3.4 Ulcer >=5mm rofecoxib 50mg | 2 | 733 | Risk Ratio (M‐H, Fixed, 95% CI) | 2.48 [1.21, 5.11] |
| 3.6 Gastric Ulcer >= 3mm rofecoxib 50mg | 2 | 733 | Risk Ratio (M‐H, Fixed, 95% CI) | 1.55 [0.80, 3.01] |
| 3.8 Duodenal Ulcer >= 3mm rofecoxib 50mg | 2 | 733 | Risk Ratio (M‐H, Fixed, 95% CI) | 2.27 [0.80, 6.48] |
| 4 Erosions (endoscoped)‐change from baseline 50mg v 25mg 12 weeks | 1 | Mean Difference (IV, Fixed, 95% CI) | Subtotals only | |
| 4.1 Hawkey | 1 | 369 | Mean Difference (IV, Fixed, 95% CI) | 0.24 [‐0.50, 0.98] |
2.1. Analysis.
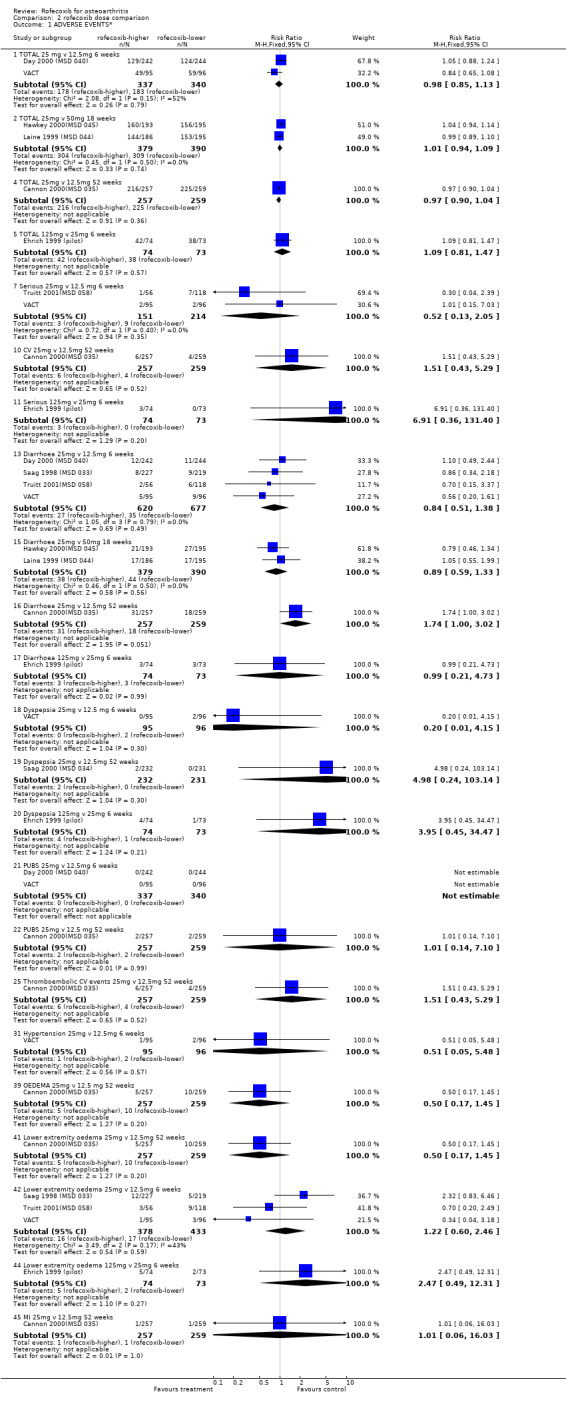
Comparison 2 rofecoxib dose comparison, Outcome 1 ADVERSE EVENTS*.
2.2. Analysis.
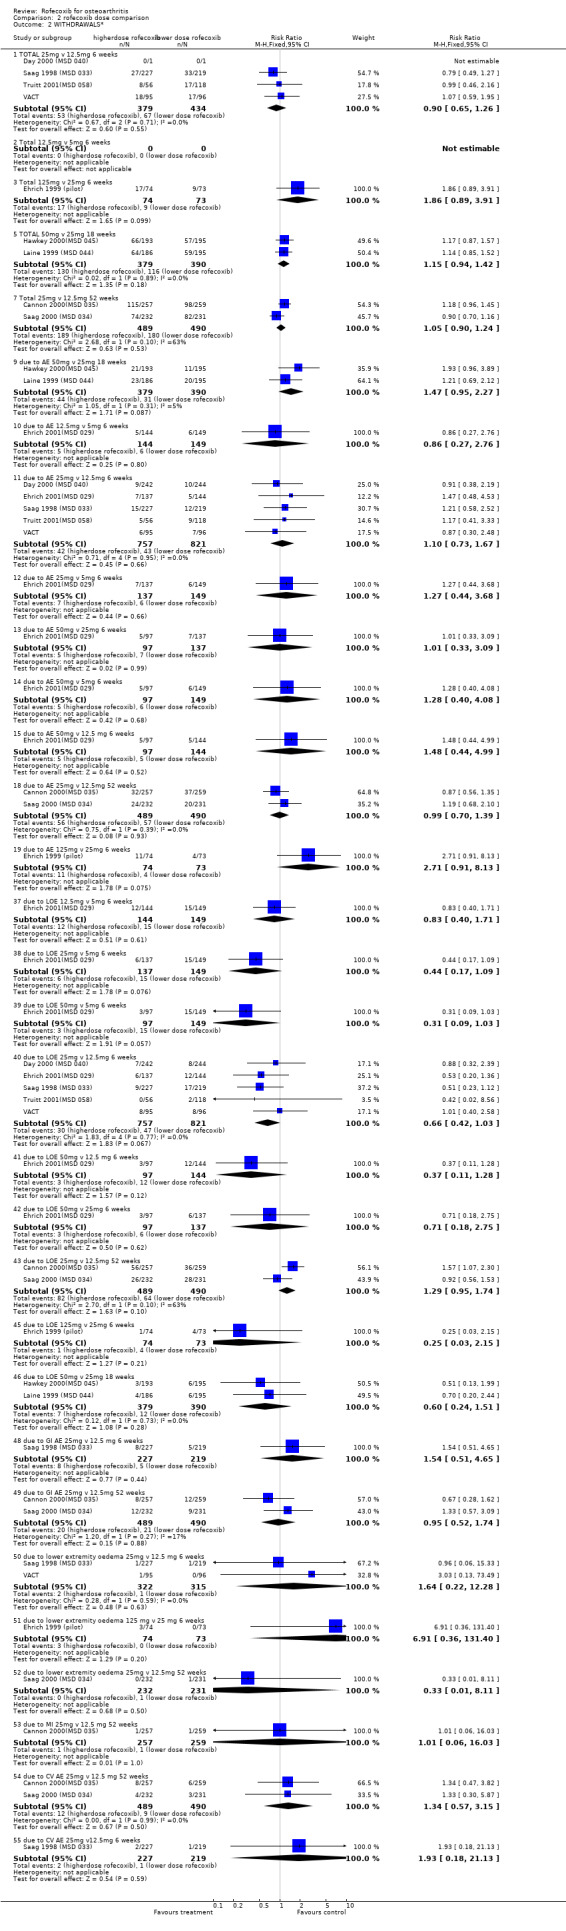
Comparison 2 rofecoxib dose comparison, Outcome 2 WITHDRAWALS*.
2.3. Analysis.
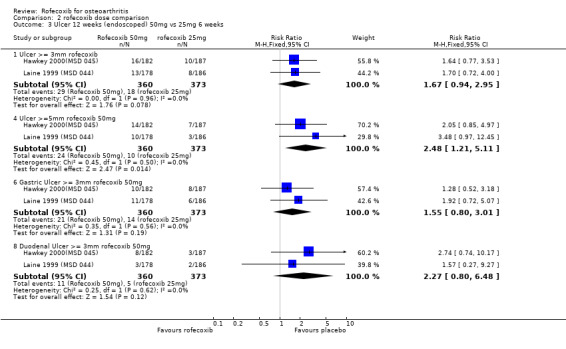
Comparison 2 rofecoxib dose comparison, Outcome 3 Ulcer 12 weeks (endoscoped) 50mg vs 25mg 6 weeks.
2.4. Analysis.
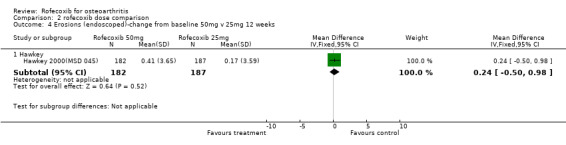
Comparison 2 rofecoxib dose comparison, Outcome 4 Erosions (endoscoped)‐change from baseline 50mg v 25mg 12 weeks.
Comparison 3. rofecoxib versus diclofenac.
| Outcome or subgroup title | No. of studies | No. of participants | Statistical method | Effect size |
|---|---|---|---|---|
| 1 WITHDRAWALS | 3 | Risk Ratio (M‐H, Fixed, 95% CI) | Subtotals only | |
| 1.1 Total 12.5mg 52 weeks | 2 | 988 | Risk Ratio (M‐H, Fixed, 95% CI) | 0.92 [0.79, 1.08] |
| 1.2 Total 25mg 52 weeks | 2 | 987 | Risk Ratio (M‐H, Fixed, 95% CI) | 0.97 [0.83, 1.13] |
| 1.3 due to LOE 12.5mg | 2 | 988 | Risk Ratio (M‐H, Fixed, 95% CI) | 1.11 [0.80, 1.54] |
| 1.4 due to LOE 25mg 52 weeks | 2 | 987 | Risk Ratio (M‐H, Fixed, 95% CI) | 1.43 [1.05, 1.94] |
| 1.5 due to AE 12.5 mg 52 weeks | 2 | 988 | Risk Ratio (M‐H, Fixed, 95% CI) | 0.71 [0.52, 0.97] |
| 1.6 due to AE 25mg 52 weeks | 2 | 987 | Risk Ratio (M‐H, Fixed, 95% CI) | 0.70 [0.51, 0.95] |
| 1.7 due to GI AE 12.5 mg 52 weeks | 2 | 988 | Risk Ratio (M‐H, Fixed, 95% CI) | 0.73 [0.42, 1.27] |
| 1.8 due to GI AE 25 mg 52 weeks | 2 | 987 | Risk Ratio (M‐H, Fixed, 95% CI) | 0.70 [0.40, 1.21] |
| 1.9 due to CV AE 12.5 mg 52 weeks | 2 | 988 | Risk Ratio (M‐H, Fixed, 95% CI) | 0.71 [0.31, 1.64] |
| 1.10 due to CV AE 25 mg 52 weeks | 2 | 987 | Risk Ratio (M‐H, Fixed, 95% CI) | 0.95 [0.44, 2.06] |
| 1.11 Total 25mg 2 weeks | 1 | 65 | Risk Ratio (M‐H, Fixed, 95% CI) | 3.65 [0.43, 30.89] |
| 1.12 due to GI AE 25mg 2 weeks | 1 | 65 | Risk Ratio (M‐H, Fixed, 95% CI) | 0.30 [0.01, 7.22] |
| 1.13 due to renal AE 25mg 2 weeks | 1 | 65 | Risk Ratio (M‐H, Fixed, 95% CI) | 8.23 [0.46, 146.90] |
| 1.14 due to lab AE 12.5mg 52 weeks | 1 | 527 | Risk Ratio (M‐H, Fixed, 95% CI) | 0.07 [0.01, 0.56] |
| 1.15 due to lab AE 25mg 52 weeks | 1 | 525 | Risk Ratio (M‐H, Fixed, 95% CI) | 0.15 [0.03, 0.65] |
| 1.16 due to elevated transaminase 25mg 52 weeks | 1 | 461 | Risk Ratio (M‐H, Fixed, 95% CI) | 0.10 [0.01, 0.77] |
| 2 ADVERSE EVENTS | 2 | Risk Ratio (M‐H, Fixed, 95% CI) | Subtotals only | |
| 2.3 TOTAL 12.5mg 52 weeks | 1 | 527 | Risk Ratio (M‐H, Fixed, 95% CI) | 1.01 [0.94, 1.08] |
| 2.4 TOTAL 25mg 52 weeks | 1 | 525 | Risk Ratio (M‐H, Fixed, 95% CI) | 0.98 [0.91, 1.05] |
| 2.5 MI 12.5mg 52 weeks | 1 | 527 | Risk Ratio (M‐H, Fixed, 95% CI) | 0.52 [0.05, 5.67] |
| 2.6 MI 25mg 52 weeks | 1 | 525 | Risk Ratio (M‐H, Fixed, 95% CI) | 0.52 [0.05, 5.72] |
| 2.7 PUBS 12.5mg 52 weeks | 1 | 527 | Risk Ratio (M‐H, Fixed, 95% CI) | 0.69 [0.12, 4.09] |
| 2.8 PUBS 25mg 52 weeks | 1 | 525 | Risk Ratio (M‐H, Fixed, 95% CI) | 0.70 [0.12, 4.13] |
| 2.9 OEDEMA 12.5mg 52 weeks | 1 | 527 | Risk Ratio (M‐H, Fixed, 95% CI) | 1.15 [0.47, 2.78] |
| 2.10 OEDEMA 25mg 52 weeks | 1 | 525 | Risk Ratio (M‐H, Fixed, 95% CI) | 0.58 [0.20, 1.71] |
| 2.11 CV 12.5mg 52 weeks | 1 | 527 | Risk Ratio (M‐H, Fixed, 95% CI) | 0.46 [0.14, 1.47] |
| 2.12 CV 25mg 52 weeks | 1 | 525 | Risk Ratio (M‐H, Fixed, 95% CI) | 0.70 [0.25, 1.93] |
| 2.13 Oedema 25mg 2 weeks | 1 | 65 | Risk Ratio (M‐H, Fixed, 95% CI) | 19.2 [1.17, 314.55] |
| 2.14 GI 25mg 2 weeks | 1 | 65 | Risk Ratio (M‐H, Fixed, 95% CI) | 0.05 [0.00, 0.79] |
| 2.15 Hypertension 25mg 2 weeks | 1 | 65 | Risk Ratio (M‐H, Fixed, 95% CI) | 15.54 [0.93, 258.58] |
| 2.16 Weight gain 25mg 2 weeks | 1 | 65 | Risk Ratio (M‐H, Fixed, 95% CI) | 19.2 [1.17, 314.55] |
| 2.17 Oliguria 25mg 2 weeks | 1 | 65 | Risk Ratio (M‐H, Fixed, 95% CI) | 11.89 [0.70, 202.66] |
| 3 EFFICACY ‐ WOMAC | 1 | Std. Mean Difference (IV, Fixed, 95% CI) | Subtotals only | |
| 3.5 pain 12.5 mg 52 weeks | 1 | 527 | Std. Mean Difference (IV, Fixed, 95% CI) | ‐0.12 [‐0.30, 0.05] |
| 3.6 pain 25mg 52 weeks | 1 | 525 | Std. Mean Difference (IV, Fixed, 95% CI) | ‐0.10 [‐0.27, 0.07] |
| 3.7 physical function (100mm VAS) 12.5 mg 52 weeks | 1 | 527 | Std. Mean Difference (IV, Fixed, 95% CI) | ‐0.10 [‐0.27, 0.08] |
| 3.8 physical function (100mm VAS) 25mg 52 weeks | 1 | 525 | Std. Mean Difference (IV, Fixed, 95% CI) | ‐0.08 [‐0.25, 0.09] |
| 3.9 stiffness (100mm VAS) 12.5 mg 52 weeks | 1 | 527 | Std. Mean Difference (IV, Fixed, 95% CI) | ‐0.12 [‐0.29, 0.05] |
| 3.10 stiffness (100mm VAS) 25mg 52 weeks | 1 | 525 | Std. Mean Difference (IV, Fixed, 95% CI) | ‐0.09 [‐0.27, 0.08] |
| 4 EFFICACY‐ patient/investigator‐ continuous | 2 | Mean Difference (IV, Fixed, 95% CI) | Subtotals only | |
| 4.1 patient assessed pain (100mm VAS) 25mg 2 weeks | 1 | 60 | Mean Difference (IV, Fixed, 95% CI) | ‐6.26 [‐10.78, ‐1.74] |
| 4.2 patient global disease activity (100mm VAS) 25mg 2 weeks | 1 | 60 | Mean Difference (IV, Fixed, 95% CI) | ‐6.39 [‐10.87, ‐1.91] |
| 4.3 physician global disease activity (100mm VAS) 25mg 2 weeks | 1 | 60 | Mean Difference (IV, Fixed, 95% CI) | ‐5.08 [‐9.66, ‐0.50] |
| 4.4 Patient Global Status (100mm VAS) 12.5 mg 52 weeks | 1 | 527 | Mean Difference (IV, Fixed, 95% CI) | ‐3.0 [‐7.53, 1.53] |
| 4.5 Patient Global Status (100mm VAS) 25mg 52 weeks | 1 | 525 | Mean Difference (IV, Fixed, 95% CI) | ‐4.40 [‐8.93, 0.13] |
| 4.6 Investigator Global response(0‐4 Likert) 12.5 mg 26 weeks | 1 | 527 | Mean Difference (IV, Fixed, 95% CI) | ‐0.30 [‐0.49, ‐0.11] |
| 4.7 Investigator Global response (0‐4 Likert) 25 mg 26 weeks | 1 | 525 | Mean Difference (IV, Fixed, 95% CI) | ‐0.30 [‐0.49, ‐0.11] |
| 4.8 joint tenderness (0‐3 Likert) 12.5 mg 52 weeks | 1 | 527 | Mean Difference (IV, Fixed, 95% CI) | 0.0 [‐0.14, 0.14] |
| 4.9 joint tenderness (0‐3 Likert) 25mg 52 weeks | 1 | 525 | Mean Difference (IV, Fixed, 95% CI) | 0.10 [‐0.04, 0.24] |
| 5 Use of concomitant OA treatment post 26 weeks | 1 | Risk Ratio (M‐H, Fixed, 95% CI) | Subtotals only | |
| 5.1 12.5mg 52 weeks | 1 | 461 | Risk Ratio (M‐H, Fixed, 95% CI) | 1.06 [0.54, 2.10] |
| 5.2 25mg 52 weeks | 1 | 462 | Risk Ratio (M‐H, Fixed, 95% CI) | 0.79 [0.38, 1.66] |
| 6 Renal function 2 weeks | 1 | Mean Difference (IV, Fixed, 95% CI) | Subtotals only | |
| 6.1 Body weight (kg) | 1 | 60 | Mean Difference (IV, Fixed, 95% CI) | 1.17 [‐1.96, 4.30] |
| 6.2 Systolic blood pressure (mmHg) | 1 | 60 | Mean Difference (IV, Fixed, 95% CI) | 8.0 [3.00, 13.00] |
| 6.3 Diastolic blood pressure (mmHg) | 1 | 60 | Mean Difference (IV, Fixed, 95% CI) | 8.0 [4.47, 11.53] |
| 6.4 Blood urea nitrogen | 1 | 60 | Mean Difference (IV, Fixed, 95% CI) | ‐6.05 [‐8.25, ‐3.85] |
| 6.5 Creatinine | 1 | 60 | Mean Difference (IV, Fixed, 95% CI) | ‐0.19 [‐0.26, ‐0.12] |
| 6.6 sodium (mEq/l) | 1 | 60 | Mean Difference (IV, Fixed, 95% CI) | 1.25 [0.41, 2.09] |
| 6.7 potassium (mEq/l) | 1 | 60 | Mean Difference (IV, Fixed, 95% CI) | ‐0.57 [‐0.77, ‐0.37] |
| 6.8 chlorum (mEq/l) | 1 | 60 | Mean Difference (IV, Fixed, 95% CI) | ‐0.41 [‐1.25, 0.43] |
| 6.9 uric acid (mg/dl) | 1 | 60 | Mean Difference (IV, Fixed, 95% CI) | ‐0.74 [‐1.26, ‐0.22] |
| 6.10 24 hour urine (ml) | 1 | 60 | Mean Difference (IV, Fixed, 95% CI) | 131.18 [7.77, 254.59] |
| 6.11 Creatinine clearance (ml/min) | 1 | 60 | Mean Difference (IV, Fixed, 95% CI) | 9.45 [2.95, 15.95] |
3.1. Analysis.
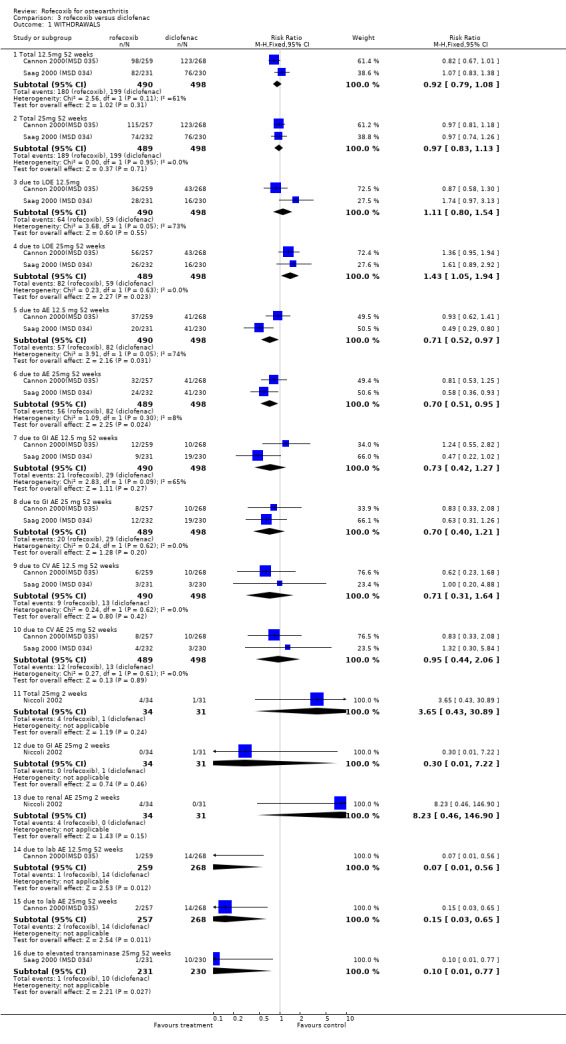
Comparison 3 rofecoxib versus diclofenac, Outcome 1 WITHDRAWALS.
3.2. Analysis.
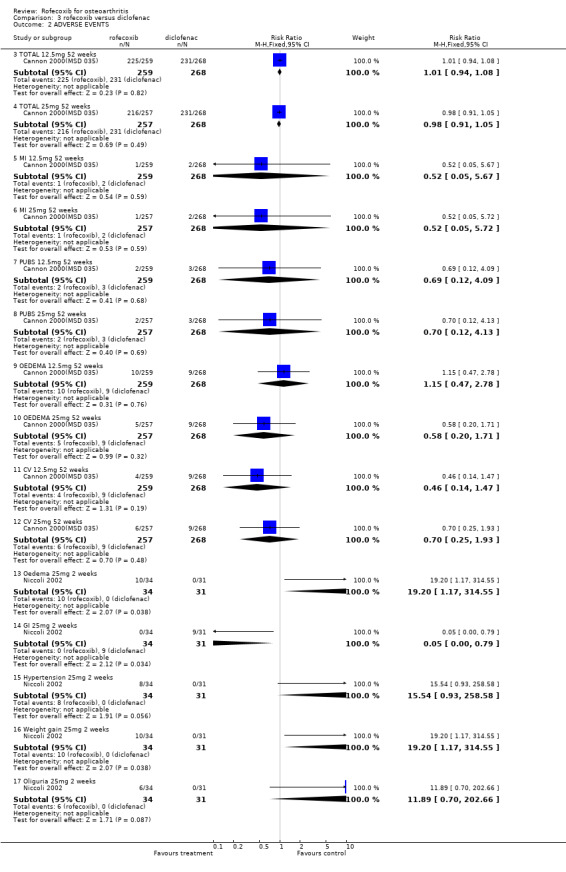
Comparison 3 rofecoxib versus diclofenac, Outcome 2 ADVERSE EVENTS.
3.3. Analysis.
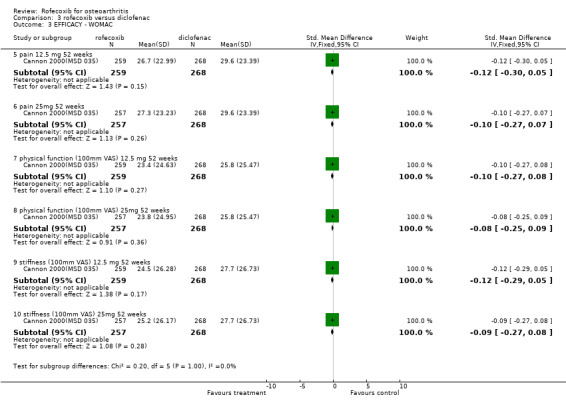
Comparison 3 rofecoxib versus diclofenac, Outcome 3 EFFICACY ‐ WOMAC.
3.4. Analysis.
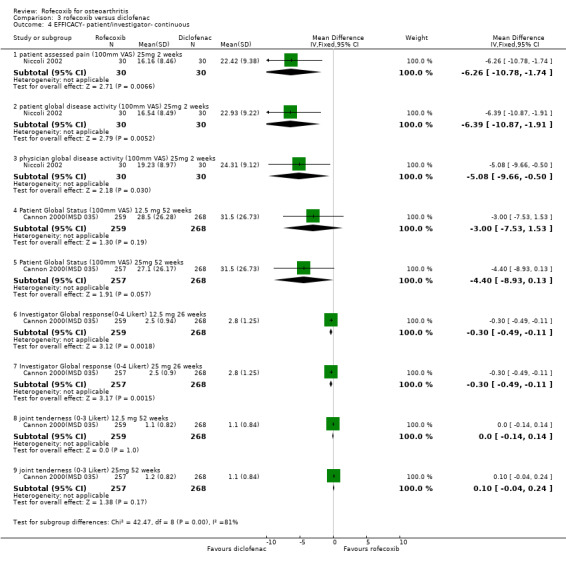
Comparison 3 rofecoxib versus diclofenac, Outcome 4 EFFICACY‐ patient/investigator‐ continuous.
3.5. Analysis.
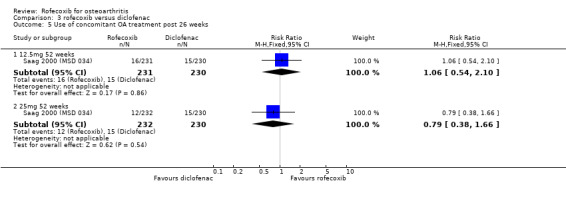
Comparison 3 rofecoxib versus diclofenac, Outcome 5 Use of concomitant OA treatment post 26 weeks.
3.6. Analysis.
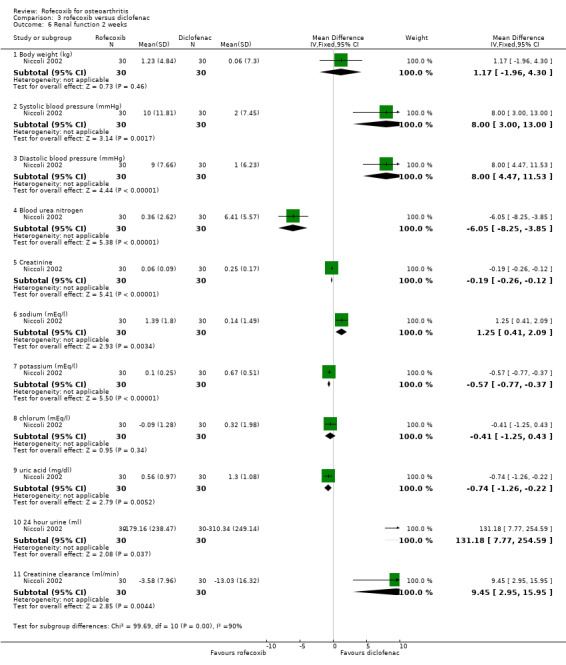
Comparison 3 rofecoxib versus diclofenac, Outcome 6 Renal function 2 weeks.
Comparison 4. rofecoxib versus ibuprofen.
| Outcome or subgroup title | No. of studies | No. of participants | Statistical method | Effect size |
|---|---|---|---|---|
| 1 ADVERSE EVENTS* | 5 | Risk Ratio (M‐H, Fixed, 95% CI) | Subtotals only | |
| 1.1 Total 12.5mg 6 weeks | 1 | 493 | Risk Ratio (M‐H, Fixed, 95% CI) | 0.98 [0.83, 1.17] |
| 1.2 Total 25mg 6 weeks | 1 | 491 | Risk Ratio (M‐H, Fixed, 95% CI) | 1.03 [0.87, 1.22] |
| 1.7 Total 25mg 18 weeks | 2 | 766 | Risk Ratio (M‐H, Fixed, 95% CI) | 1.02 [0.95, 1.10] |
| 1.8 Total 50 mg 18 weeks | 2 | 755 | Risk Ratio (M‐H, Fixed, 95% CI) | 1.04 [0.96, 1.12] |
| 1.13 Diarrhoea 12.5mg | 2 | 933 | Risk Ratio (M‐H, Fixed, 95% CI) | 1.07 [0.58, 1.98] |
| 1.14 Diarrhoea 25mg | 2 | 939 | Risk Ratio (M‐H, Fixed, 95% CI) | 1.06 [0.57, 1.96] |
| 1.15 Diarrhoea 25mg 18 weeks | 2 | 766 | Risk Ratio (M‐H, Fixed, 95% CI) | 0.99 [0.67, 1.47] |
| 1.16 Diarrhoea 50mg 18 weeks | 2 | 755 | Risk Ratio (M‐H, Fixed, 95% CI) | 0.88 [0.58, 1.32] |
| 1.25 PUBs 12.5mg 6 weeks | 2 | 933 | Risk Ratio (M‐H, Fixed, 95% CI) | 0.25 [0.03, 2.26] |
| 1.26 PUBs 25mg 6 weeks | 2 | 939 | Risk Ratio (M‐H, Fixed, 95% CI) | 0.25 [0.03, 2.25] |
| 1.30 lower extremity oedema 12.5mg 6 weeks | 1 | 440 | Risk Ratio (M‐H, Fixed, 95% CI) | 1.01 [0.30, 3.44] |
| 1.31 lower extremity oedema 25mg 6 weeks | 1 | 448 | Risk Ratio (M‐H, Fixed, 95% CI) | 2.34 [0.84, 6.52] |
| 2 WITHDRAWALS* | 4 | Risk Ratio (M‐H, Fixed, 95% CI) | Subtotals only | |
| 2.1 Total 12.5mg 6 weeks | 1 | 440 | Risk Ratio (M‐H, Fixed, 95% CI) | 1.04 [0.66, 1.63] |
| 2.2 Total 25mg 6 weeks | 1 | 448 | Risk Ratio (M‐H, Fixed, 95% CI) | 0.82 [0.51, 1.32] |
| 2.3 Total 25mg 18/24 weeks | 2 | 766 | Risk Ratio (M‐H, Fixed, 95% CI) | 0.50 [0.42, 0.59] |
| 2.4 Total 50mg 18/24 weeks | 2 | 755 | Risk Ratio (M‐H, Fixed, 95% CI) | 0.57 [0.49, 0.67] |
| 2.5 due to AE 12.5mg 6 weeks | 2 | 933 | Risk Ratio (M‐H, Fixed, 95% CI) | 0.74 [0.44, 1.27] |
| 2.6 due to AE 25mg 6 weeks | 2 | 939 | Risk Ratio (M‐H, Fixed, 95% CI) | 0.80 [0.47, 1.36] |
| 2.7 due to AE 25mg 16 weeks | 2 | 766 | Risk Ratio (M‐H, Fixed, 95% CI) | 0.65 [0.42, 0.99] |
| 2.8 due to AE 50mg 18/24 weeks | 2 | 755 | Risk Ratio (M‐H, Fixed, 95% CI) | 0.95 [0.64, 1.40] |
| 2.11 due to LOE 12.5mg 6 weeks | 2 | 933 | Risk Ratio (M‐H, Fixed, 95% CI) | 0.90 [0.54, 1.52] |
| 2.12 due to LOE 25mg 6 weeks | 2 | 939 | Risk Ratio (M‐H, Fixed, 95% CI) | 0.57 [0.31, 1.03] |
| 2.13 due to LOE 25mg 16 weeks | 2 | 766 | Risk Ratio (M‐H, Fixed, 95% CI) | 0.82 [0.39, 1.75] |
| 2.14 due to LOE 50mg 16 weeks | 2 | 755 | Risk Ratio (M‐H, Fixed, 95% CI) | 0.50 [0.20, 1.21] |
| 2.25 due to GI AE 12.5 mg 6 weeks | 1 | 440 | Risk Ratio (M‐H, Fixed, 95% CI) | 0.72 [0.23, 2.24] |
| 2.26 due to GI AE 25 mg 6 weeks | 1 | 448 | Risk Ratio (M‐H, Fixed, 95% CI) | 1.11 [0.41, 3.02] |
| 2.30 due to lower extremity oedema 12.5 mg 6 weeks | 1 | 440 | Risk Ratio (M‐H, Fixed, 95% CI) | 3.03 [0.12, 73.91] |
| 2.31 due to lower extremity oedema 25 mg 6 weeks | 1 | 448 | Risk Ratio (M‐H, Fixed, 95% CI) | 2.92 [0.12, 71.32] |
| 2.32 due to CV AE 12.5 mg | 1 | 440 | Risk Ratio (M‐H, Fixed, 95% CI) | 3.03 [0.12, 73.91] |
| 2.33 due to CV AE 25 mg | 1 | 448 | Risk Ratio (M‐H, Fixed, 95% CI) | 4.87 [0.24, 100.84] |
| 2.34 due to diarrhoea 12.5 mg 6 weeks | 1 | 440 | Risk Ratio (M‐H, Fixed, 95% CI) | 0.0 [0.0, 0.0] |
| 2.35 due to diarrhoea 25 mg 6 weeks | 1 | 448 | Risk Ratio (M‐H, Fixed, 95% CI) | 0.0 [0.0, 0.0] |
| 3 Ulcer 12 weeks (endoscoped) | 2 | Risk Ratio (M‐H, Fixed, 95% CI) | Subtotals only | |
| 3.1 Ulcer >= 3mm rofecoxib 25mg | 2 | 727 | Risk Ratio (M‐H, Fixed, 95% CI) | 0.17 [0.11, 0.27] |
| 3.2 Ulcer >= 3mm rofecoxib 50mg | 2 | 714 | Risk Ratio (M‐H, Fixed, 95% CI) | 0.28 [0.19, 0.42] |
| 3.3 Ulcer >= 5mm rofecoxib 25mg | 2 | 727 | Risk Ratio (M‐H, Fixed, 95% CI) | 0.13 [0.07, 0.24] |
| 3.4 Ulcer >=5mm rofecoxib 50mg | 2 | 714 | Risk Ratio (M‐H, Fixed, 95% CI) | 0.32 [0.20, 0.49] |
| 3.5 Gastric Ulcer >= 3mm rofecoxib 25mg | 2 | 727 | Risk Ratio (M‐H, Fixed, 95% CI) | 0.15 [0.09, 0.25] |
| 3.6 Gastric Ulcer >= 3mm rofecoxib 50mg | 2 | 714 | Risk Ratio (M‐H, Fixed, 95% CI) | 0.23 [0.14, 0.36] |
| 3.7 Duodenal Ulcer >= 3mm rofecoxib 25mg | 2 | 727 | Risk Ratio (M‐H, Fixed, 95% CI) | 0.24 [0.09, 0.63] |
| 3.8 Duodenal Ulcer >= 3mm rofecoxib 50mg | 2 | 714 | Risk Ratio (M‐H, Fixed, 95% CI) | 0.55 [0.27, 1.12] |
| 4 EFFICACY‐ patient/investigator‐ dicotomous | 1 | Risk Ratio (M‐H, Fixed, 95% CI) | Subtotals only | |
| 4.1 Patient global‐ good or excellent response 12.5 mg 6 weeks | 1 | 440 | Risk Ratio (M‐H, Fixed, 95% CI) | 0.96 [0.81, 1.13] |
| 4.2 Patient global‐ good or excellent response 25 mg 6 weeks | 1 | 448 | Risk Ratio (M‐H, Fixed, 95% CI) | 1.07 [0.91, 1.25] |
| 5 EFFICACY‐WOMAC | 1 | Mean Difference (IV, Fixed, 95% CI) | Subtotals only | |
| 5.1 WOMAC pain on walking 12.5mg 6 weeks | 1 | 493 | Mean Difference (IV, Fixed, 95% CI) | 0.77 [‐3.07, 4.61] |
| 5.2 WOMAC pain on walking 25mg 6 weeks | 1 | 491 | Mean Difference (IV, Fixed, 95% CI) | 1.52 [‐2.34, 5.38] |
| 5.3 WOMAC physical function subscale 12.5mg 6 weeks | 1 | 493 | Mean Difference (IV, Fixed, 95% CI) | 0.67 [‐2.50, 3.84] |
| 5.4 WOMAC physical function subscale 25mg 6 weeks | 1 | 491 | Mean Difference (IV, Fixed, 95% CI) | 2.58 [‐0.61, 5.77] |
| 5.5 pain 12.5mg 6 weeks | 1 | 493 | Mean Difference (IV, Fixed, 95% CI) | 0.48 [‐2.79, 3.75] |
| 5.6 pain 25mg 6 weeks | 1 | 491 | Mean Difference (IV, Fixed, 95% CI) | 1.89 [‐1.41, 5.19] |
| 5.7 stiffness 12.5mg 6 weeks | 1 | 493 | Mean Difference (IV, Fixed, 95% CI) | 1.07 [‐2.50, 4.64] |
| 5.8 stiffness 25mg 6 weeks | 1 | 491 | Mean Difference (IV, Fixed, 95% CI) | 0.62 [‐2.96, 4.20] |
| 6 EFFICACY‐ patient/investigator measured‐ continuous | 1 | Mean Difference (IV, Fixed, 95% CI) | Subtotals only | |
| 6.1 Patient Global Response 12.5mg 6 weeks | 1 | 493 | Mean Difference (IV, Fixed, 95% CI) | 0.06 [‐0.10, 0.22] |
| 6.2 Patient Global Response 25mg 6 weeks | 1 | 491 | Mean Difference (IV, Fixed, 95% CI) | 0.22 [0.06, 0.38] |
| 6.3 Investigator Global Disease Status 12.5mg 6 weeks | 1 | 493 | Mean Difference (IV, Fixed, 95% CI) | 0.07 [‐0.06, 0.20] |
| 6.4 Investigator Global Disease Status 25mg 6 weeks | 1 | 491 | Mean Difference (IV, Fixed, 95% CI) | 0.19 [0.06, 0.32] |
| 6.5 patient disease status 12.5mg 6 weeks | 1 | 493 | Mean Difference (IV, Fixed, 95% CI) | 1.65 [‐2.01, 5.31] |
| 6.6 patient disease status 25mg 6 weeks | 1 | 491 | Mean Difference (IV, Fixed, 95% CI) | 3.77 [0.09, 7.45] |
| 6.7 investigator global response 12.5mg 6 weeks | 1 | 493 | Mean Difference (IV, Fixed, 95% CI) | 0.04 [‐0.13, 0.21] |
| 6.8 Investigator global response 25mg 6 weeks | 1 | 491 | Mean Difference (IV, Fixed, 95% CI) | 0.16 [‐0.01, 0.33] |
| 7 Sudy joint tenderness (0‐3) | 1 | Mean Difference (IV, Fixed, 95% CI) | Subtotals only | |
| 7.1 12.5mg 6 weeks | 1 | 493 | Mean Difference (IV, Fixed, 95% CI) | 0.02 [‐0.10, 0.14] |
| 7.2 25mg 6 weeks | 1 | 491 | Mean Difference (IV, Fixed, 95% CI) | 0.11 [‐0.00, 0.22] |
| 8 Paracetamol use‐ tablets per day | 1 | Mean Difference (IV, Fixed, 95% CI) | Subtotals only | |
| 8.1 12.5mg 6 weeks | 1 | 493 | Mean Difference (IV, Fixed, 95% CI) | ‐0.11 [‐0.30, 0.08] |
| 8.2 25mg 6 weeks | 1 | 491 | Mean Difference (IV, Fixed, 95% CI) | ‐0.17 [‐0.36, 0.02] |
| 9 Erosions (endoscoped)‐change from baseline | 1 | Mean Difference (IV, Fixed, 95% CI) | Subtotals only | |
| 9.1 25mg 12 weeks | 1 | 374 | Mean Difference (IV, Fixed, 95% CI) | ‐2.98 [‐3.71, ‐2.25] |
| 9.2 50mg 12 weeks | 1 | 369 | Mean Difference (IV, Fixed, 95% CI) | ‐2.74 [‐3.48, ‐2.00] |
4.1. Analysis.
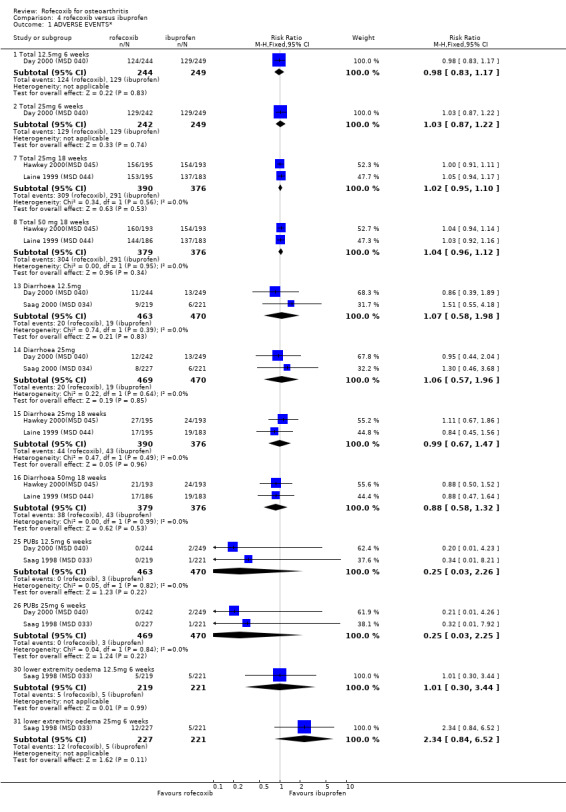
Comparison 4 rofecoxib versus ibuprofen, Outcome 1 ADVERSE EVENTS*.
4.2. Analysis.
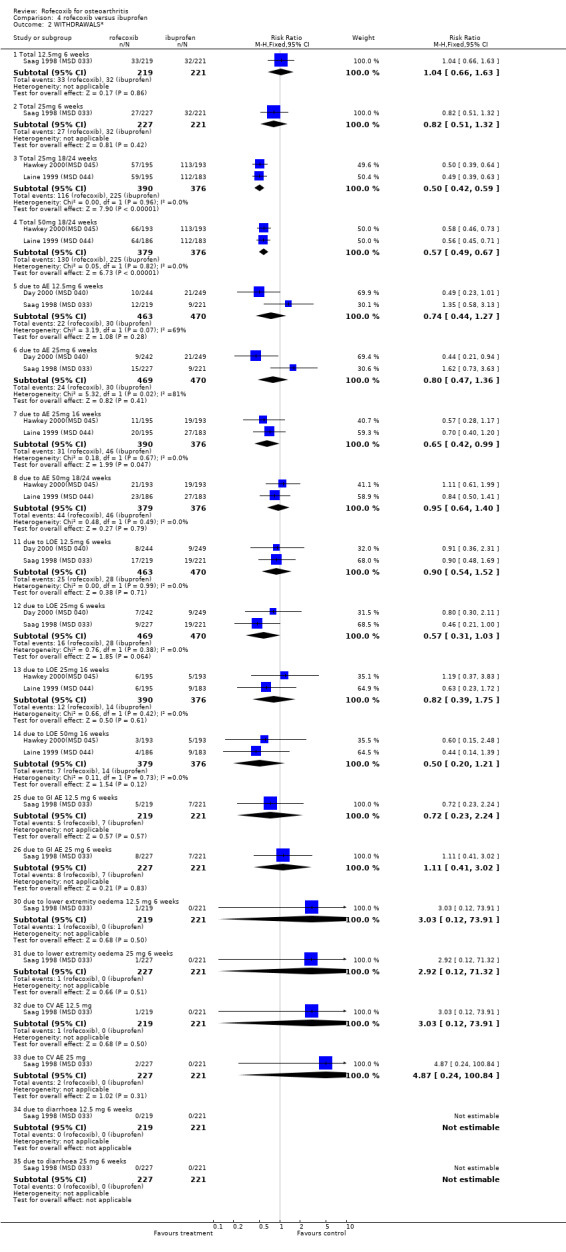
Comparison 4 rofecoxib versus ibuprofen, Outcome 2 WITHDRAWALS*.
4.3. Analysis.
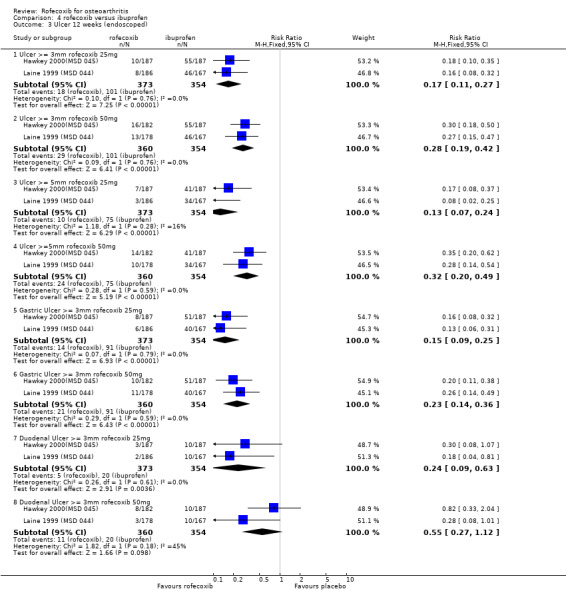
Comparison 4 rofecoxib versus ibuprofen, Outcome 3 Ulcer 12 weeks (endoscoped).
4.4. Analysis.
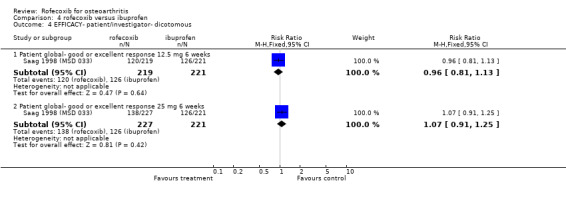
Comparison 4 rofecoxib versus ibuprofen, Outcome 4 EFFICACY‐ patient/investigator‐ dicotomous.
4.5. Analysis.
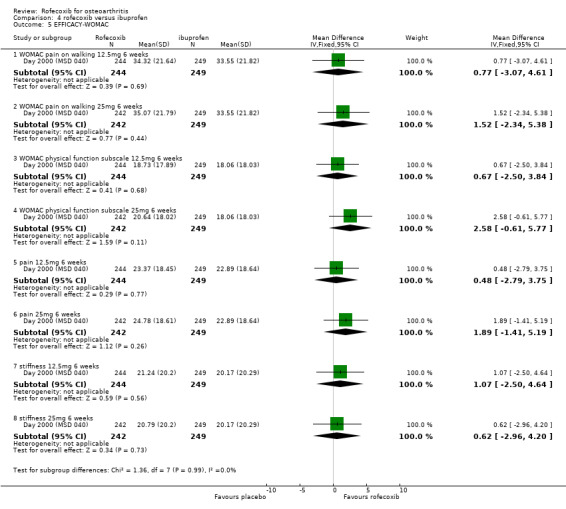
Comparison 4 rofecoxib versus ibuprofen, Outcome 5 EFFICACY‐WOMAC.
4.6. Analysis.
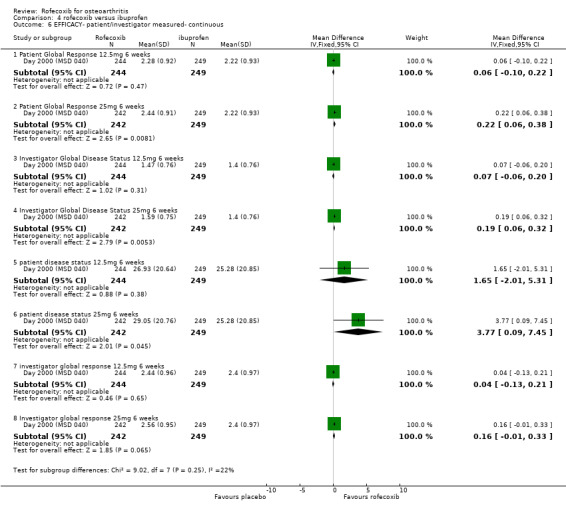
Comparison 4 rofecoxib versus ibuprofen, Outcome 6 EFFICACY‐ patient/investigator measured‐ continuous.
4.7. Analysis.
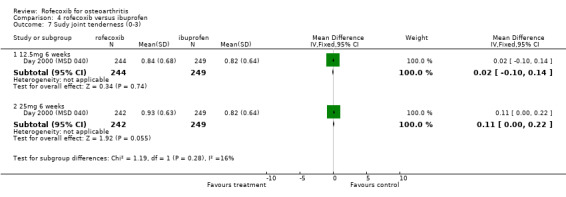
Comparison 4 rofecoxib versus ibuprofen, Outcome 7 Sudy joint tenderness (0‐3).
4.8. Analysis.
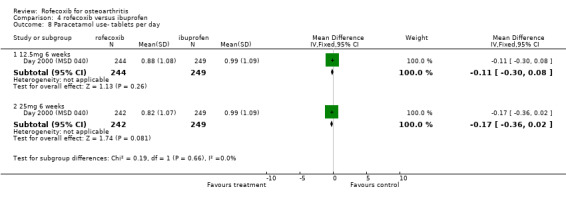
Comparison 4 rofecoxib versus ibuprofen, Outcome 8 Paracetamol use‐ tablets per day.
4.9. Analysis.
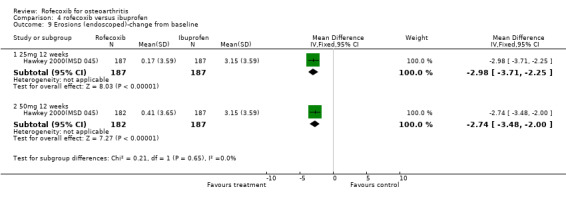
Comparison 4 rofecoxib versus ibuprofen, Outcome 9 Erosions (endoscoped)‐change from baseline.
Comparison 5. rofecoxib versus naproxen.
| Outcome or subgroup title | No. of studies | No. of participants | Statistical method | Effect size |
|---|---|---|---|---|
| 1 Adverse events | 2 | Risk Ratio (M‐H, Fixed, 95% CI) | Subtotals only | |
| 1.1 MI 12.5 mg 6 weeks | 1 | 944 | Risk Ratio (M‐H, Fixed, 95% CI) | 3.01 [0.12, 73.77] |
| 1.2 MI: 25mg 12 weeks | 1 | 5557 | Risk Ratio (M‐H, Fixed, 95% CI) | 4.98 [0.58, 42.57] |
| 1.3 Thrombotic: 25mg 12 weeks | 1 | 5557 | Risk Ratio (M‐H, Fixed, 95% CI) | 1.42 [0.54, 3.73] |
| 1.4 Thrombotic (adjudicated): 25mg 12 weeks | 1 | 5557 | Risk Ratio (M‐H, Fixed, 95% CI) | 0.75 [0.32, 1.77] |
| 1.5 Stroke: 25mg 12 weeks | 1 | 5557 | Risk Ratio (M‐H, Fixed, 95% CI) | 0.08 [0.00, 1.36] |
| 1.6 Lower extremity oedema 12.5 mg 6 weeks | 1 | 944 | Risk Ratio (M‐H, Fixed, 95% CI) | 1.46 [0.69, 3.11] |
| 1.7 Lower extremity oedema : 25mg 12 weeks | 1 | 5557 | Risk Ratio (M‐H, Fixed, 95% CI) | 0.93 [0.71, 1.22] |
| 1.8 Peripheral oedema 12.5 mg 6 weeks | 1 | 944 | Risk Ratio (M‐H, Fixed, 95% CI) | 0.50 [0.05, 5.52] |
| 1.9 Hypertension 12.5 mg 6 weeks | 1 | 944 | Risk Ratio (M‐H, Fixed, 95% CI) | 1.13 [0.44, 2.90] |
| 1.10 Hypertension: 25mg 12 weeks | 1 | 5557 | Risk Ratio (M‐H, Fixed, 95% CI) | 1.22 [0.89, 1.68] |
| 1.11 Total 12.5mg 6 weeks | 1 | 944 | Risk Ratio (M‐H, Fixed, 95% CI) | 0.90 [0.78, 1.03] |
| 1.12 Total GI 12.5mg 6 weeks | 1 | 944 | Risk Ratio (M‐H, Fixed, 95% CI) | 0.55 [0.42, 0.73] |
| 1.13 PUB 12.5mg 6 weeks | 1 | 944 | Risk Ratio (M‐H, Fixed, 95% CI) | 0.14 [0.01, 2.77] |
| 1.14 Exceeding predefined limits of change diastolic : 25mg 12 weeks | 1 | 5308 | Risk Ratio (M‐H, Fixed, 95% CI) | 1.12 [0.84, 1.51] |
| 1.15 Exceeding predefined limits of change systolic : 25mg 12 weeks | 1 | 5308 | Risk Ratio (M‐H, Fixed, 95% CI) | 1.15 [0.98, 1.35] |
| 1.16 PUB 25mg 12 weeks | 1 | 5557 | Risk Ratio (M‐H, Fixed, 95% CI) | 0.22 [0.05, 1.02] |
| 1.17 Pre study hypertensive sub group: Hypertension: 25mg 12 weeks | 1 | 2714 | Risk Ratio (M‐H, Fixed, 95% CI) | 1.13 [0.75, 1.70] |
| 1.18 Pre study hypertensive sub group: Lower extremity oedema 25mg 12 weeks | 1 | 2714 | Risk Ratio (M‐H, Fixed, 95% CI) | 0.96 [0.68, 1.37] |
| 1.19 Pre‐study hypertensive group: Exceeding predefined limits of change diastolic : 25mg 12 weeks | 1 | 2605 | Risk Ratio (M‐H, Fixed, 95% CI) | 1.29 [0.88, 1.88] |
| 1.20 Pre‐study hypertensive group: Exceeding predefined limits of change systolic : 25mg 12 weeks | 1 | 2605 | Risk Ratio (M‐H, Fixed, 95% CI) | 1.08 [0.88, 1.32] |
| 1.21 laboratory 12.5 mg 6 weeks | 1 | 944 | Risk Ratio (M‐H, Fixed, 95% CI) | 0.87 [0.57, 1.31] |
| 1.22 Serious AEs 12.5 mg 6 weeks | 1 | 944 | Risk Ratio (M‐H, Fixed, 95% CI) | 0.70 [0.27, 1.83] |
| 2 Withdrawals | 2 | Risk Ratio (M‐H, Fixed, 95% CI) | Subtotals only | |
| 2.1 Total 12.5mg 6 weeks | 1 | 944 | Risk Ratio (M‐H, Fixed, 95% CI) | 0.87 [0.62, 1.23] |
| 2.2 Total 25mg 12 weeks | 1 | 5557 | Risk Ratio (M‐H, Fixed, 95% CI) | 0.96 [0.88, 1.04] |
| 2.3 due to LOE 12.5mg 6 weeks | 1 | 944 | Risk Ratio (M‐H, Fixed, 95% CI) | 0.67 [0.19, 2.36] |
| 2.4 due to LOE 25mg 12 weeks | 1 | 5557 | Risk Ratio (M‐H, Fixed, 95% CI) | 1.00 [0.82, 1.22] |
| 2.5 due to AEs 12.5mg 6 weeks | 1 | 944 | Risk Ratio (M‐H, Fixed, 95% CI) | 0.77 [0.47, 1.26] |
| 2.6 due to AEs 25mg 12 weeks | 1 | 5557 | Risk Ratio (M‐H, Fixed, 95% CI) | 0.96 [0.85, 1.10] |
| 2.7 due to GI AEs 12.5mg 6 weeks | 1 | 944 | Risk Ratio (M‐H, Fixed, 95% CI) | 0.28 [0.10, 0.75] |
| 2.8 due to GI AEs 25mg 12 weeks | 1 | 5557 | Risk Ratio (M‐H, Fixed, 95% CI) | 0.73 [0.60, 0.88] |
| 2.9 due to GI AEs with concomitant low dose aspirin 25mg 12 weeks | 1 | 719 | Risk Ratio (M‐H, Fixed, 95% CI) | 0.57 [0.32, 1.01] |
| 2.11 due to laboratory test adverse event 25mg 12 weeks | 1 | 5557 | Risk Ratio (M‐H, Fixed, 95% CI) | 2.19 [0.76, 6.29] |
| 2.12 due to hypertension : 12.5mg 6 weeks | 1 | 944 | Risk Ratio (M‐H, Fixed, 95% CI) | 5.02 [0.24, 104.31] |
| 2.13 due to hypertension: 25mg 12 weeks | 1 | 5557 | Risk Ratio (M‐H, Fixed, 95% CI) | 2.49 [0.97, 6.40] |
| 2.14 due to peripheral/lower extremity oedema : 12.5mg 6 weeks | 1 | 944 | Risk Ratio (M‐H, Fixed, 95% CI) | 7.03 [0.36, 135.72] |
| 2.15 due to lower extremity oedema : 25mg 12 weeks | 1 | 5557 | Risk Ratio (M‐H, Fixed, 95% CI) | 1.62 [0.67, 3.90] |
| 2.16 Pre study hypertensive sub group: due to Hypertension: 25mg 12 weeks | 1 | 2714 | Risk Ratio (M‐H, Fixed, 95% CI) | 1.80 [0.53, 6.13] |
| 2.17 Pre study hypertensive sub group: due to lower extremity oedema: 25mg 12 weeks | 1 | 2714 | Risk Ratio (M‐H, Fixed, 95% CI) | 1.18 [0.43, 3.23] |
| 2.18 due to laboratory test adverse event 12.5mg 6 weeks | 1 | 944 | Risk Ratio (M‐H, Fixed, 95% CI) | 1.00 [0.06, 16.01] |
| 3 Concomitant GI medication use | 1 | Risk Ratio (M‐H, Fixed, 95% CI) | Subtotals only | |
| 3.1 25mg 6 weeks | 1 | 5557 | Risk Ratio (M‐H, Fixed, 95% CI) | 0.80 [0.66, 0.97] |
| 3.2 25mg 12 weeks | 1 | 5557 | Risk Ratio (M‐H, Fixed, 95% CI) | 0.81 [0.69, 0.95] |
| 3.3 25mg 12 weeks:concomitant low dose aspirin | 1 | 719 | Risk Ratio (M‐H, Fixed, 95% CI) | 0.82 [0.57, 1.18] |
| 4 Use of rescue medication | 1 | Risk Ratio (M‐H, Fixed, 95% CI) | Subtotals only | |
| 4.1 12.5mg 6 weeks | 1 | 944 | Risk Ratio (M‐H, Fixed, 95% CI) | 1.05 [0.93, 1.18] |
5.1. Analysis.
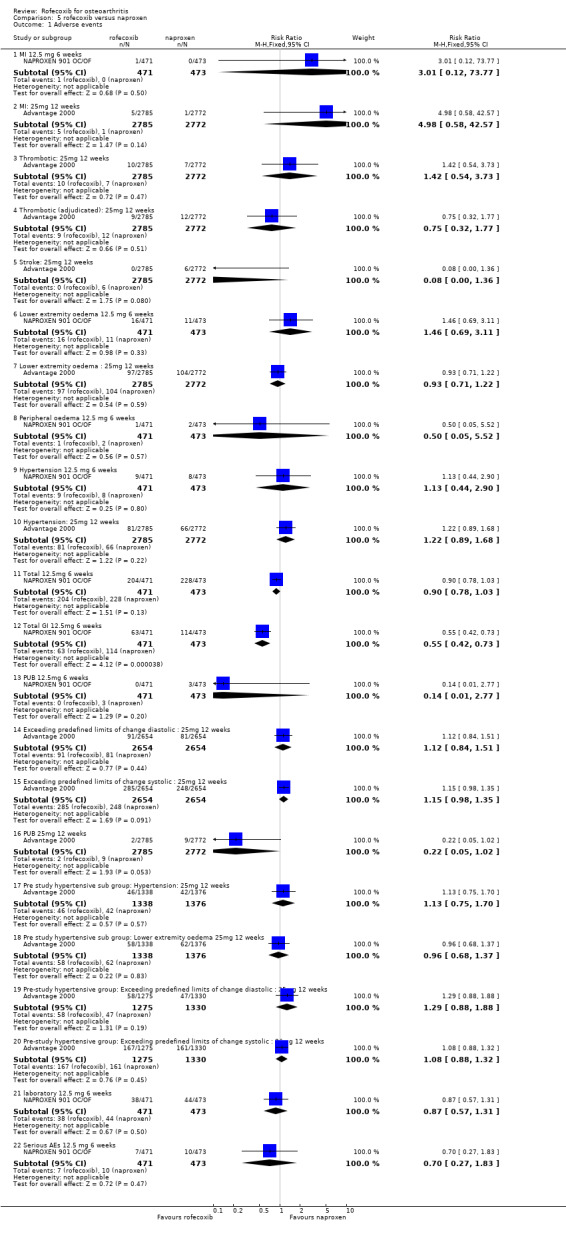
Comparison 5 rofecoxib versus naproxen, Outcome 1 Adverse events.
5.2. Analysis.
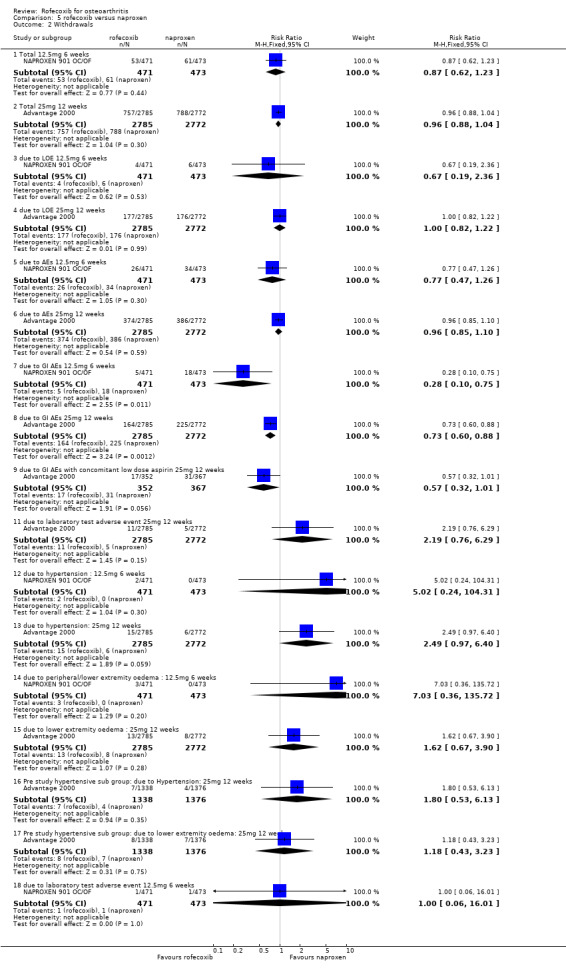
Comparison 5 rofecoxib versus naproxen, Outcome 2 Withdrawals.
5.3. Analysis.
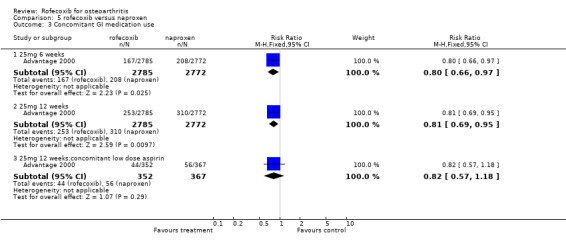
Comparison 5 rofecoxib versus naproxen, Outcome 3 Concomitant GI medication use.
5.4. Analysis.
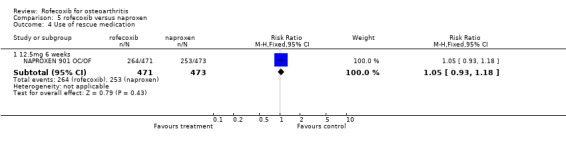
Comparison 5 rofecoxib versus naproxen, Outcome 4 Use of rescue medication.
Comparison 6. rofecoxib versus nimesulide.
| Outcome or subgroup title | No. of studies | No. of participants | Statistical method | Effect size |
|---|---|---|---|---|
| 1 Withdrawals | 1 | Risk Ratio (M‐H, Fixed, 95% CI) | Subtotals only | |
| 1.1 TOTAL | 1 | 114 | Risk Ratio (M‐H, Fixed, 95% CI) | 1.33 [0.31, 5.69] |
| 1.2 due to LOE | 1 | 114 | Risk Ratio (M‐H, Fixed, 95% CI) | 1.0 [0.15, 6.86] |
| 2 Adverse Events | 2 | Risk Ratio (M‐H, Fixed, 95% CI) | Subtotals only | |
| 2.1 goor or very good tolerability 7 days | 1 | 60 | Risk Ratio (M‐H, Fixed, 95% CI) | 1.0 [0.76, 1.32] |
| 2.2 TOTAL AE | 1 | 114 | Risk Ratio (M‐H, Fixed, 95% CI) | 2.0 [0.19, 21.44] |
| 3 EFFICACY | 2 | Risk Ratio (M‐H, Fixed, 95% CI) | Subtotals only | |
| 3.1 goor or very good analgesic efficacy 7 days | 1 | 60 | Risk Ratio (M‐H, Fixed, 95% CI) | 0.94 [0.57, 1.53] |
| 3.2 Investigator assessment improved 30 days | 1 | 114 | Risk Ratio (M‐H, Fixed, 95% CI) | 0.77 [0.61, 0.97] |
| 3.3 Patient assessment improved 30 days | 1 | 114 | Risk Ratio (M‐H, Fixed, 95% CI) | 0.83 [0.67, 1.03] |
| 4 Use of paracetamol rescue | 2 | 174 | Risk Ratio (M‐H, Fixed, 95% CI) | 0.95 [0.54, 1.68] |
6.1. Analysis.
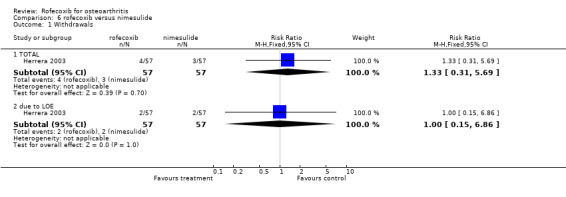
Comparison 6 rofecoxib versus nimesulide, Outcome 1 Withdrawals.
6.2. Analysis.
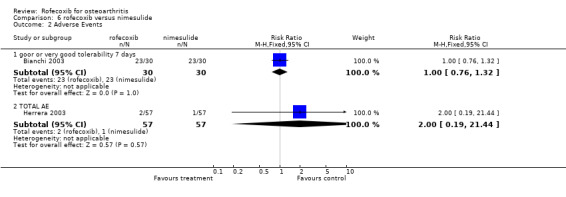
Comparison 6 rofecoxib versus nimesulide, Outcome 2 Adverse Events.
6.3. Analysis.
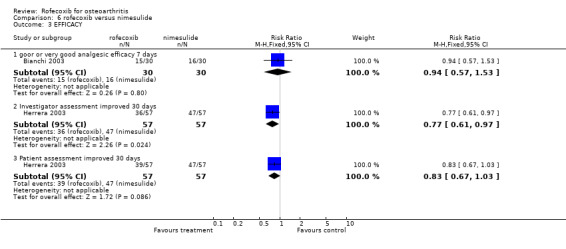
Comparison 6 rofecoxib versus nimesulide, Outcome 3 EFFICACY.
6.4. Analysis.
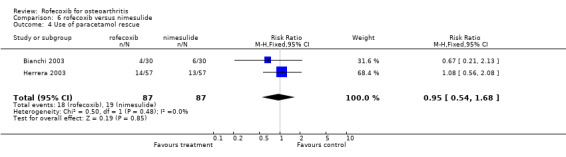
Comparison 6 rofecoxib versus nimesulide, Outcome 4 Use of paracetamol rescue.
Comparison 7. rofecoxib versus nabumetone.
| Outcome or subgroup title | No. of studies | No. of participants | Statistical method | Effect size |
|---|---|---|---|---|
| 1 WITHDRAWALS* | 3 | Risk Ratio (M‐H, Fixed, 95% CI) | Subtotals only | |
| 1.1 Total: 12.5mg rofecoxib vs 1000mg nabumetone 6 weeks | 1 | 834 | Risk Ratio (M‐H, Fixed, 95% CI) | 0.84 [0.64, 1.11] |
| 1.2 Total 12.5mg rofecoxib versus 1500mg nabumetone 6 weeks | 1 | 233 | Risk Ratio (M‐H, Fixed, 95% CI) | 1.10 [0.58, 2.11] |
| 1.3 Total: 25mg rofecoxib versus 1500mg nabumetone 6 weeks | 1 | 171 | Risk Ratio (M‐H, Fixed, 95% CI) | 1.10 [0.49, 2.43] |
| 1.4 due to AE:12.5 mg rofecoxib vs 1000mg nabumetone 6 weeks | 2 | 1616 | Risk Ratio (M‐H, Fixed, 95% CI) | 1.24 [0.84, 1.84] |
| 1.5 due to AE:12.5 mg rofecoxib vs 1500mg nabumetone 6 weeks | 1 | 233 | Risk Ratio (M‐H, Fixed, 95% CI) | 1.10 [0.44, 2.74] |
| 1.6 due to AE: 25mg rofecoxib versus 1500mg nabumetone 6 weeks | 1 | 171 | Risk Ratio (M‐H, Fixed, 95% CI) | 1.28 [0.44, 3.74] |
| 1.7 due to LOE: 12.5mg rofecoxib vs 1000mg nabumetone 6 weeks | 1 | 834 | Risk Ratio (M‐H, Fixed, 95% CI) | 0.64 [0.41, 0.98] |
| 1.8 due to LOE: 12.5mg rofecoxib versus 1500mg nabumetone 6 weeks | 1 | 233 | Risk Ratio (M‐H, Fixed, 95% CI) | 0.97 [0.14, 6.80] |
| 1.9 due to LOE: 25mg rofecoxib versus 1500mg nabumetone 6 weeks | 1 | 171 | Risk Ratio (M‐H, Fixed, 95% CI) | 0.41 [0.02, 8.34] |
| 2 ADVERSE EVENTS* | 3 | Risk Ratio (M‐H, Fixed, 95% CI) | Subtotals only | |
| 2.1 TOTAL 12.5mg rofecoxib vs 1000mg nabumetone 6 weeks | 2 | 1616 | Risk Ratio (M‐H, Fixed, 95% CI) | 1.09 [0.99, 1.20] |
| 2.2 TOTAL GI 12.5mg rofecoxib vs 1000mg nabumetone 6 weeks | 1 | 834 | Risk Ratio (M‐H, Fixed, 95% CI) | 1.34 [0.77, 2.30] |
| 2.3 Serious 12.5mg rofecoxib versus 1000mg nabumetone 6 weeks | 2 | 1616 | Risk Ratio (M‐H, Fixed, 95% CI) | 1.28 [0.57, 2.89] |
| 2.4 Serious 12.5mg rofecoxib versus 1500mg nabumetone 6 weeks | 1 | 233 | Risk Ratio (M‐H, Fixed, 95% CI) | 1.36 [0.45, 4.18] |
| 2.5 Serious: 25mg rofecoxib versus 1500mg nabumetone 6 weeks | 1 | 171 | Risk Ratio (M‐H, Fixed, 95% CI) | 0.41 [0.05, 3.43] |
| 2.6 LOWER EXTREMITY OEDEMA: rofecoxib 12.5mg vs nabumetone 1000mg 6 weeks | 2 | 1616 | Risk Ratio (M‐H, Fixed, 95% CI) | 1.41 [0.72, 2.77] |
| 2.7 LOWER EXTREMITY OEDEMA: rofecoxib 12.5mg vs nabumetone 1500mg 6 weeks | 1 | 233 | Risk Ratio (M‐H, Fixed, 95% CI) | 1.75 [0.61, 5.08] |
| 2.8 LOWER EXTREMITY OEDEMA: rofecoxib 25mg vs nabumetone 1500mg 6 weeks | 1 | 171 | Risk Ratio (M‐H, Fixed, 95% CI) | 1.23 [0.31, 4.97] |
| 2.9 Drug related lower extremity oedema: rofecoxib 12.5mg vs nabumetone 1500mg 6 weeks | 1 | 233 | Risk Ratio (M‐H, Fixed, 95% CI) | 2.44 [0.48, 12.31] |
| 2.10 Drug related lower extremity oedema: rofecoxib 25mg vs nabumetone 1500mg 6 weeks | 1 | 171 | Risk Ratio (M‐H, Fixed, 95% CI) | 2.05 [0.30, 14.20] |
| 2.11 OEDEMA: rofecoxib 12.5mg vs nabumetone 25mg 6 weeks | 1 | 233 | Risk Ratio (M‐H, Fixed, 95% CI) | 0.0 [0.0, 0.0] |
| 2.12 OEDEMA: rofecoxib 25mg vs nabumetone 1500mg 6 weeks | 1 | 171 | Risk Ratio (M‐H, Fixed, 95% CI) | 6.11 [0.25, 147.53] |
| 2.13 Diarrhoea 12.5mg rofecoxib vs 1000 mg nabumetone 6 weeks | 1 | 834 | Risk Ratio (M‐H, Fixed, 95% CI) | 1.31 [0.67, 2.58] |
| 2.14 Diarrhoea 12.5mg rofecoxib vs 1500 mg nabumetone 6 weeks | 1 | 233 | Risk Ratio (M‐H, Fixed, 95% CI) | 0.65 [0.24, 1.77] |
| 2.15 Diarrhoea 25mg rofecoxib vs 1500 mg nabumetone 6 weeks | 1 | 171 | Risk Ratio (M‐H, Fixed, 95% CI) | 0.46 [0.10, 2.04] |
| 2.16 HYPERTENSION: rofecoxib 12.5mg vs nabumetone 1000mg 6 weeks | 2 | 1616 | Risk Ratio (M‐H, Fixed, 95% CI) | 1.48 [0.53, 4.12] |
| 2.17 Blood pressure increase: rofecoxib 12.5mg vs nabumetone 1500mg 6 weeks | 1 | 233 | Risk Ratio (M‐H, Fixed, 95% CI) | 0.19 [0.01, 4.02] |
| 2.18 Blood pressure increase: rofecoxib 25mg vs nabumetone 1500mg 6 weeks | 1 | 171 | Risk Ratio (M‐H, Fixed, 95% CI) | 1.03 [0.10, 11.08] |
| 2.19 aged >65: TOTAL 12.5mg rofecoxib vs 1000mg nabumetone 6 weeks | 1 | 834 | Risk Ratio (M‐H, Fixed, 95% CI) | 1.00 [0.86, 1.15] |
| 2.23 CV 12.5mg mg rofecoxib 1000mg nabumetone 6 weeks | 1 | 834 | Risk Ratio (M‐H, Fixed, 95% CI) | 2.90 [0.12, 71.01] |
| 2.24 CV 25mg | 0 | 0 | Risk Ratio (M‐H, Fixed, 95% CI) | 0.0 [0.0, 0.0] |
| 4 EFFICACY‐WOMAC | 1 | Mean Difference (IV, Fixed, 95% CI) | Subtotals only | |
| 4.1 physical function 12.5mg 6 weeks | 1 | 233 | Mean Difference (IV, Fixed, 95% CI) | ‐0.49 [‐7.56, 6.58] |
| 4.2 physical function 25mg 6 weeks | 1 | 171 | Mean Difference (IV, Fixed, 95% CI) | ‐0.81 [‐9.05, 7.43] |
| 4.3 pain 12.5mg 6 weeks | 1 | 233 | Mean Difference (IV, Fixed, 95% CI) | 0.42 [‐7.41, 8.25] |
| 4.4 pain 25mg 6 weeks | 1 | 171 | Mean Difference (IV, Fixed, 95% CI) | 1.71 [‐7.42, 10.84] |
| 4.5 stiffness 12.5mg 6 weeks | 1 | 233 | Mean Difference (IV, Fixed, 95% CI) | ‐0.72 [‐9.24, 7.80] |
| 4.6 stiffness 25mg 6 weeks | 1 | 171 | Mean Difference (IV, Fixed, 95% CI) | 1.20 [‐8.73, 11.13] |
| 5 EFFICACY ‐ patient/investigator measured ‐ dicotomous | 2 | Risk Ratio (M‐H, Fixed, 95% CI) | Subtotals only | |
| 5.1 Response‐ patient measured good/ excellent 12.5mg rofecoxib vs 1000mg nabumetone 6 weeks: average of 6 weeks | 2 | 1616 | Risk Ratio (M‐H, Fixed, 95% CI) | 1.17 [1.05, 1.29] |
| 5.2 response‐ investigator measured good/excellent 12.5mg rofecoxib vs 1000mg nabumetone 6 weeks: average of 6 wee | 1 | 834 | Risk Ratio (M‐H, Fixed, 95% CI) | 1.16 [1.02, 1.32] |
| 6 EFFICACY‐ patient/investigator measured ‐ continuous | 1 | Mean Difference (IV, Fixed, 95% CI) | Subtotals only | |
| 6.1 patient‐ global disease status 12.5mg 6 weeks | 1 | 233 | Mean Difference (IV, Fixed, 95% CI) | ‐0.61 [‐9.73, 8.51] |
| 6.2 patient‐ global disease status 25mg 6 weeks | 1 | 171 | Mean Difference (IV, Fixed, 95% CI) | ‐0.55 [‐11.23, 10.13] |
| 6.3 study joint tenderness 12.5mg 6 weeks | 1 | 233 | Mean Difference (IV, Fixed, 95% CI) | 0.14 [‐0.14, 0.42] |
| 6.4 study joint tenderness 25mg 6 weeks | 1 | 171 | Mean Difference (IV, Fixed, 95% CI) | 0.16 [‐0.16, 0.48] |
| 6.5 investigator‐ global disease status‐ 12.5mg 6 weeks | 1 | 233 | Mean Difference (IV, Fixed, 95% CI) | 0.01 [‐0.32, 0.34] |
| 6.6 investigator‐global disease status‐ 25mg 6 weeks | 1 | 171 | Mean Difference (IV, Fixed, 95% CI) | 0.16 [‐0.23, 0.55] |
| 7 Paracetamol use‐ tablets per day | 1 | Mean Difference (IV, Fixed, 95% CI) | Subtotals only | |
| 7.1 12.5mg 6 weeks | 1 | 233 | Mean Difference (IV, Fixed, 95% CI) | ‐0.05 [‐0.40, 0.30] |
| 7.2 25mg 6 weeks | 1 | 171 | Mean Difference (IV, Fixed, 95% CI) | ‐0.04 [‐0.45, 0.37] |
| 8 Paracetamol use‐ number of patients | 1 | Risk Ratio (M‐H, Fixed, 95% CI) | Subtotals only | |
| 8.1 12.5mg rofecoxib vs 1000mg nabumetone 6 weeks: average of 6 weeks | 1 | 834 | Risk Ratio (M‐H, Fixed, 95% CI) | 1.01 [0.93, 1.09] |
7.1. Analysis.
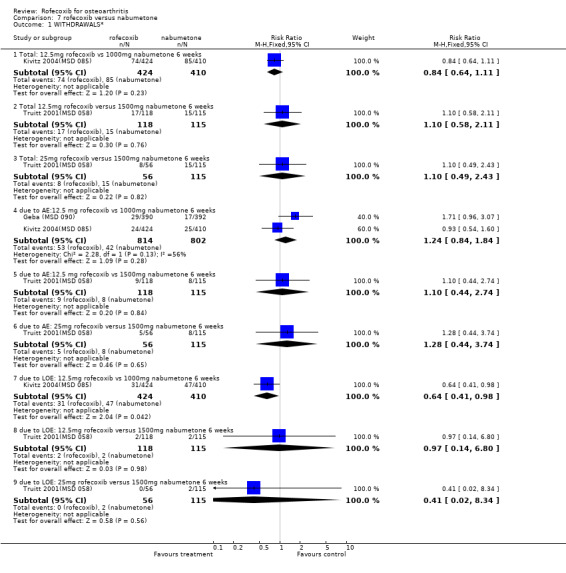
Comparison 7 rofecoxib versus nabumetone, Outcome 1 WITHDRAWALS*.
7.2. Analysis.
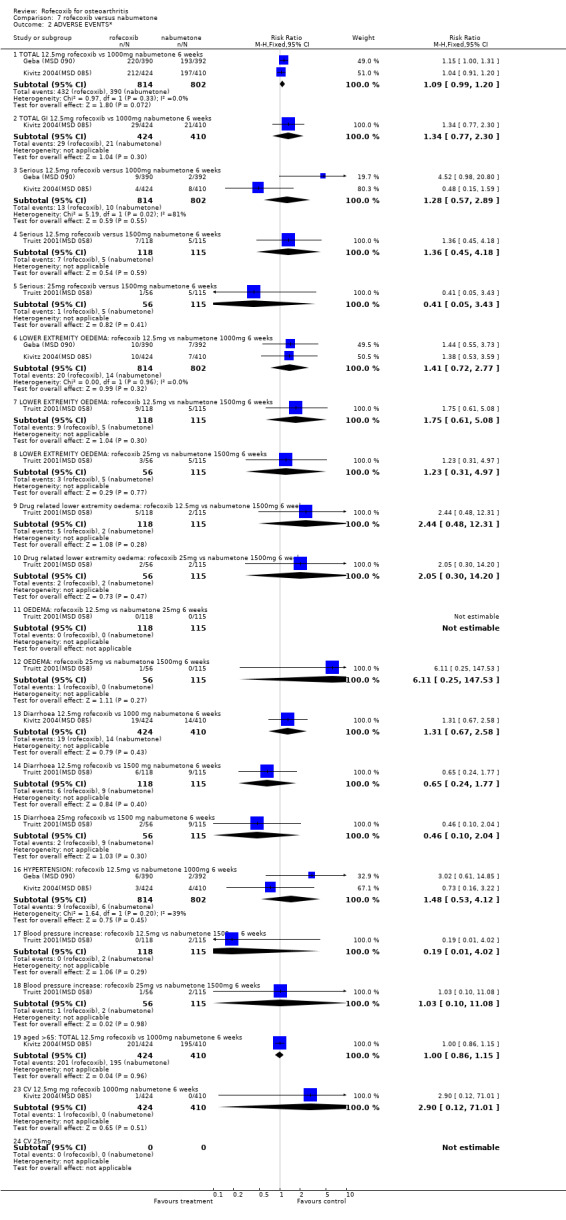
Comparison 7 rofecoxib versus nabumetone, Outcome 2 ADVERSE EVENTS*.
7.4. Analysis.
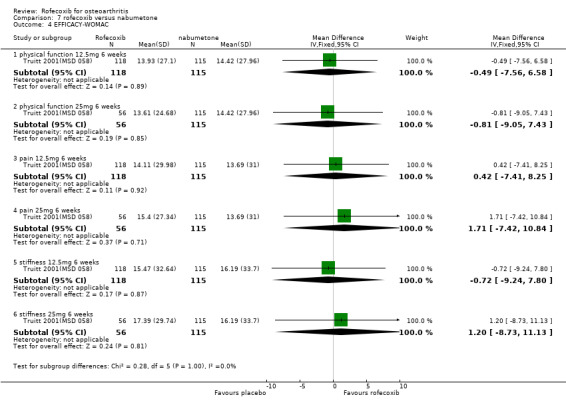
Comparison 7 rofecoxib versus nabumetone, Outcome 4 EFFICACY‐WOMAC.
7.5. Analysis.
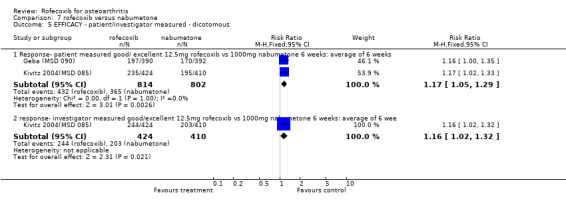
Comparison 7 rofecoxib versus nabumetone, Outcome 5 EFFICACY ‐ patient/investigator measured ‐ dicotomous.
7.6. Analysis.
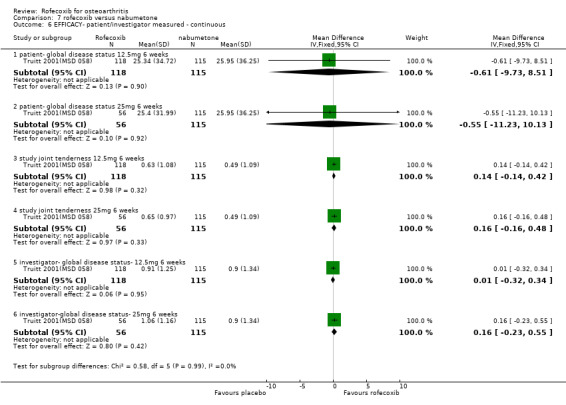
Comparison 7 rofecoxib versus nabumetone, Outcome 6 EFFICACY‐ patient/investigator measured ‐ continuous.
7.7. Analysis.
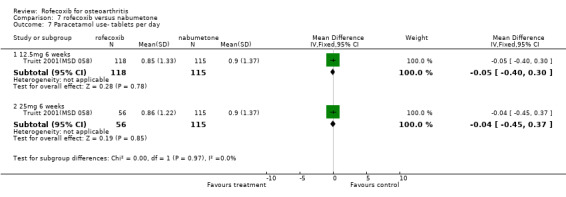
Comparison 7 rofecoxib versus nabumetone, Outcome 7 Paracetamol use‐ tablets per day.
7.8. Analysis.
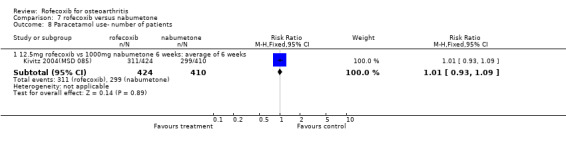
Comparison 7 rofecoxib versus nabumetone, Outcome 8 Paracetamol use‐ number of patients.
Comparison 8. rofecoxib versus paracetamol.
| Outcome or subgroup title | No. of studies | No. of participants | Statistical method | Effect size |
|---|---|---|---|---|
| 1 Adverse events | 1 | Risk Ratio (M‐H, Fixed, 95% CI) | Totals not selected | |
| 1.1 TOTAL 12.5mg 6 weeks | 1 | Risk Ratio (M‐H, Fixed, 95% CI) | 0.0 [0.0, 0.0] | |
| 1.2 TOTAL 25mg 6 weeks | 1 | Risk Ratio (M‐H, Fixed, 95% CI) | 0.0 [0.0, 0.0] | |
| 1.3 Hypertension 12.5mg 6 weeks | 1 | Risk Ratio (M‐H, Fixed, 95% CI) | 0.0 [0.0, 0.0] | |
| 1.4 Hypertension 25mg 6 weeks | 1 | Risk Ratio (M‐H, Fixed, 95% CI) | 0.0 [0.0, 0.0] | |
| 1.5 Lower extremity oedema 12.5mg 6 weeks | 1 | Risk Ratio (M‐H, Fixed, 95% CI) | 0.0 [0.0, 0.0] | |
| 1.6 Lower extremity oedema 25mg 6 weeks | 1 | Risk Ratio (M‐H, Fixed, 95% CI) | 0.0 [0.0, 0.0] | |
| 1.7 Pedal oedema 12.5mg 6 weeks | 1 | Risk Ratio (M‐H, Fixed, 95% CI) | 0.0 [0.0, 0.0] | |
| 1.8 Pedal oedema 25mg 6 weeks | 1 | Risk Ratio (M‐H, Fixed, 95% CI) | 0.0 [0.0, 0.0] | |
| 1.9 Ankle oedema 12.5mg 6 weeks | 1 | Risk Ratio (M‐H, Fixed, 95% CI) | 0.0 [0.0, 0.0] | |
| 1.10 Ankle oedema 25mg 6 weeks | 1 | Risk Ratio (M‐H, Fixed, 95% CI) | 0.0 [0.0, 0.0] | |
| 1.11 Diarrhoea 12.5mg 6 weeks | 1 | Risk Ratio (M‐H, Fixed, 95% CI) | 0.0 [0.0, 0.0] | |
| 1.12 Diarrhoea 25mg 6 weeks | 1 | Risk Ratio (M‐H, Fixed, 95% CI) | 0.0 [0.0, 0.0] | |
| 1.13 Serious 12.5mg 6 weeks | 1 | Risk Ratio (M‐H, Fixed, 95% CI) | 0.0 [0.0, 0.0] | |
| 1.14 Serious 25mg 6 weeks | 1 | Risk Ratio (M‐H, Fixed, 95% CI) | 0.0 [0.0, 0.0] | |
| 2 Withdrawals | 1 | Risk Ratio (M‐H, Fixed, 95% CI) | Totals not selected | |
| 2.1 TOTAL 12.5mg 6 weeks | 1 | Risk Ratio (M‐H, Fixed, 95% CI) | 0.0 [0.0, 0.0] | |
| 2.2 TOTAL 25mg 6 weeks | 1 | Risk Ratio (M‐H, Fixed, 95% CI) | 0.0 [0.0, 0.0] | |
| 2.3 due to AE 12.5mg 6 weels | 1 | Risk Ratio (M‐H, Fixed, 95% CI) | 0.0 [0.0, 0.0] | |
| 2.4 due to AE 25mg 6 weeks | 1 | Risk Ratio (M‐H, Fixed, 95% CI) | 0.0 [0.0, 0.0] | |
| 2.5 due to LOE 12.5mg 6 weeks | 1 | Risk Ratio (M‐H, Fixed, 95% CI) | 0.0 [0.0, 0.0] | |
| 2.6 due to LOE 25mg 6 weeks | 1 | Risk Ratio (M‐H, Fixed, 95% CI) | 0.0 [0.0, 0.0] | |
| 3 Efficacy | 1 | Mean Difference (IV, Fixed, 95% CI) | Totals not selected | |
| 3.1 Walking Pain 12.5mg 6 weeks | 1 | Mean Difference (IV, Fixed, 95% CI) | 0.0 [0.0, 0.0] | |
| 3.2 Walking Pain 25mg 6 weeks | 1 | Mean Difference (IV, Fixed, 95% CI) | 0.0 [0.0, 0.0] | |
| 3.3 Rest Pain 12.5mg 6 weeks | 1 | Mean Difference (IV, Fixed, 95% CI) | 0.0 [0.0, 0.0] | |
| 3.4 Rest Pain 25mg 6 weeks | 1 | Mean Difference (IV, Fixed, 95% CI) | 0.0 [0.0, 0.0] | |
| 3.5 Morning Stiffness 12.5mg 6 weeks | 1 | Mean Difference (IV, Fixed, 95% CI) | 0.0 [0.0, 0.0] | |
| 3.6 Morning Stiffness 25mg 6 weeks | 1 | Mean Difference (IV, Fixed, 95% CI) | 0.0 [0.0, 0.0] | |
| 3.7 Night Pain 12.5mg 6 weeks | 1 | Mean Difference (IV, Fixed, 95% CI) | 0.0 [0.0, 0.0] | |
| 3.8 Night Pain 25mg 6 weeks | 1 | Mean Difference (IV, Fixed, 95% CI) | 0.0 [0.0, 0.0] | |
| 3.9 Pain Subscale 12.5mg 6 weeks | 1 | Mean Difference (IV, Fixed, 95% CI) | 0.0 [0.0, 0.0] | |
| 3.10 Pain Subscale 25mg 6 weeks | 1 | Mean Difference (IV, Fixed, 95% CI) | 0.0 [0.0, 0.0] | |
| 3.11 Stiffness Subscale 12.5mg 6 weeks | 1 | Mean Difference (IV, Fixed, 95% CI) | 0.0 [0.0, 0.0] | |
| 3.12 Stiffness Subscale 25mg 6 weeks | 1 | Mean Difference (IV, Fixed, 95% CI) | 0.0 [0.0, 0.0] | |
| 3.13 Function Subscale 12.5mg 6 weeks | 1 | Mean Difference (IV, Fixed, 95% CI) | 0.0 [0.0, 0.0] | |
| 3.14 Function Subscale 25mg 6 weeks | 1 | Mean Difference (IV, Fixed, 95% CI) | 0.0 [0.0, 0.0] | |
| 4 EFFICACY‐ patient/investigator assessed dicotomous | 1 | Risk Ratio (M‐H, Fixed, 95% CI) | Totals not selected | |
| 4.1 Patient global response to therapy 12.5 mg 6 weeks | 1 | Risk Ratio (M‐H, Fixed, 95% CI) | 0.0 [0.0, 0.0] | |
| 4.2 patient global response to therapy 25 mg 6 weeks | 1 | Risk Ratio (M‐H, Fixed, 95% CI) | 0.0 [0.0, 0.0] |
8.1. Analysis.
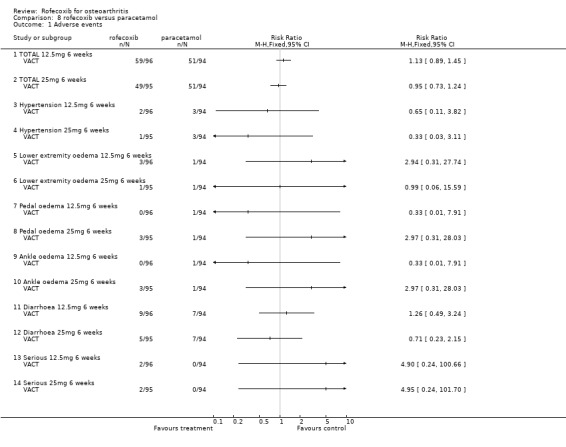
Comparison 8 rofecoxib versus paracetamol, Outcome 1 Adverse events.
8.2. Analysis.
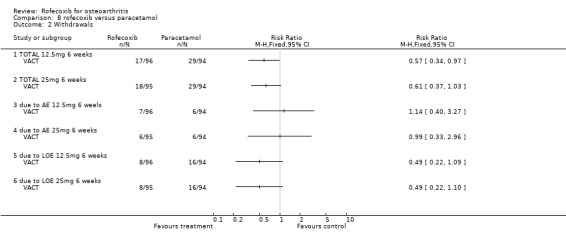
Comparison 8 rofecoxib versus paracetamol, Outcome 2 Withdrawals.
8.3. Analysis.
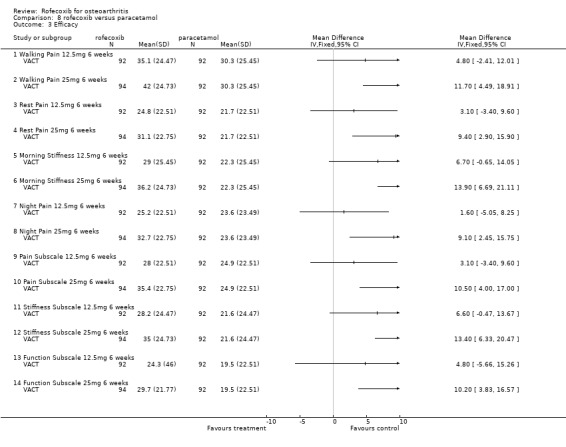
Comparison 8 rofecoxib versus paracetamol, Outcome 3 Efficacy.
8.4. Analysis.
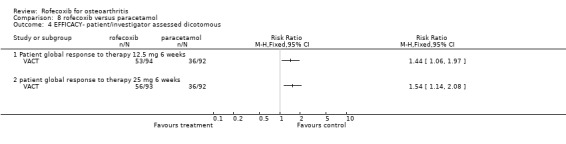
Comparison 8 rofecoxib versus paracetamol, Outcome 4 EFFICACY‐ patient/investigator assessed dicotomous.
Comparison 9. rofecoxib versus celecoxib.
| Outcome or subgroup title | No. of studies | No. of participants | Statistical method | Effect size |
|---|---|---|---|---|
| 1 Withdrawals | 6 | Risk Ratio (M‐H, Fixed, 95% CI) | Subtotals only | |
| 1.1 due to AE 12.5mg 6 weeks | 1 | 193 | Risk Ratio (M‐H, Fixed, 95% CI) | 1.77 [0.53, 5.85] |
| 1.2 due to AE 25mg 6 weeks | 5 | 2595 | Risk Ratio (M‐H, Fixed, 95% CI) | 1.03 [0.77, 1.39] |
| 1.3 due to LOE 12.5mg 6 weeks | 1 | 193 | Risk Ratio (M‐H, Fixed, 95% CI) | 0.90 [0.36, 2.23] |
| 1.4 due to LOE 25mg 6 weeks | 5 | 2595 | Risk Ratio (M‐H, Fixed, 95% CI) | 0.76 [0.47, 1.24] |
| 1.5 Total 12.5mg 6 weeks | 1 | 193 | Risk Ratio (M‐H, Fixed, 95% CI) | 1.01 [0.55, 1.86] |
| 1.6 Total 25mg 6 weeks | 5 | 2595 | Risk Ratio (M‐H, Fixed, 95% CI) | 0.93 [0.76, 1.14] |
| 1.7 due to cardiorenal AE 25mg 6 weeks | 2 | 1471 | Risk Ratio (M‐H, Fixed, 95% CI) | 1.33 [0.58, 3.07] |
| 1.8 due to GI AE 25mg 6 weeks | 1 | 122 | Risk Ratio (M‐H, Fixed, 95% CI) | 4.27 [0.49, 37.12] |
| 1.9 due to aggrevated hypertension 25mg 6 weeks | 1 | 810 | Risk Ratio (M‐H, Fixed, 95% CI) | 3.09 [0.63, 15.22] |
| 1.10 due to peripheral oedema 25mg 6 weeks | 1 | 810 | Risk Ratio (M‐H, Fixed, 95% CI) | 2.58 [0.50, 13.20] |
| 1.11 due to hypertension | 1 | 931 | Risk Ratio (M‐H, Fixed, 95% CI) | 2.93 [0.12, 71.74] |
| 1.12 due to oedema 25mg 6 weeks | 1 | 192 | Risk Ratio (M‐H, Fixed, 95% CI) | 5.10 [0.25, 104.94] |
| 2 Adverse events | 7 | Risk Ratio (M‐H, Fixed, 95% CI) | Subtotals only | |
| 2.1 TOTAL 12.5mg 6 weeks | 1 | 193 | Risk Ratio (M‐H, Fixed, 95% CI) | 1.19 [0.93, 1.53] |
| 2.2 TOTAL 25mg 6 weeks | 4 | 1503 | Risk Ratio (M‐H, Fixed, 95% CI) | 1.04 [0.95, 1.14] |
| 2.3 Total GI AE 25mg 6 weeks | 1 | 122 | Risk Ratio (M‐H, Fixed, 95% CI) | 3.05 [1.39, 6.68] |
| 2.4 Oedema 25mg 6 weeks | 4 | 2473 | Risk Ratio (M‐H, Fixed, 95% CI) | 1.77 [1.27, 2.47] |
| 2.5 Systolic BP increase 25mg 6 weeks | 3 | 2833 | Risk Ratio (M‐H, Fixed, 95% CI) | 1.54 [1.24, 1.90] |
| 2.6 Diastolic BP increase 25mg 6 weeks | 3 | 2833 | Risk Ratio (M‐H, Fixed, 95% CI) | 1.55 [0.91, 2.63] |
| 2.7 CHF 12.5mg 6 weeks | 1 | 193 | Risk Ratio (M‐H, Fixed, 95% CI) | 0.0 [0.0, 0.0] |
| 2.8 CHF 25mg 6 weeks | 3 | 2094 | Risk Ratio (M‐H, Fixed, 95% CI) | 3.06 [0.73, 12.72] |
| 2.9 Laboratory renal 25mg 6 weeks | 1 | 810 | Risk Ratio (M‐H, Fixed, 95% CI) | 1.03 [0.34, 3.17] |
| 2.10 Serious 12.5mg 6 weeks | 1 | 193 | Risk Ratio (M‐H, Fixed, 95% CI) | 5.05 [0.25, 103.86] |
| 2.11 Serious 25mg 6 weeks | 3 | 1381 | Risk Ratio (M‐H, Fixed, 95% CI) | 1.52 [0.79, 2.93] |
| 2.12 Hypertension 25mg 6 weeks | 2 | 571 | Risk Ratio (M‐H, Fixed, 95% CI) | 3.51 [0.73, 16.84] |
| 2.13 Diarrhoea 25mg 6 weeks | 3 | 693 | Risk Ratio (M‐H, Fixed, 95% CI) | 0.79 [0.40, 1.57] |
| 2.14 Dyspepsia 25mg 6 weeks | 4 | 1503 | Risk Ratio (M‐H, Fixed, 95% CI) | 1.24 [0.82, 1.89] |
| 2.15 Headache 25mg 6 weeks | 3 | 693 | Risk Ratio (M‐H, Fixed, 95% CI) | 0.83 [0.64, 1.08] |
| 2.16 PUBS 25mg 6 weeks | 2 | 570 | Risk Ratio (M‐H, Fixed, 95% CI) | 0.0 [0.0, 0.0] |
| 2.17 Upper GI distress | 1 | 122 | Risk Ratio (M‐H, Fixed, 95% CI) | 1.42 [0.33, 6.10] |
| 2.18 Hypertension 12.5mg 6 weeks | 1 | 193 | Risk Ratio (M‐H, Fixed, 95% CI) | 2.02 [0.19, 21.92] |
| 2.19 PUBS 12.5mg 6 weeks | 1 | 192 | Risk Ratio (M‐H, Fixed, 95% CI) | 0.0 [0.0, 0.0] |
| 2.20 Diarrhoea 12.5mg 6 weeks | 1 | 193 | Risk Ratio (M‐H, Fixed, 95% CI) | 1.30 [0.50, 3.35] |
| 2.21 Dyspepsia 12.5mg 6 weeks | 1 | 193 | Risk Ratio (M‐H, Fixed, 95% CI) | 0.67 [0.12, 3.94] |
| 2.22 Headache 12.5mg 6 weeks | 1 | 193 | Risk Ratio (M‐H, Fixed, 95% CI) | 0.37 [0.12, 1.11] |
| 2.23 Lower extremity oedema 12.5mg 6 weeks | 1 | 193 | Risk Ratio (M‐H, Fixed, 95% CI) | 7.07 [0.37, 135.10] |
| 2.24 goor or very good tolerability 7 days | 1 | 60 | Risk Ratio (M‐H, Fixed, 95% CI) | 1.10 [0.81, 1.49] |
| 2.25 Systolic BP increase 25mg 6 weeks: older hypertensives only | 2 | 1902 | Risk Ratio (M‐H, Fixed, 95% CI) | 1.81 [1.40, 2.33] |
| 2.26 Oedema 25mg 6 weeks (standard population) | 2 | 571 | Risk Ratio (M‐H, Fixed, 95% CI) | 1.72 [0.61, 4.85] |
| 2.27 Systolic BP increase 25mg 6 weeks (standard population) | 1 | 931 | Risk Ratio (M‐H, Fixed, 95% CI) | 1.02 [0.69, 1.52] |
| 3 Mean Systolic BP change from baseline | 1 | Mean Difference (IV, Fixed, 95% CI) | Subtotals only | |
| 3.1 Overall | 1 | 1092 | Mean Difference (IV, Fixed, 95% CI) | 3.3 [1.89, 4.71] |
| 4 EFFICACY‐WOMAC | 2 | Mean Difference (IV, Fixed, 95% CI) | Subtotals only | |
| 4.1 Walking Pain 12.5mg 6 weeks | 1 | 186 | Mean Difference (IV, Fixed, 95% CI) | ‐1.10 [‐8.17, 5.97] |
| 4.2 Walking Pain 25mg 6 weeks | 1 | 188 | Mean Difference (IV, Fixed, 95% CI) | 5.80 [‐1.27, 12.87] |
| 4.3 Rest Pain 12.5mg 6 weeks | 1 | 186 | Mean Difference (IV, Fixed, 95% CI) | 1.40 [‐5.10, 7.90] |
| 4.4 Rest Pain 25mg 6 weeks | 1 | 188 | Mean Difference (IV, Fixed, 95% CI) | 7.70 [1.20, 14.20] |
| 4.5 Morning Stiffness 12.5mg 6 weeks | 1 | 186 | Mean Difference (IV, Fixed, 95% CI) | ‐0.10 [‐7.46, 7.26] |
| 4.6 Morning Stiffness 25mg 6 weeks | 1 | 188 | Mean Difference (IV, Fixed, 95% CI) | 7.10 [‐0.11, 14.31] |
| 4.7 Night Pain 12.5mg 6 weeks | 1 | 186 | Mean Difference (IV, Fixed, 95% CI) | 2.60 [‐3.90, 9.10] |
| 4.8 Night Pain 25mg 6 weeks | 1 | 188 | Mean Difference (IV, Fixed, 95% CI) | 10.10 [3.60, 16.60] |
| 4.9 Pain Subscale 12.5mg 6 weeks | 1 | 186 | Mean Difference (IV, Fixed, 95% CI) | ‐0.60 [‐7.10, 5.90] |
| 4.10 Pain Subscale 25mg 6 weeks | 2 | 567 | Mean Difference (IV, Fixed, 95% CI) | 0.01 [‐0.81, 0.84] |
| 4.11 Stiffness Subscale 12.5mg 6 weeks | 1 | 186 | Mean Difference (IV, Fixed, 95% CI) | 0.30 [‐6.77, 7.37] |
| 4.12 Stiffness Subscale 25mg 6 weeks | 2 | 567 | Mean Difference (IV, Fixed, 95% CI) | 0.11 [‐0.17, 0.39] |
| 4.13 Function Subscale 12.5mg 6 weeks | 1 | 186 | Mean Difference (IV, Fixed, 95% CI) | ‐0.60 [‐10.98, 9.78] |
| 4.14 Function Subscale 25mg 6 weeks | 2 | 567 | Mean Difference (IV, Fixed, 95% CI) | 0.12 [‐2.41, 2.66] |
| 5 EFFICACY ‐patient/investigator measures‐ dicotomous | 6 | Risk Ratio (M‐H, Fixed, 95% CI) | Subtotals only | |
| 5.1 goor or very good analgesic efficacy 7 days | 1 | 60 | Risk Ratio (M‐H, Fixed, 95% CI) | 1.07 [0.63, 1.81] |
| 5.2 patient improved pain 25mg 6 weeks | 1 | 122 | Risk Ratio (M‐H, Fixed, 95% CI) | 0.98 [0.82, 1.18] |
| 5.3 patient improved arthritis 25mg 6 weeks | 1 | 379 | Risk Ratio (M‐H, Fixed, 95% CI) | 0.90 [0.72, 1.12] |
| 5.4 physician improved arthritis 25mg 6 weeks | 1 | 379 | Risk Ratio (M‐H, Fixed, 95% CI) | 0.89 [0.71, 1.10] |
| 5.5 patient global response to therapy ‐ good or excellent 12.5 mg 6 weeks | 1 | 188 | Risk Ratio (M‐H, Fixed, 95% CI) | 1.23 [0.93, 1.64] |
| 5.6 patient global response to therapy‐ good or excellent 25 mg 6 weeks | 3 | 2168 | Risk Ratio (M‐H, Fixed, 95% CI) | 1.14 [1.05, 1.24] |
| 6 EFFICACY‐ patient/investigator measures‐ continuous | 1 | Mean Difference (IV, Fixed, 95% CI) | Subtotals only | |
| 6.1 patient‐ pain on walking 25mg 6 weeks | 1 | 379 | Mean Difference (IV, Fixed, 95% CI) | ‐2.30 [‐7.84, 3.24] |
| 7 Adjustment of medication | 1 | Risk Ratio (M‐H, Fixed, 95% CI) | Subtotals only | |
| 7.1 to manage hypertension 25mg 6 weeks | 1 | 1092 | Risk Ratio (M‐H, Fixed, 95% CI) | 1.35 [0.64, 2.82] |
| 7.2 to manage oedema 25mg 6 weeks | 1 | 1092 | Risk Ratio (M‐H, Fixed, 95% CI) | 1.21 [0.53, 2.78] |
| 8 Use of paracetamol rescue | 3 | 818 | Risk Ratio (M‐H, Fixed, 95% CI) | 1.07 [0.65, 1.75] |
9.1. Analysis.
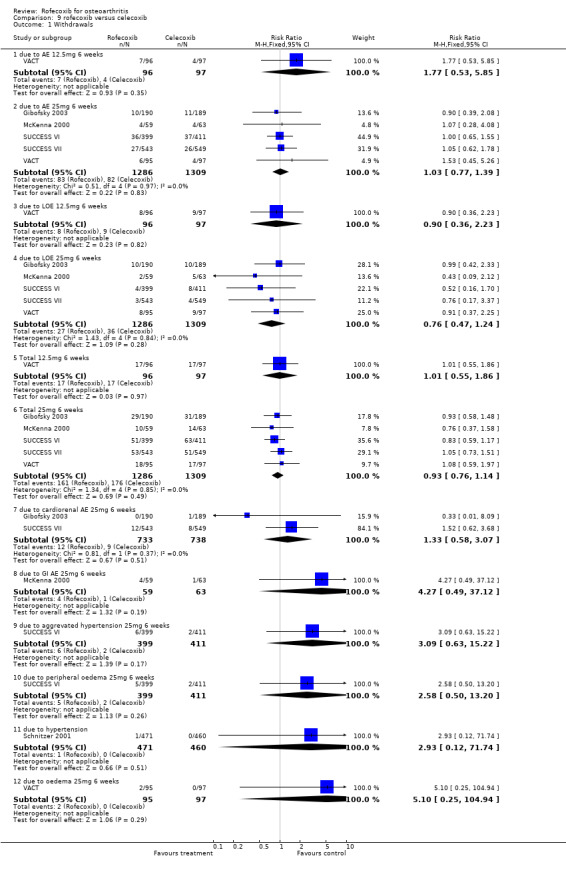
Comparison 9 rofecoxib versus celecoxib, Outcome 1 Withdrawals.
9.2. Analysis.
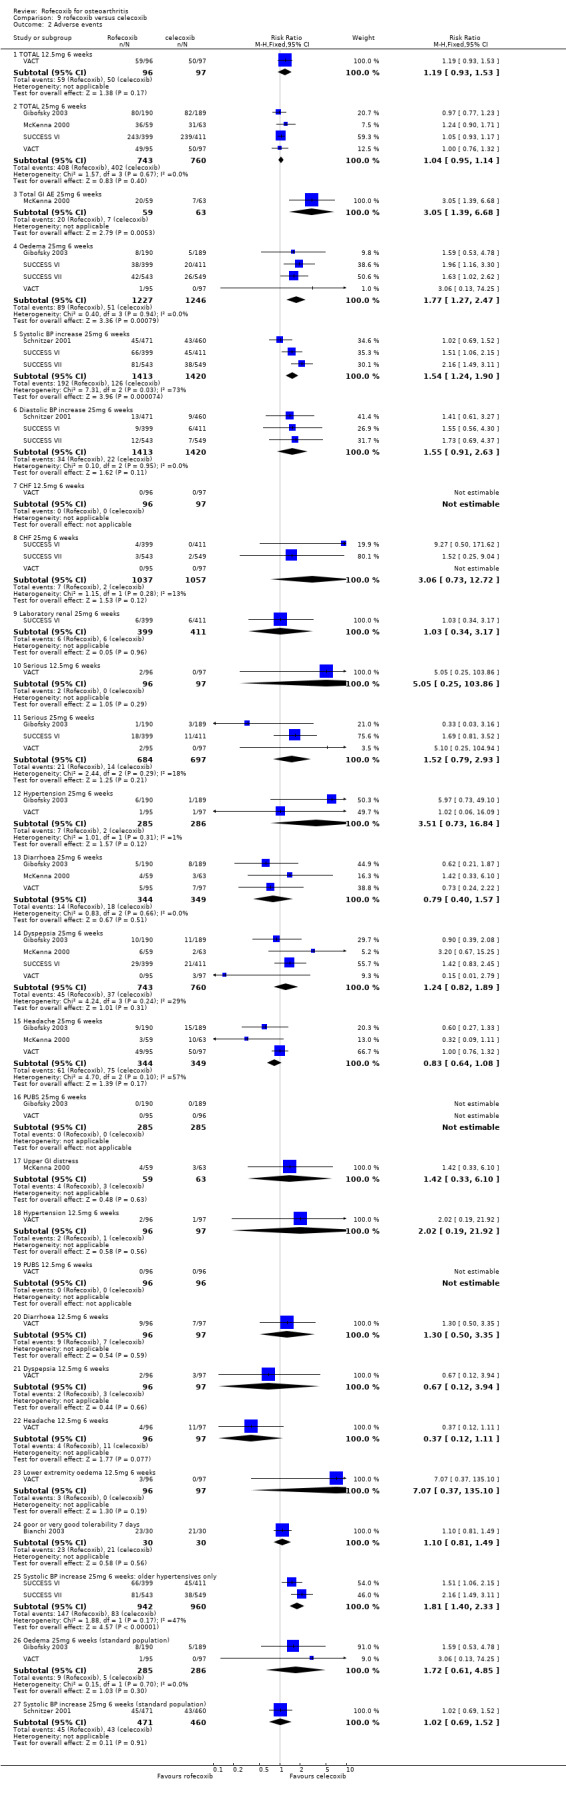
Comparison 9 rofecoxib versus celecoxib, Outcome 2 Adverse events.
9.3. Analysis.
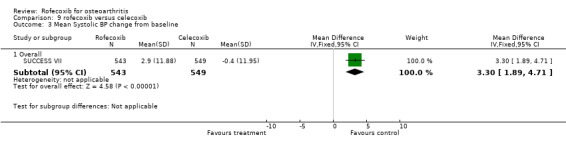
Comparison 9 rofecoxib versus celecoxib, Outcome 3 Mean Systolic BP change from baseline.
9.4. Analysis.
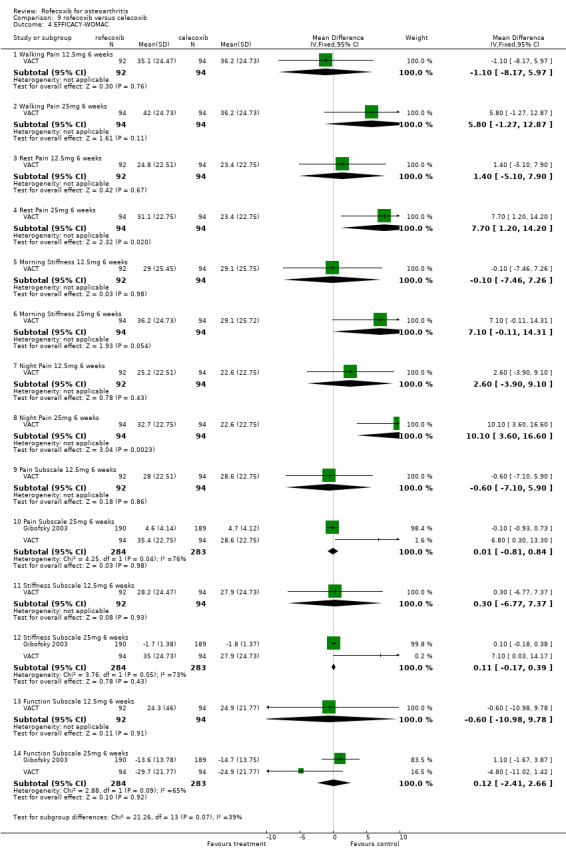
Comparison 9 rofecoxib versus celecoxib, Outcome 4 EFFICACY‐WOMAC.
9.5. Analysis.
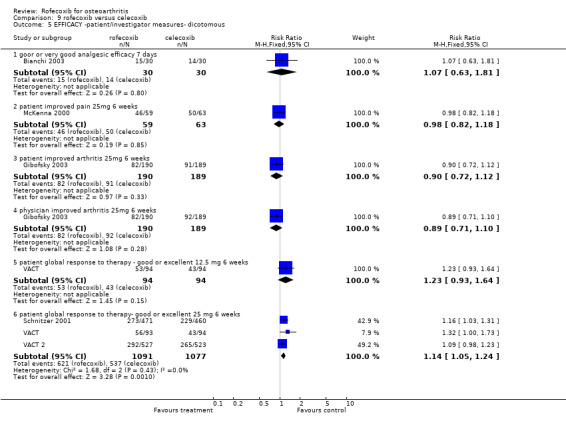
Comparison 9 rofecoxib versus celecoxib, Outcome 5 EFFICACY ‐patient/investigator measures‐ dicotomous.
9.6. Analysis.
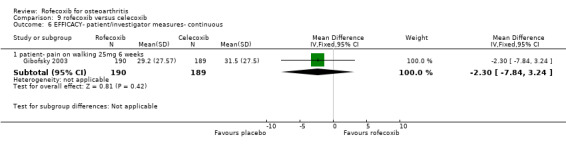
Comparison 9 rofecoxib versus celecoxib, Outcome 6 EFFICACY‐ patient/investigator measures‐ continuous.
9.7. Analysis.
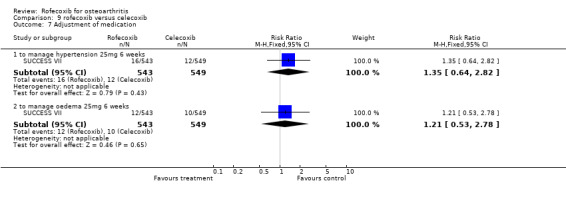
Comparison 9 rofecoxib versus celecoxib, Outcome 7 Adjustment of medication.
9.8. Analysis.
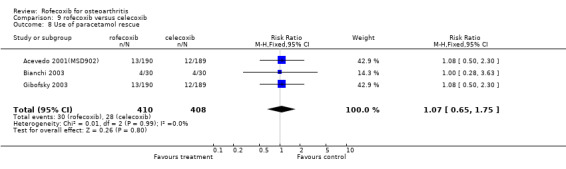
Comparison 9 rofecoxib versus celecoxib, Outcome 8 Use of paracetamol rescue.
Comparison 10. rofecoxib versus arthrotec.
| Outcome or subgroup title | No. of studies | No. of participants | Statistical method | Effect size |
|---|---|---|---|---|
| 1 WITHDRAWALS 6 weeks | 1 | Risk Ratio (M‐H, Fixed, 95% CI) | Subtotals only | |
| 1.1 Total | 1 | 483 | Risk Ratio (M‐H, Fixed, 95% CI) | 0.65 [0.36, 1.17] |
| 1.2 due to AE | 1 | 483 | Risk Ratio (M‐H, Fixed, 95% CI) | 0.45 [0.22, 0.94] |
| 1.3 due to LOE | 1 | 483 | Risk Ratio (M‐H, Fixed, 95% CI) | 1.00 [0.06, 15.83] |
| 2 ADVERSE EVENTS 6 weeks | 1 | Risk Ratio (M‐H, Fixed, 95% CI) | Subtotals only | |
| 2.1 CV | 1 | 483 | Risk Ratio (M‐H, Fixed, 95% CI) | 1.39 [0.63, 3.08] |
| 2.2 TOTAL GI | 1 | 483 | Risk Ratio (M‐H, Fixed, 95% CI) | 0.60 [0.47, 0.75] |
| 2.3 TOTAL | 1 | 483 | Risk Ratio (M‐H, Fixed, 95% CI) | 0.72 [0.63, 0.83] |
| 2.4 Diarrhoea | 1 | 483 | Risk Ratio (M‐H, Fixed, 95% CI) | 0.31 [0.18, 0.54] |
| 2.5 Abdominal Pain | 1 | 483 | Risk Ratio (M‐H, Fixed, 95% CI) | 0.65 [0.39, 1.10] |
| 2.6 Lower extremity oedema | 1 | 483 | Risk Ratio (M‐H, Fixed, 95% CI) | 1.00 [0.29, 3.40] |
| 2.7 NSAID ‐type GI | 1 | 483 | Risk Ratio (M‐H, Fixed, 95% CI) | 0.60 [0.41, 0.87] |
| 2.8 SERIOUS | 1 | 483 | Risk Ratio (M‐H, Fixed, 95% CI) | 0.75 [0.17, 3.30] |
| 3 EFFICACY 6 weeks | 1 | Std. Mean Difference (IV, Fixed, 95% CI) | Subtotals only | |
| 3.1 Patient Global (100mm VAS) change from baseline | 1 | 483 | Std. Mean Difference (IV, Fixed, 95% CI) | ‐0.12 [‐0.30, 0.06] |
| 3.2 Investigator Global (0‐4 Likert) change from baseline | 1 | 483 | Std. Mean Difference (IV, Fixed, 95% CI) | 0.04 [‐0.14, 0.22] |
10.1. Analysis.
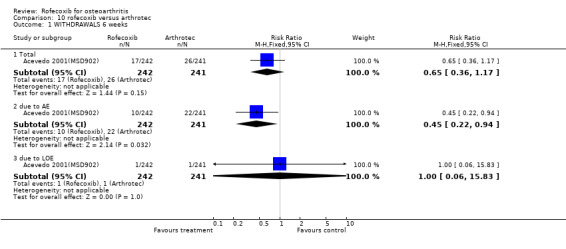
Comparison 10 rofecoxib versus arthrotec, Outcome 1 WITHDRAWALS 6 weeks.
10.2. Analysis.
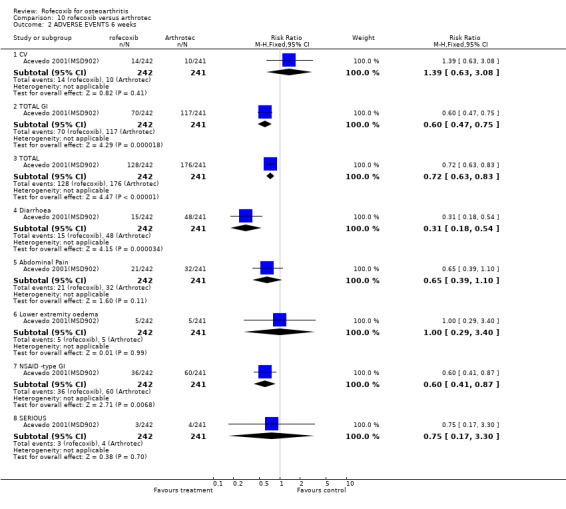
Comparison 10 rofecoxib versus arthrotec, Outcome 2 ADVERSE EVENTS 6 weeks.
10.3. Analysis.
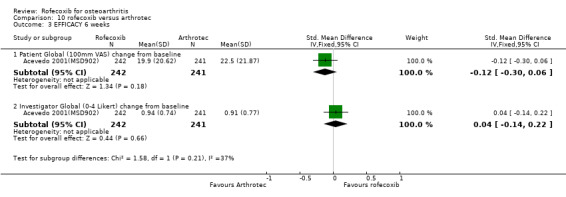
Comparison 10 rofecoxib versus arthrotec, Outcome 3 EFFICACY 6 weeks.
Characteristics of studies
Characteristics of included studies [ordered by study ID]
Acevedo 2001(MSD902).
| Methods | 6 weeks double‐blind, multicentre international (21 sites) No CCX, aspirin, H2 blockers, antacids, sucralfate, warfarin, ticlopidine or PPIs permitted paracetamol rescue (max 8 tablets) Randomisation: computer generated schedule stratified for history of ulcer and/or upper GI bleeding double dummy ITT analysis Sample size: 220 per group assuming 16% incidence diarrhoea in Arthrotec and 6% rofecoxib. 90% power to detect 10% difference between the treatment groups in the incidence of diarrhoea. | |
| Participants | OA N=483 >=40 yoa (Mean age 62.1 years; range 39‐85) requiring regular NSAID therapy Patients stratified according to previous history of gastroduodenal ulcer or GI bleed Exclusion: inflammatory/post traumatic arthritis; infectious disease; malabsorption; uncontolled diabetes; GI disease associated with diarrhoea; renal, cardiovascular or hepatic disease; bleeding disorder; allergic to NSAIDs/paracetamol; positive for faecal occult blood; previous misoprostol use; regular aspirin users; CCX in previous month; history of sustained GI medication. Equivalent baseline characteristics 7.2% prior history of upper GI ulceration/bleeding 13% receiving low dose aspirin; 49% antihypertensive medication | |
| Interventions | rofecoxib 12.5mg/day diclofenac 50mg/misoprostol 200mcg b.d (Arthrotec) | |
| Outcomes | TOLERABILITY: Primary: incidence of spontaneously reported diarrhoea; Secondary: spontaneously reported abdominal pain; discontinuation due to AEs; incidence of all AE, incidence of drug related AEs, proportion with serious AEs, incidence of GI AEs, and NSAID‐type GI AEs (acid reflux, dyspepsia, epigastric discomfort, heartburn, nausea and vomiting); EFFICACY: patient global assessment (100mm VAS) and investigator global disease (Likert 0‐4) | |
| Notes | WITHDRAWALS: 43 (8.9%) EFFICACY: No SS difference in efficacy. SAFETY: Rofecoxib fewer GI events (28.9% vs. 48.5 %) p<0.001, fewer NSAID type events (18.6% vs. 29.9%) p=0.004, fewer episodes of diarrhoea (6.2 % vs. 19.9%) p>0.001. Lower extremity oedema 2.1% v 2.1%; cardiovascular events 5.8% vs. 4.1% (NS). QA: R=2 B=2 W=1 |
|
| Risk of bias | ||
| Bias | Authors' judgement | Support for judgement |
| Allocation concealment? | Unclear risk | B ‐ Unclear |
Advantage 2000.
| Methods | 12 weeks double‐blind, multicentre (600 sites) US and Sweden predominantly primary care low dose aspirin permitted GI protective medication permitted to treat GI symptoms (PPI, antacids, H2 blockers) paracetamol rescue Randomisation: computer generated schedule double dummy 'modified' ITT analysis: all who took at least 1 dose Sample size: 2780 per group. 90% power to detect 2% difference between treatments for primary safety variable. | |
| Participants | OA knee, hip, hand or spine N=5557 >=40 yoa (Mean age 63.0 years) ARC functional class I, II, III symptomatic > 6 months requiring regular NSAID or paracetamol therapy Permitted: history of dyspepsia, ulcer, GI bleeding, or other GI symptoms Exclusion: potentially confounding concurrent disease, malabsorption, > 4 days history of GI protective medication during month prior to entry. Equivalent baseline characteristics including CV and GI. 49% taking antihypertensive medication and 13% low dose aspirin. 29% prior history of GI events associated with NSAID use | |
| Interventions | rofecoxib 25 mg od naproxen 500mg bd | |
| Outcomes | Primary: 12 week GI tolerability (discontinuation due to GI adverse events or abdominal pain); Secondary: concomitant GI medication use, discontinuation due to AEs; incidence of all AE, incidence of drug related AEs, incidence of serious AEs, incidence of GI AEs (PUBs), incidence of cardiovascular AEs ; EFFICACY: patient global assessment of disease status(100mm VAS); Medical Outcomes Study 36‐item Short Form Health Survey; AUSCAN OA Hand Index. Independent blind adjudication of PUBs and CV events. SUBGROUP: low‐dose aspirin users;individuals previously dicontinuing arthritis medication due to GI symptoms; patients with hypertension at baseline (those taking antihypertensive mediation). | |
| Notes | WITHDRAWALS: 1545 (27.8%) EFFICACY: No SS difference in efficacy or discontinuation due to lack of efficacy. SAFETY: Rofecoxib associated with a significantly lower incidence of discontinuation due to GI events (5.9% vs 8.1% RR 0.75, CI: 0.59, 0.96 ). This difference was evident at 3 weeks and continued over the course of the study. Analysis of interaction of treatment by low‐dose aspirin showed no statistically significant modification of effect (p>0.2), indicating a consistent risk reduction regardless of aspirin use. No SS differences in the incidence of hypertension, pre‐defined limits of change for systolic or diastolic blood pressure, or lower extremity oedema. Higher incidence of these events in hypertensive patients but not SS. No SS difference in the number of thrombotic cardiovascular events. Five MI in rofecoxib group and 1 in naproxen group (p=0.015). Funded by Merck & Co QA: R=2 B=2 W=1 |
|
| Risk of bias | ||
| Bias | Authors' judgement | Support for judgement |
| Allocation concealment? | Unclear risk | B ‐ Unclear |
Bianchi 2003.
| Methods | 3 weeks 7‐day cross over double‐blind. single centre Italy. 3 day washout prior to study. No pain treatment 24 hours prior to study RANDOMISATION: latin square design; computer generated random numbers NOT PERMITTED: other analgesia paracetamol rescue: 500mg per day only No washout reported between cross‐over phases drugs POWER: Assuming an alpha error of 0.05 and beta of 0.20 | |
| Participants | OA knee N=31 >= 18 yoa (Mean age 69.0; range 53‐80) INCLUSION: met ACR criteria; OA at least 3 months; minimum VAS of 40mm pain associated with walking. EXCLUSION: concurrent arthritis disease or laboratory test result outside normal reference range; history of allergy to study drugs or hypersensitivity to other NSAIDs; GI ulceration within 30 days; bleeding disorders. Equivalent at baseline | |
| Interventions | rofecoxib 25mg od celexcoxib 200mg od nimesulide 100mg od | |
| Outcomes | Pain intensity (100mm VAS) Total pain relief over 3 hours: addition of time‐weighted pain relief scores (expressed as difference between the value recorded at baseline and that recorded at each time point). Analgesic efficacy (0‐4 Likert) Total number of paracetamol tablets Global tolerability (0‐4 Likert) | |
| Notes | WITHDRAWAL:1 (3%) No wash‐out period reported between cross‐over phases. EFFICACY: Days 1 and 7 overall analgesic effect over the first 3 hours was significantly more marked for single dose of nimesulide that for rofecoxib or celecoxib. QA: R=2 B=1 W=1 | |
| Risk of bias | ||
| Bias | Authors' judgement | Support for judgement |
| Allocation concealment? | Unclear risk | B ‐ Unclear |
Cannon 2000(MSD 035).
| Methods | 52 weeks double‐blind, randomised, US multicentre no aspirin or CCX rescue paracetamol randomisation : computer generated randomisation scheme double dummy POWER: comparability stated if for all 3 primary endpoints, the 95% confidence intervals of the difference in the mean treatment response between 2 treatments were within + or ‐ 10mm on a 100mm VAS scale or 0.5 on a Likert scale. >99% power to demonstrate comparable efficacy (according to the criteria stated between 25mg rofecoxib and diclofenac if the true difference is 0. ITT analysis Voluntary extension period post study | |
| Participants | OA hip and knee N=784 clinical and radiographic evidence study joint primary source of pain > = 40 yoa (Mean age 63.6) Steinbrocker I‐III functional 2 groups: prior NSAID or paracetamol use. Prior NSAID use: post wash‐out moderate pain when walking, increase in pain and worse physician assessment of disease status. Prior paracetamol use: post wash‐out moderate pain when walking and patient assessment of disease status fair, poor or very poor. stratified depending on whether prior NSAID or paracetamol exclusion: renal impairment, clinically significant abnormalities on physical or laboratory examination at screening; positive faecal occult blood; class III/IV angina, uncontrolled CHF, uncontrolled hypertension, previous stroke or TIA within 2 years, active hepatic disease, recent neoplastic disease, allergy to NSAID/paracetamol, required aspirin at any dose, CCX, warfarin or ticlopidine. Patients with history of gastroduodenal ulcer or GI bleeding were allowed to participate No baseline differences reported women: post menopausal or demonstrably non‐gravid. | |
| Interventions | rofecoxib 12.5 mg od rofecoxib 25mg od diclofenac 50mg tds | |
| Outcomes | PRIMARY: WOMAC index: pain when walking*; investigator global disease status (0‐4) 26 weeks only*;patient global response to therapy (0‐4)*;
SECONDARY: WOMAC pain (100mm VAS), stiffness (100mm VAS), functional ability (100mm VAS); joint tenderness (0‐3); patient global disease status (100mm VAS) ; investigator global response to therapy(0‐4); rescue paracetamol; LOE withdrawals; laboratory tests. For the determination of comparability, the three primary end points were analysed as the averaged response over the 52 week treatment period (first 26 weeks only for the patient's assessment of response to therapy). |
|
| Notes | WITHDRAWALS: 336 (42.9%) EFFICACY: LOE: no SS difference.SS improvement from baseline all groups, all OMs. No SS effect for location of joint i.e. hip or knee, previous medication, age or sex.All primary: treatment response within 2 weeks and maintained throughout study. Although differences between therapies within a priori defined limits, diclofenac SS superior for patient response to therapy and investigator disease status. SAFETY: No SS differences between comparators GI ADRs R=2 B=2 W=1 |
|
| Risk of bias | ||
| Bias | Authors' judgement | Support for judgement |
| Allocation concealment? | Unclear risk | B ‐ Unclear |
CRESCENT (Sowers).
| Methods | 12 weeks double‐blind randomised US multicentre | |
| Participants | OA Type 2 diabetes mellitus also taking ACE inhibitors N= 404 Mean age 63 | |
| Interventions | rofecoxib 25mg od celecoxib 200mg od naproxen 500mg bd | |
| Outcomes | PRIMARY: mean change from baseline to week 6 of the average 24‐hour systolic blood pressure SECONDARY: 'arthritis efficacy measurements' 24 ambulatory blood pressure measurements |
|
| Notes | Abstract only | |
| Risk of bias | ||
| Bias | Authors' judgement | Support for judgement |
| Allocation concealment? | Unclear risk | B ‐ Unclear |
Day 2000 (MSD 040).
| Methods | 6 weeks
double‐blind,
multicentre (49 sites)
rescue paracetamol (2.6g)
stratified into previous NSAID and previous paracetamol
no aspirin or CCX
double‐dummy
randomisation: computer generated schedule 1:4:4:4
allocation schedule independently maintained compliance assessed by returned tablet counts ITT analysis but only patients with baseline plus 1 treatment measurement included comparability stated if for 2 out of 3 primary endpoints, the 95% confidence intervals of the difference in the mean treatment response between 2 treatments were within + or ‐ 10mm on a 100mm VAS scale or 0.5 on a Likert scale POWER: greater than 99% power to demonstrate comparable efficacy (according to criteria cited) between rofecoxib and ibuprofen if their true difference is 0. |
|
| Participants | OA knee or hip N=809 >= 40 years of age (Mean age 63.7; range not given) clinical and radiological diagnosis ARA functional class I‐III symptomatic for minimum of 6 months knee and hip primary source of pain increased pain and worse physician global disease status following NSAID /paracetamol withdrawal plus worse patient global for paracetamol women; post menopausal or demonstrably non‐gravid Exclusion: CCX, any dose aspirin, warfarin or ticlopidine significant renal impairment; clinically significant abnormal physical or laboratory screening; positive faecal blood test; malabsorption; class III/IV angina or congestive heart failure; uncontrolled hypertension; stroke or TIA within 2 years; active hepatic disease; recent neoplastic disease; allergy to NSAID or paracetamol No baseline differences | |
| Interventions | rofecoxib 12.5mg od rofecoxib 25mg od ibuprofen 800mg tds placebo | |
| Outcomes | PRIMARY: WOMAC index: pain when walking*; patient global response to therapy (0‐4 Likert)*; investigator global disease status (0‐4 Likert)*;
analysed as mean response (change from baseline) over all observation times in the 6‐week treatment period. SECONDARY: WOMAC index: pain, stiffness, functional disability; joint tenderness (0‐3 Likert); patient global disease status(10cm VAS) ; investigator global response to therapy(0‐4 Likert); study joint tenderness (0‐3 Likert); rescue paracetamol; LOE withdrawals. |
|
| Notes | WITHDRAWALS: 100 (12.4%)
Difficult to ascertain whether ITT. Denominators infer that it was, but text states that " only 14 of the 809 randomised patients were excluded from the analysis for one or more of the primary endpoints because of missing baseline or on‐treatment data.
PLACEBO EFFICACY: rofecoxib SS reduction all OMs and SS superior to placebo.LOE : SS fewer withdrawals in active compared to placebo (p= 0.009).Maximum effects within 2 weeks. IBUPROFEN EFFICACY: All responses SS and no SS differences between groups although some separation evident from graphs.Maximum responses within 2 weeks and sustainedRofecoxib 25mg superior to ibuprofen (p=0.005) for pt response and investigator global disease status.Treatment effects consistent for knee v hip, paracetamol v NSAID. QA: R=2 B=2 W=1 |
|
| Risk of bias | ||
| Bias | Authors' judgement | Support for judgement |
| Allocation concealment? | Low risk | A ‐ Adequate |
Ehrich 1999 (pilot).
| Methods | 6 weeks randomised Phase II double‐blind multicentre US (27 sites) paracetamol rescue (max 8 x 325mg per 24 hours) no data on concomitant randomisation: computer generated allocation schedule matching placebo ITT analysis SUBGROUPS: age, ARA functional class; baseline values for primary endpoints POWER: difference in VAS of 12mm between patient groups at least 80% power (a=0.05, 2 tailed) with a sample size of 60 per treatment group. WOMAC scales: 80% power to detect a difference of 47 mm. | |
| Participants | OA knee N=219 No baseline differences >40 yoa (Mean age 63.5, range 35‐84) <= 125 kg in weight ARA I to III knee pain, especially in motion of at least 6 months duration radiographic evidence previous positive NSAID response and to be taking NSAIDs prior to entry randomised if increased pain on prior NSAID withdrawal EXCLUSION: previous gastro‐duodenal ulceration; history of GI bleeding; history of GI surgery; renal impairment; diabetes; history of cardiovascular disease, stroke or neurological disorder; hepatic or neoplastic disease; coagulation disorder | |
| Interventions | rofecoxib 25 mg od rofecoxib 125mg od placebo | |
| Outcomes | PRIMARY: WOMAC pain*; patient assessed pain (10cm VAS)*; SECONDARY: WOMAC physical function/stiffness; investigator and patient global response (0‐4); investigator global disease status (0‐4); patient global disease status (10cm VAS); LOE withdrawals | |
| Notes | WITHDRAWAL: 57 (26.0%) LOE: rofecoxib SS to placebo p<0.001 EFFICACY: all endpoints rofecoxib SS superior to placebo (p<0.001). Although some separation in response curves no SS differences between doses (any endpoint) (p<0.05).improvement occurring at week 1 (SS WOMAC pain) and SS at week 2 other outcomes. SAFETY: similar AE withdrawal rates, 1 PUB in 125mg rofecoxib arm. QA: R=2 B=2 W=1 |
|
| Risk of bias | ||
| Bias | Authors' judgement | Support for judgement |
| Allocation concealment? | Low risk | A ‐ Adequate |
Ehrich 2001(MSD 029).
| Methods | 6 weeks double‐blind, randomised,multicentre US hip patients not randomised to 50mg ANALYSIS: average change from baseline accross the entire six weeks of treatment. ITT. Abstract states that following the 6 week treatment period 472 patients continued in a six month double‐blidn extension study. Patients allcoated to placebo or 5mg during the intial 6 weeks were re‐allocated to either 12.5mg; 25mg or diclofenac 150mg. The results from this study don't appear to have been published. | |
| Participants | OA knee and hip N=672 >=40 yoa (mean age 61.7; range 38‐93) pain in affected joint on majority of days each month characteristic radiographic changes ARC I‐III; worsening of pain following discontinuation of NSAID therapy* EXCLUSION: significant renal impairment; evidence of active GI tract bleeding; clinical malabsorption; class III/IV angina or CHF; uncontrolled hypertension; stroke within previous 2 years; active hepatic disease; recent neoplastic disease;allergy to paracetamol or NSAIDs. BASELINE: no SS differences | |
| Interventions | rofecoxib 5 or 12.5 or 25 or 50mg/day Placebo | |
| Outcomes | WOMAC: pain on walking, stiffness, disability; patient global assessment response(0‐4); investigator global assessment disease status (0‐4); SF‐36 | |
| Notes | Publication states that " The efficacy results of rofecoxib in the management of OA from this study have been reported elsewhere (refence given for Ehrich 1999)"; numbers presented in Ehrich 1999 don't however match those reported in this publication and it also involves a dose of 125mg, which was not included in the Ehrich 2001 publication. Very little information presented in the publication other than QOL analysis. WITHDRAWAL= 107/672 (15.9%) Justification for analysis " in a previous study, full clincal efficacy response was realised at the first point of measurement and maintained at a generally constant lvel across the entire 6 weeks of treatment. Therefore average response across the treatment period was predefined as the primary calculation of response fore each patient to minimise variability and yeild the most precise estimate of treatment effects. SF‐26 mental scores adjust to take into account regression to the mean and by adjusting for physical efficacy as measure by an average primary clincal efficacy endpoints (after adjusting the walking pain VAS response by dividing by 25 to scale it to the categorical scale. No overall rates of adverse events available. EFFICACY: all rofecoxib groups SS superior to placebo (p<0.001) all OMs.Dose response higher doses superior to 5mg ?SSImprovements for all doses rofecoxib SS to placebo in all SF 36 domains except general health. Evidence of dose response : 5mg smaller mean changes than other doses for all endpoints. SAFETY: Incidence of discontinuation due to ADRs equivalent between rofecoxib and placebo‐ no details. QA: R=1 B=1 W=1 |
|
| Risk of bias | ||
| Bias | Authors' judgement | Support for judgement |
| Allocation concealment? | Unclear risk | B ‐ Unclear |
Geba (MSD 090).
| Methods | 6 weeks double‐blind, randomised, multicentre US (115 sites) pre‐trial NSAID washout RANDOMISATION: computer generated blinded allocation schedule double dummy rescue paracetamol up to 2600mg except during first 6 days or 24 hours pre efficacy assessment modified ITT analysis: baseline flare, took at least one dose of study drug and had a postbaseline efficacy assessment. low dose aspirin permitted up to 81mg/day for CV prophylaxis (10‐14%) POWER: detection of clinically relevant difference between treatment groups in terms of the primary endpoint PGART; 380 patients per active group; 180 placebo estimated that the study would have 99% power to detect a difference of at least 15% between rofecoxib and nabumetone in terms of the percentage of patients with good/excellent PGART response. Statistical significance on PGART endpoint implied consistent with difference of 15 percentage points. | |
| Participants | N=978 OA knee >= 40 years of age (mean 63) OA of greater than 6 months duration history of NSAID response ARC I, II or III flare with NSAID withdrawl pre‐trial EXCLUSION: pregnancy; imminent joing replacement; concurrent medical/arthritic disease that could alter study outcome; significant systemic disease that contra‐indicated NSAIDs; CCX within one month; misoprostol; sucralfate; histamine blockers; antacids; PPIs; analgesics; wafarin; ticlopidine; high‐dose aspirin; appetite suppresants; other medications for chronic diseases; BASELINE: no differences ASPIRIN USE: rofecoixb 46/424; nabumetone 57/410; placebo 21/208 | |
| Interventions | rofecoxib 12.5mg/day nabumetone 1000mg/day placebo | |
| Outcomes | PRIMARY: patient global response to therapy (0‐4) later stated as the number of patients with good or excellent response. SECONDARY: WOMAC pain walking on a flat surface (100mm VAS); investigator global response to therapy (0‐4); LOE withdrawals; SF‐36 quality of life; |
|
| Notes | WITHDRAWAL: not given Abstract presents brief details of methodology only. Also states that methodology identical to Kivtiz therefore methods copied from this entry in table of characteristics of included studies. There are however slight variations in the methodology described‐ Kivitz states corticosteroid use per se, whilst Geba abstract states "corticosteroid use within one month". Similarly Geba states " sustained use of antacids, H2 blockers or PPIs", whilst Kivitz states use per se. | |
| Risk of bias | ||
| Bias | Authors' judgement | Support for judgement |
| Allocation concealment? | Unclear risk | D ‐ Not used |
Gibofsky 2003.
| Methods | 6 weeks double‐blind multicentre US & Canada (61 sites) Double dummy RANDOMISATION: computer generated schedule POWER: 188 patients in each active treatment group and 94 in placebo. Sample sizes sufficient to reject, using a 5% one sided t‐test with 80% power, the null hypothesis that celecoxib is inferior to rofecoxib, with noninferiority limits of 10 on the 100 mm VAS and 5.5 points on the WOMAC total domain score. ITT analysis | |
| Participants | OA knee
N= 475
>= 40 yoa (Mean age 62.9)
INCLUSION: ACR criteria; functional capactiy class rating of I, II or III; OA flare at baseline; negative pregnancy test.
EXCLUSION: inflammatory arthritis or acute joint trauma; recent CCX (previous 8 weeks) or hyaluronic acid (6 months) injection; NSAID use within 2 days or 5 half‐lives; history of or active malignancy; upper GI ulceration within 30 days; active GI disease, chronic or acute renal or hepatic disease, significant coagulation defect; known NSAID or Cox II hypersensitivity; abnormal laboratory test results at screening.
PERMITTED: aspirin <=325mg/day for cardiovascular prevention; acetaminophen; antacids.
NOT PERMITTED: NSAIDS; analgesics; oral or injectable CCX or hyaluronic acid; anticoagulants; DMARDs; anti‐ulcer medication; daily or almost daily use of antacids; anti‐platelet agents.
BASELINE: no SS differences FLARE: 3 out of 4 of following: VAS score >= 40mm for patient's assessment of OA pain; OA severity index of >= 7; patient's global assessment of arthritis as poor or very poor; physician's global assessment as poor or very poor. |
|
| Interventions | rofecoxib 25mg od
celecoxib 200mg od
placebo To be taken with evening meal |
|
| Outcomes | PRIMARY: Patient assessment of OA pain (100mm VAS); WOMAC total domain score at week 6.
SECONDARY: Patient global assessment (1‐5 Likert); Physician global assessment (1‐5 Likert); OA severity index (composite scale 0‐24); WOMAC subscales pain, stiffness and physical function; Patient satisfaction (1‐10 Likert).Patient assessment of pain on walking (100mm VAS). IMPROVED defined as a reduction of at least 2 grades from baseline or a change to 'very good'on patient and physician global assessments. |
|
| Notes | WITHDRAWAL: 94 (19.7%) QA: R=2 B=2 W=1 | |
| Risk of bias | ||
| Bias | Authors' judgement | Support for judgement |
| Allocation concealment? | Unclear risk | B ‐ Unclear |
Hawkey 2000(MSD 045).
| Methods | 16‐24 week double‐blind multicentre, international (36 sites) Paracetamol, non‐NSAID pain medication and supplied antacids were permitted. No concomitant NSAIDs, aspirin, CCX, anticoagulants, ticlopidine, H2 antagonists, prostaglandin analogues, sucralfate, unapproved antacids, PPIs.All withdrawn 2 weeks prior to baseline. Endoscopy and biopsy at baseline for H pylori status testing. matching placebos randomisation stratified by prescence/absence of history of PUB. In order to allow for an anticipated lack of efficacy in the placebo group, 95% of patients taking placebo and 5% in the other groups were randomly selected and discontinued from the trial in a blinded manner at week 16. Study designed to provide 95% power to detect a difference in the 12 week cumulative ulcer incidence between the rofecoxib or placebo groups and the ibuprofen groups assuming an incidence of 2.5% for the placebo and rofecoxib groups and 15% for the ibuprofen group. no baseline differences ITT analysis | |
| Participants | OA N= 775 >=50 yoa (Mean age 61.5, range 49‐89) prior NSAID use 49.4% required treatment for at least 6 months PERMITTED:Patients with history of ulcer, perforation or GI haemmorrhage, endoscopically detected gastroduodenal erosion and active H pylori infection. EXCLUSION : patients with endoscopical evidence at baseline of erosive esophagitis, UGI ulcer or pyloric obstruction. Also previous upper GI surgery, inflammatory bowel disease, reduced renal function, faecal occult blood, unstable medical disease, malignancy within previous 5 years, pregnancy, cerebrovascular events in previous 2 years, anticoagulant therapy, CCX, ticlopidine, aspirin. | |
| Interventions | rofecoxib 25 mg od rofecoxib 50 mg od ibuprofen 800mg tds placebo | |
| Outcomes | Primary: endoscopically detected ulcers >=3mm
Secondary: endoscopically detected ulcers >=5mm
Global assessment of disease by patients (Likert 0‐4); Paracetamol use Ulcer defined as mucosal break >= 3mm with unequivocal depth. Erosions defined as a mucosal break of any size with no depth |
|
| Notes | WITHDRAWAL: 278/775= 35.9% PLACEBO: 12 week cumulative rates of endoscopically detected ulcers in rofecoxib arm were similar to those seen in placebo. IBUPROFEN Rofecoxib caused fewer endoscopically detected ulcers than did ibuprofen. Patients developing ulcer were excluded from the trial QA: R=1 B=2 W=0 | |
| Risk of bias | ||
| Bias | Authors' judgement | Support for judgement |
| Allocation concealment? | Unclear risk | B ‐ Unclear |
Herrera 2003.
| Methods | 30 days double‐blind single centre, Venezuela POWER: 90% to detect a difference in the main variable (VAS) between the groups of 10% with alpha error of 0.05 rescue paracetamol | |
| Participants | OA knee N= 114 >= 50 yoa (Mean age = 61.5) INCLUSION: met ACR criteria EXCLUSION: severe hepatic, renal, cardiovascular or haematological disease; prosthesis or intraarticular surgery, arthrocentesis in last 3 months prior to study; cerebrovascluar events in last two years; hypersensitivity/allergy to NSAIDs; presence or antecedents of peptic ulcer; use of analgesics during the last 5 days; pregancy or nursing. NOT PERMITTED: anticoagulants; hydantoins;oral antidiabetics; anti‐malarials; immune suppressants; oral intraarticular steroids within last three months; muscle relaxants; neuroleptics; antidepressants; NSAIDs. Equivalent at baseline except 'almost all' nimisulide patients right knee and rofecoxib left knee affected | |
| Interventions | rofecoxib 25mg od
nimesulide retard 300mg od paracetamol rescue therapy |
|
| Outcomes | Investigator treatment efficacy (100mm VAS) WOMAC: daily activities; pain and stiffness paracetamol use | |
| Notes | WITHDRAWAL: 7(6%)
No standard deviations reported. Unclear number withdrawing and randomised, text of study suggests 114 was final number rather than baseline as reported in the abstract. Possibly not ITT analysis. EFFICACY:Both drugs significant improvement in efficay. Onset of analgesia faster with nimisulide (within 15 minutes significant effect occurred vs 45 minutes with rofecoxib. Nimisulide longer duration of action days 2 and 3. WOMAC and VAS QoL: SS difference on day 30 in favour of nimisulide (p=0.04). SAFETY: similar tolerability QA: R=1 B=1 W=1 |
|
| Risk of bias | ||
| Bias | Authors' judgement | Support for judgement |
| Allocation concealment? | Unclear risk | B ‐ Unclear |
Kivitz 2004(MSD 085).
| Methods | 6 weeks double‐blind, randomised, multicentre US (113 sites) pre‐trial NSAID washout RANDOMISATION: computer generated blinded allocation schedule double dummy rescue paracetamol up to 2600mg except during first 6 days or 24 hours pre efficacy assessment modified ITT analysis: baseline flare, took at least one dose of study drug and had a postbaseline efficacy assessment. low dose aspirin permitted up to 81mg/day for CV prophylaxis (10‐14%) POWER: detection of clinically relevant difference between treatment groups in terms of the primary endpoint PGART; 380 patients per active group; 180 placebo estimated that the study would have 99% power to detect a difference of at least 15% between rofecoxib and nabumetone in terms of the percentage of patients with good/excellent PGART response. Statistical significance on PGART endpoint implied consistent with difference of 15 percentage points. | |
| Participants | OA knee N= 1042 >= 40 years of age (mean 63.1; range 35‐92) OA of greater than 6 months duration history of NSAID response ARC I, II or III flare with NSAID withdrawl pre‐trial EXCLUSION: pregnancy; concurrent medical/arthritic disease that could alter study outcome; significant systemic disease that contra‐indicated NSAIDs; CCX; misoprostol; sucralfate; histamine blockers; antacids; PPIs; analgesics; wafarin; ticlopidine; high‐dose aspirin; appetite suppresants; other medications for chronic diseases; BASELINE: no differences ASPIRIN USE: rofecoixb 46/424; nabumetone 57/410; placebo 21/208 | |
| Interventions | rofecoxib 12.5mg/day nabumetone 1000mg/day placebo | |
| Outcomes | PRIMARY: patient global response to therapy (0‐4) later stated as the number of patients with good or excellent response. SECONDARY: WOMAC pain walking on a flat surface (100mm VAS); investigator global response to therapy (0‐4); LOE withdrawals; SF‐36 quality of life; After start of trial, protocol amended to include endpoints for the assessment of onset of efficacy (PGART and walking pain) 4 hours after taking dose on days 1‐6. 55.1% of patients enrolled after this time. |
|
| Notes | WITHDRAWAL: 226 (21.7%) PLACEBO EFFICACY: Rofecoxib SS superior in number of patients with good or excellent response at 4 hours (p<0.05), 28hrs (p<0.001), 5 days (p not given) and 2, 4, and 6 wks (p<0.05). Patient Global Response: median time to good or excellent response rofecoxib 52hrs, placebo >124 hrs Pain walking over first 5 days rofecoxib greater improvement (p<0.05). NABUMETONE EFFICACY: Rofecoxib SS superior to nabumetone in number of patients with good or excellent response at 28hrs (p<0.001), 5 days (p not given) and 2,4,and 6 wks (p<0.05). Patient Global Response: median time to good or excellent response rofecoxib 52hrs, nabumetone 100hrs, placebo >124 hrs (p=0.002 rofecoxib vs. nabumetone, p=0.001 nabumetone vs. placebo). QA: R=2 B=2 W=1 |
|
| Risk of bias | ||
| Bias | Authors' judgement | Support for judgement |
| Allocation concealment? | Low risk | A ‐ Adequate |
Laine 1999 (MSD 044).
| Methods | 12; 16‐24 week
double‐blind
US multicentre (34 sites)
Paracetamol, non‐NSAID pain medication and supplied antacids were permitted.
No concomitant NSAIDs, aspirin, anticoagulants, sucralfate, unapproved antacids, antibiotics, PPIs or GPAs. Endoscopy, biopsy and H pylori status testing at baseline.
double‐dummyt
randomisation: stratified by prescence/absence of history of PUB. Blocks of 4 from a computer generated list
allocation concealment: sealed envelopes
In order to allow for an anticipated lack of efficacy in the placebo group, 95% of patients taking placebo and 5% in the other groups were randomly selected and discontinued from the trial in a blinded manner at week 16.
Study designed to provide 95% power (alpha = 0.05, 2 tailed) to detect a difference in the 12 week cumulative ulcer incidence between the rofecoxib or placebo groups and the ibuprofen groups assuming an incidence of 2.5% for the placebo and rofecoxib groups and 15% for the ibuprofen group. Predefined statistical criteria to compare ulcer rates were established for combined analysis. 2 treatments would be considered equivalent if the one‐sided 95% CI upper limit of the difference in rates was <4 percentage points.
Life table analysis of ulcer rates comparing first 3 months with second 3 months.
Subgropu analysis: age>65; gender; race; past GI events; H pylori status; tobacco use; prior NSAID use; gastroduodenal erosions at baseline. ITT analysis Endoscopy: baseline, weeks 6, 12 and 24 and unscheduled discontinuations and for evaluation of GI symptoms. |
|
| Participants | OA N=742 >=50 yoa (Mean age 61.8, range 47‐7) prior NSAID use 93% required NSAID treatment for at least 6 months Patients with history of ulcer, perforation or GI hemmorrhage, endoscopically detected gastroduodenal erosion and active H pylori infection EXCLUSION : active duodenal, gastric or oesophageal ulcers; pyloric obstruction; patients with endoscopical evidence at baseline of erosive esophagitis, UGI ulcer or pyloric obstruction, previous upper GI surgery, inflammatory bowel disease, reduced renal function, faecal occult blood, unstable medical disease, bleeding diathesis, malignancy within previous 5 years, cerebrovascular events in previous 2 years, anticoagulant therapy, CCX, ticlopidine, aspirin. No baseline differences | |
| Interventions | rofecoxib 25 mg od rofecoxib 50 mg od ibuprofen 800mg tds placebo | |
| Outcomes | Primary: endoscopically detected ulcers >=3mm
Secondary: endoscopically detected ulcers >=5mm
Patient Global assessment of disease (Likert 0‐4); Paracetamol use Ulcer defined as mucosal break >= 3mm with unequivocal depth. Erosions defined as a mucosal break of any size with no depth |
|
| Notes | WITHDRAWAL: 293 = 39.5%
Primary hypothesis was that 25mg rofecoxib would cause fewer gastroduodenal ulcers than 800mg ibuprofen three times a day after 12 weeks of therapy. A priori subgroup analysis indicated that age >=65 years, history of past GI events, and prescence of gastroduodenal ulcer at baseline were risk factors for the development of ulcers. No evidence that Hpylori was a risk factor (p =0.983) The cumulative incidence of endoscopically detected gastroduodenal ulcers =3mm with rofecoxib (both doses) was comparable with placebo at 12 weeks (placebo 9.9%, 25 mg rofecoxib 4.1%, 50 mg rofecoxib 14.7%, p<0.001). IBUPROFEN The cumulative incidence of endoscopically detected gastroduodenal ulcers =3mm with rofecoxib (both doses) was SS lower than with ibuprofen (placebo 9.9%, 25 mg rofecoxib 4.1%, 50 mg rofecoxib 14.7%, and ibuprofen 27.7% p<0.001). 'equivalent' individual GI AEs, GI w/d not reported QA: R=2 B=2 W=0 |
|
| Risk of bias | ||
| Bias | Authors' judgement | Support for judgement |
| Allocation concealment? | Low risk | A ‐ Adequate |
McKenna 2000.
| Methods | 6 week double‐blind, US multicentre (20 sites) Double dummy FLARE CRITERIA: absolute score of at least 40mm for patient's VAS pain assessment; 1 or more grade increase in physician's global assessment; 1 or more grade increase in patient's global assessment; 2 or more point increase in OA severity index. PERMITTED: paracetamol for non‐arthritic pain (max 2 g per day); low dose aspirin (<=325mg) for cardiovascular prophylaxis; occaisional antacid use. NOT PERMITTED: anticoagulants; antirheumatic; antiulcer medication WASHOUT: 2 days or 5 half lives whichever longer RANDOMISATION: computer generated seperate schedules for those with pain assessment of <= 69mm at baseline and >= 70mm at baseline. POWER: 60 per group to provide 90% power to detect a treatment difference, using two‐tailed significance test and set the alpha level of significance at 0.05. Minimum treatment expected difference between active and placebo of 15mm on 100mm VAS. ITT analysis | |
| Participants | OA knee N=182 >=40 yoa (Mean age 62.2) INCLUSION: ACR functional class I‐III at screening; flare on analgesic withdrawal (2 days or 5 half‐life washout); women adequate contraception and not pregnant EXCLUSION: significant malignancy within 5 years; inflammatory arthritis or acute joint trauma of the knee; active GI, renal or hepatic disease; coagulation defect; clinically significant abnormal screening laboratory values; known hypersentivity to COX II inhibitors, sulphonamides or NSAIDs; surgery or invasive proceedure planned during the study; CCX within 8 weeks prior; intra‐articular hyaluronic acid within 6 months; investigational medication within 30 days; diagnosed/treated for oesophageal, gastric, pyloric channel or duodenal ulcer within 30 days. No SS differences at baseline | |
| Interventions | rofecoxib 25mg od celecoxib 200mg od placebo | |
| Outcomes | PRIMARY: pain (100mm VAS); WOMAC total; patient global assessment of arthritis (1‐5 Likert); SECONDARY: WOMAC pain, stiffness and physical functioning, total; physican global assessment of arthritis (1‐5 Likert); OsteoArthritis Seveity Index (0‐24): pain, walking disatance and activities of daily living. |
|
| Notes | WITHDRAWAL: 40( 22%) EFFICACY: Data given as p values with some graphical presentation: No SD's in tabulated data. Both active groups equivalent improvement pain, global assessment, WOMAC, which was superior to placebo.SAFETY: RR GI adverse events = 3.05 (95% CI: 1.39, 6.68) QA: R=2 B=1 W=1 | |
| Risk of bias | ||
| Bias | Authors' judgement | Support for judgement |
| Allocation concealment? | Unclear risk | B ‐ Unclear |
Moskowitz 2003.
| Methods | 2 week double‐blind US multicentre double‐dummy ITT analysis | |
| Participants | OA knee N=530 >=50 yoa met flare criteria | |
| Interventions | rofecoxib 10mg per day rofecoxib 25mg per day placebo | |
| Outcomes | PRIMARY: Pain intensity following 10minute walk(VAS) SECONDARY: "other validated OA efficacy measures" Pain intensity following 10 minute walk (VAS): baseline, 30mins, 1hour, 1hour 30mins, 2 hours, 3 hours, 4 hours 5 hours and 6 hours | |
| Notes | Abstract only Sponsored by Pfizer | |
| Risk of bias | ||
| Bias | Authors' judgement | Support for judgement |
| Allocation concealment? | Unclear risk | B ‐ Unclear |
NAPROXEN 901 OC/OF.
| Methods | 6 weeks double‐blind, multicentre international (80 sites) paracetamol rescue up to 2.6g Randomisation: computer generated schedule stratified for history of ulcer or upper GI bleeding and use of low‐dose aspirin. double dummy ITT analysis Sample size: individual studies 200 per group 95% power to demonstrate equivalence between rofecoxib and naproxen if true mean difference is zero. | |
| Participants | OA knee or hip N=482; N=462 >=40 yoa (Mean age 61.6) Requiring regular NSAIDs; pain on moste days in previous month; radiographic evidence. At least moderate pain on NSAID withdrawal and worse physician assessment of disease status. Exclusion: inflammatory or post‐traumatic arthritis; uncontrolled diabetes or hypertension; angina or CHF; malabsorption; morbid obesity; inherited bleeding disorder; positive fecal occult blood; creatinine clearance <30ml/min; serum creatinine >2.0; CCX; misoprostol; H2; PPI; warfarin; topicolone; aspirin >100mg/day; history of ulcer, upper GI bleed requiring aspirin; concomitant disease in which NSAIDS contraindicated. BASELINE: equivalent characteristics | |
| Interventions | rofecoxib 12.5 mg od naproxen 500mg bd | |
| Outcomes | Primary: WOMAC pain when walking; patient global response (0‐4 Likert); investigator global disease status(0‐4 Likert).
Average response over all observation times in 6 week treatment period excluding days 2‐6. Secondary: WOMAC (physical function, pain, stiffness, total score average, subscale average); patient global disease status (100mm VAS); investigator global response (0‐4 Likert); time to onset of pain relief. SAFETY: spontaneously reported AE's; vital signs; laboratory tests; NSAID‐related GI AEs. |
|
| Notes | WITHDRAWAL: 114 = 12.1% 2 identical studies in different continents. Analysis combined in publication. EFFICACY: no data reported. Authors report that for all efficacy endpoints treatment effects for rofecoxib and naproxen were comparable and seen at the first measures of efficacy. Subgroups equivalent. SAFETY: Authors report that both compunds were generally well tolerated with an improved gastrointestinal safety profile for rofecoxib versu naproxen. QA: R=2 B=2 W=1 |
|
| Risk of bias | ||
| Bias | Authors' judgement | Support for judgement |
| Allocation concealment? | Unclear risk | B ‐ Unclear |
Niccoli 2002.
| Methods | 2 week assessor‐ blind, single centre (Italy) POWER: 30 patients in each arm to detect a 20% reduction in creatine clearance values 80% power (a=0.05). Sodium intake not controlled therefore 24 hour urinary sodium excretion not measured. | |
| Participants | OA hip,hand and knee. N=96 60‐80 years of age (Mean age 72.3). ACR classifaction criteria for OA. Treatment arms equivalent at baseline. Exclusion:unreliable in self‐evaluation of symptoms; severe cardiovascular, renal or hepatic disorder; GI bleeding or peptic ulcer; hypersensitivity to NSAIDS; concomitant atnihistamines, antibiotics, NSAIDs, CCX, mucolytics, anticoagulants, antiplatelets or potentially nephrotoxic drugs; pregnancy or lactation; previous abnormalities in renal function (serum creatinine >1.5mg/dl; creatinine clearance <50ml/min). | |
| Interventions | rofecoxib 25mg/day diclofenac 50mg tds Amtolmetin guacyl (AMG) 600mg bd 3/7 then 600mg/day Drugs taken soon after meals. | |
| Outcomes | Primary: difference in creatinine clearance before and after treatment. Secondary: body weight; systolic and diastolic blood pressure; peripheral oedema; blood urea nitogen; serum creatinine, sodium, potassium, chlorum and uric acid; daily urine volume; creatinine clearance; blood cell count; liver function. EFFICACY: patient global pain (100mm VAS); patient global disease activity(100mm VAS); physician global disease activity(100mm VAS). | |
| Notes | Report states: "In the case of any adverse events related to the study drug, patients were withdrawn from the study". Dropouts replaced by next eligible patient who was assigned to the same treatment arm
Six patients (1 AMG; 1 diclofenac;4 rofecoxib) withdrew from the study during the first week of treatment due to intolerance or adverse events. These patients were not considered further.
WITHDRAWAL: unclear ‐ appears to be 6 (6.2%) EFFICACY: Authorts report a significant reduction all treatment groups. Multiple comparison analysis showed that diclofenac significantly reduced pain and the physician's global disease activity scores compared to rofecoxib (p<0.001). QA: R=1 B=1 W=1 |
|
| Risk of bias | ||
| Bias | Authors' judgement | Support for judgement |
| Allocation concealment? | Unclear risk | B ‐ Unclear |
Saag 1998 (MSD 033).
| Methods | 6 week double‐blind multicentre, no aspirin or CCX rescue paracetamol double dummy comparability stated if for all 3 primary endpoints, the 95% confidence intervals of the difference in the mean treatment response between 2 treatments were within + or ‐ 10mm on a 100mm VAS scale or 0.5 on a Likert scale 43% hypertension, 6% diabetes, 46% drug allergies,29% hypercholesterolemia, 27% hypothyroidism randomisation: computer generated schedule in a 1:4:4:4 scheme After 26 weeks, topical or systemic analgesics and CCX permitted for breakthrough pain. compliance assessed by returned tablet counts ITT analysis but only patients with baseline plus 1 treatment measurement included Analysis: average change from baseline over the six‐week treatment period. POWER: to detect differences of approximately 0.86 on LIkert and 14mm on VAS between rofecoxib and placebo with 99% power (alpha=0.05, 2 tailed) , given a sample size of 50 (placebo) and 200 (rofecoxib). At least 99% power to yield the 95% CI's within the comparability ranges for the 3 primary endpoints if the true difference between rofecoxib and ibuprofen would be 0, assuming 200 patients receiving each active treatment. | |
| Participants | OA hip and knee N=736 >= 40 years of age (Mean age 61.3 , range 39 to 91) ARA functional class I‐III clinical and radiographical confirmation history of benefit from NSAIDs or paracetamol increased pain following NSAID withdrawal and patients with moderate symptoms taking paracetamol Exclusion: CCX, topical analgesics, low dose aspirin, regular antacid, H2 blocker, PPI, warfarin or ticlopidine, significant renal impairment, evidence of active GI bleed, GI malabsorption syndrome, class III/IV angina or congestive heart failure, uncontrolled hypertension, stroke, TIA within 2 years, active hepatic disease, recent neoplastic disease, allergy to NSAID or paracetamol, and any other condition that could confound results, interfere with participation or put patient at risk BASELINE: no SS differences | |
| Interventions | rofecoxib 12.5mg od rofecoxib 25mg od ibuprofen 800mg tds placebo | |
| Outcomes | PRIMARY: WOMAC index: pain when walking; patient global response to therapy (0‐4); investigator global disease status (0‐4) SECONDARY: WOMAC index: pain, stiffness, functional ability; joint tenderness (0‐3); patient global disease status(10cm VAS) ; investigator global response to therapy(0‐4); study joint tenderness (0‐3); rescue paracetamol; LOE withdrawals |
|
| Notes | Withdrawals 111/736 = 15.1% EFFICACY: rofecoxib (both doses) SS superior to placebo (p<0.001) all OMs.SAFETY: RR GI withdrawals 12.5mg 0.79 (95% CI: ,0.16, 3.97 ), 25mg 1.22 (95% CI:0.26, 5.59 ), IBUPROFEN EFFICACY AND SAFETY: No SS differences between groups (efficacy p =0.05, ADRs p=0.1 and withdrawals due to ADRs p=0.1).RR GI withdrawals 12.5mg 0.72 (95% CI: 0.23, 2.24), 25mg 1.11 (95% CI:0.41, 3.02). |
|
| Risk of bias | ||
| Bias | Authors' judgement | Support for judgement |
| Allocation concealment? | Unclear risk | B ‐ Unclear |
Saag 2000 (MSD 034).
| Methods | 52 weeks double‐blind double dummy multicentre (43) international randomisation: computer generated schedule After 26 weeks, topical or systemic analgesics and CCX permitted for breakthrough pain. compliance assessed by returned tablet counts ITT analysis but only patients with baseline plus 1 treatment measurement included Primary efficacy analysis: average change from baseline over the first 12 week treatment period. Analyses also performed at 26 and 52 weeks. A secondary analysis of the last observed value in each treatment period, and an analysis of patients who completed the study were performed to confirm the findings of the primary analysis. Power: to detect differences of approximately 0.86 on the Likert scale and 14mm on the VAS between rofecoxib and placebo with 99% power (alpha=0.05, 2 tailed), given sample size of 200 in each group. Reported as at least 99% power to yeild the 95% CIs within the comparability ranges for the 3 primary end points if the true difference between rofecoxib and diclofenac would be 0, assuming 200 patients receiving each active treatment. | |
| Participants | OA hip and knee N=693 >= 40 years of age (Mean age 62.3; range 38‐85) ARA functional class I‐III history of benefit from NSAIDs or paracetamol increased pain following NSAID withdrawal and patients with moderate symptoms taking paracetamol Exclusion: CCX, topical analgesics, low dose aspirin, regular antacid, H2 blocker, PPI, warfarin or ticlopidine, significant renal impairment, evidence of active GI bleed, GI malabsorption syndrome, class III/IV angina or congestive heart failure, uncontrolled hypertension, stroke, TIA within 2 years, active hepatic disease, recent neoplastic disease, allergy to NSAID or paracetamol, and any other condition that could confound results, interfere with participation or put patient at risk 34% hypertension, 5% type 2 diabetes mellitus, 3% drug allergies, 7% hypercholesterolemia, 5% hypothyroidism No significant baseline differences in gender; ARA functional class; prior NSAID use; primary study joint; age or OA duration. 66.5% completed 1year | |
| Interventions | rofecoxib 12.5mg od rofecoxib 25mg od diclofenac 50mg tds | |
| Outcomes | Primary: WOMAC index: pain when walking; patient global response to therapy (0‐4); investigator global disease status (0‐4)* Secondary: WOMAC index: pain, stiffness, functional ability; joint tenderness (0‐3); patient global disease status(10cm VAS) ; investigator global response to therapy(0‐4); study joint tenderness (0‐3); rescue paracetamol; LOE withdrawals. Other: laboratory evaluations at each visit |
|
| Notes | WITHDRAWALS: 232/693 = 66.5%
Standard deviations of the efficacy variables not avaialble in the publication. Unclear what time period the endpoints reported are from (see methods) and no data available for the 'primary efficacy analyses [which] were based on the average change from baseline over the first 12 week treatment period.
Treatment period means given for response to therapy. Figure 4 states graphs for primary efficacy end points (WOMAC pain, physical function and stiffness), which conflict with those stated in the methods (see outcomes). Figure 4 also indicates that p<0.001 vs placebo, atlhough no placebo arm stated in the methods. Rofecoxib 12.5 mg signficantly less effective than diclofenac for secondary outcomes: pain when walking on a flat surface; investigator global response to therpay and patient global assesment of disease status. and use of rescue paracetamol. 25mg rofecoxib and diclofenac no significant difference. Report however states that " The 95% CIs for the difference between 12.5mg and 25mg rofecoxib versus diclofenac were contained within the prespecified comparability grounds for all of hte global assessments indicating clinical comparability of responses among the three treatments." Paper also states that " Signficant differences resulted from sample sizes, which needed to be large to ensure satisfaction of the comparability criteria."
Table2 and Table 3 are conflicting in terms of numbers of patients withdrawing due to lack of efficacy.
Although it states ITT analysis also states that " fewer than 1% of patients were missing sufficient data (either the baseline or all treatment period values) to exclude them from the efficacy analysis. EFFICACY AND SAFETY: Rofecoxib (both doses) of comparable efficacy and tolerability (including GI events) to diclofenac all endpoints. More patients discontinued due to ADRs in diclofenac group (SS not reported).Patient response to therapy: rofecoxib 12.5mg = ‐2.18, rofecoxib 25mg = ‐2.33, diclofenac = ‐2.39 (no reports of SS)RR GI withdrawals 12.5mg 0.47 (95% CI: 0.22, 1.02), 25mg 0.63 (95% CI:0.31, 1.26). QA: R=2 B=2 W=1 |
|
| Risk of bias | ||
| Bias | Authors' judgement | Support for judgement |
| Allocation concealment? | Unclear risk | B ‐ Unclear |
Schnitzer 2001.
| Methods | 6 week double‐blind paracetamol rescue | |
| Participants | OA knee or hip N= 1082 Mean age =62 Baseline equivalent 40% history of hypertension | |
| Interventions | rofecoxib 25mg od celecoxib 200mg od placebo | |
| Outcomes | WOMAC Patient Global Response to Therapy Blood pressure SBP: increase >20mm Hg and SBP>140 DBP: increase >15mm Hg and DBP>90 | |
| Notes | Abstract only RESULTs: More patients on placebo discontinued prematurely, primarily due to LOE. Compared to celecoxib, rofecoxib provided SS superior relief of night pain; morning stiffness; rest pain and walking pain; WOMAC subscales pain, stiffness and physical function; good or excellent response and quicker onset of efficacy. Both active groups superior to placebo. Similar incidence of clincial AEs, drug related AEs, serious AEs and discontinuations due to AEs in active groups. (From Schnitzer poster) RESULTS (From Geba poster): patients with pre‐defined changes in SCP: rofecoxib 45/471=9.6%; celecoxib 43/460 = 9.4%; placebo 5/151= 3.3% patients with pre‐defined changes in DBP: rofecoxib 13/471= 2.8%; celecoxib 9/460= 2%; placebo 3/151= 2% Number of withdrawls due to hypertension = 1 rofecoxib; 0 celecoxib; 0 placebo % good or excellent patient global response to therapy; rofecoxib 273/471; celecoxib 229/460 | |
| Risk of bias | ||
| Bias | Authors' judgement | Support for judgement |
| Allocation concealment? | Unclear risk | B ‐ Unclear |
SUCCESS VI.
| Methods | 6 week double‐blind, US/ Canada multicentre (101 sites) double dummy cuff BP measurements taken; arm with highest BP measurement taken PERMITTED:<= 325 mg aspirin permitted if stable dose fo 30 days prior; antiplatelets; paracetamol rescue (up to 4g); adjustment of diuretic/hypertensive at discretion of investigator not‐permitted: NSAIDS, oral or injected CCX; intraarticluar hyaluronic acid; prescription/OTC antiulcer drugs. WASHOUT: 4 days minimum RANDOMISATION: computer‐generated 1:1 in blocks of 4. ALLOCATION CONCEALMENT: known only by suppliers clinical packaging group. Sealed envelopes held by statistician. ITT analysis POWER: 405 patients per treatment arm to provide 90% power, with a two‐sided significance level of 0.05 to detect a treatment difference if the true event rates for oedema and hypertension for patients using rofecoxib and celecoxib were 10% and 4% respectively. | |
| Participants | OA hip, knee or hand N=810 older hypertensive patients treated with anti‐hypertensive medication >=65 yoa (Mean age 74.1) INCLUSION: stable controlled hypertension; ARC criteria for OA of hip, knee or hand; would benefit from chronic daily therapy with NSAID to control symptoms. seated diastolic <=95mmHg; systolic <=160mmHg; based on cuff measurement same dose of hypertensive for minimum of 3 months EXCLUSION: active GI disease; renal, hepatic or coagulation disorder; history of New York Heart Assocaition class III or IV heart failure; secondary hypertension; malignant hypertension; renal artery stenosis; acute joint trauma; rheumatoid arthritis; active untreated crystal induced arthropathies; known hypersensitivity to rofecoxib, celecoxib, sulphonamides, NSAIDs or related compounds; history of oesophageal, GI or duodenal ulceration within 30 days of study; use of celecoxib or rofecoxib within 30 days; serum creatinine >1.5mg/dL; blood urea nitrogen of at least 1.5 times upper limit of normal; serum potassium concentration <3.0 mmol/l or > 5.0 mmol/l. Equivalent at baseline except celceoxib greater mean duration of OA (p=0.012) and celecoxib more treated with ACE inhibitors (40% vs. 29%; p=0.002). Also more patients had a systolic BP of greater than 140mmHg at baseline in the celecoxib group (40 vs 37%) | |
| Interventions | rofecoxib 25mg od celecoxib 200mg od | |
| Outcomes | PRIMARY: significant peripheral oedema (0‐4 Likert) ; elevated hypertension (systolic or diastolic) : elevated systolic blood pressure (>20mmHg increase with absolute >140mmHg); elevated diastolic blood pressure (>15mmHg increase with absolute >90mmHg). Significant oedema: increase of at least 1 grade in peripheral plus 3% weight gain; increase of 2 or more with or without weight gain; increase to 4+ oedema; initiation or increase in medication for oedema. SECONDARY: hypertension; changes in diuretic and/or hypertensive medication; change in mean diastolic or systolic; new onset or worsening CHF; clinically significant renal lab vales. POST HOC: systolic BP changes and weight gain in patients experiencing oedema. |
|
| Notes | WITHDRAWAL: 114 (14%)
Cardiorenal events excluded from the overall safety analysis; therefore possibly underestimate.
Suitability of pooling the results with other studies?
Investigators were allowed to change diuretic/antihypertensive‐ no details on how many patients this occurred in. Could have biased results. Additionally more patients in the celecoxib group were receving ACE inhibitors at baseline (40% vs 29%; p=0.002). Also more patients had a systolic BP of greater than 140mmHg at baseline in the celecoxib group (40 vs 37%) although covariate analysis did not indicate this had a confounding effect. SPONSOR: Pharmacia Corporation and Pfizer Inc. SAFETY: incidence of oedema rofecoxib > celecoxib (p=0.014).Nearly 60% more patients with rofecoxib (1.6 fold increase) had increase in systolic blood pressure of =20mmHg (p<0.05) observed at week 2. At week 6 change in mean baseline bp +2.6mm rofecoxib and ‐0.47mm celecoxib (p=0.007). Diasatolic bp increased 2.3% rofecoxib compared to 1.2% celecoxib( p=0.29) Not all patients enrolled met current guidelines for hypertension control but were considered by investigator to have stable hypertension. QA: R=2 B=2 W=1 |
|
| Risk of bias | ||
| Bias | Authors' judgement | Support for judgement |
| Allocation concealment? | Low risk | A ‐ Adequate |
SUCCESS VII.
| Methods | 6 week double‐blind, US/ Canada multicentre (107 sites) double‐dummy cuff BP measurements taken; arm with highest BP measurement taken 4 day pre treatment NSAID washout PERMITTED:<= 325 mg aspirin permitted if stable dose fo 30 days prior; antiplatelets; paracetamol rescue (up to 4g); adjustment of diuretic/hypertensive at discretion of investigator; Occaisional use of paracetamol, non‐NSAID analgesics, glucosamine, chondroitin or other herbal preparations permitted for pain relief not‐permitted: NSAIDS, oral or injected CCX; intraarticluar hyaluronic acid; prescription/OTC antiulcer drugs. adjustment of diuretic/hypertensive at discretion of investigator RANDOMISATION: computer‐generated 1:1 in blocks of 4. ITT analysis POWER: 500 patients per treatment arm to provide 80% power, with a two‐sided significance level of 0.05 to detect a treatment difference in clincially significant elevations in systolic BP of 12.2% and 18.8% between celecoxib and rofecoxib respectively. | |
| Participants | OA hip,hand and knee N=1092 >= 65 yoa (Mean age 73.2) INCLUSION: ARC criteria for OA functional capacity I‐III; stable controlled hypertension; potential benefits from chronic daily NSAID therapy. Stable dose of antihypertensive medications for >= 3months seated diastolic <=95mmHg; systolic <=160mmHg EXCLUSION: active GI disease; renal, hepatic or coagulation disorder; history of New York Heart Assocaition class III or IV heart failure; secondary hypertension; malignant hypertension; renal artery stenosis; acute joint trauma; rheumatoid arthritis; active untreated crystal induced arthropathies; known hypersensitivity to rofecoxib, celecoxib, sulphonamides, NSAIDs or related compounds; history of oesophageal, GI or duodenal ulceration within 30 days of study; use of celecoxib or rofecoxib within 30 days; serum creatinine >1.5mg/dL; blood urea nitrogen of at least 1.5 times upper limit of normal; serum potassium concentration <3.0 mmol/l or > 5.0 mmol/l. Equivalent at baseline | |
| Interventions | rofecoxib 25mg od celecoxib 200mg od | |
| Outcomes | PRIMARY: significant peripheral oedema (0‐4 Likert) ; elevated systolic blood pressure (>20mmHg increase with absolute >140mmHg); change from baseline in mean systolic BP. Significant oedema: increase of at least 1 grade in peripheral plus 3% weight gain; increase of 2 or more with or without weight gain; increase to 4+ oedema; initiation or increase in medication for oedema. SECONDARY: ; changes in diuretic and/or hypertensive medication; change in mean diastolic; new onset or worsening CHF; clinically significant renal lab vales; any cardiorenal clinical event. POST HOC: systolic BP changes and weight gain in patients experiencing oedema. | |
| Notes | WITHDRAWAL: 104 (9.5%) SPONSOR: Pharmacia Corporation and Pfizer Inc. No overall rates of adverse events reported Subgroup analyses indicated that significant differences in mean systolic BP from baseline between celecoxib and rofecoxib in patients using ACE inhibitors and BB monotherapy or combined with diuretics. BP changes were minimal and not different between apteitns reeiveing calcium channel antagonists or diuretic monotherapy. Oedema more common in women receiving rofecoxib vs celecoxib 32 vs 16. In patients with clinically significant oedema, SS higher mean weight and mean diastolic BP increase occured in the rofecoxib group (+2.4kg; +10.1 mmHg) compared to the celecoxib group (+1.4kg; + 0.4mmHg). Conflicting statements in publication about numbers randomised; error in Table 1 QA: R=2 B=2 W=1 |
|
| Risk of bias | ||
| Bias | Authors' judgement | Support for judgement |
| Allocation concealment? | Unclear risk | B ‐ Unclear |
Truitt 2001(MSD 058).
| Methods | 6 week US multicentre (48) double‐blind? aspirin permitted rescue paracetamol RANDOMISATION: centralised computer‐generated schedule stratified according to low dose aspirin use and study site. Prospectively targeted group sizes: placebo, rofecoxib 25mg (target of 50 patients); rofecoxib 12.5mg and nabumetone (target of 100 patients) double dummy blinding ITT analysis POWER: 90% power to detect a difference of 13mm on the patient global assessment between rofecoxib and placebo (a=0.05, two tailed) | |
| Participants | OA knee or hip N=341 >=80 yoa (Mean age 83, range 80‐95) most painful joint designated study joint if both hip and knee affected Baseline characteristics reported as similar. INCLUSION: ambulatory; pain in study joint for at least 6 months, radiographically confirmed. ACR functional class I‐III; history of positive benefit from NSAIDS or paracetamol and to have taken in previous 20/30 days; ongoing low dose aspirin up to 325 mg permitted; >24 on 'Mini Mental State Examination' at screening; able to swallow; pre study washout flare with post‐washout Patient Global Assessment of Disease Status >= 40mm (100mm=very poor) EXCLUSION:prior history of inflammatory arthritis; acute ligamentous on meniscal injury to study joint within past 18 months;arthroscopy within 4 months;CCX within 3 months; other medical conditions or abnormal laboratory values that contraindicated NSAID use or could cofound; angina or CHF with symptoms at rest; decreased renal function; uncontrolled hypertension; active GI bleeding within past 3 months; history of leukaemia, lymphoma or myeloproliferative disease; hypersensitivity to aspirin or NSAIDS; postive stoll‐guaiac test. | |
| Interventions | rofecoxib 12.5 mg od rofecoxib 25mg od nabumetone 1500mg od placebo | |
| Outcomes | PRIMARY: patient global disease status (10cm VAS); SECONDARY: WOMAC index: pain; stiffness, physical function, (pain at night, morning stiffness); investigator global disease status (0‐4);LOE withdrawals; AE withdrawals;joint tenderness (0‐3); laboratory testing | |
| Notes | WITHDRAWAL: 49 (14.3%)
Not stated as double blind but double dummy used and safety assessor blinded.
EFFICACY: all OMs rofecoxib SS superior to placebo (p=0.001). NABUMETONE EFFICACY AND SAFETY: Results similar‐ but no reported results of significance tests in abstract or submission. QA: R=2 B=2 W=1 |
|
| Risk of bias | ||
| Bias | Authors' judgement | Support for judgement |
| Allocation concealment? | Unclear risk | B ‐ Unclear |
VACT.
| Methods | 6 weeks,
double‐blind,
US multicentre (29 sites) 6 week average for patient calculated as mean change from baseline to weeks 2,4 and 6. ; no CCX permitted. No rescue medication permitted. double‐dummy RANDOMISATION: computer generated POWER: 50 evaluable patients per treatment and subgroup, the half‐width of a 95% CI would be 8.3mm, assuming a within group SD of 30mm. With 75(100) patients per group the power to detect a treatment difference of 10mm on the WOMAC scale was 52% (65%). modified ITT: all patients taking at least 1 dose of study medication included. |
|
| Participants | OA knee N=382 >=40 yoa (Mean age 62.6; range 39‐91) INCLUSION: symptomatic OA for at least six months; ARA functional class I‐III. NSAID responsive or regular user of paracetamol for at least 30 days prior who experienced exacerbation following withdrawal EXCLUSION: concurrent medical or arthritic disease or abnormal laboratory values that might confound results or put patient at risk; history of allergy or hypersensitivity to study drugs, aspirin, ibuprofen or NSAID, sulphonamides; investigational drug within 30days of screening. BASELINE equivalence | |
| Interventions | rofecoxib 12.5mg od rofecoxib 25mg od celecoxib 200mg od paracetamol 1g qds | |
| Outcomes | WOMAC (100mm VAS) [ Pain on walking, night pain, pain at rest, morning stiffness, functional disability] patient global response to therapy (0‐4) | |
| Notes | WITHDRAWAL: 81( 21.2%)
Powered to compare rofecoxib with paracetamol
Average of values over time period used for analysis rather than change from baseline No correction for multiplicity; 5 primary endpoints with 4 different comparisons; 33 individual p values EFFICACY: Rofecoxib 25mg SS superior after 5 days to paracetamol (pain walking, night pain, rest pain, pain, stiffness, functional disability (p <0.05). Rofecoxib 25mg SS superior to celecoxib (night pain, rest pain, pain, stiffness, patient global response, (p <0.05). But equivalent on other outcome measures. Rofecoxib 25mg superior to rofecoxib 12.5mg night pain. Rofecoxib 12.5mg v celecoxib: no SS difference any efficacy endpoint early or 6 weeks. SAFETY: No SS difference in ADRs between groups RR total AE = 1.19 (95% CI: 0.93, 1.53) 12.5mg and 1.00 (95% CI: 0.76, 1.32) and AE withdrawals = 1.77 (95% CI: 0.53, 5.85) 12.5mg and 1.53 (95% CI: 0.45, 5.26). GI events not reported. QA: R=2 B=2 W=1 |
|
| Risk of bias | ||
| Bias | Authors' judgement | Support for judgement |
| Allocation concealment? | Unclear risk | B ‐ Unclear |
VACT 2.
| Methods | 6 weeks | |
| Participants | N=1578 (median age 62) demographics similar | |
| Interventions | rofecoxib 12.5 or 25mg od celecoxib 200mg od paracetamol 1g qds | |
| Outcomes | ||
| Notes | Published in abstract only. Methods reported as being identical to VACT 1. REPORTED RESULTS: Number of patients with a good or excellent response not significantly different at week 6; signficant at weeks 2 and 4. Cumulative regression analysis of PGART was significantly greater with Rof25mg compared to CEL. Rof 12.5 mg not signficantly different to CEL. Coxibs significantly grater PGART vs ACET at any time point. Time to good or excellent PGART response was significantly quicker in for rof 25mg compared to celecoxib.All coxibs significantly quicker than paracetamol. For the four WOMAC endpoints both rof 12.5mg and 25mg had signficantly greater reductions compared to CEL and PARA. WOMAC subscales improvement greater with ROF25 compared to CEL and all coxibs greater than PAR. |
|
| Risk of bias | ||
| Bias | Authors' judgement | Support for judgement |
| Allocation concealment? | Unclear risk | D ‐ Not used |
RA = rheumatoid arthritis OA = osteo arthritis ; N= number of patients enrolled; yoa = years of age; OMs= outcome measures; SS= statistically significant; LOE= lack of efficacy; DMARD= disease modifying antirheumatic agent; CCX= corticosteroids; GCX= glucocorticoids; MTX= methotrexate; VAS= Visual Analogue Scale, AE= adverse events; RR = risk ratio; 95% CI= 95% confidence interval; US= United States; UK= United Kingdom; NHP= Nottingham Health Profile; ESR= erythrocyte sedimentation rate; # = number of; HAQ= ; CRP= C‐reactive protein; VAS‐= visual analogue scale, od= once daily, bd= twice daily, tds= three times a day, CHF= congestive heart failure, TIA = transient ischaemic attack; QA=quality assessment (Jadad), R=randomization, B=blinding, W=withdrawals and dropouts,* denotes primary outcome measure
Characteristics of excluded studies [ordered by study ID]
| Study | Reason for exclusion |
|---|---|
| Bjarnason 1998 | Healthy volunteers |
| Eskiyurt 2001 | Uncontrolled cohort study |
| Gertz 2002 | Pooled analysis |
| Lanza 1999 | Healthy volunteers with endpoints of impact on mucosa |
| Lipsky 1997 | Report of results of Simon 1998 |
| Malmstrom 1999 | Dental pain |
| Reicin 2002 | Pooled analysis |
| Reitblat 2002 1 | Non‐randomised. Examination of blood pressure elevation. |
| Singh 1999 | Non‐randomised uncontrolled study |
| VICOXX | Non‐randomised uncontrolled cohort . Patients started on NSAIDS then transferred to rofecoxib |
Declarations of interest
None known
Edited (no change to conclusions)
References
References to studies included in this review
Acevedo 2001(MSD902) {published data only}
- Acevedo E, Casteneda O, Ugaz M, Beaulieu AD, Pons‐Estel B, Caeiro F, Casas N, Garza‐Elizondo M, Irazoque F, Hinojosa W, Gutierrez‐Urena S, Vandormael K, Rodgers DB, Laurenzi M. Tolerability profiles of rofecoxib (Vioxx) and Arthrotec. A comparison of six weeks treatment in patients with osteoarthritis. Scand J Rheumatol 2001;30:19‐24. [DOI] [PubMed] [Google Scholar]
- Laurenzi M, Vandormael K, Daniels B, Seidenberg B, Nuyen K, Vala M, et al. Comparison of the tolerability profile of rofecoxib and Arthrotec(TM) in patients with osteoarthritis‐study design and baseline characteristics [poster]. EULAR. 2000.
- Laurenzi M, Vandormael K, Malice MP, Jasan J, Vala M, Justice S, Bozalis D. Comparison of the tolerability profile of rofecoxib and Arthrotec(TM) in patients with osteoarthritis [poster]. EULAR. 2000.
Advantage 2000 {published data only}
- Geba GP, Lisse JR, Perlman M, Polis AB, Dixon ME, Skalky CS. Gastrointestinal tolerability in primary care patients treated with naproxen or rofecoxib for osteoarthritis: the ADVANTAGE trial. EULAR abstract SAT0096, Prague. 2001.
- Geba GP, Lisse JR, Perlman M, Polis AB, Dixon ME, Skalky CS. The efficacy of rofecoxib versus naproxen in osteoarthritis: subgroup analysis by joint in the advantage trial. EULAR abstract THU0248. 2000.
- Geba GP, Polis AB, Bohidar NR, et al. Edema adverse experiences in 5557 osteoarthritis patients treated with rofecoxib compared to naproxen in the ADVANTAGE trial: a multivariate analysis [abstract]. ACR Annual Scientific Meeting, New Orleans. 2002.
- Geba GP, Polis AB, Bohidar NR, et al. Hypertension among rofecoxib compared to naproxen in the ADVANTAGE trial: a multivariate analysis. ACR Annual Scientific meeting, New Orleans. 2002.
- Geba GP, Polis AB, Bohidar NR, et al. Hypertension and oedema related adverse events among diabetic patients treated with rofecoxib or naproxen in the population of and osteoarthritis trial: ADVANTAGE. ACR, Orlando. 2003.
- Geba GP, Polis AB, Bohidar NR, Petruschke RA, Dobbins TW, Rush JR, Keane WF. Effect of rofecoxib versus naproxen: hypertension and edema adverse events in a multivariate analysis involving 5557 patients from the ADVANTAGE trial. EULAR abstract THU0220. 2000.
- Geba GP, Polis AB, Dixon MB, Skalky CS, Myers DA, Higginbotham JA, Caldwell JR, Wingert KJ, Gormley GJ. Gastrointestinal tolerability in primary care patients treated with naproxen or rofecoxib for osteoarthritis(OA): the ADVANTAGE trial. EULAR conference. 2000.
- Geba GP, Polis AB, Shalky CS, Petruschke RA, Dobbins TW. Rofecoxib versus naproxen in osteoarthritis patients receiving concomitant low dose aspirin: a sub‐group analysis involving 719 patients from the ADVANTAGE trial. EULAR abstract THU0252. 2000.
- Geba GP, Polis AB, Skalky CS, et al. Gastrointestinal tolerability among osteoarthritis patients receiving low dose aspirin in combination with rofecoxib or naproxen [absract]. ACR New Orleans. 2002.
- Lisse JR, Perlman M, Johansson G, Shoemaker JR, Schechtman J, Skalky CS, Dixon ME, Polis AB, Mollen AJ, Geba GP. Gastrointestinal tolerability and effectiveness of rofecoxib versus naproxen in the treatment of osteoarthritis. A randomised controlled trial. Annals of Internal Medicine 2003;139:539‐546. [DOI] [PubMed] [Google Scholar]
Bianchi 2003 {published data only}
- Bianchi M, Broggini M. A randomised, double‐blind, clinical trial comparing the efficacy of nimesulide, celecoxib and rofecoxib in osteoarthritis of the knee. Drugs 2003;63(Supplement 1):37‐46. [DOI] [PubMed] [Google Scholar]
Cannon 2000(MSD 035) {published data only}
- Cannon GW, Caldwell JR, Holt P, McLean B, Seidenberg B, Bolognese J, et al. Rofecoxib, a specific inhibitor of cyclooxygenase 2, with clinical efficacy comparable with that of diclofenac sodium: results of a one‐year, randomized, clinical trial in patients with osteoarthritis of the knee and hip. Rofecoxib Phase III Protocol 035 Study Group. Arthritis & Rheumatism 2000;43(5):978‐987. [DOI] [PubMed] [Google Scholar]
- Cannon GW, Caldwell JR, Holt P, et al. MK‐0966, a specific COX‐2 inhibitor, has clinical efficacy comparable to diclofenac in the treatment of knee and hip osteoarthritis (OA) in a 26‐week controlled clinical trial [abstract]. Arthritis & Rheumatism 1998;41(Suppl 9):Abstract 983. [Google Scholar]
- Cannon GW, Krupa D, Sperling R, Truitt K. Two‐year efficacy of rofecoxib and diclofenac in treatment of knee and hip osteoarthritis [abstract]. Eular, Lisbon. 2003.
- Cannon GW, Krupa DA, McCormick CL, Mehta A, Reicin AS. Rofecoxib has a lower incidence of increased liver function tests and LFT‐related adverse events in comparison to diclofenac [abstact]. EULAR, Lisbon. 2003.
CRESCENT (Sowers) {published data only}
- Sowers J, White W, Pitt B. Rofecoxib, but not celecoxib or naproxen, increases mean 24‐hour systolic blood pressure: results of a randomized double blind controlled trial in treated hypertensive patients with osteoarthritis (oa) and type 2 diabetes mellitus?. American Journal of Hypertension 2003;16 supplement(5,2):11A. [Google Scholar]
- Sowers J, Ingen H, White W, et al. Rofecoxib but not celecoxib, at doses providing equal OA efficacy increases mean 24‐hour systolic blood pressure in treated hypertensive patients with osteoarthritis and type 2 diabetes mellitus [abstract]. EULAR, Lisbon Abstract FRI0279. 2003.
Day 2000 (MSD 040) {published data only}
- Day RO, Luza A, Castaneda O, et al. MK‐0966, a specific cox‐2 inhibitor, has clinical efficacy comparable to ibuprofen in the treatment of knee and hip OA in a 6 week controlled trial; XIV European League against Rheumatism Congress, [abstract]. EULAR. 6‐11 June, Glasgow 1999; Vol. Abstract no 860.
- Day RO, Morrison B, Luza A. A randomized trial of the efficacy and tolerability of the COX‐2 inhibitor rofecoxib vs ibuprofen in patients with osteoarthritis. Rofecoxib/Ibuprofen Comparator Study Group. Archives of Internal Medicine 2000;160(12):1781‐87. [DOI] [PubMed] [Google Scholar]
Ehrich 1999 (pilot) {published data only}
- Ehrich EW, Schnitzer TJ, McIlwain H, Levy R, Wolfe F, Weisman M, et al. Effect of specific COX‐2 inhibition in osteoarthritis of the knee: a 6 week double blind, placebo controlled pilot study of rofecoxib. Rofecoxib Osteoarthritis Pilot Study Group. Journal of Rheumatology 1999;26(11):2438‐447. [PubMed] [Google Scholar]
Ehrich 2001(MSD 029) {published data only}
- Ehrich EW, Bolognese J, Watson DJ, Kong SK. Effect of rofecoxib on measures of health‐related quality of life in patients with osteoarthritis. American Journal of Managed Care 2001;7(6):609‐616. [PubMed] [Google Scholar]
- Ehrich EW, Bolognese JA, Watson DJ, et al. The effect of MK‐0966 (Vioxx), a cox‐2 specific inhibitor, on health related quality of life in osteoarthritis patients. Rheumatology Europe 1998;27(suppl 2):119 abstract 197. [Google Scholar]
- Ehrich EW, Schnitzer TJ, Kivitz AJ, et al. MK‐966, a highly selective COX‐2 inhibitor, was effective in the treatment of osteoarthritis (OA) of the knee and hip in a 6‐week placebo controlled study [abstract]. Arthritis & Rheumatism 1997;40(suppl 9):Abstract 330. [Google Scholar]
- Ehrich EW, Schnitzer TJ, Weaver AL, et al. Treatment with MK‐966 (Vioxx), a specific cox‐2 inhibitor, resulted in clinical improvement in osteoarthritis (OA) of the knee and hip, that was sustained over six months. Rheumatology Europe 1998;27(Suppl 2):119 abstract 198. [Google Scholar]
Geba (MSD 090) {published data only}
- Geba GP, Polis AB, Najarian DK, et al. Onset of efficacy and patient assessment of clinical response in osteoarthritis (OA): comparison of rofecoxib to nabumetone. American Geriatric Society. 2001.
- Weaver AL, Polis AB, Petruschke RA, et al. Onset of efficacy of rofecoxib compared to nabumetone and placebo in patients with osteoarthritis. EULAR. 2003.
- Weaver AL, Polis AB, Petruschke RA, Najarian DK, Geba GP. Onset of efficacy of rofecoxib compared to nabumetone and placebo in patients with osteoarthritis. ‐. ‐. [DOI] [PubMed]
Gibofsky 2003 {unpublished data only}
- Gibofsky A, Williams G, McKenna F, Fort J. Comparing the effiacy of cyclooxygenase 2‐specific inhibitors in treating osteoarthritis. Arthritis and Rheumatism 2003;48(11):3102‐3111. [DOI] [PubMed] [Google Scholar]
- Pincus T, Gibofsky A, Williams G, McKenna F. Celecoxib 200mg QD and rofecoxib 25mg QD show similar efficacy in the treatment of a flare of osteoarthritis of the knee. EULAR abstracts online. 2002.
Hawkey 2000(MSD 045) {published data only}
- Hawkey C, Laine L, Simon T, Beaulieu A, Maldonado‐Cocco J, Acevedo E, et al. Comparison of the effect of rofecoxib (a cyclooxygenase 2 inhibitor), ibuprofen, and placebo on the gastroduodenal mucosa of patients with osteoarthritis: a randomized, double‐blind, placebo‐controlled trial. The Rofecoxib Osteoarthritis Endoscopy Multinational Study Group. Arthritis & Rheumatism 2000;43(2):370‐377. [DOI] [PubMed] [Google Scholar]
Herrera 2003 {published data only}
- Herrera JA, González, M. Comparative Evaluation of the Effectiveness and Tolerability of Nimesulide Versus Rofecoxib Taken Once a Day in the Treatment of Patients with Knee Osteoarthritis. American Journal of Therapeutics 2003;10(6):468‐472. [DOI] [PubMed] [Google Scholar]
Kivitz 2004(MSD 085) {published data only}
- Geba G, Polis A, Dixon M, et al. Rofecoxib results in superior clinical response compared to nabumetone in the treatment of osteoarthritis. Arthritis & Rheumatism 1999;42(Suppl 9):Abstract 440. [Google Scholar]
- Kivitz AJ, Greenwald MW, Cohen SB, Polis AB, Najarian DK, Dixon ME, et al. Efficacy and safety of rofecoxib 12.5mg versus nabumetone 1000mg in patients with osteoarthritis of the knee: a randomised controlled trial. Journal of the American Geriatrics Society 2004;52:666‐674. [DOI] [PubMed] [Google Scholar]
- Laurenzi M, Geba G, Polis A, Dixon M, Brady P, Green JA, et al. Evaluation of onset of action of rofecoxib, naproxen and nabumetone in patients with osteoarthritis (OA) [poster]. EULAR 2000. 2000.
- Weaver AL, Polis AB, Petruschke RA, et al. Onset of efficacy of rofecoxib compared to nabumetone and placebo in patients with osteoarthritis. EULAR. 2003.
Laine 1999 (MSD 044) {published data only}
- Laine L, Harper S, Simon T, Bath R, Johanson J, Schwartz H, et al. A randomized trial comparing the effect of rofecoxib, a cyclooxygenase 2‐specific inhibitor, with that of ibuprofen on the gastroduodenal mucosa of patients with osteoarthritis.Rofecoxib Osteoarthritis Endoscopy Study Group [see comments]. Gastroenterology 1999;117(4):776‐783. [DOI] [PubMed] [Google Scholar]
- Laine L, Harper S, Simon TJ, et al. Randomized study of rofecoxib, a cyclooxygenase‐2 specific inhibitor, on the gastroduodenal mucosa of osteoarthritis. Arthritis & Rheumatism 1999;42(Suppl 9):S145‐Abstract 448. [Google Scholar]
McKenna 2000 {published data only}
- McKenna F, Weaver A, Fiechtner J, Bello A, Fort JG. Cox‐2 specific inhibitors in the management of osteoarthritis of the knee: a placebo‐controlled randomised, double‐blind study. Journal of Clinical Rheumatology 2001;7(Supplement 3):151‐159. [DOI] [PubMed] [Google Scholar]
- McKenna F, Weaver AL, Fiechtner JI, Bello AE, Fort J. CoX‐2 specific inhibitors in the management of osteoarthritis of the knee‐ a placebo‐controlled randomised,double‐blind study [poster]. EULAR conference 2000. [DOI] [PubMed]
Moskowitz 2003 {published data only}
- Moskowitz RW, Jones RB, Cawkwell G. Valdecoxib 10mg demonstrates a rapid onset of action following a single dose in patients with OA of the knee in a flare state [abstract. EULAR FRI 0277. 2003.
NAPROXEN 901 OC/OF {published data only}
- Laurenzi M, Geba G, Polis A, Dixon M, Brady P, Green JA, et al. Evaluation of onset of action of rofecoxib, naproxen and nabumetone in patients with osteoarthritis (OA) [poster]. EULAR. 2000.
- Myllykangas‐Luosujarvi R, Lu HS, Chen SL, Choon D, Amante C, Chow CT, Pasero G, Genti Gy, Sarembock B, Zerbini CAF, Vrijens F, Moan A, Rodgers DB, Tora L, Laurenzi. Comparison of low‐dose rofecoxib versus 1000mg naproxen in patients with osteoarthritis. Scandanavian Journal of Rheumatology 2002;31:337‐344. [DOI] [PubMed] [Google Scholar]
Niccoli 2002 {published data only}
- Niccoli L, Bellino S, Cantini F. Renal tolerability of three commonly employed non‐steroidal anti‐inflammatory drugs in elderly patients with osteoarthritis. Clinical and Exeprimental Rheumatology 2002;20:201‐207. [PubMed] [Google Scholar]
Saag 1998 (MSD 033) {published data only}
- Saag K, Fisher C, Mckay J, et al. MK‐0966, a specific COX‐2 inhibitor has clinical efficacy comparable to ibuprofen in the treatment of knee and hip osteoarthritis (OA) in a 6‐week controlled clinical trial [abstract]. Arthritis & Rheumatism 1998;41(Suppl 9):Abstract 242. [Google Scholar]
- Saag K, Heijde DVd, Fisher C, Samara AM, Tora L, Bolognese JA, et al. Rofecoxib, a new cyclooxygenase 2 inhibitor, shows sustained efficacy comparable with other nonsteroidal anti‐inflammatory drugs. Archives of Family Medicine 2000;9(10):1124‐1134. [DOI] [PubMed] [Google Scholar]
Saag 2000 (MSD 034) {published data only}
- Acevedo E, Romanowicz A, Heijde DVd, et al. Rofecoxib, a cox‐2 specific inhibitor (C‐2 SI), had clinical efficacy comparable to diclofenac in the treatment of knee and hip osteoarthritis (OA) in a one‐year controlled clinical trial; XIV European League against Rheumatism Congress, [abstract]. EULAR. 6‐11 June, Glasgow 1999; Vol. 206 Abstract 858.
- Cannon GW, Krupa D, Sperling R, Truitt K. Two‐year efficacy of rofecoxib and diclofenac in treatment of knee and hip osteoarthritis [abstract]. Eular, Lisbon. 2003.
- Cannon GW, Krupa DA, McCormick CL, Mehta A, Reicin AS. Rofecoxib has a lower incidence of increased liver function tests and LFT‐related adverse events in comparison to diclofenac [abstact]. EULAR, Lisbon. 2003.
- Saag K, Heijde DVd, Fisher C, Samara AM, Tora L, Bolognese JA, et al. Rofecoxib, a new cyclooxygenase 2 inhibitor, shows sustained efficacy comparable with other nonsteroidal anti‐inflammatory drugs. Archives of Family Medicine 2000;9(10):1124‐1134. [DOI] [PubMed] [Google Scholar]
Schnitzer 2001 {unpublished data only}
- Geba GP, Polis AB, Dixon ME, Dobbins TW, Rush JE, Weir MR. Comparative blood pressure effects of rofecoxib, celecoxib, and placebo in patients with osteoarthritis: a randomised controlled trial. EULAR. 2002.
- Schnitzer TJ, Kivitz AJ, Greenwald M, Fleischmann RM, Matzura‐ Wolfe D, Polis AB, Dixon ME, Dobbins PW, Geba GP. Rofecoxib provides superior relief of symptoms of osteoarthritis(OA) compared to celecoxib. EULAR conference abstracts. 2001.
SUCCESS VI {published data only}
- Whelton A, Fort J, Puma J, Normandin D, Bello AE, Verburg KM. Cyclooxygenase‐2 specific inhibitors and cardiorenal function: a randomised controlled trial of celecoxib and rofecoxib in older hypertensive osteoarthritis patients. American Journal of Managed Care 2002;8(15 Supplement):S371‐382. [DOI] [PubMed] [Google Scholar]
- Whelton A, Fort J, Puma J, Normandin D, Bello AE, Verburg KM. Cyclooxygenase‐2 specific inhibitors and cardiorenal function: a randomised controlled trial of celecoxib and rofecoxib in older hypertensive osteoarthritis patients [poster]. EULAR. 2000. [DOI] [PubMed]
SUCCESS VII {unpublished data only}
- Whelton A, White W, Bello A, Puma J. Blood pressure control and edema rates in older patients with hypertension and osteoarthritis following treatment with COX‐2 specific inhibitors. EULAR confernce proceedings. 2002.
- Whelton A, White W, Bello A, Puma J, Fort J and Success VII investigators. Effects of celecoxib and rofecoxib on blood pressure and edema in patients > or = 65 years of age with systemic hypertenision and osteoarthritis. American Journal of Cardiology 2002;90(9):959‐963. [DOI] [PubMed] [Google Scholar]
- White W, Whelton A, Bello A, Puma J. Rofecoxib but not celecoxib increases systolic blood pressure in hypertensive patients treated with ACE inhibitors and beta blockers. EULAR. 2002.
Truitt 2001(MSD 058) {published data only}
- Truitt K, Ettinger W, Schnitzer TJ, et al. Rofecoxib, a Cox‐2 specific inhibitor had a clinical efficacy and overall safety in treating OA patients over 80 years and older; XIV European League against Rheumatism Congress, [abstract]. 6‐11 June, Glasgow 1999. EULAR. 1999; Vol. Abstract no. 859.
- Truitt KE, Sperling RS, Ettinger WH, Greenwald M, DeTora L, Zeng Q, Bolognese J, Ehrich E. A multicenter, randomised, controlled trial to evaluate the safety profile, tolerability and efficacy of rofecoxib in advanced elderly patients with osteoarthritis. Aging Clin Exp Res 2001;13:112‐121. [DOI] [PubMed] [Google Scholar]
VACT {unpublished data only}
- Geba G, Polis A, Petruschke R, Keane W. Hypertension adverse experiences among osteoarthritis patients treated with rofecoxib, celecoxib or acetaminophen in the 'VACT' trials [abstract]. EULAR, Lisbon. 2003.
- Geba G, Weaver A, Polis A, et al. Pooled analysis of the VACT studies: the response of osteoarthritis patients to therapy with rofecoxib, celecoxib or acetaminophen [Abstract]. American Pain Society, Poster 826. 2003.
- Geba G, Weaver A, Polis A, Petruschke R, Schnitzer T. The response of osteoarthritis patients to therapy with rofecoxib, celecoxib or acetaminophen: a pooled analysis of the VACT trials [abstract]. EULAR, Lisbon. 2003.
- Geba G, Weaver AL, Schnitzer TJ, Polis A, Dixon M, Kivitz AJ, et al. A clinical trial comparing rofecoxib to celecoxib and paracetamol in the treatment of osteoarthritis (OA): early efficacy results. Eular conference proceedings. 2000.
- Geba GP, Schnitzer TJ, Polis AB, et al. Patient global assessment and WOMAC response among osteoarthritis patients treated with rofecoxib, celecoxib or acetaminophen in the VACT‐2 trial. EULAR. 2003.
- Geba GP, Weaver AL, Polis AB, Dixon ME, Schnitzer TJ. Correction. JAMA 2002;287:989A. [DOI] [PubMed] [Google Scholar]
- Geba GP, Weaver AL, Polis AB, Dixon ME, Schnitzer TJ. Efficacy of rofecoxib, celecoxib and acetaminophen in osteoarthritis of the knee. JAMA 2002;287(1):64‐71. [DOI] [PubMed] [Google Scholar]
VACT 2 {published data only}
- Geba G, Polis A, Petruschke R, Keane W. Hypertension adverse experiences among osteoarthritis patients treated with rofecoxib, celecoxib or acetaminophen in the 'VACT' trials [abstract]. EULAR, Lisbon. 2003.
- Geba G, Weaver A, Polis A, et al. Pooled analysis of the VACT studies: the response of osteoarthritis patients to therapy with rofecoxib, celecoxib or acetaminophen [Abstract]. American Pain Society, Poster 826. 2003.
- Geba G, Weaver A, Polis A, Petruschke P, Schnitzer T. Analysis of the onset of efficacy with rofecoxib, celecoxib and acetaminophen in osteoarthritis: the VACT‐2 trial. EULAR, Lisbon. 2003.
- Geba G, Weaver A, Polis A, Petruschke R, Schnitzer T. The response of osteoarthritis patients to therapy with rofecoxib, celecoxib or acetaminophen: a pooled analysis of the VACT trials [abstract]. EULAR, Lisbon. 2003.
- Geba GP, Schnitzer TJ, Polis AB, et al. Patient global assessment and WOMAC response among osteoarthritis patients treated with rofecoxib, celecoxib or acetaminophen in the VACT‐2 trial. EULAR. 2003.
- Geba GP, Weaver AL, Polis AB, et al. Onset of efficacy with rofecoxib, celecoxib and acetaminophen in osteoarthritis: the VACT‐2 trial. American Pain Society. 2003.
- Geba GP, Weaver AL, Polis AB, et al. Response of osteoarthritis patients to therapy with rofecoxib, celecoxib or paracetamol. Presented at Pain in Europe IV, 4th Congress of the European Federation of IASP Chapters, Prague, Czech Republi. September 2‐6, 2003.
References to studies excluded from this review
Bjarnason 1998 {published data only}
- Bjarnason I SGCReal. COX‐2 specific inhibition with MK‐096625 or 50 mg Q.D. does not increase intestinal permeability [abstract]. American journal of Gastroenterology 1998;93(9):1670‐Abstract 246. [Google Scholar]
Eskiyurt 2001 {unpublished data only}
- Eskiyurt N. The first experience of the efficacy and safety of coxibs in turkish nation. EULAR conference abstracts. 2001.
Gertz 2002 {published data only}
- Gertz BJ, Krupa D, Bolognese JA, Sperling RS, Reicin A. A comparison of adverse renovascular experiences among osteoarthritis patients treateed with rofecoxib and comparator non‐selective non‐steroidal anti‐inflammatory agents. Current Medical Research and Opinion 2002;18:82‐91. [DOI] [PubMed] [Google Scholar]
Lanza 1999 {published data only}
- Lanza FL, Rack MF, Simon TJ, Quan H, Bolognese JA, Hoover ME, et al. Specific inhibition of cyclooxygenase‐2 with MK‐0966 is associated with less gastroduodenal damage than either aspirin or ibuprofen. Alimentary Pharmacology & Therapeutics 1999;13(6):761‐767. [DOI] [PubMed] [Google Scholar]
Lipsky 1997 {published data only}
- Lipsky PE IP. Outcome of specific COX‐2 inhibition in rheumatoid arthritis. J‐Rheumatol 1997;24 Suppl 49:9‐14. [PubMed] [Google Scholar]
Malmstrom 1999 {published data only}
- Malmstrom K, Daniels S, Kotey P, Seidenberg B, Desjardins P. Comparison of rofecoxib and celecoxib, two cyclooxygenase‐2 inhibitors in postoperative dental pain: a randomized, placebo‐ and active‐comparator‐controlled clinical trial. Clinical Therapeutics 1999;21(10):1653‐1663. [DOI] [PubMed] [Google Scholar]
Reicin 2002 {published data only}
- Reicin AS, Shaprio D, Sperling RS, Barr E, Yu Q. Comparison of cardiovascular thrombotic events in patients with osteoarthritis treated with rofecoxib versus nonselective NSAIDs. American Journal of Cardiology 2002;89:204‐209. [DOI] [PubMed] [Google Scholar]
Reitblat 2002 1 {published data only}
- Reitblat T, Zamir D, Estis L, Priluk R, Drogenikov T, Viskoper JR. The different patterns of blood presure elevation by rofecoxib and nabumetone. Journal of Human Hypertension 2002;16(6):431‐4. [DOI] [PubMed] [Google Scholar]
Singh 1999 {published data only}
- Singh G, Ramey D, Triadafilopoulos G. Early experience with selective COX‐2 inhibitors; safety profile in over 340,000 patient years of use [abstract]. Arthritis & Rheumatism 1999;42(Suppl 9):Abstract 1352. [Google Scholar]
VICOXX {published data only}
- Arboleya LR, Figuera E, Soledad M, Aragon B. Experience of rofecoxib in patients with osteoarthritis previously treated with traditional non‐steroidal anti‐inflammatory durgs in Spain: results of phase 2 of the VICOXX study. Current Medical Research and Opinion 2003;19(4):278‐297. [DOI] [PubMed] [Google Scholar]
References to studies awaiting assessment
Goldstein 2002 {unpublished data only}
- Goldstein J, Bello A, Fort J. Differential rates of UGI symptoms in patients receiving celecoxib versus rofecoxib with and without low dose aspirin for cardiovascular prophylaxis. EULAR conference abstracts. 2000.
Hawkey 1999 ab {published data only}
- Hawkey C, Laine L, Mortensen E, et al. Treatment of osteoarthritis with rofecoxib, a COX‐2 specific inhibitor, was associated with a lower incidence of gastroduodenal ulcers compared to ibuprofen and was comparable to placebo treatment [abstract]. Proceedings of the 14th Congress of hte European League Against Rheumatism. Glasgow, 199.
Laine 1999ab {published data only}
- Laine L, Hawkey C, Harper S, et al. Effect of the COX‐2 specificn inhibitor rofecoxib on ulcer formation: a double blind comparison with ibuprofen and placebo [abstract]. Gasteroenterology 1999;116:A232. [Google Scholar]
Rack 1999 {published data only}
- Rack, MF, Simon T, Quan H, et al. Selective inhibition of cyclooxygenase 2 (COX2) with MK0966 is associated with less gastroduodenal damage than aspirin or ibuprofen. Aliment Pharmacol Ther 1999;13:761‐767. [DOI] [PubMed] [Google Scholar]
Watson 2000 {published data only}
Whelton 2000 {published data only}
- Whelton A, Schulman G, Wallemark D, Drower EJ, Isakson PC, ver Geis GS. Effects of celecoxib and naproxen on renal function in the elderly. Archives of Internal Medicine 2000;160:1465‐1470. [DOI] [PubMed] [Google Scholar]
Whelton 2001 {published data only}
- Whelton A, Fort J, Puma J, Normandin D, Bello AE, Verburg KM. Cyclooxygenase‐2 specific inhibitors and cardiorenal function: a randomised controlled trial of celecoxib and rofecoxib in older hypertensive osteoarthritis patients. American Journal of Therapeutics 2001;8:85‐95. [DOI] [PubMed] [Google Scholar]
Additional references
Bellamy 1997
- Bellamy N, Kirwan J, Boers M. Recommendations for a core set of outcome measures for future phase lll clinical trials in knee,hip and hand osteoarthritis.Consensus development at OMERACT III. J Rheum 1997;24:700‐802. [PubMed] [Google Scholar]
Bombardier 2000
- Bombardier C, Laine L, Reicin A, et al. Comparison of upper gastrointestinal toxicity of Rofecoxib and Naproxen in patients with rheumatoid arthritis. The VIGOR trial.. New England Journal of Medicine 2000;343(21):1520‐1584. [DOI] [PubMed] [Google Scholar]
Brooks 1999
- Brooks P. Interpreting the clinical significance of the differential inhibition of cyclooxygenase‐1 and cyclooxygenase‐2. British Journal of Rheumatology 1999;38:779‐787. [DOI] [PubMed] [Google Scholar]
Cannon 2003
- Cannon GW, Krupa DA, McCormick CL, Mehta A, Reicin AS. Rofecoxib has a lower incidence of increased liver function tests and LFT‐related adverse events in comparison to diclofenac [abstact]. EULAR, Lisbon. 2003.
Cannon 2003
- Cannon GW, Krupa D, Sperling R, Truitt K. Two‐year efficacy of rofecoxib and diclofenac in treatment of knee and hip osteoarthritis [abstract]. Eular, Lisbon. 2003.
Ehrich 2000
- Ehrich EW, et al. Minimal perceptible clinical improvement with the Western Ontario and McMaster Universities osteoarthritis index questionnaire and global assessments in patients with osteoarthritis. Journal of Rheumatology 2000;27(11):2635‐2641. [PubMed] [Google Scholar]
Garner 2004
- Garner S, Fidan D, Frankish R, Judd M, Towheed T, Wells G, Tugwell P. Rofecoxib for the treatment of rheumatoid arthritis. Cochrane Database of Systematic Reviews 2004, Issue 3. [Google Scholar]
Gertz 2002
- Gertz B, et al. A comparison of adverse renovascular experiences among osteoarthritis patients treated with rofecoxib and comparator non‐selective non‐steroidal anti‐inflammatory agents. Current Medical Research and Opinion 2002;18(2):82‐91. [DOI] [PubMed] [Google Scholar]
Glaser 1995
- Glaser KB. Clycooxygenase selectivity and NSAIDS. Inflammopharmacology 1995;3:335‐345. [Google Scholar]
Hawkey 2001
- Hawkey CJ, Laine L. Harper SE, Quan HUI, Bolognese JA, Mortensen E. Influence of risk factors on endoscopic and clinical ulcers in patients taking rofecoxib or ibuprofen in two randomised controlled trials. Aliment Pharmacol Ther 2001;15:1593‐1601. [DOI] [PubMed] [Google Scholar]
Henry 1996
- David Henry, Lynette L‐Y Lim, Luis A Garcia Rodriguez, Susanne Perez Gutthann, Jeffrey L Carson, Marie Griffin, Ruth Savage, Richard Logan, Yola Moride, Chris Hawkey, Suzanne Hill, James T Fries. Variability in risk of gastrointestinal complications with individual non‐steroidal anti‐inflammatory drugs: results of a collaborative meta‐analysis. BMJ 1996;312:1563‐1566. [DOI] [PMC free article] [PubMed] [Google Scholar]
Jadad 1996
- Jadad AR, Moore RA, Carrol D, Jenkinson C. Assessing the quality of reports of randomised controlled trials: is blinding necessary?. Controlled Clinical Trials 1996;17:1‐12. [DOI] [PubMed] [Google Scholar]
Kawai 1998
- Kawai S, Nishida S, Kato M, Furumaya Y, Okamoto R, et al. Comparison of cyclooxygenase 1 and 2 inhibitory activities of various nonsteroidal anti‐inflammatory drugs using human platelets and synovial cells. European Journal of Pharmacology 1998;347:87‐94. [DOI] [PubMed] [Google Scholar]
Konstam 2001
- Konstam MA, et al. Cardiovascular thrombotic events in controlled clinical trials of rofecoxib. Circulation 2001;104(19):2280‐2288. [DOI] [PubMed] [Google Scholar]
Lanes 2000
- Lanes S, Rodriguez LAG, Hwang E. Baseline risk of gastrointestinal disorders among new users of meloxicam, ibuprofen, diclofenac, naproxen and indomethacin.. Pharmacoepidemiology and Drug Safety 2000;9:113‐117. [DOI] [PubMed] [Google Scholar]
Langman 1994
- Langman MJ, Weil J, Wainwright P, et al. Risks of bleeding peptic ulcer associated with individual non‐steroidal anti‐inflammatory drugs.. Lancet 1994;343:1075‐1078. [DOI] [PubMed] [Google Scholar]
Larkai 1989
- Larkai EN. Dyspepsia in NSAID users: the size of the problem.. J Clin Gastroenterol 1989;11(2):158‐162. [DOI] [PubMed] [Google Scholar]
Layton 2003
- Layton D, Heeley E, Hughes K, Shakir SA. Comparison of the incidence rates of thromboembolic events reported for patients prescribed rofecoxib and meloxicam in general practice in England using prescription event monitoring PEM data. Rheumatology 2003;42:1342‐1353. [DOI] [PubMed] [Google Scholar]
Mamdani 2002
- Mamdani M, Rochon PA, Juurlink D, et al. Observational study of upper GI haemorrhage in elderly patients given selective cyclo‐oxygenase 2 inhibitors or conventional NSAIDs. BMJ 2002;325:624. [DOI] [PMC free article] [PubMed] [Google Scholar]
Mamdani 2004
- Mamdani M. Juurlink D, Lee D, et al. Cyclooxygenase 2 inhibitors versus non‐selective non‐steroidal anti‐inflammatory drugs and congestive heartfailure outcomes in elederly patients; a population based cohort study. Lancet 2004;363:1751‐1756. [DOI] [PubMed] [Google Scholar]
Ray 2002
- Ray WA, Stein M, Daugherty JR, et al. Cox 2 selective non‐steroidal anti‐inflammatory drugs and risk of serious coronary heart disease. Lancet 2002;360:1071‐1073. [DOI] [PubMed] [Google Scholar]
Reicin 2002
- Reicin AS, Shaprio D, Sperling RS, Barr E, Yu Q. Comparison of cardiovascular thrombotic events in patients with osteoarthritis treated with rofecoxib versus nonselective NSAIDs. American Journal of Cardiology 2002;89:204‐209. [DOI] [PubMed] [Google Scholar]
Reindeau 1997
- Riendeau D, Percival M, Boyce C, et al. Biochemical and pharmacological profile of a tetrasubstituted furanone as a highly selective COX 2 inhibitor. British Journal of Pharmacology 1997;121:105‐117. [DOI] [PMC free article] [PubMed] [Google Scholar]
Schulz 1995
- Schulz KF, Chalmers I, Hayes RJ, Altman D. Empirical evidence of bias: dimensions of methodological quality associated with estimates of treatment effects in controlled trials. Journal of the American Medical Association 1995;273:408‐412. [DOI] [PubMed] [Google Scholar]
Silverstein 1995
- Silverstein F, Graham D, Senior J, et al. Misoprostol reduces serious gastrointestinal complications in patients with rheumatoid arthritis receiving nonsteroidal anti‐inflammatory drugs. Annals of Internal Medicine 1995;123:241‐249. [DOI] [PubMed] [Google Scholar]
Simon 1996
- Simon LS. Nonsteroidal antiinflammatory drugs and their effects; the importance of COX "selectivity". Journal of Clinical Rheumatology 1996;2(3):135‐140. [DOI] [PubMed] [Google Scholar]
Singh 1996
- Singh G. Ramey DR. Morfeld D. Shi H. Hatoum HT. Fries JF. Gastrointestinal tract complications of nonsteroidal anti‐inflammatory drug treatment in rheumatoid arthritis. A prospective observational cohort study. Arch Int Med 1996;156:1530‐1536. [PubMed] [Google Scholar]
Solomon 2004
- Solomon DH, Schneeweiss S, Glyn RJ. Relationship between selective cyclooxygenase 2 inhibitors and acute myocardial infarction in older adults. Circulation 2004;109:2068‐2073. [DOI] [PubMed] [Google Scholar]
Stalnikowicz 1993
- Stalnikowicz R, Rachmilewitz D. NSAID‐induced gastroduodenal damage: is prevention needed?. Journal of Clinical Gastroenterology 1993;17:238‐243. [DOI] [PubMed] [Google Scholar]
Van Hecken 2000
- Hecken A, Schwartz J, Depre M, et al. Comparative Inhibitory activity of rofecoxib, meloxicam, diclofenac, naproxen on cox 2 versus cox 1 in healthy volunteers. J Clin Pharmacol 2000;40:1109‐1120. [PubMed] [Google Scholar]
Vane 1998
- Vane JR, Bakhle YS, Botting RM. Cyclooxygenases 1 and 2.. Annual Review of Pharmacology & Toxicology 1998;38:97‐120. [DOI] [PubMed] [Google Scholar]
Warner 1999
- Warner TD, Giuliano F, VojnovicI, Bukasa A, Mitchell JA, Vane JR. Nonsteroid drug selectivities for cyclo‐oxygenase‐1 rather than cyclo‐oxygenase‐2 are associated with human gastro‐intestinal toxicity: a full in vitro analysis. Proc Natl Acad Sci USA 1999;96:7563‐7568. [DOI] [PMC free article] [PubMed] [Google Scholar]
Weir 2003
- Weir MR, Sperling R, Reicin A, et al. Selective Cox 2 inhibition and cardiovascular effects: a review of the rofecoxib development program. American Heart Journal 2003;146(4):591‐604. [DOI] [PubMed] [Google Scholar]
Whelton 1991
- Whelton A, Hamilton CW. Nonsteroidal antiinflammatory drugs: effect on kidney function. Journal of Clinical Pharmacology 1991;31:588‐598. [DOI] [PubMed] [Google Scholar]