
Figure 5.
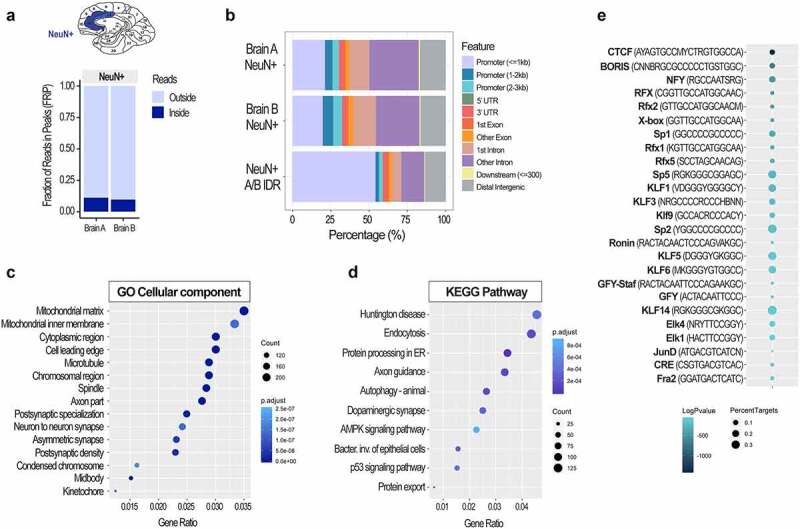
Chromatin accessibility analysis using cell type-specific ATAC-seq assay in post-mortem human brain. FRiP scores (a) and genomic peak distribution (b) of the ATAC-seq data generated from neuronal (NeuN+) nuclei of the two post-mortem human anterior cingulate cortices (Brodmann areas 24/32; Brains A and B). A/B IDR peaks, high confidence peaks generated by the IDR analysis, were then used for the GO Cellular component (c) and KEGG pathway (d) analyses. Colours indicate adjusted p values and dot size corresponds to gene count. Top 15 GO and top 10 KEGG pathways are shown. Motif analysis of the ATAC-seq data (e) shows top 25 transcription factor binding motifs. Colours indicate log adjusted P values and dot size corresponds to percent target.