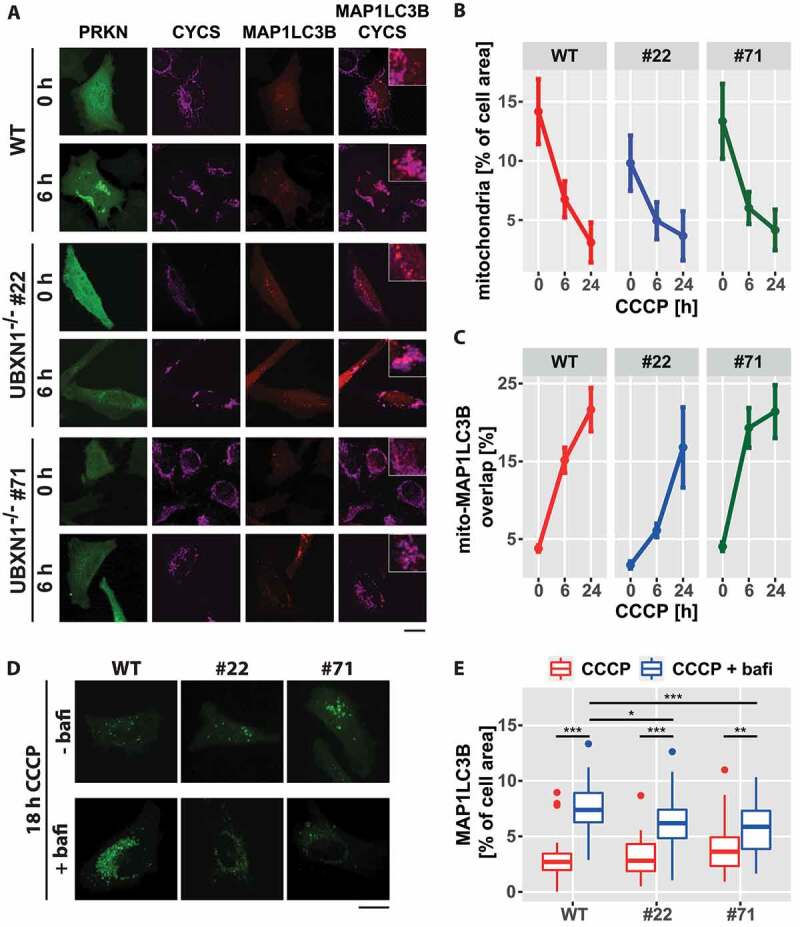
Figure 9.

Loss of UBXN1 negatively impacts mitophagic flux. (A) HeLa cells (WT) and HeLa UBXN1-/- clone 22 (#22) and clone 71 (#71) cells transfected with expression plasmids for mCherry-MAP1LC3B and YFP-PRKN and treated with 25 µM CCCP for 6 h were fixed and stained using mouse anti-CYCS antibodies and imaged by confocal microscopy. Shown are representative images from three independent experiments. Scale bar: 20 µm. (B) Loss of mitochondrial mass was determined in images of panel A. Shown is the mean mitochondrial area from 32 to 51 cells per condition from three independent experiments. (C) Overlap between CYCS and MAP1LC3B as determined in images of panel A. Shown are mean percent mitochondrial area overlapping with MAP1LC3B from 32 to 51 cells per condition from three independent experiments. (D) HeLa cells (WT) and cells of HeLa UBXN1-/- clone 22 (#22) and HeLa UBXN1-/- clone 71 (#71) were transfected with expression plasmids for GFP-MAP1LC3B and mCherry-PRKN, treated with 25 µM CCCP or 25 µM CCCP plus 100 nM bafilomycin A1 for 18 h. After fixation, cells were and imaged by confocal microscopy. Scale bar: 20 µm. (E) Using image analysis on confocal images of panel D, the density of GFP-MAP1LC3B dots as measure of autolysosome area per cell was determined. The boxplot represents data from 28 to 40 cells per condition.
