

Summary
The composition of the intestinal microbiota is associated with both the development of tumors and the efficacy of anti-tumor immunity. Here we examined the impact of microbiota-specific T cells in anti-colorectal cancer (CRC) immunity. Introduction of Helicobacter hepaticus (Hhep) in a mouse model of CRC did not alter the microbial landscape, but increased tumor infiltration by cytotoxic lymphocytes and inhibited tumor growth. Anti-tumor immunity was independent of CD8+ T cells but dependent upon CD4+ T cells, B cells and NK cells. Hhep colonization induced Hhep-specific T follicular helper (Tfh) cells, increased the number of colon Tfh and supported the maturation of Hhep+ tumor-adjacent tertiary lymphoid structures. Tfh cells were necessary for Hhep-mediated tumor control and immune infiltration and adoptive transfer of Hhep-specific CD4+ T cells to Tfh deficient Bcl6fl/flCd4Cre mice restored anti-tumor immunity. Thus, introduction of immunogenic intestinal bacteria can promote Tfh-associated anti-tumor immunity in the colon, suggesting therapeutic approaches for the treatment of CRC.
Keywords: Colorectal cancer, T follicular helper cell, microbiome, T cells, bacteria-specific, tertiary lymphoid structure, tumor microenvironment
Graphical Abstract

eTOC blurb
The effectiveness of immune-mediated cancer therapy is modulated by the microbiota. Overacre-Delgoffe et al. reveal that colonization of mice with an immunogenic intestinal bacteria, Helicobacter hepaticus, induces Hhep-specific T follicular helper cells and tumor-adjacent lymphoid structures, thereby promoting anti-tumor immunity.
Introduction
Colorectal cancer (CRC) is one of the most common and deadly forms of cancer, representing almost 10% of all cancer deaths worldwide. (Arnold et al., 2017; Bray et al., 2018; Favoriti et al., 2016; Rawla et al., 2018). Late stage metastatic CRC carries a very poor prognosis and is largely refractory to current treatments (Bray et al., 2018; Tauriello et al., 2017). Immunotherapy has revolutionized the treatment of multiple kinds of epithelial cell cancers but has shown minimal effectiveness in CRC (Le et al., 2015). The reasons for this are not fully understood, highlighting a need for a deeper mechanistic understanding of the intrinsic and environmental factors that define the immune response to CRC (Mlecnik et al., 2016).
Organized lymphoid aggregates composed of T and B cells, known as Tertiary Lymphoid Structures (TLS) are a positive prognostic marker for many types of solid tumors including CRC (Cabrita et al., 2020; Galon and Lanzi, 2020; Helmink et al., 2020; Mlecnik et al., 2016; Petitprez et al., 2020). TLS are also associated with positive responses to immunotherapy, but the mechanism of TLS formation and how they augment immunotherapy is not clear. In general, TLS form in response to chronic infection and inflammation (Koscsó et al., 2020; Randall and Kern, 2014; Rangel-Moreno et al., 2011) but in the context of cancer, it is unknown why there is such heterogeneity from patient to patient.
The microbiome is a collection of microorganisms that live alongside or directly against barrier surfaces, and in mammals the largest population lives in the colon (Gilbert et al., 2018). The colonic microbiota has a large impact on multiple aspects of host biology by digesting food and providing metabolites necessary for host health. In particular, the microbiota plays a critical role in shaping the host immune response, and different members of the microbiota have distinct abilities to induce T cell activation and differentiation (Atarashi et al., 2015; Honda and Littman, 2016; Lathrop et al., 2011). Immune responses to intestinal resident bacteria can be modified by the local environment, with infection, inflammation and diet all having important effects on the development and differentiation of microbiome-specific T cell responses (Ansaldo et al., 2019; Hand, 2016; Hand et al., 2012; Ivanov et al., 2009; Rothschild et al., 2018; Wegorzewska et al., 2019; Xu et al., 2018). Thus, each interaction between the immune system and a member of the microbiota is highly contextual. For instance, Helicobacter hepaticus (Hhep), an adherent bacterium that resides predominantly in the cecum and colon, induces local immune responses that vary broadly depending on the immune status of the host (Chai et al., 2017; Xu et al., 2018). In conditions of health, Hhep colonization induces CD4+ T cells that differentiate into regulatory (Treg) or follicular helper (Tfh) states but under immunodeficient settings the presence of Hhep drives the differentiation of inflammatory Hhep-specific Th1 and Th17 cells and the development of colitis (Kullberg et al., 2003; Xu et al., 2018).
The composition of the microbiota can contribute to the development of disease, including CRC. Some intestinal bacteria, such as certain strains of E. coli and enterotoxigenic B. fragilis, can have a ‘pro-tumor’ effect by directly interacting with colorectal tumors, driving mutagenesis and induction of inflammatory cytokines (Arthur et al., 2012; Dejea et al., 2018; Grivennikov et al., 2012; Kostic et al., 2013; Schwabe and Jobin, 2013; Sears and Garrett, 2014). Alternatively, some compositions of the microbiome and specific bacterial taxa are associated with immunotherapy responses in animal models and melanoma patients (Gopalakrishnan et al., 2018; Iida et al., 2013; Matson et al., 2018; Routy et al., 2018). In accord with the plastic nature of the immune response to colonic Helicobacter, it is associated with both pro- and anti-CRC effects, depending upon the circumstances of the host. For instance, in settings of immunodeficiency (Tra−/−) or in mice prone to colonic inflammation such as Il10−/− mice, Helicobacter spp. colonization is sufficient to induce colitis and supports the development of CRC (Erdman et al., 2003; Maloy et al., 2005). Conversely, the transfer of the microbiota from wild-caught mice, which has substantial amounts of Helicobacter spp., to gnotobiotic animals leads to reduced CRC growth(Rosshart et al., 2017). Our ability to use the microbiome to augment tumor immunity is limited because the basic underlying mechanisms that determine whether a given member of the microbiota contributes to tumor growth or control are unknown. Therapeutic advances in this regard necessitate a better understanding of the role of microbiome-specific T cells in promoting or limiting immune responses against tumors.
We hypothesized that innately immunogenic bacteria such as Hhep, which inhabit the mucus layer and adhere to the colonic epithelium would be more likely to modulate the immune response and might have an effect that exceeds their relative low abundance (Fox et al., 1994; Li et al., 2015). We found that Hhep colonization limited tumor burden and extended overall survival in a carcinogen-induced orthotopic mouse model of colorectal cancer. More CD4+ T cells, B cells and NK cells were observed in tumors of Hhep-colonized mice and antibody depletion studies confirmed the importance of these three immune cell types, but not CD8+ T cells, in limiting tumor progression. Hhep-colonized mice with CRC exhibited lymphatic vessels and TLS close to the tumors and Hhep-specific Tfh cells could be detected trafficking to the TLS. Bcl6fl/flCd4Cre mice did not exhibit Hhep-mediated induction of TLS and CRC control. Adoptive transfer of naïve Hhep-specific CD4+ T cells into Bcl6fl/flCd4Cre mice restored TLS formation, immune infiltration of the tumor and control over CRC growth. Therefore, colonic bacteria-specific CD4+ T cell responses contribute to anti-tumor immunity in CRC and may represent a target to augment cancer immunotherapy.
Results
H. hepaticus remodels the tumor microenvironment and leads to long-term survival in colorectal cancer.
We hypothesized that an intestinal bacteria-specific immune response during tumor development may lead to enhanced anti-tumor immunity but that any effects would be highly dependent upon the properties of the bacteria chosen. Therefore, we modified the colonic microbiota through the addition of an intrinsically immunogenic intestinal bacteria: Helicobacter hepaticus (Hhep) (Danne and Powrie, 2018; Kullberg et al., 2006; Xu et al., 2018). Hhep colonization of tumor-bearing mice allowed us to directly assess how the local microbiota modified the differentiation of colon-resident T cells and subsequently, whether changes in colonic T cells had an effect on the growth of CRC. C57BL/6 mice from Jackson labs are tested to be free of Hhep and have a relatively homogenous intestinal microbiome that makes them a well-controlled system for these experiments. We colonized mice undergoing the azoxymethane-dextran sodium sulfate (AOM-DSS) model of colitis-associated colon cancer with Hhep, after tumors had developed (week 7) and assessed weight gain, tumor burden, and long-term survival (Fig. 1A and Fig. S1A). AOM-DSS was an attractive model for these studies because it is responsive to the intestinal microbiome (Zackular et al., 2013) and is also characterized by slow developing colon tumors, so we could measure the local effects on the immune response during the various stages of tumor development. After oral gavage with Hhep, C57BL/6 mice were stably colonized, and Hhep was detected in fecal samples at all timepoints assessed (Fig. 1B). In contrast to Il10−/− or T cell deficient mice where Hhep increases CRC burden, we found that Hhep colonization of tumor-bearing lymphoreplete C57BL/6 mice led to a survival advantage (Fig. 1C), and a reduction in both tumor number and size (Fig. 1D–E) (Ge et al., 2017; Kullberg et al., 1998; Nagamine et al., 2008a). The anti-tumor effect was conserved when Hhep was gavaged prior to AOM-DSS treatment and a subset of mice in our CRC model benefitted when Hhep was given as late as week 9 post-tumor induction (Fig. S1B). Together, these data suggest that Hhep colonization alone mediates a potent anti-tumor effect in the colon.
Figure 1. H. hepaticus reduces tumor burden and leads to long-term survival in colorectal cancer.

C57Bl/6 Hhep-free mice were injected i.p. with 10mg/kg AOM on day 0 and given 3% DSS in their drinking water on days 7–14, 28–35, and 49–56. Half of the mice were gavaged on day 45 and 49 with Hhep.
(A) Experimental plan
(B) qPCR of Hhep in the stool from the indicated timepoints of mice from (A). Dotted line represents the LOD.
(C) Survival plots of mice from (A).
(D) Tumor number and size from (C), plotted over time.
(E) Tumor number and representative image of colons 12 weeks into the AOM-DSS protocol.
(F-G) Representative image of immunofluorescence staining of colon sections 12 weeks post AOM. CD4 (green), CD19 (red), CD11c (purple), and DAPI (blue).
(H-I) Quantification of CD4 T cells within the total tumor or percent found in the tumor core from (F-G).
(J) Quantification of tumors with characteristics of a necrotic core at either 9- or 12-weeks post AOM. Fractions below each column represent the number of mice in each group that had at least one tumor with a necrotic core.
Data are a composite of 2 (B-C) independent experiments with 9–10 mice per group, 7 (D) independent experiments with 4–5 mice per group, and 2 (F-J) independent experiments with 3 mice per group and 2–3 tumors per mouse quantified. Error bars represent the mean ± SEM. Kaplan-Meier (C), one way ANOVA (H) and student’s T test (D, I-J) were used. *p<0.05, **p<0.005, ***p<0.0005.
The colonic microbiota can vary during disease and is a critical regulator of both the growth of colorectal tumors and anti-tumor immune responses, so we sought to determine how intestinal colonization with Hhep during tumorigenesis impacted the microbiome. Hhep colonization had modest effects on the general structure of the microbiota of mice carrying colorectal tumors (Fig. S1C–E). At later timepoints (D82), Hhep-colonized mice could be discriminated from untreated AOM-DSS controls on the basis of the microbiota, with Hhep-colonized mice grouping closer to the healthy pre-treatment (D0) microbiota (Fig. S1C). This difference in the late (day 82) microbiota was characterized by an enrichment in Ruminococcaceae (as determined by ANCOM), which has been associated with better patient outcomes in melanoma (Fig. S1F).
Since we observed only modest effects on the colonic microbiota, we next focused on the possibility that Hhep colonization was modulating the colonic immune response in mice with CRC. We hypothesized that Hhep colonization was increasing immune cell infiltration of the tumor which is typical of tumors which respond better to therapy (Galon and Lanzi, 2020; Mlecnik et al., 2016; Sharma et al., 2017). Imaging of tumor sections revealed that Hhep colonization led to an increase in CD4+ T cells, B cells and CD11c+ cells in the tumor (Fig. 1F–G). Quantitative analysis of our imaging data revealed that tumors in Hhep-colonized mice were populated with more CD4+ T cells and that these cells were found at a higher frequency within the tumor core, with a lower proportion of CD4+ T cells confined to vessels running through the tumor (Fig. 1F–I and Fig. S1G–H). In addition, tumors from colonized mice regularly had areas with sparse DAPI staining, consistent with a necrotic core (Fig. 1J). Flow cytometric analysis indicated that there was a decrease in the ratio of CD4+Foxp3+ Treg cells to CD4+Foxp3− T cells within in the tumor compartment, consistent with an increase in tumor-resident conventional CD4+ T cells (Tconv cells) in Hhep-colonized mice (Fig. S2A–B). Altogether we have shown that colonizing mice with an immunogenic intestinal bacteria can lead to substantial control over tumor growth that is associated with increased immune cell infiltration of the tumor.
Hhep-driven anti-tumor immunity is associated with an increase in cytotoxic lymphocytes in and around colorectal tumors.
To more comprehensively capture the effects of Hhep colonization on the TME of CRC, we performed single cell RNA sequencing (scRNAseq) on total cells from the tumor-containing epithelial layer (EL) and lamina propria (LP) layer 12 weeks into the AOM-DSS protocol (Fig. S2C). We isolated the entire EL because clearly isolating distinct tumors at this time can be challenging. DeteRministic Annealing Gaussian mixture mOdels for clusteriNg Single-Cell data (DRAGON) clustering analysis identified 12 distinct cellular clusters within the EL comprising the major cell types known to associate with the colonic epithelium (Fig. S2D). Analysis of the EL scRNAseq clusters indicated that Hhep colonization induced an increase in a mixed group of cytotoxic lymphocytes (Cluster 1) and effector T cells (Cluster 5) consistent with the hypothesis that Hhep colonization is promoting more effective anti-tumor immunity in CRC (Fig. 2A–C and Fig. S2D). Deeper analysis of scRNAseq data revealed that Cluster 1 contained a variety of different Natural Killer (NK) cells and T cells (CD8+, CD4+, NK) expressing genes related to cytotoxic function (Gzma, Fasl, Tbx21) (Fig. 2D–E and S2E). In accord, Hhep colonization also increased cellular expression of the chemokine Cxcl10, associated with the trafficking of cytotoxic T and NK cells and the number of cells expressing its receptor Cxcr3 (Fig. 2F and S2F). Confocal microscopy revealed that Hhep colonization increased the accumulation of NK cells and T cells in colorectal tumors (Fig. S2G–H). Taken together, we demonstrate Hhep colonization leads to increased tumor infiltration by lymphocytes with cytotoxic functions.
Figure 2. Hhep induces cytotoxic lymphocytes in and around colorectal tumors.

CRC was induced in mice as in 1A.
(A-D) Cells from EL at week 12 of the AOM-DSS protocol (3 AOM-DSS mice, 3 AOM-DSS + Hhep mice) were enriched for CD45+ cells, labeled with CD45/MHCi cell hashing antibodies, and sequenced and analysed as single cell RNAseq samples.
(A) Heatmap of 12 unique clusters found within the EL samples.
(B) UMAP visualization and DRAGON clustering of EL revealed 12 unique clusters across all samples.
(C) Quantification and forest plot of (B).
(D) Subclustering of Cluster 1 (Cytotoxic lymphocytes). 7 unique clusters were identified.
(E-F) Violin plots of (E)Gzma and (F)Cxcr3 within cells of the EL calculated from scRNAseq dataset.
Data represent 1 independent experiment with 3 mice per group. Wilcoxon rank sum test was used (E-F). ***p<0.0005.
Hhep colonization drives Hhep-specific CD4+ T follicular helper cell expansion.
The majority of immunotherapeutic approaches, including those in CRC, target the activation of CD8+ T cells, primarily through boosting cytotoxic effector function (Diaz and Le, 2015; Le et al., 2017; McLane et al., 2019; Twyman-Saint Victor et al., 2015). NK cells and CD4+ T cells can also mediate potent cytotoxic anti-tumor effects (Bihl et al., 2010; Doorduijn et al., 2017; Ma et al., 2018). Whether CD8+ T cells are critical in Hhep-mediated protection against tumors was not clear. Underscoring the diversity of cell types that express cytotoxic functions found in colorectal tumors, antibody-mediated depletion experiments revealed that Hhep-mediated anti-tumor immunity was independent of CD8+ T cells and dependent upon the presence CD4+ T cells and to a lesser extent NK cells(Fig. 3A and S3A). Therefore, we analyzed the colonic CD4+ T cell response to Hhep colonization. Hhep is known to induce both Treg and Tfh CD4+ T cell responses, but how the anti-Hhep T cell response is shaped by CRC is not known (Chai et al., 2017; Xu et al., 2018). To analyze Hhep-specific CD4+ T cells, we utilized both MHC class II tetramers and congenic CD45.1+ Hhep-specific TCR transgenic mice (HH5-1tg CD45.1) (Fig. 3B and S3B–D). Flow cytometry of the colon LP revealed a durable increase in the percent of Tfh cells (CXCR5+PD1+CD4+ T cells) amongst CD4+ T cells after Hhep colonization (Fig. 3B–D and S3B–E). Using both Hhep-specific tetramers and Hhep-specific TCR transgenic CD4+ T cells (HH5-1tg), we detected that a large proportion of LP and mesenteric lymph node Hhep-specific CD4+ T cells developed into Bcl6+, CXCR5+, and PD1+ expressing Tfh cells that persisted for at least 4 weeks post-Hhep colonization (Fig. 3C–E and S3C–G). This was in contrast to tumor-free controls (DSS + Hhep, without AOM), where Hhep-specific T cells were induced to differentiate into Treg cells (Fig. S3H–I) (Chai et al., 2017; Xu et al., 2018). In non Hhep-colonized mice, Hhep-specific TCR tg T cells could not be recovered from the colon, indicating that these cells require Hhep for activation and differentiation (Fig. S3D). Analysis of adoptively transferred T cells specific to a different Hhep epitope (HH7–2tg) in Hhep colonized mice also showed that the majority differentiated into Tfh cells, indicating that a Tfh cell dominated anti-Hhep response is generalizable in the context of colorectal tumors (Fig. S3J–K). Collectively, our results support the hypothesis that in the context of colorectal tumors, Hhep colonization induces Hhep-specific Tfh cells in the LP.
Figure 3. Hhep colonization drives Hhep-specific T follicular helper cell expansion.

CRC was induced in mice as in 1A.
(A) Tumor number quantification from mice given AOM-DSS +/− Hhep where half the mice were treated with anti-CD4, anti-CD8, anti-NK1.1, or anti-NK1.1+anti-CD8 antibodies to deplete cells every 5 days starting on day 58.
(B-E) Cells were isolated from the colons of tumor-bearing mice +/− Hhep 12 weeks post AOM and enriched for Hhep-specific tetramer+ or CD45.1+ Hhep-specific TCR transgenic cells prior to staining.
(B) Shown are representative graphs of HH-E2 tetramer and CD44 to identify tetramer positive CD4 T cells from the LP.
(C) Representative flow plots of tetramer positive and negative T cells (gated on total CD4+ or Tetramer+ CD4+ T cells as indicated) stained to identify Tfh cells.
(D) Quantification of (C).
(E) Time course of the percent of Tfh cells calculated from transferred HH5-1tg CD4+ (Hhep-specific) from different tissues, as indicated.
Data represent 2–3 independent experiments with 3–4 mice per group per experiment. One-way ANOVA (A), and student’s T test (D) were used. *p<0.05, **p<0.005.
Hhep colonization expands the colonic lymphatic network.
Hhep-specific CD4+ T cells predominantly accumulate in the colonic LP and thus are likely to exert effects on that tissue (Chai et al., 2017; Xu et al., 2018). To comprehensively analyze the effect that Hhep colonization had on the LP, we again utilized scRNAseq (Fig. S4A). DRAGON clustering analysis of the LP revealed 16 clusters comprising all of the major hematopoietic and stromal cells of the colon (Fig. S4A). Cluster analysis revealed an enrichment for cells expressing genes associated with stromal and endothelial cells (clusters 1, 5, 9, and 13), and specifically an increase in a Ccl21a+Lyve1+ lymphatics cluster (cluster 9, sub-cluster 2) in Hhep-colonized mice (Fig. 4A–B). In accord with an expansion of the lymphatic network in the colon of Hhep colonized mice, we observed an increased frequency of genes required for lymphangiogenesis (Pdpn, Vegfc) in the LP and fluorescent microscopy revealed an increase in Lyve-1 stained vessel-like structures (Fig. 4C–D & Fig. S4B–D) (Chen et al., 2016; Farnsworth et al., 2019; Hunter et al., 2016; Martens et al., 2020). Lymphatic vessels express integrins and secrete cytokines that can recruit and support immune cells (T & B cells, DCs) potentially increasing anti-tumor immunity in the colon (Lund, 2016; Lund et al., 2016).
Figure 4. Hhep colonization expands the colonic lymphatic network.

(A) Cells from the LP were prepared and sequenced as in (Fig. 2). DRAGON clustering revealed 16 unique clusters in the LP and an increase in the lymphatics cluster (cluster 9) in the LP of Hhep-colonized mice.
(B) Subclustering of Cluster 9 (lymphatics) from scRNASeq LP samples. 5 clusters were identified, and Cluster 2 represents the Ccl21a+Lyve1+ cells.
(C) Lyve1+ IF staining.CD4 (green), CD19 (red), Lyve1 (yellow), DAPI (blue).
(D) Quantification of (C).
Data represent 1 (A-B) or 2 (C-D) independent experiments with 3–5 mice per group. Student’s T test (D) was used. *p<0.05.
Mature tertiary lymphoid structures form in response to Hhep colonization.
The expansion of lymphatic and stromal cells in the LP of Hhep-colonized may also be indicative of the development of tertiary lymphoid structures (TLS). TLS are ectopic lymphoid organs that form in response to chronic inflammation. Their presence inside or near tumors is associated with a positive prognosis for many tumor types including CRC (Becht et al., 2016; Di Caro et al., 2014; Coppola et al., 2011; Dieu-Nosjean et al., 2016; Helmink et al., 2020; Petitprez et al., 2020; Ruddle, 2016). In our model, we characterized TLS by visualizing organized structures within the LP that were DAPI dense, containing clear B and T cell zones. Hhep colonized mice showed an increase in the number of TLS surrounding and within the tumor itself (Fig. 5A–D & Fig. S5A). Further, there was a qualitative shift in the organization of TLS found in Hhep colonized mice, characterized by well-defined B and T cell zones and an increased presence of CD11c+ cells in the T cell zone, consistent with an increase in dendritic cells (Fig. 5A). TLS were observed as early as week 9 and were maintained at least through week 12 in the LP of Hhep colonized mice but were rarely seen in non-colonized mice (which predominantly contained relatively disorganized colonic patches), indicating that development and expansion of these structures required Hhep and was not a generalized response to DSS-induced inflammation or tumor growth (Fig. 5C–D and S5B). In addition, the expression of genes associated with TLS formation were increased in the LP of Hhep colonized mice, such as Lta, Tnfsf14 (LIGHT), Icam1, and Vcam1 (Fig. S5C–F). Thus, Hhep colonization was sufficient to drive an increase in lymphatics and TLS in the colonic LP that were able to be better support T and B cell recruitment and the anti-tumor response.
Figure 5. Mature tertiary lymphoid structures form in response to Hhep colonization.

CRC was induced as in 1A. Colons were harvested 12 weeks post AOM and fixed with PFA prior to staining for IF.
(A) IF staining of TLS. CD4 (green), CD19 (red), CD11c (purple), and DAPI (blue).
(B) Stitched images of colons from (A) showing numbers and locations of TLS (white arrows) or colonic patches (orange arrows) found in AOM-DSS+/− Hhep. CD4 (green), CD19 (red), CD11c (purple), and DAPI (blue).
(C) Quantification of number of TLS per colon of tumor-bearing mice +/− Hhep. Quantification performed at 9- and 12-weeks post AOM.
(D) Quantification of intratumoral, peritumoral, and distant TLS in tumor-bearing mice +/− Hhep 12 weeks post AOM. Numbers beneath the pie charts indicate numbers of total tumors analyzed and number of total mice used.
Data represent 3–5 independent experiments with 3–5 mice per group. Student’s T test (B) was used. **p<0.005.
TLS contain Hhep and Hhep-specific T cells.
Hhep is known to adhere to the colonic epithelium where it can be sampled by phagocytic immune cells (Danne et al., 2017; Fox et al., 1994). We thus hypothesized that this immunogenicity may be important for the induction of TLS in the context of CRC. To determine the biogeography of Hhep colonization, we utilized Fluorescent In-Situ Hybridization (FISH) for 16S rRNA genes. At both 9 and 12 weeks, we observed only sparse clusters of Hhep within the intestinal lumen (Fig. S6A). Imaging of colon tissue of Hhep-colonized mice consistently revealed bacteria, and specifically Hhep bacterial cells within nuclei dense regions of the lamina propria that are consistent with the structure of TLS (Fig. 6A–C and S6B). The presence of Hhep within TLS supported the idea that they may act as sites of activation for Hhep-specific T cells. To track the location of Hhep-specific T cells within the colon, we transferred naïve CD45.1+ Hhep-specific TCR tg CD4+ T cells into tumor-bearing Hhep-colonized mice 7 weeks post AOM administration. Hhep-specific CD4+ T cells were predominantly found within the TLS inside or around the B cell follicle (Fig. 6D and S6C). Neither Hhep (FISH analysis) nor Hhep-specific CD4+ T cells were consistently found within the tumor (Data not shown), supporting the notion that the CD4+ T cell-driven effects of Hhep colonization were dependent upon the CD4+ Tfh cell responses in the colonic LP, and more specifically tumor-associated TLS.
Figure 6. TLS contain Hhep and Hhep-specific T cells.
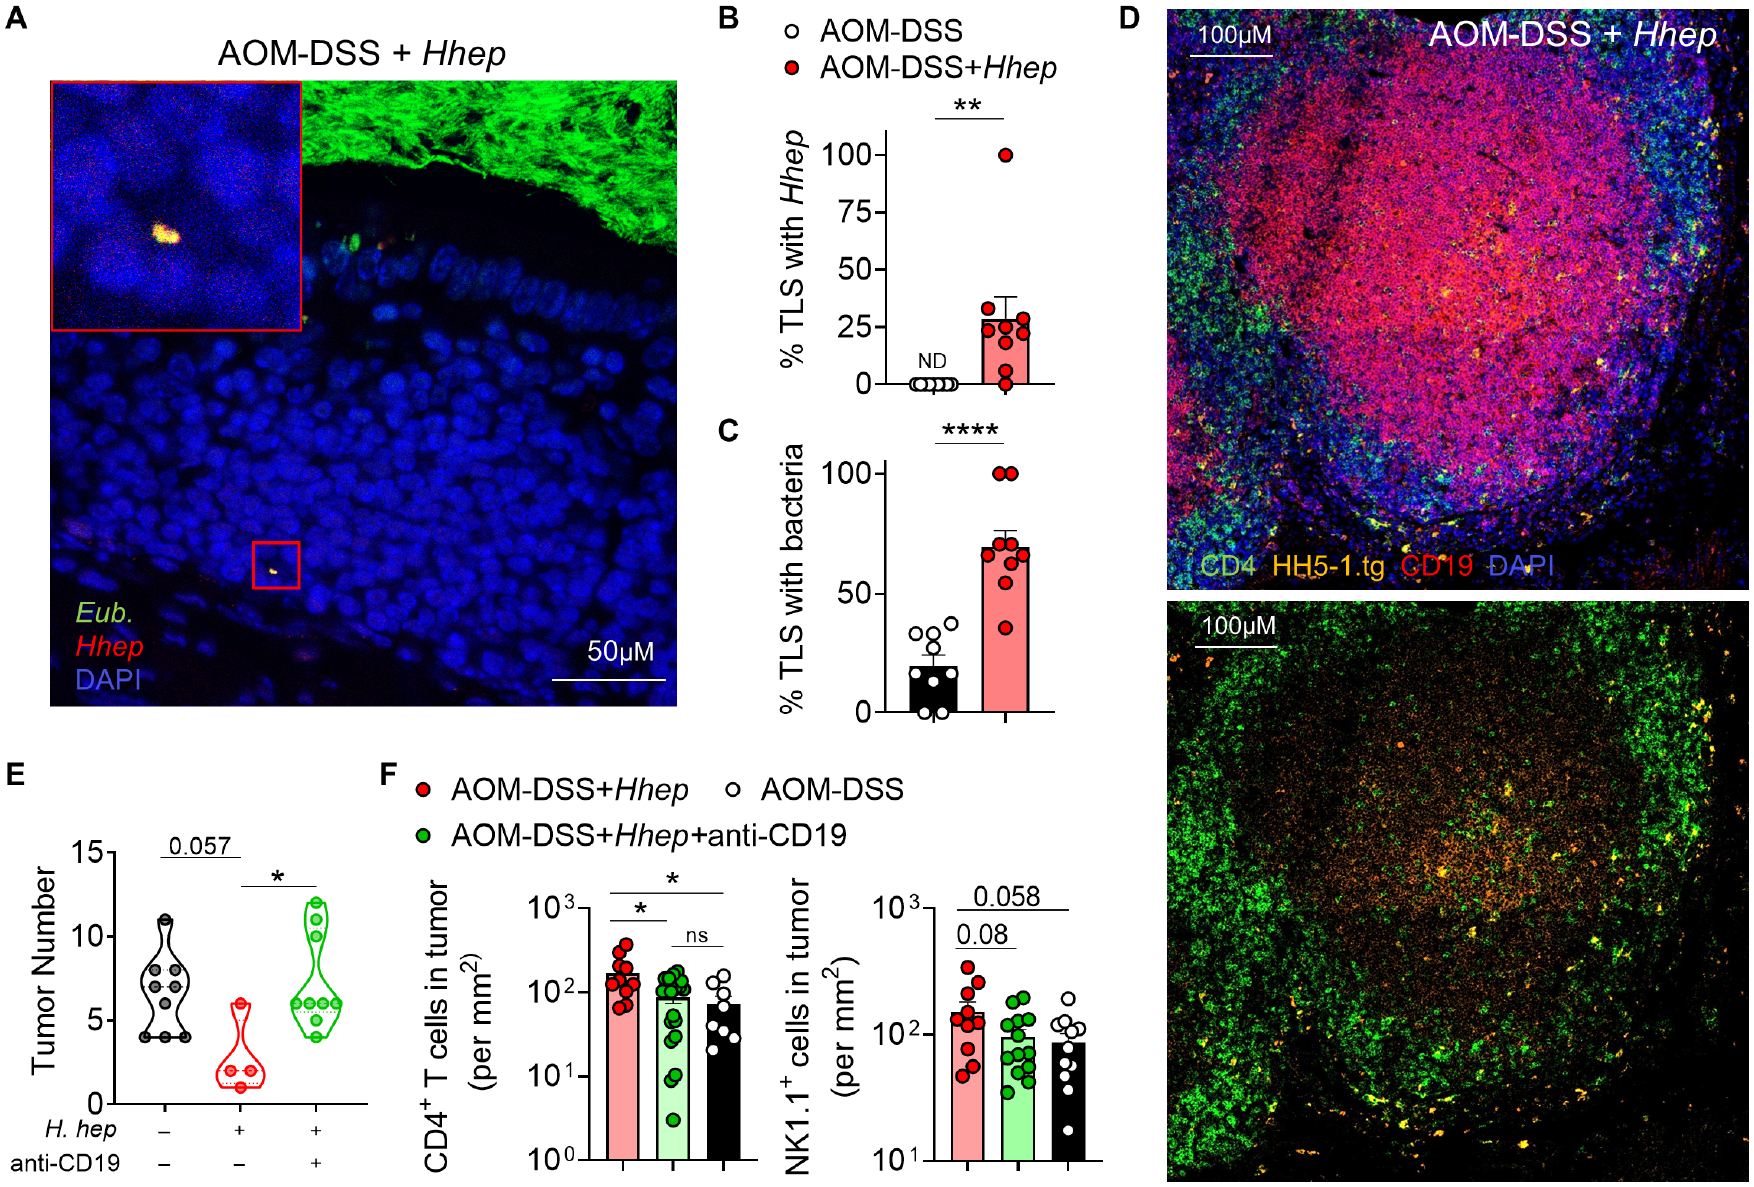
CRC was induced as in 1A. Colons were harvested 12 weeks post AOM and fixed with Methacarn. (A-C) or PFA (D) prior to sectioning for IF.
(A) FISH staining of TLS using 16S Eubacteria (green) and Hhep (red) specific probes. Yellow indicates co-staining.
(B-C) Quantification of percent TLS containing Hhep or bacteria.
(D) IF staining of TLS. Shown: CD4 (green), HH5-1tg CD45.1 T cells (orange), CD19 (red), and DAPI (blue).
(E) CRC was induced as in 1A but mice were anti-CD19 antibody every 5 days starting on day 58. Shown is the tumor number at 12 weeks.
(F) Number of CD4+ T cells and NK cells in the tumors of AOM-DSS+/−Hhep +/−anti-CD19 depleting antibody visualized by immunofluorescence.
Data represent 3–5 (A-D) or 2 (E-F) independent experiments with 3–5 mice per group. Student’s T test (B-C) and one way ANOVA (F) were used. *p<0.05, **p<0.005, ****p<0.00005.
Hhep-specific Tfh cells are necessary and sufficient to drive TLS formation and control tumor burden.
Tfh cells are often found in and around B cell follicles, require B cells for development and survival, and provide B cell help through ICOS and CD40L expression and IL-21 secretion (Crotty, 2019). One hypothesis consistent with our results is that the interaction of Hhep-specific CD4+ TFH cells with B cells supports the growth of TLS in the colon and thus anti-tumor immunity. Accordingly, Hhep-mediated control over CRC required B cells, and the loss of B cells through CD19 depletion reduced the number of tumor infiltrating CD4+ T cells and NK cells. (Fig. 6E–F) (Crotty, 2019; Helmink et al., 2020; Vinuesa et al., 2016; Yu et al., 2009). To test the importance of Hhep-specific Tfh cells in TLS induction and control over CRC directly, we utilized Bcl6fl/flCd4Cre mice that largely lack Tfh cells (Fig. 7A) (Hollister et al., 2013; Johnston et al., 2009). AOM-DSS induction of CRC in Bcl6fl/flCd4Cre mice with Hhep confirmed that Tfh cells were required for Hhep-driven formation of colonic TLS, immune infiltration of the tumor, and control of tumor growth (Fig. 7B–D). Transfer of Hhep-specific CD4+ TCR transgenic T cells into Bcl6fl/flCd4Cre mice was sufficient to restore formation of organized TLS, increase immune infiltration into the tumor (particularly NK cells), and reduce tumor burden (Fig. 7B–D and S7A–D) (Cao et al., 2019). In aggregate, our data indicated that bacteria-specific Tfh cells were sufficient to drive TLS formation, increased immune infiltration, and led to tumor reduction or clearance in an animal model of CRC. Both Tfh cells and intra- or peritumoral TLS have been associated with a positive response to therapy in head and neck cancer patients (Cillo et al., 2020) and CRC (Mlecnik et al., 2016; Schürch et al., 2020). Indeed, analysis of CRC patients within the TCGA database showed that an enriched Tfh cell signature generally presented within patients at a lower tumor stage and also associated with longer progression-free survival, while differences in CD8+ T cells showed no relationship with disease prognosis (Fig. 7E–F & Fig. S7E). Thus, both in mice and in human patients, the presence of Tfh cells and TLS were associated with better control over CRC and critically, within our animal model, microbiome-specific Tfh cells were necessary and sufficient to activate anti-CRC immunity.
Figure 7. Hhep-specific Tfh cells are necessary and sufficient to drive TLS formation and control tumor burden.

(A) Bcl6L/LCd4Cre mice were treated with AOM-DSS + Hhep. Some mice received an adoptive transfer of CD45.1+HH5-1 TCR transgenic T cells and tumor number and TLS numbers were assessed at week 12.
(B) Colon sections of mice from (A) were stained for CD4 (green), CD19 (red), CD11c (purple), and DAPI (blue) to assess TLS numbers.
(C-D) Quantification of TLS (C) or tumor burden (D) of Bcl6L/LCd4Cre mice with or without HH5-1tg T cells adoptively transferred.
(E) Tumor stage analysis of TCGA CRC patient data comparing those with a high or low TFH signature. n=96 for TFH low and n=94 for TFH hi.
(F) Progression-Free Survival analysis of patients from (E).
Data are a composite of 2 independent experiments with 3–5 mice per group (B-D). Error bars represent the mean ± SEM. Student’s t tests (C-D) was used. *p<0.05, ***p<0.0005.
Discussion
The microbiome is an important modulator of the host immune response, and as such, particular members of the microbiota have been associated with positive prognosis in immunotherapy against melanoma. However, developing therapies based on promoting an anti-tumor microbiota has been challenging due to the fact that each study has identified distinct bacterial taxa (Gopalakrishnan et al., 2018; Matson et al., 2018; Routy et al., 2018; Sivan et al., 2015; Vétizou et al., 2015). Here, we present evidence that if the goal is to activate the immune response and foster anti-tumor immunity, that efforts should be made to identify the most immunogenic intestinal bacteria, typically the bacteria that inhabit the mucus layer close to the intestinal epithelium (Ansaldo et al., 2019; Chiaranunt et al., 2018; Ivanov et al., 2009; Xu et al., 2018).
Hhep is an epithelial adherent bacterium that resides within the colon, and is known to elicit a strong immune response that can vary widely based on the environment (Chai et al., 2017; Kullberg et al., 2006; Xu et al., 2018). For example, at homeostasis, Hhep drives a response dominated by Treg cells with a large sub-population of Tfh cells (Xu et al., 2018). Here during AOM-DSS induced CRC, we see a reversal of the balance observed in naïve mice, with Tfh cells being dominant. What we have not observed is a differentiation of Hhep-specific CD4+ T cells to inflammatory IFNγ-producing Th1 cells or IL17-producing Th17 cells, which was induced by Hhep in other models of colitis (Kullberg et al., 2003). One hypothesis to explain the difference is that our model has an intact Treg cell population that balances the inflammatory response to Hhep. Beyond inhibiting inflammatory T cell responses, Treg cells also are critical for regulating macrophages and other innate cells, which may explain why Hhep colonization of genetically lymphopenic mice leads to spontaneous colitis and tumorigenesis (Chai et al., 2017; Erdman et al., 2009; Ge et al., 2017; Kullberg et al., 1998, 2001, 2003; Maggio-Price et al., 2006; Nagamine et al., 2008a, 2008b). Our hypothesis is that Hhep-specific Treg cells are important in shaping the immune response after colonization; however, there are other Hhep-mediated mechanisms that could be important in the balance between inflammatory and regulatory immune responses against Hhep. For example, Hhep produces a number of immunogenic molecules which activate Toll-like receptors 2 and 4 to drive both inflammatory (IL-23) and regulatory (IL-10) cytokines independent of T cell activation (Danne et al., 2017; Kullberg et al., 2001, 2006; Nagamine et al., 2008a). How these molecules shape the CRC environment outside of the effect of Hhep-specific T cells in our experiments remains to be seen.
In our model, both control over tumors and immune infiltration of the tumor were associated with increased development of local lymphatics and TLS as well as the activation and differentiation of Hhep-specific Tfh cells. Tfh cells and the presence of mature TLS have been associated with better prognosis of a variety of tumor types, but perhaps most notably CRC; however, the mechanism by which tumor-associated TLS activate anti-tumor immunity is not known (Becht et al., 2016; Di Caro et al., 2014; Cillo et al., 2020; Coppola et al., 2011; Dieu-Nosjean et al., 2016; Hollern et al., 2019; Joshi et al., 2015; Petitprez et al., 2020; Ruddle, 2016). Here, we discovered that the invasion of the tumor by immune cells was dependent upon the presence of TLS. We hypothesize that increased Hhep-mediated induction of TLS, in concert with increased lymphatic density in the colon are leading to more efficient trafficking of tumor-derived antigen and antigen-presenting cells, and thus magnifying the local recruitment and activation of tumor-specific T cells and the anti-tumor immune response. Amongst tumor invading cells, we observed a particular enrichment for NK cells and CD4+ T cells and we hypothesize that TLS-dependent activation of CD4+ T cells leads to more effective ‘help’ for NK cells in the tumor. Indeed, CD4+ T cells provide help to local NK cells in chronic viral infections (Doorduijn et al., 2017; Jost et al., 2014). B cells too may be able to activate tumor killing via the secretion of anti-tumor antigen antibodies (DeFalco et al., 2018). Thus, while it is clear that CD4+ T cells, B cells, and TLS are required for control over CRC, there are a multitude of potential downstream anti-tumor mechanisms that these cells and structures may support after Hhep colonization.
It is not currently known why some patients with CRC develop organized TLS while others do not. Here, we present evidence that for CRC the development of mature TLS is supported by the interaction of microbiota-specific Tfh cells with colonic B cells, which fits well with the critical role of B cells in the generation of tertiary lymphoid tissue (Nolte et al., 2004; Randall and Mebius, 2014; Ruddle, 2014, 2016). We postulate that one reason for the heterogeneity in development of intra- and peri-tumoral TLS in different patients is differences in the intestinal microbiome, specifically in epithelial adherent bacteria known to induce Tfh cells. We hypothesize that adding back immunogenic intestinal bacteria to the microbiome could be an important factor for the efficacy of current CRC patient treatments, including tumor immunotherapy (Asaoka et al., 2015; Diaz and Le, 2015; Topalian et al., 2012). We propose that, in the future, it may be beneficial to combine rational targeted modification of the mucosal immune response by specific intestinal bacteria with current immunotherapeutic treatments that have so far been unsuccessful in the majority of CRC patients.
LIMITATIONS OF THE STUDY
We have investigated a mouse model of colitis-associated cancer. It will be important to confirm key aspects of the model, specifically microbiota-induced Tfh cells and TLS associated with colorectal tumors, in patients populations. We are performing those studies currently. We do not think that the induction of TLS and Tfh cells will be solely limited to Hhep as infection in the colon and other bacteria can also induce these cells and structures (Ansaldo et al., 2019; Koscsó et al., 2020). However, the ability to induce TLS and tumor control may be a property enriched in the Helicobacter genus. Gnotobiotic mice colonized with a Helicobacter-dominated microbiota from wild mice are partially protected from CRC induced by AOM-DSS (Rosshart et al., 2017). Conversely, some laboratory microbiomes containing other Helicobacter species decrease the effectiveness of CD8+ T cell control over colorectal tumors (Yu et al., 2020), so it will be important to tease out the specific mechanisms employed by different strains of Helicobacter to induce mucosal immune responses. In addition, the mechanism behind how TLS activate anti-tumor immune responses remains unclear and should be a major area of focus for the tumor immunotherapy community.
STAR Methods
EXPERIMENTAL MODELS AND SUBJECT DETAILS
Animal Models
6-week old C57Bl/6 mice from Jackson Labs were used for the majority of the studies. Bcl6fl/flCd4Cre mice were acquired from the Poholek Lab, and Hhep-specific HH5-1 and HH7-2 TCR transgenic mice were purchased from Jackson Labs. Both males and females were used and randomly assigned to experimental groups. All mice were maintained at and all experiments were performed in an American Association for the Accreditation of Laboratory Animal Care-accredited animal facility at the University of Pittsburgh and housed in accordance with the procedures outlined in the Guide for the Care and Use of Laboratory Animals under an animal study proposal approved by the Institutional Animal Care and Use Committee of the University of Pittsburgh. Mice were housed in specific pathogen-free (SPF) conditions.
Microbe Strains
Helicobacter hepaticus (Hhep) 51449 was purchased from ATCC and grown in an anaerobic chamber at 37°C in either supplemented TSB broth or on chocolate agar plates.
METHOD DETAIL
Disease models
To establish carcinogen-induced colorectal cancer in mice, we injected 10mg/kg Azoxymethane (AOM) i.p. on Day 0, prior to 3 cycles of a ‘1 week on, 2 weeks off’ schedule of administering 3% DSS in the drinking water beginning on Day 7. Mouse weights were monitored weekly and euthanized if more than 25% weight was lost. For Hhep colonization, mice were gavaged with ~1×10⁸ Hhep (200μL) two times, 5 days apart at week 7. Mice were sacrificed at either week 9 or 12 post AOM, and tumors were enumerated and measured. For survival experiments, mice were euthanized due to rectal prolapse, weight loss, or moribund. Prolapses were treated for 24hrs via administration of petroleum jelly, and mice were euthanized if no improvement was made.
In vivo treatments
For CD4 or CD8 depleting experiments, mice were treated with 200μg anti-CD4 or anti-CD8 every 3 days beginning week 9 through the end of the experiment. For B cell depletion, mice were treated with 300μg anti-CD19 every 5 days beginning week 9 through the end of the experiment. Depletions were started at week 9 to allow for TLS formation after Hhep colonization which occurs between Day 49 and Day 60. For NK cell depletion, mice were treated with 200μg anti-NK1.1 every 3 days beginning week 9 through the end of the experiment.
For TCR transgenic CD4+ T cell transfers, spleens were harvested from naïve CD45.1+ Hhep TCR tg mice (HH5-1 or HH7-2) and stained for naïve T cell markers. Naïve CD4 T cells (CD90+CD4+CD25−CD44LO) were flow cytometrically sorted at 1×10⁵ cells were transferred retro-orbitally per mouse at week 7, 1 day prior to Hhep gavage.
Immunofluorescence
Tissue and slide preparation
Tissues were fixed in 1% PFA for 1 hour at 4°C, then placed in 30% sucrose at 4°C overnight or until fully dehydrated. Tissue segments were frozen in OCT over dry ice and stored at −80°C. Tissues were sectioned using a cryostat and frozen for storage. To stain slides, tissues were outlined with a pap-pen, washed 5 times with PBS, washed 5 times with 0.5% BSA in PBS, blocked with 10% rat serum (in 0.5% BSA/PBS) for 45 minutes at RT, stained with primary antibodies in 0.5% BSA/PBS overnight at 4°C. Tissues were washed 5 times with 0.5% BSA/PBS prior to staining with secondary antibodies for 1 hour at 4°C and staining with DAPI/Hoechst for 5 minutes covered at RT. Prolong Antifade Gold was used to seal slides, and images were taken as soon as possible using a Nikon A1R Confocal fluorescent microscope in the University of Pittsburgh Center for Biological Imaging. Stained slides were stored covered at 4°C.
Fluorescent in situ hybridization
For FISH staining, tissues were immediately fixed in a methacarn solution at 4°C overnight. Tissue cassettes were washed with PBS and put in 70% ethanol prior to paraffin embedding and sectioning. Sections were deparaffinized in xylene prior to 2 successive ethanol washes (95% and 90%) and rehydration with ddH2O. 16S Eubacteria and Hhep specific probes were added at 100nM in hybridization buffer (0.9M NaCl, 20mM Tris-HCl pH 7.2, 0.1% SDS) and left in a humidified chamber within a 56°C incubator overnight. A separate slide was stained with a ‘scrambled’ probe for control. Slides were washed with prewarmed wash buffer (0.9M NaCl, 20mM Tris-HCl pH 7.2) prior to DAPI/Hoechst staining. Slides were sealed with Prolong Antifade Gold and imaged using a Nikon A1R Confocal fluorescent microscope in the University of Pittsburgh Center for Biological Imaging.
For H&E images, tissues were butterflied and cleaned prior to fixing in Formalin overnight at room temperature in cassettes. Tissues were washed three times with PBS 24–72 hours, washed 3x in PBS, and stored in 70% ethanol prior to paraffin embedding. Following paraffin embedding, slides were stained for hematoxylin and eosin stains for morphological analysis, and imaged at a 10X magnification.
Tumor core and TLS distance to tumor calculations
For calculation of tumor core, images were loaded into Elements software and masks were overlaid over the entire tumor. The core mask was determined using the Erode function and tumors were normalized such that the core was the ~15% of the total area for each tumor regardless of size or group. The tumor periphery mask was calculated by subtracting the core area from the total tumor area.
TLS distance to tumor calculations and designation as (intra/peri/distant) were calculated using Elements software. Specifically, the distance along the epithelium was calculated from the nearest edge of the tumor to the nearest edge of the closest TLS. TLS were designated as intratumoral if the distance was 0μM and peritumoral if the distance was <800μM.
Flow cytometry
Mesenteric lymph nodes (mLN), spleens, and colon tissues were harvested in 3% Complete RPMI. Lymph nodes and spleens were forced through 70μM strainers to obtain a single cell suspension. To isolate lymphocytes from lamina propria (LP) and epithelial layers (IEL), we performed gut preparations as previously described (Oldenhove et al., 2009). Single cell suspensions were stained with live/dead and required surface markers for 10 minutes on ice, fixed for 45 minutes on ice with either the ThermoFisher ‘Foxp3’ (intracellular transcription factor analysis) or BD fixation (intracellular cytokine analysis) kits, and stained with fluorescently-labelled antibodies for intracellular markers for 45 minutes on ice. For cytokines, cells were stimulated with PMA/Ionomycin and Brefeldin A for 2.5hrs at 37°C (T cells) or stimulated with BFA alone for 1.5 hrs at 37°C (innate cells) prior to staining. For TCR transgenic transfer or tetramer experiments, mice were sacrificed at either week 9 or week 12, and single cell suspensions were made as described above. For tetramer experiments, cell suspensions were stained with tetramer for 1 hour at RT as previously described (Moon et al., 2007). TCR transgenic or tetramer cells were enriched through a positive selection magnetic pulldown (Stem Cell Technologies) for either the tetramer or CD45.1, and both bound and unbound fractions were run by flow cytometry. For Tfh cell staining, cells were stained as described (Pepper et al., 2011) with the following changes. Cells were stained with PD-1 and CXCR5 for 45 minutes at room temperature prior to fix/perm. After permeabilization, cells were stained with Bcl6 where applicable. All flow cytometry was acquired on an LSRFortessa FACS analyzer and cell sorting was carried out on a FACS Aria (BD Biosciences).
scRNAseq
Sample preparation
Cells were isolated from the lamina propria and the tumor containing epithelial layer of AOM-DSS+/−Hhep tumor-bearing mice 12 weeks post AOM using the same isolation protocol used for flow cytometry assays. Cells were then labeled with TotalSeq-C0301 anti-mouse Hashtag antibodies specific for MHCi and CD45 (Clones M1/42 and 30-F11) to label all cells prior to pooling.
Library preparation and sequencing
Libraries were prepared using 10X 5’ v1 single-cell RNAseq kit. Briefly, samples from multiple mice derived from either Epithelial Layer (EL) or Lamina Propria (LP) were multiplexed by staining with cell hashing antibodies (Biolegend TotalSeq-C). Sample were then loaded into 2 lanes on a single-cell Chip A, encapsulated into droplets containing individual cells and beads, and then reverse transcribed. Libraries were prepared for sequencing as per the manufacturer’s recommendations. Fragment sizes and concentrations of the final prepared gene expression and cell hashing libraries were quantified by BioAnalyzer, and samples were pooled for sequencing on a NovaSeq6000 S2 flow cell at the UPMC Genome Core with the following read parameters: read 1: 28 cycles; i7 index: 8 cycles; i5 index: 0 cycles; read 2: 91 cycles.
Alignment and generation of gene barcode matrices
Following sequencing, raw data was demultiplexed into FASTQ files using bcl2fastq from Illumina. Individual FASTQ files from gene expression libraries were then aligned to the mm10 reference genome using CellRanger v3.1.0 (10X Genomics), resulting in generation of gene barcode matrices. For cell hashing libraries, we utilized CITE-seq-Count (https://hoohm.github.io/CITE-seq-Count/#how-to-cite-cite-seq-count) to generate feature-barcode matrices containing read counts for cell hash antibodies by cell barcode. Individual samples were then identified by unique expression of cell hash antibodies associated with individual samples. Cell containing counts for more than one set of CITEseq antibodies were excluded as doublets.
Dimensionality reduction, clustering and cell type identification
After generating filtered gene barcode matrices from individual samples, we utilized the R package Seurat (v3.1.4) for downstream processing in R v3.6.1. Gene barcode matrices were first read into Seurat, and a data integration workflow was utilized to integrate data between the two sample sources (i.e. EL and LP) as described previously (Stuart et al., 2019). Briefly, for each individual sample, library size was normalized, highly variable features were selected, and gene expression was scaled across all cells. Next, dimensionality was reduced using principal component analysis (PCA) on the scaled data and significant principal components were selected heuristically based on the frequency of variance explained. To integrate data, integration anchors were next identified across samples, and used to normalize expression across datasets. Using the integrated data, we then scaled expression values across all cells in the dataset and performed PCA followed by UMAP to visualize cells in a 2-dimensional space. DeteRministic Annealing Gaussian mixture mOdels for clusteriNg Single-Cell data (DRAGON) was then used on the significant principal components to identify clusters. Differentially expressed genes were then identified using a Wilcoxon rank-sum test across clusters as implemented in Seurat, and cell types were characterized based on expression of canonical lineage markers. Bubble plots and heat maps were created with Seurat. Downstream analysis to identify more subtle differences within individual lineages was performed by isolating populations of interest, identifying highly variable genes within the lineage of interest, and repeating the dimensionality reduction and visualization workflow for the entire dataset. Raw and processed RNAseq data are available upon request and will be publicly released following acceptance.
Forest plot for cell frequencies
A forest plot was used to visualize the mean fold change and associated 80% confidence intervals for cell frequencies across clusters in the intraepithelial samples between AOM-DSS and AOM-DSS+Hhep. To achieve this, the proportion of cells within each cluster from each of the 3 replicates of AOM-DSS and AOM-DSS+Hhep conditions was first calculated. Next, the mean and standard deviation for cell frequency in a given cluster for AOM-DSS and AOM-DSS+Hhep were determined for each condition. To determine 80% confidence intervals for the ratio of the mean cell proportion in each cluster between AOM-DSS and AOM-DSS+Hhep, 10,000 bootstrapped replicates were performed where 3 samples from each condition were simulated used a truncated normal distribution (using the R package truncnorm) with μ restricted to fall between 0 and 1, the μ estimate equal to the mean cell proportion from a given condition and a given cluster along with σ set to the given standard deviation from the same condition and cluster. The 80% confidence interval was then derived from the bootstrapped replicate for each cluster.
QUANTIFICATION AND STATISTICAL ANALYSIS
TCGA data analysis
To assess significance of select immune cell populations in overall and progression-free survival of CRC patients, we utilized RSEM normalized log2 bulk mRNASeq expression data from the TCGA accessed through the Firehose pipeline hosted by the Broad Institute as previously described(Cillo et al., 2020; Deng et al., 2017). Firebrowse was used to identify patient CRC sample cohorts and to download bulk mRNASeq data. Clinical and outcomes data were accessed through the Pan-Cancer clinical data (Liu et al., 2018). To determine whether there was a relationship between expression of select immune cell population related gene sets and clinical outcomes in patients, we utilized CIBERSORT(Chen et al., 2018) to deconvolve cell frequencies using LM22. Patient outcomes and survival were integrated with CIBERSORT data to determine association between various immune subsets and progression-free or overall survival as well as tumor staging.
16S data analysis
To assess changes in the microbiota over time, stool was taken from C57BL/6 experimental mice 4 timepoints throughout tumor progression, beginning at Day 0 post AOM and ending at Day 82 when mice were sacrificed. Stool was frozen at −80° until the last samples were acquired. Bacterial DNA was isolated from stool using the Qiagen DNA Stool Mini Kit and quantified using a Nanodrop. PCR amplification of the small subunit ribosomal RNA gene (16S rRNA) was performed as follows: DNA were denatured at 94°C for 3 minutes, amplified at 94°C for 45s, 50°C for 60s and 72°C for 90s to amplify, and held at 72°C for 10 min for a final extension step. Samples were sequenced by BGI Genomics. Microbiome informatics were performed using QIIME2 2020.2(Bolyen et al., 2019). Raw sequences were quality-filtered and denoised with DADA2(Callahan et al., 2016). Amplicon variant sequences (ASVs) were aligned with mafft and used to construct a phylogeny with fasttree2(Katoh et al., 2002; Price et al., 2010). Alpha diversity metrics (observed OTUs), beta diversity metrics (Bray Curtis dissimilarity) and Principle Coordinate Analysis (PCoA) were estimated after samples were rarefied to 63,000 (subsampled without replacement) sequences per samples. Taxonomy was assigned to ASVs using naive Bayes taxonomy classifier against the Greengenes 18_8 99% OTUs reference sequences(McDonald et al., 2012). ANCOM was used to compare family level relative abundances between groups. All plots were made with publicly available R packages.
Helicobacter hepaticus quantification
DNA isolated as mentioned above for 16S rRNA sequencing was stored and used for Hhep quantification by qPCR. qPCR was performed on DNA from stool samples collected over time from D0 to D82 post AOM injection for both AOM-DSS and AOM-DSS+Hhep groups. The relative amount of Hhep found within the stool was calculated by normalizing to Eub rRNA (total bacteria) samples using the primers listed in the table below.
Statistics
Data are presented as mean ± SEM including n for each experiment which represents the number of mice used per group unless otherwise stated. Statistical significance was determined using unpaired Student’s t test when comparing two groups, and one-way ANOVA with multiple comparisons, when comparing multiple groups. Some experiments comparing non-parametric groupings (numbers of cells) were compared with a Mann-Whitney test. All statistical analysis was calculated using Prism software (GraphPad). For details on significance, please see figure legends.
RESOURCE AVAILABILITY
Lead Contact
Further information and requestions for resources and reagents should be directed to and will be fulfilled by the lead contact, Timothy Hand (timothy.hand@chp.edu).
Materials Availability
This study did not generate new unique reagents.
Data and code availability
Single-cell RNAseq data have been deposited at GEO and are publicly available as of the date of publication (GSE178485). 16S data have been uploaded to NCBI SRA and are publicly available as of the date of publication (PRJNA655517). Accession numbers for both are listed in the key resources table. Any additional information required to reanalyze the data reported in this paper is available from the lead contact upon request.
Supplementary Material
Highlights.
Helicobacter hepaticus (Hhep) colonization reduces colorectal cancer burden in mice.
Hhep induces CD4+ Tfh cell and B cell dependent anti-colorectal cancer immunity.
Hhep colonization expands peritumoral tertiary lymphoid structures (TLS).
Hhep-specific Tfh cells promote both TLS and anti-tumor immunity.
Acknowledgements
The authors would like to thank A. Poholek for Bcl6fl/flCd4Cre mice, J. Michel and A. Styche from the Children’s Hospital of Pittsburgh Flow Core for cell sorting, T. Tabib, R. Lafyatis and the UPMC Genome Center for preparation and sequencing of single cell RNA sequencing samples, the NIH tetramer core for MHCII tetramers containing sequences from Helicobacter hepaticus, the staff of the Division of Laboratory Animal Services for the animal husbandry, the Children’s Hospital of Pittsburgh Histology Core, the Center for Biological Imaging, the Center for Research Computing, the RK Mellon Institute, Department of Pediatrics, and the Department of Immunology at the University of Pittsburgh/UPMC as well as Nikhil Joshi, Grace Chen, Semir Beyaz, and the Hand Lab for helpful discussions. This work was supported by the UPMC Children’s Hospital of Pittsburgh/R.K. Mellon Institute for Pediatric Research (including a RAC Post-doctoral Fellowship to A.B.), the NIH (R21 CA249074 to TWH; T32 5T32CA082084-18 to A.E.O.-D. and T32AI089443 to A.H.P.B.; R01 CA203689 and P01 AI108545 to D.A.A.V.), the Damon Runyon Cancer Research Foundation (DRCRF postdoctoral fellowship to A.E.O.-D.), the Eden Hall Foundation (T.W.H.) and the Hillman Cancer Center (Hillman Postdoctoral Fellowship for Innovative Cancer Research to A.R.C).
Declaration of Interests
DAAV: cofounder and stockholder – Novasenta and Tizona; stock holder - Oncorus and Werewolf; patents licensed and royalties - Astellas, BMS; scientific advisory board member - Tizona, Werewolf and F-Star; consultant - Astellas, BMS, Almirall; research funding - BMS, Astellas and Novasenta.
Footnotes
Publisher's Disclaimer: This is a PDF file of an unedited manuscript that has been accepted for publication. As a service to our customers we are providing this early version of the manuscript. The manuscript will undergo copyediting, typesetting, and review of the resulting proof before it is published in its final form. Please note that during the production process errors may be discovered which could affect the content, and all legal disclaimers that apply to the journal pertain.
Bibliography
- Ansaldo E, Slayden LC, Ching KL, Koch MA, Wolf NK, Plichta DR, Brown EM, Graham DB, Xavier RJ, Moon JJ, et al. (2019). Akkermansia muciniphila induces intestinal adaptive immune responses during homeostasis. Science 364, 1179–1184. [DOI] [PMC free article] [PubMed] [Google Scholar]
- Arnold M, Sierra MS, Laversanne M, Soerjomataram I, Jemal A, and Bray F (2017). Global patterns and trends in colorectal cancer incidence and mortality. Gut 66, 683–691. [DOI] [PubMed] [Google Scholar]
- Arthur JC, Perez-Chanona E, Mühlbauer M, Tomkovich S, Uronis JM, Fan T-J, Campbell BJ, Abujamel T, Dogan B, Rogers AB, et al. (2012). Intestinal inflammation targets cancer-inducing activity of the microbiota. Science 338, 120–123. [DOI] [PMC free article] [PubMed] [Google Scholar]
- Asaoka Y, Ijichi H, and Koike K (2015). PD-1 Blockade in Tumors with Mismatch-Repair Deficiency. N. Engl. J. Med 373, 1979. [DOI] [PubMed] [Google Scholar]
- Atarashi K, Tanoue T, Ando M, Kamada N, Nagano Y, Narushima S, Suda W, Imaoka A, Setoyama H, Nagamori T, et al. (2015). Th17 cell induction by adhesion of microbes to intestinal epithelial cells. Cell 163, 367–380. [DOI] [PMC free article] [PubMed] [Google Scholar]
- Becht E, de Reyniès A, Giraldo NA, Pilati C, Buttard B, Lacroix L, Selves J, Sautès-Fridman C, Laurent-Puig P, and Fridman WH (2016). Immune and Stromal Classification of Colorectal Cancer Is Associated with Molecular Subtypes and Relevant for Precision Immunotherapy. Clin. Cancer Res 22, 4057–4066. [DOI] [PubMed] [Google Scholar]
- Bihl F, Pecheur J, Bréart B, Poupon G, Cazareth J, Julia V, Glaichenhaus N, and Braud VM (2010). Primed antigen-specific CD4+ T cells are required for NK cell activation in vivo upon Leishmania major infection. J. Immunol 185, 2174–2181. [DOI] [PubMed] [Google Scholar]
- Bolyen E, Rideout JR, Dillon MR, Bokulich NA, Abnet CC, Al-Ghalith GA, Alexander H, Alm EJ, Arumugam M, Asnicar F, et al. (2019). Reproducible, interactive, scalable and extensible microbiome data science using QIIME 2. Nat. Biotechnol 37, 852–857. [DOI] [PMC free article] [PubMed] [Google Scholar]
- Bray F, Ferlay J, Soerjomataram I, Siegel RL, Torre LA, and Jemal A (2018). Global cancer statistics 2018: GLOBOCAN estimates of incidence and mortality worldwide for 36 cancers in 185 countries. CA Cancer J Clin 68, 394–424. [DOI] [PubMed] [Google Scholar]
- Cabrita R, Lauss M, Sanna A, Donia M, Skaarup Larsen M, Mitra S, Johansson I, Phung B, Harbst K, Vallon-Christersson J, et al. (2020). Tertiary lymphoid structures improve immunotherapy and survival in melanoma. Nature 577, 561–565. [DOI] [PubMed] [Google Scholar]
- Callahan BJ, McMurdie PJ, Rosen MJ, Han AW, Johnson AJA, and Holmes SP (2016). DADA2: High-resolution sample inference from Illumina amplicon data. Nat. Methods 13, 581–583. [DOI] [PMC free article] [PubMed] [Google Scholar]
- Cao Y, Yang Q, Deng H, Tang J, Hu J, Liu H, Zhi M, Ye L, Zou B, Liu Y, et al. (2019). Transcriptional factor ATF3 protects against colitis by regulating follicular helper T cells in Peyer’s patches. Proc. Natl. Acad. Sci. USA 116, 6286–6291. [DOI] [PMC free article] [PubMed] [Google Scholar]
- Di Caro G, Bergomas F, Grizzi F, Doni A, Bianchi P, Malesci A, Laghi L, Allavena P, Mantovani A, and Marchesi F (2014). Occurrence of tertiary lymphoid tissue is associated with T-cell infiltration and predicts better prognosis in early-stage colorectal cancers. Clin. Cancer Res 20, 2147–2158. [DOI] [PubMed] [Google Scholar]
- Chai JN, Peng Y, Rengarajan S, Solomon BD, Ai TL, Shen Z, Perry JSA, Knoop KA, Tanoue T, Narushima S, et al. (2017). Helicobacter species are potent drivers of colonic T cell responses in homeostasis and inflammation. Sci. Immunol 2. [DOI] [PMC free article] [PubMed] [Google Scholar]
- Chen B, Khodadoust MS, Liu CL, Newman AM, and Alizadeh AA (2018). Profiling Tumor Infiltrating Immune Cells with CIBERSORT. Methods Mol. Biol 1711, 243–259. [DOI] [PMC free article] [PubMed] [Google Scholar]
- Chen W-S, Cao Z, Sugaya S, Lopez MJ, Sendra VG, Laver N, Leffler H, Nilsson UJ, Fu J, Song J, et al. (2016). Pathological lymphangiogenesis is modulated by galectin-8-dependent crosstalk between podoplanin and integrin-associated VEGFR-3. Nat. Commun 7, 11302. [DOI] [PMC free article] [PubMed] [Google Scholar]
- Chiaranunt P, Tometich JT, Ji J, and Hand TW (2018). T cell proliferation and colitis are initiated by defined intestinal microbes. J. Immunol 201, 243–250. [DOI] [PMC free article] [PubMed] [Google Scholar]
- Cillo AR, Kürten CHL, Tabib T, Qi Z, Onkar S, Wang T, Liu A, Duvvuri U, Kim S, Soose RJ, et al. (2020). Immune Landscape of Viral- and Carcinogen-Driven Head and Neck Cancer. Immunity 52, 183–199.e9. [DOI] [PMC free article] [PubMed] [Google Scholar]
- Coppola D, Nebozhyn M, Khalil F, Dai H, Yeatman T, Loboda A, and Mulé JJ (2011). Unique ectopic lymph node-like structures present in human primary colorectal carcinoma are identified by immune gene array profiling. Am. J. Pathol 179, 37–45. [DOI] [PMC free article] [PubMed] [Google Scholar]
- Crotty S (2019). T follicular helper cell biology: A decade of discovery and diseases. Immunity 50, 1132–1148. [DOI] [PMC free article] [PubMed] [Google Scholar]
- Danne C, and Powrie F (2018). Helicobacter hepaticus polysaccharide induces an anti-inflammatory response in intestinal macrophages. Microb. Cell 5, 208–211. [DOI] [PMC free article] [PubMed] [Google Scholar]
- Danne C, Ryzhakov G, Martínez-López M, Ilott NE, Franchini F, Cuskin F, Lowe EC, Bullers SJ, Arthur JSC, and Powrie F (2017). A Large Polysaccharide Produced by Helicobacter hepaticus Induces an Anti-inflammatory Gene Signature in Macrophages. Cell Host Microbe 22, 733–745.e5. [DOI] [PMC free article] [PubMed] [Google Scholar]
- DeFalco J, Harbell M, Manning-Bog A, Baia G, Scholz A, Millare B, Sumi M, Zhang D, Chu F, Dowd C, et al. (2018). Non-progressing cancer patients have persistent B cell responses expressing shared antibody paratopes that target public tumor antigens. Clin. Immunol 187, 37–45. [DOI] [PubMed] [Google Scholar]
- Dejea CM, Fathi P, Craig JM, Boleij A, Taddese R, Geis AL, Wu X, DeStefano Shields CE, Hechenbleikner EM, Huso DL, et al. (2018). Patients with familial adenomatous polyposis harbor colonic biofilms containing tumorigenic bacteria. Science 359, 592–597. [DOI] [PMC free article] [PubMed] [Google Scholar]
- Deng M, Brägelmann J, Kryukov I, Saraiva-Agostinho N, and Perner S (2017). FirebrowseR: an R client to the Broad Institute’s Firehose Pipeline. Database (Oxford) 2017. [DOI] [PMC free article] [PubMed] [Google Scholar]
- Diaz LA, and Le DT (2015). PD-1 Blockade in Tumors with Mismatch-Repair Deficiency. N. Engl. J. Med 373, 1979. [DOI] [PubMed] [Google Scholar]
- Dieu-Nosjean M-C, Giraldo NA, Kaplon H, Germain C, Fridman WH, and Sautès-Fridman C (2016). Tertiary lymphoid structures, drivers of the anti-tumor responses in human cancers. Immunol. Rev 271, 260–275. [DOI] [PubMed] [Google Scholar]
- Doorduijn EM, Sluijter M, Salvatori DC, Silvestri S, Maas S, Arens R, Ossendorp F, van der Burg SH, and van Hall T (2017). CD4+ T Cell and NK Cell Interplay Key to Regression of MHC Class Ilow Tumors upon TLR7/8 Agonist Therapy. Cancer Immunol Res 5, 642–653. [DOI] [PubMed] [Google Scholar]
- Erdman SE, Poutahidis T, Tomczak M, Rogers AB, Cormier K, Plank B, Horwitz BH, and Fox JG (2003). CD4+ CD25+ regulatory T lymphocytes inhibit microbially induced colon cancer in Rag2-deficient mice. Am. J. Pathol 162, 691–702. [DOI] [PMC free article] [PubMed] [Google Scholar]
- Erdman SE, Rao VP, Poutahidis T, Rogers AB, Taylor CL, Jackson EA, Ge Z, Lee CW, Schauer DB, Wogan GN, et al. (2009). Nitric oxide and TNF-alpha trigger colonic inflammation and carcinogenesis in Helicobacter hepaticus-infected, Rag2-deficient mice. Proc. Natl. Acad. Sci. USA 106, 1027–1032. [DOI] [PMC free article] [PubMed] [Google Scholar]
- Farnsworth RH, Karnezis T, Maciburko SJ, Mueller SN, and Stacker SA (2019). The interplay between lymphatic vessels and chemokines. Front. Immunol 10, 518. [DOI] [PMC free article] [PubMed] [Google Scholar]
- Favoriti P, Carbone G, Greco M, Pirozzi F, Pirozzi REM, and Corcione F (2016). Worldwide burden of colorectal cancer: a review. Updates Surg 68, 7–11. [DOI] [PubMed] [Google Scholar]
- Fox JG, Dewhirst FE, Tully JG, Paster BJ, Yan L, Taylor NS, Collins MJ, Gorelick PL, and Ward JM (1994). Helicobacter hepaticus sp. nov., a microaerophilic bacterium isolated from livers and intestinal mucosal scrapings from mice. J. Clin. Microbiol 32, 1238–1245. [DOI] [PMC free article] [PubMed] [Google Scholar]
- Galon J, and Lanzi A (2020). Immunoscore and its introduction in clinical practice. Q. J. Nucl. Med. Mol. Imaging 64, 152–161. [DOI] [PubMed] [Google Scholar]
- Ge Z, Feng Y, Ge L, Parry N, Muthupalani S, and Fox JG (2017). Helicobacter hepaticus cytolethal distending toxin promotes intestinal carcinogenesis in 129Rag2-deficient mice. Cell Microbiol 19. [DOI] [PMC free article] [PubMed] [Google Scholar]
- Gilbert JA, Blaser MJ, Caporaso JG, Jansson JK, Lynch SV, and Knight R (2018). Current understanding of the human microbiome. Nat. Med 24, 392–400. [DOI] [PMC free article] [PubMed] [Google Scholar]
- Gopalakrishnan V, Spencer CN, Nezi L, Reuben A, Andrews MC, Karpinets TV, Prieto PA, Vicente D, Hoffman K, Wei SC, et al. (2018). Gut microbiome modulates response to anti-PD-1 immunotherapy in melanoma patients. Science 359, 97–103. [DOI] [PMC free article] [PubMed] [Google Scholar]
- Grivennikov SI, Wang K, Mucida D, Stewart CA, Schnabl B, Jauch D, Taniguchi K, Yu G-Y, Osterreicher CH, Hung KE, et al. (2012). Adenoma-linked barrier defects and microbial products drive IL-23/IL-17-mediated tumour growth. Nature 491, 254–258. [DOI] [PMC free article] [PubMed] [Google Scholar]
- Hand TW (2016). The role of the microbiota in shaping infectious immunity. Trends Immunol 37, 647–658. [DOI] [PMC free article] [PubMed] [Google Scholar]
- Hand TW, Dos Santos LM, Bouladoux N, Molloy MJ, Pagán AJ, Pepper M, Maynard CL, Elson CO, and Belkaid Y (2012). Acute gastrointestinal infection induces long-lived microbiota-specific T cell responses. Science 337, 1553–1556. [DOI] [PMC free article] [PubMed] [Google Scholar]
- Helmink BA, Reddy SM, Gao J, Zhang S, Basar R, Thakur R, Yizhak K, Sade-Feldman M, Blando J, Han G, et al. (2020). B cells and tertiary lymphoid structures promote immunotherapy response. Nature 577, 549–555. [DOI] [PMC free article] [PubMed] [Google Scholar]
- Hollern DP, Xu N, Thennavan A, Glodowski C, Garcia-Recio S, Mott KR, He X, Garay JP, Carey-Ewend K, Marron D, et al. (2019). B cells and T follicular helper cells mediate response to checkpoint inhibitors in high mutation burden mouse models of breast cancer. Cell 179, 1191–1206.e21. [DOI] [PMC free article] [PubMed] [Google Scholar]
- Hollister K, Kusam S, Wu H, Clegg N, Mondal A, Sawant DV, and Dent AL (2013). Insights into the role of Bcl6 in follicular Th cells using a new conditional mutant mouse model. J. Immunol 191, 3705–3711. [DOI] [PMC free article] [PubMed] [Google Scholar]
- Honda K, and Littman DR (2016). The microbiota in adaptive immune homeostasis and disease. Nature 535, 75–84. [DOI] [PubMed] [Google Scholar]
- Hunter MC, Teijeira A, and Halin C (2016). T Cell Trafficking through Lymphatic Vessels. Front. Immunol 7, 613. [DOI] [PMC free article] [PubMed] [Google Scholar]
- Iida N, Dzutsev A, Stewart CA, Smith L, Bouladoux N, Weingarten RA, Molina DA, Salcedo R, Back T, Cramer S, et al. (2013). Commensal bacteria control cancer response to therapy by modulating the tumor microenvironment. Science 342, 967–970. [DOI] [PMC free article] [PubMed] [Google Scholar]
- Ivanov II, Atarashi K, Manel N, Brodie EL, Shima T, Karaoz U, Wei D, Goldfarb KC, Santee CA, Lynch SV, et al. (2009). Induction of intestinal Th17 cells by segmented filamentous bacteria. Cell 139, 485–498. [DOI] [PMC free article] [PubMed] [Google Scholar]
- Johnston RJ, Poholek AC, DiToro D, Yusuf I, Eto D, Barnett B, Dent AL, Craft J, and Crotty S (2009). Bcl6 and Blimp-1 are reciprocal and antagonistic regulators of T follicular helper cell differentiation. Science 325, 1006–1010. [DOI] [PMC free article] [PubMed] [Google Scholar]
- Joshi NS, Akama-Garren EH, Lu Y, Lee D-Y, Chang GP, Li A, DuPage M, Tammela T, Kerper NR, Farago AF, et al. (2015). Regulatory T Cells in Tumor-Associated Tertiary Lymphoid Structures Suppress Anti-tumor T Cell Responses. Immunity 43, 579–590. [DOI] [PMC free article] [PubMed] [Google Scholar]
- Jost S, Tomezsko PJ, Rands K, Toth I, Lichterfeld M, Gandhi RT, and Altfeld M (2014). CD4+ T-cell help enhances NK cell function following therapeutic HIV-1 vaccination. J. Virol 88, 8349–8354. [DOI] [PMC free article] [PubMed] [Google Scholar]
- Katoh K, Misawa K, Kuma K, and Miyata T (2002). MAFFT: a novel method for rapid multiple sequence alignment based on fast Fourier transform. Nucleic Acids Res 30, 3059–3066. [DOI] [PMC free article] [PubMed] [Google Scholar]
- Koscsó B, Kurapati S, Rodrigues RR, Nedjic J, Gowda K, Shin C, Soni C, Ashraf AZ, Purushothaman I, Palisoc M, et al. (2020). Gut-resident CX3CR1hi macrophages induce tertiary lymphoid structures and IgA response in situ. Sci. Immunol 5. [DOI] [PMC free article] [PubMed] [Google Scholar]
- Kostic AD, Chun E, Robertson L, Glickman JN, Gallini CA, Michaud M, Clancy TE, Chung DC, Lochhead P, Hold GL, et al. (2013). Fusobacterium nucleatum potentiates intestinal tumorigenesis and modulates the tumor-immune microenvironment. Cell Host Microbe 14, 207–215. [DOI] [PMC free article] [PubMed] [Google Scholar]
- Kullberg MC, Ward JM, Gorelick PL, Caspar P, Hieny S, Cheever A, Jankovic D, and Sher A (1998). Helicobacter hepaticus triggers colitis in specific-pathogen-free interleukin-10 (IL-10)-deficient mice through an IL-12- and gamma interferon-dependent mechanism. Infect. Immun 66, 5157–5166. [DOI] [PMC free article] [PubMed] [Google Scholar]
- Kullberg MC, Rothfuchs AG, Jankovic D, Caspar P, Wynn TA, Gorelick PL, Cheever AW, and Sher A (2001). Helicobacter hepaticus-induced colitis in interleukin-10-deficient mice: cytokine requirements for the induction and maintenance of intestinal inflammation. Infect. Immun 69, 4232–4241. [DOI] [PMC free article] [PubMed] [Google Scholar]
- Kullberg MC, Andersen JF, Gorelick PL, Caspar P, Suerbaum S, Fox JG, Cheever AW, Jankovic D, and Sher A (2003). Induction of colitis by a CD4+ T cell clone specific for a bacterial epitope. Proc. Natl. Acad. Sci. USA 100, 15830–15835. [DOI] [PMC free article] [PubMed] [Google Scholar]
- Kullberg MC, Jankovic D, Feng CG, Hue S, Gorelick PL, McKenzie BS, Cua DJ, Powrie F, Cheever AW, Maloy KJ, et al. (2006). IL-23 plays a key role in Helicobacter hepaticus-induced T cell-dependent colitis. J. Exp. Med 203, 2485–2494. [DOI] [PMC free article] [PubMed] [Google Scholar]
- Lathrop SK, Bloom SM, Rao SM, Nutsch K, Lio C-W, Santacruz N, Peterson DA, Stappenbeck TS, and Hsieh C-S (2011). Peripheral education of the immune system by colonic commensal microbiota. Nature 478, 250–254. [DOI] [PMC free article] [PubMed] [Google Scholar]
- Le DT, Uram JN, Wang H, Bartlett BR, Kemberling H, Eyring AD, Skora AD, Luber BS, Azad NS, Laheru D, et al. (2015). PD-1 Blockade in Tumors with Mismatch-Repair Deficiency. N. Engl. J. Med 372, 2509–2520. [DOI] [PMC free article] [PubMed] [Google Scholar]
- Le DT, Durham JN, Smith KN, Wang H, Bartlett BR, Aulakh LK, Lu S, Kemberling H, Wilt C, Luber BS, et al. (2017). Mismatch repair deficiency predicts response of solid tumors to PD-1 blockade. Science 357, 409–413. [DOI] [PMC free article] [PubMed] [Google Scholar]
- Li H, Limenitakis JP, Fuhrer T, Geuking MB, Lawson MA, Wyss M, Brugiroux S, Keller I, Macpherson JA, Rupp S, et al. (2015). The outer mucus layer hosts a distinct intestinal microbial niche. Nat. Commun 6, 8292. [DOI] [PMC free article] [PubMed] [Google Scholar]
- Liu J, Lichtenberg T, Hoadley KA, Poisson LM, Lazar AJ, Cherniack AD, Kovatich AJ, Benz CC, Levine DA, Lee AV, et al. (2018). An Integrated TCGA Pan-Cancer Clinical Data Resource to Drive High-Quality Survival Outcome Analytics. Cell 173, 400–416.e11. [DOI] [PMC free article] [PubMed] [Google Scholar]
- Lund AW (2016). Rethinking lymphatic vessels and antitumor immunity. Trends Cancer 2, 548–551. [DOI] [PubMed] [Google Scholar]
- Lund AW, Wagner M, Fankhauser M, Steinskog ES, Broggi MA, Spranger S, Gajewski TF, Alitalo K, Eikesdal HP, Wiig H, et al. (2016). Lymphatic vessels regulate immune microenvironments in human and murine melanoma. J. Clin. Invest 126, 3389–3402. [DOI] [PMC free article] [PubMed] [Google Scholar]
- Ma C, Han M, Heinrich B, Fu Q, Zhang Q, Sandhu M, Agdashian D, Terabe M, Berzofsky JA, Fako V, et al. (2018). Gut microbiome-mediated bile acid metabolism regulates liver cancer via NKT cells. Science 360. [DOI] [PMC free article] [PubMed] [Google Scholar]
- Maggio-Price L, Treuting P, Zeng W, Tsang M, Bielefeldt-Ohmann H, and Iritani BM (2006). Helicobacter infection is required for inflammation and colon cancer in SMAD3-deficient mice. Cancer Res 66, 828–838. [DOI] [PMC free article] [PubMed] [Google Scholar]
- Maloy KJ, Antonelli LRV, Lefevre M, and Powrie F (2005). Cure of innate intestinal immune pathology by CD4+CD25+ regulatory T cells. Immunol. Lett 97, 189–192. [DOI] [PubMed] [Google Scholar]
- Martens R, Permanyer M, Werth K, Yu K, Braun A, Halle O, Halle S, Patzer GE, Bošnjak B, Kiefer F, et al. (2020). Efficient homing of T cells via afferent lymphatics requires mechanical arrest and integrin-supported chemokine guidance. Nat. Commun 11, 1114. [DOI] [PMC free article] [PubMed] [Google Scholar]
- Matson V, Fessler J, Bao R, Chongsuwat T, Zha Y, Alegre M-L, Luke JJ, and Gajewski TF (2018). The commensal microbiome is associated with anti-PD-1 efficacy in metastatic melanoma patients. Science 359, 104–108. [DOI] [PMC free article] [PubMed] [Google Scholar]
- McDonald D, Price MN, Goodrich J, Nawrocki EP, DeSantis TZ, Probst A, Andersen GL, Knight R, and Hugenholtz P (2012). An improved Greengenes taxonomy with explicit ranks for ecological and evolutionary analyses of bacteria and archaea. ISME J 6, 610–618. [DOI] [PMC free article] [PubMed] [Google Scholar]
- McLane LM, Abdel-Hakeem MS, and Wherry EJ (2019). CD8 T cell exhaustion during chronic viral infection and cancer. Annu. Rev. Immunol 37, 457–495. [DOI] [PubMed] [Google Scholar]
- Mlecnik B, Bindea G, Angell HK, Maby P, Angelova M, Tougeron D, Church SE, Lafontaine L, Fischer M, Fredriksen T, et al. (2016). Integrative analyses of colorectal cancer show immunoscore is a stronger predictor of patient survival than microsatellite instability. Immunity 44, 698–711. [DOI] [PubMed] [Google Scholar]
- Moon JJ, Chu HH, Pepper M, McSorley SJ, Jameson SC, Kedl RM, and Jenkins MK (2007). Naive CD4(+) T cell frequency varies for different epitopes and predicts repertoire diversity and response magnitude. Immunity 27, 203–213. [DOI] [PMC free article] [PubMed] [Google Scholar]
- Nagamine CM, Rogers AB, Fox JG, and Schauer DB (2008a). Helicobacter hepaticus promotes azoxymethane-initiated colon tumorigenesis in BALB/c-IL10-deficient mice. Int. J. Cancer 122, 832–838. [DOI] [PubMed] [Google Scholar]
- Nagamine CM, Sohn JJ, Rickman BH, Rogers AB, Fox JG, and Schauer DB (2008b). Helicobacter hepaticus infection promotes colon tumorigenesis in the BALB/c-Rag2(−/−) Apc(Min/+) mouse. Infect. Immun 76, 2758–2766. [DOI] [PMC free article] [PubMed] [Google Scholar]
- Nolte MA, Arens R, Kraus M, van Oers MHJ, Kraal G, van Lier RAW, and Mebius RE (2004). B cells are crucial for both development and maintenance of the splenic marginal zone. J. Immunol 172, 3620–3627. [DOI] [PubMed] [Google Scholar]
- Oldenhove G, Bouladoux N, Wohlfert EA, Hall JA, Chou D, Dos Santos L, O’Brien S, Blank R, Lamb E, Natarajan S, et al. (2009). Decrease of Foxp3+ Treg cell number and acquisition of effector cell phenotype during lethal infection. Immunity 31, 772–786. [DOI] [PMC free article] [PubMed] [Google Scholar]
- Pepper M, Pagán AJ, Igyártó BZ, Taylor JJ, and Jenkins MK (2011). Opposing signals from the Bcl6 transcription factor and the interleukin-2 receptor generate T helper 1 central and effector memory cells. Immunity 35, 583–595. [DOI] [PMC free article] [PubMed] [Google Scholar]
- Petitprez F, de Reyniès A, Keung EZ, Chen TW-W, Sun C-M, Calderaro J, Jeng YM, Hsiao L-P, Lacroix L, Bougoüin A, et al. (2020). B cells are associated with survival and immunotherapy response in sarcoma. Nature 577, 556–560. [DOI] [PubMed] [Google Scholar]
- Price MN, Dehal PS, and Arkin AP (2010). FastTree 2 — approximately maximum-likelihood trees for large alignments. PLoS One 5, e9490. [DOI] [PMC free article] [PubMed] [Google Scholar]
- Randall TD, and Kern JA (2014). Tertiary lymphoid structures target the antitumor immune response to lung cancer. Am. J. Respir. Crit. Care Med 189, 767–769. [DOI] [PMC free article] [PubMed] [Google Scholar]
- Randall TD, and Mebius RE (2014). The development and function of mucosal lymphoid tissues: a balancing act with micro-organisms. Mucosal Immunol 7, 455–466. [DOI] [PubMed] [Google Scholar]
- Rangel-Moreno J, Carragher DM, de la Luz Garcia-Hernandez M, Hwang JY, Kusser K, Hartson L, Kolls JK, Khader SA, and Randall TD (2011). The development of inducible bronchus-associated lymphoid tissue depends on IL-17. Nat. Immunol 12, 639–646. [DOI] [PMC free article] [PubMed] [Google Scholar]
- Rawla P, Sunkara T, and Barsouk A (2018). Epidemiology of colorectal cancer: incidence, mortality, survival, and risk factors pg. [DOI] [PMC free article] [PubMed]
- Rosshart SP, Vassallo BG, Angeletti D, Hutchinson DS, Morgan AP, Takeda K, Hickman HD, McCulloch JA, Badger JH, Ajami NJ, et al. (2017). Wild mouse gut microbiota promotes host fitness and improves disease resistance. Cell 171, 1015–1028.e13. [DOI] [PMC free article] [PubMed] [Google Scholar]
- Rothschild D, Weissbrod O, Barkan E, Kurilshikov A, Korem T, Zeevi D, Costea PI, Godneva A, Kalka IN, Bar N, et al. (2018). Environment dominates over host genetics in shaping human gut microbiota. Nature 555, 210–215. [DOI] [PubMed] [Google Scholar]
- Routy B, Le Chatelier E, Derosa L, Duong CPM, Alou MT, Daillère R, Fluckiger A, Messaoudene M, Rauber C, Roberti MP, et al. (2018). Gut microbiome influences efficacy of PD-1-based immunotherapy against epithelial tumors. Science 359, 91–97. [DOI] [PubMed] [Google Scholar]
- Ruddle NH (2014). Lymphatic vessels and tertiary lymphoid organs. J. Clin. Invest 124, 953–959. [DOI] [PMC free article] [PubMed] [Google Scholar]
- Ruddle NH (2016). High endothelial venules and lymphatic vessels in tertiary lymphoid organs: characteristics, functions, and regulation. Front. Immunol 7, 491. [DOI] [PMC free article] [PubMed] [Google Scholar]
- Schürch CM, Bhate SS, Barlow GL, Phillips DJ, Noti L, Zlobec I, Chu P, Black S, Demeter J, McIlwain DR, et al. (2020). Coordinated cellular neighborhoods orchestrate antitumoral immunity at the colorectal cancer invasive front. Cell 182, 1341–1359.e19. [DOI] [PMC free article] [PubMed] [Google Scholar]
- Schwabe RF, and Jobin C (2013). The microbiome and cancer. Nat. Rev. Cancer 13, 800–812. [DOI] [PMC free article] [PubMed] [Google Scholar]
- Sears CL, and Garrett WS (2014). Microbes, microbiota, and colon cancer. Cell Host Microbe 15, 317–328. [DOI] [PMC free article] [PubMed] [Google Scholar]
- Sharma P, Hu-Lieskovan S, Wargo JA, and Ribas A (2017). Primary, adaptive, and acquired resistance to cancer immunotherapy. Cell 168, 707–723. [DOI] [PMC free article] [PubMed] [Google Scholar]
- Sivan A, Corrales L, Hubert N, Williams JB, Aquino-Michaels K, Earley ZM, Benyamin FW, Lei YM, Jabri B, Alegre M-L, et al. (2015). Commensal Bifidobacterium promotes antitumor immunity and facilitates anti-PD-L1 efficacy. Science 350, 1084–1089. [DOI] [PMC free article] [PubMed] [Google Scholar]
- Stuart T, Butler A, Hoffman P, Hafemeister C, Papalexi E, Mauck WM, Hao Y, Stoeckius M, Smibert P, and Satija R (2019). Comprehensive Integration of Single-Cell Data. Cell 177, 1888–1902.e21. [DOI] [PMC free article] [PubMed] [Google Scholar]
- Tauriello DVF, Calon A, Lonardo E, and Batlle E (2017). Determinants of metastatic competency in colorectal cancer. Mol. Oncol 11, 97–119. [DOI] [PMC free article] [PubMed] [Google Scholar]
- Topalian SL, Hodi FS, Brahmer JR, Gettinger SN, Smith DC, McDermott DF, Powderly JD, Carvajal RD, Sosman JA, Atkins MB, et al. (2012). Safety, activity, and immune correlates of anti-PD-1 antibody in cancer. N. Engl. J. Med 366, 2443–2454. [DOI] [PMC free article] [PubMed] [Google Scholar]
- Twyman-Saint Victor C, Rech AJ, Maity A, Rengan R, Pauken KE, Stelekati E, Benci JL, Xu B, Dada H, Odorizzi PM, et al. (2015). Radiation and dual checkpoint blockade activate non-redundant immune mechanisms in cancer. Nature 520, 373–377. [DOI] [PMC free article] [PubMed] [Google Scholar]
- Vétizou M, Pitt JM, Daillère R, Lepage P, Waldschmitt N, Flament C, Rusakiewicz S, Routy B, Roberti MP, Duong CPM, et al. (2015). Anticancer immunotherapy by CTLA-4 blockade relies on the gut microbiota. Science 350, 1079–1084. [DOI] [PMC free article] [PubMed] [Google Scholar]
- Vinuesa CG, Linterman MA, Yu D, and MacLennan ICM (2016). Follicular helper T cells. Annu. Rev. Immunol 34, 335–368. [DOI] [PubMed] [Google Scholar]
- Wegorzewska MM, Glowacki RWP, Hsieh SA, Donermeyer DL, Hickey CA, Horvath SC, Martens EC, Stappenbeck TS, and Allen PM (2019). Diet modulates colonic T cell responses by regulating the expression of a Bacteroides thetaiotaomicron antigen. Sci. Immunol 4. [DOI] [PMC free article] [PubMed] [Google Scholar]
- Xu M, Pokrovskii M, Ding Y, Yi R, Au C, Harrison OJ, Galan C, Belkaid Y, Bonneau R, and Littman DR (2018). c-MAF-dependent regulatory T cells mediate immunological tolerance to a gut pathobiont. Nature 554, 373–377. [DOI] [PMC free article] [PubMed] [Google Scholar]
- Yu AI, Zhao L, Eaton KA, Ho S, Chen J, Poe S, Becker J, Gonzalez A, McKinstry D, Hasso M, et al. (2020). Gut Microbiota Modulate CD8 T Cell Responses to Influence Colitis-Associated Tumorigenesis. Cell Rep 31, 107471. [DOI] [PMC free article] [PubMed] [Google Scholar]
- Yu D, Rao S, Tsai LM, Lee SK, He Y, Sutcliffe EL, Srivastava M, Linterman M, Zheng L, Simpson N, et al. (2009). The transcriptional repressor Bcl-6 directs T follicular helper cell lineage commitment. Immunity 31, 457–468. [DOI] [PubMed] [Google Scholar]
- Zackular JP, Baxter NT, Iverson KD, Sadler WD, Petrosino JF, Chen GY, and Schloss PD (2013). The gut microbiome modulates colon tumorigenesis. MBio 4, e00692–13. [DOI] [PMC free article] [PubMed] [Google Scholar]
Associated Data
This section collects any data citations, data availability statements, or supplementary materials included in this article.
Supplementary Materials
Data Availability Statement
Single-cell RNAseq data have been deposited at GEO and are publicly available as of the date of publication (GSE178485). 16S data have been uploaded to NCBI SRA and are publicly available as of the date of publication (PRJNA655517). Accession numbers for both are listed in the key resources table. Any additional information required to reanalyze the data reported in this paper is available from the lead contact upon request.