

Abstract
Background
Clinical trials have shown that calcium supplementation in children can increase bone mineral density (BMD) although this effect may not be maintained. There has been no quantitative systematic review of this intervention.
Objectives
·To determine the effectiveness of calcium supplementation for improving BMD in children. ·To determine if any effect varies by sex, pubertal stage, ethnicity or level of physical activity, and if any effect persists after supplementation is ceased.
Search methods
We searched CENTRAL, (Cochrane Central Register of Controlled Trials) (Issue 3, 2005), MEDLINE (1966 to 1 April 2005), EMBASE (1980 to 1 April 2005), CINAHL (1982 to 1 April 2005), AMED (1985 to 1 April 2005), MANTIS (1880 to 1 April 2005) ISI Web of Science (1945 to 1 April 2005), Food Science and Technology Abstracts (1969 to 1 April 2005) and Human Nutrition (1982 to 1 April 2005). Conference abstract books (Osteoporosis International, Journal of Bone and Mineral Research) were hand‐searched.
Selection criteria
Randomised controlled trials of calcium supplementation (including by food sources) compared with placebo, with a treatment period of at least 3 months in children without co‐existent medical conditions affecting bone metabolism. Outcomes had to include areal or volumetric BMD, bone mineral content (BMC), or in the case of studies using quantitative ultrasound, broadband ultrasound attenuation and ultrasonic speed of sound, measured after at least 6 months of follow‐up.
Data collection and analysis
Two authors independently assessed trial quality and extracted data including adverse events. We contacted study authors for additional information.
Main results
The 19 trials included 2859 participants, of which 1367 were randomised to supplementation and 1426 to placebo. There was no heterogeneity in the results of the main effects analyses to suggest that the studies were not comparable. There was no effect of calcium supplementation on femoral neck or lumbar spine BMD. There was a small effect on total body BMC (standardised mean difference (SMD) +0.14, 95% CI+0.01, +0.27) and upper limb BMD (SMD +0.14, 95%CI +0.04, +0.24). Only the effect in the upper limb persisted after supplementation ceased (SMD+0.14, 95%CI+0.01, +0.28). This effect is approximately equivalent to a 1.7% greater increase in supplemented groups, which at best would reduce absolute fracture risk in children by 0.1‐0.2%per annum. There was no evidence of effect modification by baseline calcium intake, sex, ethnicity, physical activity or pubertal stage. Adverse events were reported infrequently and were minor.
Authors' conclusions
While there is a small effect of calcium supplementation in the upper limb, the increase in BMD which results is unlikely to result in a clinically significant decrease in fracture risk. The results do not support the use of calcium supplementation in healthy children as a public health intervention. These results cannot be extrapolated to children with medical conditions affecting bone metabolism.
Plain language summary
Calcium for improving bone mineral density in children
Do calcium supplements build stronger bones in children?
Background
Osteoporosis is a systemic skeletal disorder characterized by low bone mass and microarchitectural deterioration of bone tissue, with a consequent increase in bone fragility and susceptibility to fracture (1993). It is a major and growing public health problem, particularly in women (Jones 1994; Cooley 2001; Woolf 2003). An estimated 10 million people already have osteoporosis and 18 million more have low bone mass (NIH 2000) in the United States alone. While the impact of osteoporosis is currently greatest in western population, its impact worldwide is expected to increase (Woolf 2003). Low bone mineral density (BMD) is a major risk factor for osteoporotic fracture (Marshall 1996). It is well accepted that childhood factors are likely to have an impact of future risk of osteoporosis (NIH 2000). Peak bone mass is the maximum bone mass attained by an individual and is reached in early adult life. At least 90% of peak bone mass is obtained by age 18 years (Bailey 1999). BMD in later life is a function of peak bone mass and the rate of subsequent bone loss (Hansen 1991). It has also been shown that peak bone mass is as important as rate of bone loss as a risk factor for fracture in later life (Riis 1996). Peak bone mass is influenced by genetic factors, but also modifiable lifestyle factors such as adequate nutrition, body weight and physical activity (Javaid 2002). Maximizing peak bone mass is therefore a potential way to minimise the impact of age‐related bone loss. In addition, there is evidence that low BMD is a risk factor for fracture in childhood (Ma 2003; Goulding 1998; Goulding 2001), suggesting that optimising age‐appropriate bone mass may also have a more immediate effect on childhood fracture rates.
Strategies to maximise peak bone mass in girls and boys have been identified as a priority area for research (NIH 2000). Bone acts as a reservoir for calcium and other ions and is the major store of calcium within the body (Favus 2003). Calcium deposition in bone leads to increased bone mineral density and bone mineral content. Clinical trials have shown that BMD in children can be increased in the short‐term by physical activity interventions ( Bradney 1998; Fuchs 2001; Heinonen 2000; Morris 1997; MacKelvie 2003; Sundberg 2001) and calcium supplementation (Bonjour 1995; Johnston 1992; Lee 1994; Lee 1995; Lloyd 1993) although this effect may not be maintained (Lee 1994); and by increased dairy intake (Chan 1995). However, there has been no systematic review of effectiveness of calcium supplementation, the magnitude of its effect, the duration of any effect after supplementation ends and the impact of sex or pubertal stage on its effect.
Objectives
·To determine the effectiveness of calcium supplementation for improving BMD in children. ·To determine if any effect varies by sex, pubertal stage, ethnicity or level of physical activity. ·To determine if any effect persists after calcium supplementation is ceased.
Methods
Criteria for considering studies for this review
Types of studies
All randomised controlled trials of calcium supplementation compared with placebo, with a treatment period of at least 3 months were included. The studies had to have areal or volumetric BMD, or bone mineral content (BMC) as an outcome, or in the case of studies using quantitative ultrasound, broadband ultrasound attenuation (BUA) and ultrasonic speed of sound (SOS).
Types of participants
Trials in children (age<18 years) without co‐existent medical conditions or treatments affecting bone metabolism were included.
Types of interventions
Trials of calcium supplementation including supplementation by food sources. Trials of less than 3 months were excluded.
Types of outcome measures
Fractures in later life would be the ideal outcome measure in intervention studies for osteoporosis prevention, however for intervention studies in children this would require following large numbers of subjects for decades and these studies have not been performed. Therefore, in this review BMD was used as a surrogate outcome, as is commonly seen in intervention studies in children (Gilsanz 1998).
Data was extracted on areal BMD and BMC, measured a minimum of 6 months after the treatment was commenced. In the original review protocol, we aimed to use percentage change from baseline, but as this was available for only a small number of studies, this was not used. The available data also did not allow for calculation of volumetric BMD as was stipulated in the original review protocol. In the case of studies using quantitative ultrasound, broadband ultrasound attenuation (BUA) and ultrasonic speed of sound (SOS) were to be used, but in the absence of studies using these measures, these outcomes were not used. The outcome measures were converted to standardized mean differences (SMD) using Review Manager (version 4.2.7). We had sufficient extractable bone measurement data for meta‐analysis of the following outcomes: total body BMC, femoral neck BMD; lumbar spine BMD; distal radius BMD and upper limb BMD. Upper limb BMD included those studies included in the outcome for distal radius and additional studies with upper limb outcomes at other sites. Where multiple upper limb sites were measured, we chose the distal radius or the site closest to that point as the outcome. Methods of measurement included dual energy x‐ray absorptiometry (DXA), single photon absorptiometry (SPA) and dual photon absorptiometry (DPA).
Where possible we also determined sex, age, pubertal stage, physical activity, baseline height, baseline weight, dietary calcium intake, type of calcium supplement used, ethnicity and follow‐up after cessation of treatment to assess possible effect modification by these variables. We also collected data on adverse effects, where available.
Search methods for identification of studies
The search strategies included a search CENTRAL, (Cochrane Central Register of Controlled Trials) (Issue 3, 2005), MEDLINE (1966 to 1 April 2005), EMBASE (1980 to 1 April 2005), CINAHL (1982 to 1 April 2005), AMED (1985 to 1 April 2005), MANTIS (1880 to 1 April 2005) ISI Web of Science (1945 to 1 April 2005), Food Science and Technology Abstracts (1969 to 1 April 2005) and Human Nutrition (1982 to 1 April 2005). Conference abstract books (Osteoporosis International, Journal of Bone and Mineral Research) were also hand searched. For MEDLINE (OVID) the strategy used was:
1exp CALCIUM/ 2exp Calcium, Dietary/ 3calcium.tw. 4exp dairy products/ 5dairy.tw. 6milk.tw. 7exp dietary supplements/ 8or/1‐7 9exp OSTEOPOROSIS/ 10osteoporo$.tw. 11exp Bone Density/ 12(bone adj2 loss).tw. 13(bone adj2 densit$).tw. 14bone mass.tw. 15bmd.tw. 16or/9‐15 178 and 16 18limit 17 to all child <0 to 18 years>
The Dickersin filter (Robinson 2002) for randomised controlled trials was applied to MEDLINE, and adapted for other databases where relevant. In the absence of evidence of publication bias we did not systematically contact content experts regarding unpublished studies. Informal contacts did not yield any unpublished studies.
Data collection and analysis
Two reviewers (TW, KS) independently reviewed relevant articles identified by the search strategy, with initial screening of abstracts according to the inclusion criteria and with full text articles being reviewed if there was insufficient information in the abstract to assess eligibility. All data was extracted by two reviewers (TW, KS). Details regarding the study population, treatment periods, baseline demographic data and baseline and end of study outcomes were extracted independently. Differences in data extraction were resolved by referring back to the original article and establishing consensus. A third reviewer (GJ) was available to assist in reaching consensus if required, but was not needed. The same two reviewers (TW,KS) performed a quality assessment independently for each trial assessing randomisation, allocation concealment, blinding of those providing treatment and of treatment subjects, and description of withdrawals and dropouts (Jadad 1996; Juni 2001).
For bone density, we calculated the SMD of the endpoints at end of trial between treatment and control groups for the various outcomes. Originally, we had planned to use percentage change from baseline as the outcome measure, but this was not possible with the data available to us, and end point data was therefore used instead. We assessed heterogeneity of the data using a Chi‐square test on N‐1 degrees of freedom. Meta‐analysis was conducted according to a fixed‐effect model for the main effect outcomes, as there was no heterogeneity for these outcomes. Where heterogeneity existed in subgroup analyses we used a random‐effects model. In the absence of heterogeneity of the main effect outcomes and because of limited numbers of studies for each outcome, we did not perform meta‐regression and we limited our subgroup analyses to key potential effect modifiers, namely: sex; ethnicity; baseline calcium intake; physical activity; type of supplementation (milk extract compared to other calcium supplement forms (calcium carbonate/calcium citrate malate/calcium phosphate)) and duration of supplementation. The baseline calcium subgroups were determined by whether the baseline dietary calcium intake was less than or greater than or equal to the median value of the individual study means, which was 794 mg/day. Due to study numbers, we were unable to perform analyses using other definitions of low calcium intake except in the case of upper limb BMD, where we also analysed in subgroups of baseline calcium intake of below compared to above the 25th percentile (i.e . 582 mg/day). Physical activity subgroups were chosen according to the data available in individual studies ‐ where the studies had physical activity as a co‐intervention or subgrouping, those in the low physical activity arm were included in the low physical activity subgroup for the review and those in the high physical activity arm in the high physical activity subgroup for the review. For study duration, we initially chose a cut‐off of 24 months duration so as to sure of exceeding any period of rapid change from the bone remodeling transient. Because this left few studies in the longer duration subgroup, we repeated the analysis using an 18‐month cut‐off, which is likely to still have exceeded the time needed for the effects on bone of remodeling changes to appear and a new steady state to be reached. We also performed a subgroup analysis whether the calcium intake in the intervention group in the trial exceeded the probable threshold (approximately 1400 mg/day) below which skeletal accumulation varies with intake and above which skeletal accumulation appears constant regardless of intake (Jackman 1997; Matkovic 1992). This was an analysis additional to those specified in the original protocol.
Where necessary the authors of the primary studies were contacted to obtain additional information. We aimed to use intention‐to‐treat data from the individual clinical trials wherever possible. If this data was not available, we used data from available treatment analysis. If no other data were available we used data from treatment received analysis. For the single study (Wang 1996) in which upper limb outcomes were presented as percent change from baseline, and no endpoint data could be obtained from the authors, we imputed endpoint data using the formula endpoint BMD= (100% +%change) X baseline BMD and assumed the endpoint standard deviation (SD) was the same as that seen at baseline (as was observed in other studies for upper limb outcomes). Where studies reported the outcome as absolute change from baseline and endpoint data were not available (Lloyd 1993; Bonjour 1995; Chevalley 2005; Iuliano‐Burns 2003; Specker 2003) we imputed the endpoint using (baseline plus change) for the mean in both treatment and control arms, and using the standard deviation of the baseline data for the endpoint SD.
Funnel plots were performed for assessment of publication bias.
Our method of imputing the standard deviation for studies which gave change rather than endpoint data was likely to result in those studies being given more rather than less weight. We therefore performed a sensitivity analysis for the main effects omitting studies for which data was imputed (Wang 1996; Lloyd 1993; Bonjour 1995; Chevalley 2005; Iuliano‐Burns 2003; Specker 2003) . We also performed a sensitivity analysis omitting the study (Bonjour 1995) that used treatment received rather than intention to treat or available data analysis. In the absence of heterogeneity of the main effect outcomes, sensitivity analyses were not performed to assess the impact of study quality on results.
Grading of evidence We used the grading system described in the 2004 book Evidence‐based Rheumatology (Tugwell 2004) and recommended by the Musculoskeletal Group: Platinum: A published systematic review that has at least two individual controlled trials each satisfying the following : ·Sample sizes of at least 50 per group ‐ if these do not find a statistically significant difference, they are adequately powered for a 20% relative difference in the relevant outcome. ·Blinding of patients and assessors for outcomes. ·Handling of withdrawals >80% follow up (imputations based on methods such as Last Observation Carried Forward (LOCF) are acceptable). ·Concealment of treatment allocation.
Gold: At least one randomised clinical trial meeting all of the following criteria for the major outcome(s) as reported: ·Sample sizes of at least 50 per group ‐ if these do not find a statistically significant difference, they are adequately powered for a 20% relative difference in the relevant outcome. ·Blinding of patients and assessors for outcomes. ·Handling of withdrawals > 80% follow up (imputations based on methods such as LOCF are acceptable). ·Concealment of treatment allocation.
Silver: A randomised trial that does not meet the above criteria. Silver ranking would also include evidence from at least one study of non‐randomised cohorts that did and did not receive the therapy, or evidence from at least one high quality case‐control study. A randomised trial with a 'head‐to‐head' comparison of agents would be considered silver level ranking unless a reference were provided to a comparison of one of the agents to placebo showing at least a 20% relative difference.
Bronze: The bronze ranking is given to evidence if at least one high quality case series without controls (including simple before/after studies in which patients act as their own control) or if the conclusion is derived from expert opinion based on clinical experience without reference to any of the foregoing (for example, argument from physiology, bench research or first principles).
Clinical relevance
The SMD effect size was used to estimate an absolute benefit in mg/cm2 by estimating the pooled SD from the means of the SD of the outcomes in treatment and control groups for each study, and multiplying the SMD by this (Alderson 2002). Relative difference in the change from baseline was estimated as the absolute benefit divided by the mean of all the baseline means of the control groups, expressed as a percentage. The result of this analysis is reported in the text of the review results and discussion.
The review will be updated in future according to Cochrane Collaboration recommendations .
Results
Description of studies
We identified 233 references to potential studies. Of these, 155 were excluded as they were not randomised controlled trials. Of the remaining 78 references, 9 were to trials without calcium supplementation as an intervention, 7 were to trials in participants with conditions predisposing to osteoporosis and 3 were to studies in adults. Of the remaining 59 references to RCTs of calcium supplementation in children, the following references were excluded for the following reasons: ·16 references were to studies with either no placebo (Barker 1998; Cadogan 1997; Chan 1995; Du 2004; Fischer 1999a; Lau 1992; Lau 2004; Li 2002; Magee 1996; Merrilees 2000; Renner 1998; Specker 1997; Zhang 2003; Zhu 2003; Zhu 2004) or which used an active placebo i.e. a placebo which itself could affect bone (Gibbons 2004) ·3 were duplicate publications (Fischer 1999b; Nowson 1995; Specker 2002) ·2 did not measure BMD or BMC or ultrasound measures of bone as outcomes (Lappe 2004; Ohgitani 1997) ·1 included vitamin D with calcium as the intervention (Moyer‐Mileur 2003) ·1 had inadequate randomisation (Matkovic 1990) ·1 had outcomes measured after< 6 months follow‐up (Volek 2003)
The remaining 35 references to 19 studies were included in the systematic review.
Additional data was requested from authors of 8 eligible studies, of whom 5 supplied the additional information sought (Cameron 2004; Johnston 1992; Prentice 2005; Stear 2003; Courteix 2005) . In only one of the cases where additional information was not obtained, did this result in no usable data being available for the meta‐analysis (Rodda 2004). All other eligible studies provided useful data for pooling.
The 19 RCTs included a total of 2859 participants, of whom 1367 were randomised to receive calcium supplementation, 1426 were randomised to placebo, and 66 withdrew from the study and the intervention group to which they were randomised was not stated. The Characteristics of Included Studies table summarises the characteristics of these studies. Studies included children as young as 3 years old, up to 18 years of age. Calcium supplementation was by calcium citrate malate, calcium carbonate, calcium phosphate, calcium lactate gluconate, calcium phosphate milk extract or milk minerals with calcium dose ranging from 300 to 1200 mg per day. No studies used ultrasound measures of bone outcomes. One study used intention‐to‐treat analysis (Dibba 2000); in one study the type of analysis was not stated (Rodda 2004); in one study (Bonjour 1995) only data from treatment received analysis was available for the femoral neck, lumbar spine and upper limb BMD at end of the trial. The remaining studies used available data analysis. Five studies had loss to follow‐up of less than 5% (Dibba 2000; Lee 1994; Molgaard 2004; Prentice 2005; Wang 1996), 5 had a loss to follow‐up of between 5 and 20% (Bonjour 1995; Iuliano‐Burns 2003; Lloyd 1993; Rozen 2003; Stear 2003) and 8 had loss to follow‐up of more than 20% (Cameron 2004; Chevalley 2005; Courteix 2005; Johnston 1992; Lee 1995; Matkovic 2004; Nowson 1997; Specker 2003) of their trial participants. One study did not report withdrawals and drop outs (Rodda 2004). Three studies had physical activity as a co‐intervention (Iuliano‐Burns 2003; Prentice 2005; Stear 2003) and one had physical activity subgroups of exercise (7.2 hours exercise per week) and sedentary (1.2 hours exercise per week) (Courteix 2005).
Risk of bias in included studies
Two reviewers (KS, TW) independently rated the methodological quality of each eligible study. Any disagreement was resolved by consensus, with the third reviewer (GJ) not being required to contribute for these to be resolved. Adequate description of randomisation was given for four studies (Courteix 2005; Dibba 2000; Iuliano‐Burns 2003; Prentice 2005), the remaining studies were stated to be randomised but randomisation procedures were not described. Four studies (Bonjour 1995; Courteix 2005; Dibba 2000; Stear 2003) described adequate allocation concealment, the description in the remainder of the studies was unclear. Adequate description of blinding of subjects was given in all studies except two (Chevalley 2005; Specker 2003) in which the description was unclear, though all were controlled with adequate placebo. Thirteen studies gave an adequate description of withdrawals and drop outs (Bonjour 1995; Cameron 2004; Chevalley 2005; Courteix 2005; Dibba 2000; Johnston 1992; Lee 1994; Lee 1995; Lloyd 1993; Molgaard 2004; Nowson 1997; Prentice 2005; Specker 2003) and six did not (Iuliano‐Burns 2003; Matkovic 2004; Rodda 2004; Rozen 2003; Stear 2003; Wang 1996). Overall, the risk of bias was rated as low in two studies (Courteix 2005; Dibba 2000), moderate in twelve studies ( Bonjour 1995; Cameron 2004; Chevalley 2005; Johnston 1992; Lee 1994; Lee 1995; Lloyd 1993; Molgaard 2004; Nowson 1997; Prentice 2005; Rodda 2004; Specker 2003), and high in five studies (Iuliano‐Burns 2003; Matkovic 2004; Rozen 2003; Stear 2003; Wang 1996).
Effects of interventions
Comparison Tables 1 to 9 give the treatment effects, as standardised mean differences (SMD) at each site at the end of the period of calcium supplementation and the results at the longest period of follow‐up available after calcium supplementation was ceased for each trial. There was no effect of calcium supplementation on BMD at the femoral neck (+0.07, 95%CI ‐0.05, +0.19) or lumbar spine BMD (+0.08, 95% CI ‐0.04, +0.20). There was a small effect on total body BMC (+0.14, 95% CI +0.01, +0.27) and upper limb BMD (+0.14, 95%CI +0.04, +0.24) which persisted after supplementation ceased only in the upper limb (+0.14, 95%CI +0.01, +0.28). As the effect at the distal radius alone was similar to that in the upper limb as defined in the methods, we discuss only the upper limb results in further detail. The effect at the upper limb is approximately equivalent to a treatment effect of 6.38 mg/cm2 or an approximately 1.7% greater increase in supplemented groups over the course of supplementation; and to a 6.30 mg/cm2 or 1.7% greater increase after follow‐up after supplementation had ceased. A single study (Rozen 2003) reported on total body BMC after cessation of supplementation, and this showed no persistent effect (SMD 0.0, 95%CI ‐0.40, +0.40). There was no significant heterogeneity for the results at any site (p= 0.29 to p>0.99).
Subgroup Analyses
Subgroup analyses by baseline calcium intake, sex, ethnicity, physical activity, pubertal stage, type of supplementation (milk extract or other), duration of supplementation and by whether the calcium threshold was exceeded all did not demonstrate significant effect modification at any site (Comparison Tables 10 to 79). Point estimates of treatment effects during supplementation were greater at all sites in females than males (Tables 19 to 26), though these differences were not significant. At the upper limb, treatment effects during supplementation were similar in magnitude and not significant in both Caucasian and Chinese population studies but a relatively strong effect was seen in the single study in an African population (+0.44, 95%CI +0.12, +0.75). A single study described a gain in lumbar spine BMD of 0.045 g/cm2 in Chinese but not Anglo‐Celt girls (Rodda 2004) but the study provided insufficient data to be included in the meta‐analysis. Subgroup analysis by physical activity level showed no evidence of effect modification, though there were only two studies with extractable data for the femoral neck, lumbar spine and upper limb outcomes. One study not included in the meta‐analysis demonstrated interaction between calcium supplementation and physical activity using femoral BMC as an outcome but not for tibia‐fibula BMC (Iuliano‐Burns 2003).
Numbers of studies available for subgroup analyses were limited for some outcomes, for example subgroup analysis by baseline calcium intake using a definition of low calcium intake as the mean baseline calcium intake of the participants in the study being in the lowest quartile. Only a single study (Rozen 2003) measured TB BMC after supplementation ceased so subgroup analyses for this outcome were not possible. Only one study reported TB BMC for males (Prentice 2005) and only one reported femoral neck and lumbar spine BMD after supplementation ceased for males (Chevalley 2005). There was only a single study with any results described in purely peri‐pubertal children (Matkovic 2004) and insufficient data for any subgroup analysis by pubertal stage for effects after cessation of supplementation. No studies in Chinese populations had total body BMC data, and only a single study using milk extract as a supplement had total body BMC data.
Funnel plots for each outcome did not suggest the presence of publication bias (See Additional Figures:Figure 1, Figure 2, Figure 3, Figure 4, Figure 5, Figure 6, Figure 7, Figure 8, Figure 9).
1.
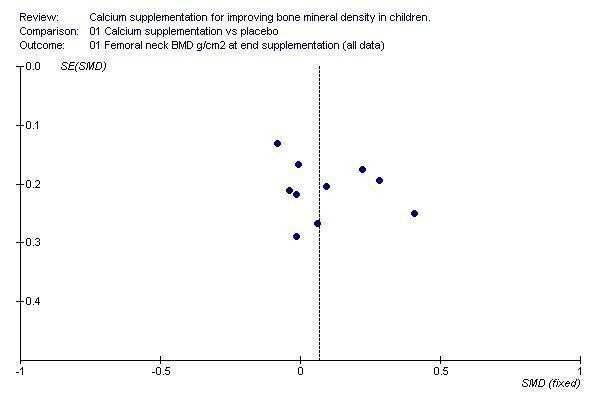
Funnel plot of studies with femoral neck BMD outcome at end of supplementation period
2.

Funnel plot of studies with femoral neck BMD outcome at end of longest period of follow‐up after supplementation ceased
3.

Funnel plot of studies with lumbar spine BMD outcome at end of supplementation period
4.

Funnel plot of studies with lumbar spine BMD outcome at end of longest period of follow‐up after supplementation ceased
5.

Funnel plot of studies with total body BMC outcome at end of supplementation period
6.
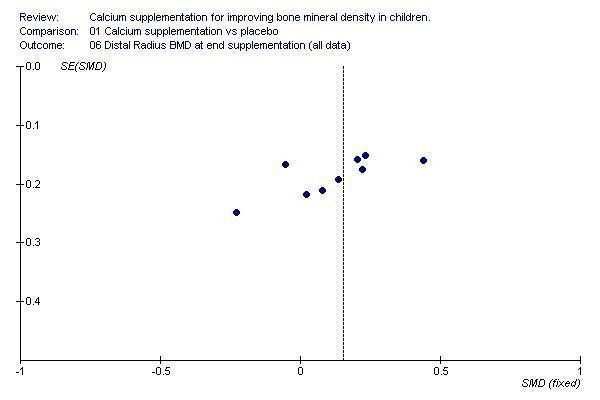
Funnel plot of studies with distal radius BMD outcome at end of supplementation period
7.

Funnel plot of studies with distal radius BMD outcome at end of longest period of follow‐up after supplementation ceased
8.
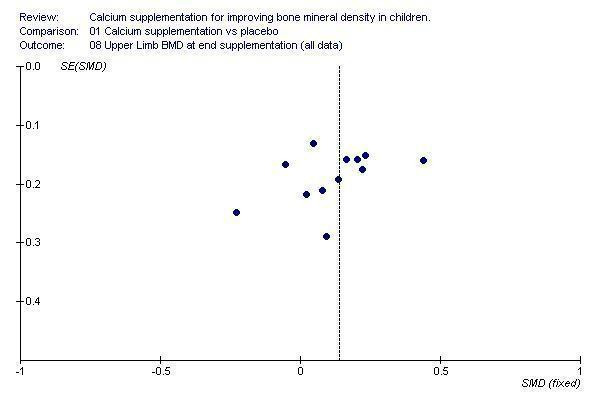
Funnel plot of studies with upper limb BMD outcome at end of supplementation period
9.
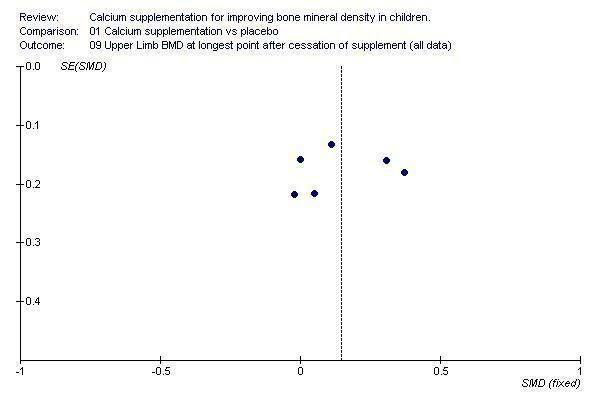
Funnel plot of studies with upper limb BMD outcome at end of longest period of follow‐up after supplementation ceased
Sensitivity analyses omitting results only given from active treatment analysis (Bonjour 1995 at end of supplementation) did not substantially alter the results of the review. Omitting the studies with imputed values reduced the effect at the upper limb after cessation of supplementation from an SMD of +0.14 (95%CI +0.01, +0.28) to +0.10 (95% CI ‐0.07, +0.28) and marginally widened the confidence interval around the effect on total body BMC at the end of supplementation (+0.15, 95%CI ‐0.01, +0.31) without changing the size of the point estimate of the treatment effect. Sensitivity analyses did not substantially affect the review results for any other outcomes.
Adverse events were reported infrequently and were minor in nature, including raised urinary calcium to creatinine ratio (1 child), and gastro‐intestinal side effects (4 children).
Discussion
Calcium supplementation has little effect on BMD. At the only site where an effect was demonstrated, the upper limb, the effect is small, equating to an approximately 1.7 percentage point greater increase in BMD in the supplemented compared to the control group, an effect which persists after supplementation ceases with a 1.7 percentage point greater increase. It is important to note that this effect did not remain statistically significant when the studies for which imputed outcomes were used were excluded, and it is therefore possible that the upper limb effect may be smaller than indicated in the main analysis. The small increase in BMD at the upper limb is unlikely to result in a clinically significant decrease in fracture risk. Importantly, there were no effects seen at other sites at which fracture is common, namely the femoral neck and lumbar spine.
Children with upper limb fractures have been reported to have reduced BMD at the femoral neck, lumbar spine and total body compared to controls with the difference being in the order of 1‐5% depending on site of BMD measurement (Ma 2003). Other studies examining distal forearm fractures in boys and girls (Goulding 1998; Goulding 2001) have reported a reduction in ultradistal radius BMD of around 4% in girls and 5% in boys and in 33% radius BMD of around 3% in both sexes. Based on the decrease in odds ratio for wrist and forearm fractures observed for each standard deviation increase in lumbar spine BMD (Ma 2003), the treatment effect observed in this review would result in an approximately 6% decrease in the relative risk of fracture. If this were applied to the peak incidence of all fracture in childhood (about 3% per annum (p.a.) in 15‐19 year old boys and 1% p.a. in 10‐14 year old girls) (Jones 2002), the decrease in absolute risk would be at most 0.2% p.a. in boys and 0.1% p.a. in girls. Therefore, while it is possible that the small increase in BMD from calcium supplementation could have an effect on reduction of fracture risk in childhood, the public health impact of this is likely to be small. Extrapolating these results to assess the potential for reduction in fracture risk in adult life is more problematic. Though the increase in upper limb BMD did persist after cessation of supplementation, the maximum length of follow‐up after supplementation was withdrawn was only 7 years (Bonjour 1995) and the study participants in even this study had not yet all reached adulthood. The impact of a period of supplementation in childhood on upper limb BMD and fracture risk in later life remains unknown. Even in calcium supplement trials in post‐menopausal women, the effect of calcium supplementation on fracture risk is unclear. While BMD increased by around 1.6 to 2 % (Shea 2004), the point estimate from the meta‐analysis of the five studies that included fracture risk as an outcome only suggested a reduction in vertebral fractures (relative risk (RR) 0.79, 95%CI 0.55 to 1.13), and a smaller reduction in risk of non‐vertebral fractures (RR 0.86, 95% CI 0.43 to 1.72). However, these results were not significant, probably due to small event numbers. The two studies providing data on non‐vertebral fracture did not examine upper limb fractures separately as an outcome, probably due to small events numbers. Thus, the public health benefits of calcium supplementation in children, either in childhood or in later life appear marginal at best.
The literature pertaining to calcium supplement use in children has been qualitatively reviewed previously (French 2000; Wosje 2000; Lanou 2005). These reviews reported that overall calcium supplementation did appear to have a favourable effect on bone outcomes. One review of six intervention studies published up until 1999 (French 2000) reported that calcium supplement use showed consistent positive effects on bone mass gains in children and adolescents, most consistently at the lumbar spine and total body sites. A second review (Wosje 2000) included one additional study and by contrast concluded that increases in BMD occurred mostly at cortical sites, are greater in populations with low baseline calcium intake and do not seem to persist beyond the supplementation period. The most recent review (Lanou 2005) was aimed specifically at determining whether the literature supported the suggestion that dairy products are better for promoting bone integrity that other calcium‐containing food sources or supplements. As part of this review the authors described 12 randomised controlled trials with duration of calcium supplementation more than 12 months. They reported that 9 out of 10 trials of calcium supplementation by non‐dairy sources showed an increase in bone outcomes and one showed no effect and that the three trials of dairy products showed slight effects. None of these latter three trials met the inclusion criteria for our review, as they were not placebo‐controlled (Cadogan 1997; Chan 1995) or did not have adequate randomisation (Matkovic 1990). In our review four studies used milk extract supplementation (Bonjour 1995; Chevalley 2005; Iuliano‐Burns 2003; Courteix 2005). In contrast to the qualitative reviews, the results of our quantitative review do not support the findings that calcium supplementation has significant beneficial effects in children for bone outcomes or that a particular type of calcium supplementation has any more effect on bone than any other.
Subgroup analyses demonstrated little effect modification across the subgroups tested, as one would expect given the lack of heterogeneity overall in the included studies. The consistently greater effects seen in females compared to males across all sites of bone outcome measurement at the end of supplementation, though not significant, are suggestive of a sex difference in the response of BMD and BMC to calcium supplementation. There were few studies on which to base an assessment of whether this sex difference persisted with withdrawal of supplementation, but on the available data the differences did not persist. The treatment effect on upper limb BMD in the single study performed in an African population was greater than that observed in either Caucasian or Chinese populations, but again not significantly so. Given that this was in a single study, some caution is needed in interpreting this result. The difference in effect may be explained by genetic factors, but the result could also be confounded by dietary, physical activity or other environmental factors.
It is interesting that there were no differences in treatment effects observed between shorter and longer studies. It has been hypothesised that calcium supplementation reduces bone remodeling rather than or as well as increasing bone modelling, thus accounting for the transient benefit of calcium supplementation seen in some individual studies (Heaney 2001). If bone remodeling was affected by calcium supplementation more than bone modelling, one would expect the difference between treatment effects in shorter versus longer studies to be small, in other words that as the duration of supplementation increased, the rate of increase in BMD/BMC would drop. This is consistent with our data. However, one would also expect that after supplementation ceased there would be a decrease in treatment effect. This is observed in our data for total body BMC but not at the upper limb, which is the only site where an overall treatment effect was observed during supplementation. The reason for this inconsistency between sites is not clear.
During supplementation, the magnitude of changes in bone density outcomes were similar whether the total calcium intake in the intervention arms of the studies did or did not exceed the estimated threshold below which skeletal accumulation varies with intake. This observation supports the concept of a calcium threshold: exceeding the threshold would not be expected to result in greater bone deposition. However, this analysis cannot confirm the magnitude of the threshold. It is possible that any effect of calcium supplementation ceases at a level less than the 1400 mg/day intake predicted from the literature which we tested in this analysis.
The sensitivity analyses performed indicated that the overall review results if anything may have overestimated the treatment effects for the upper limb after calcium supplementation had ceased. Otherwise, the sensitivity analyses had little effect on the review results and do not alter the overall conclusion of the review that the public health benefits of calcium supplementation in children, either in the short‐term or long‐term, appear marginal at best. Limitations No studies in this review measured fractures as an outcome. This is not surprising as a RCT examining fracture outcomes would require a large cohort of children followed for a lengthy period of time to have sufficient power and fracture events to detect an effect on fracture risk. However, this does add to the difficulty of interpreting the clinical and public health significance of the results. This review also did not assess changes in other bone indices such as bone size or geometry. The studies selected intentionally did not include trials in children with medical conditions or on medications that might affect bone metabolism. Therefore, the results of this review should not be extrapolated to children with such conditions. Meta‐regression could not be performed in this review due to the small number of studies. However, in the absence of heterogeneity this is not a significant limitation.
It has been suggested that areal BMD only partly corrects for bone size and that adjustment of BMC for bone area, weight and height is desirable (Prentice 1994). Only 3 studies provided such size adjusted data (Dibba 2000; Prentice 2005; Stear 2003) and so this outcome was not included in the meta‐analysis. However, qualitatively the outcomes of these 3 studies were similar, whether they were analysed using BMD or size‐adjusted BMC. Subgroup analyses identified areas in which there were gaps in studies in this review, particularly where studies have limited the number of sites measured for their outcomes. As a result, while there is no evidence of effect modification, in a number of areas studies are lacking, so that effect modification cannot be rule out. For example, one might expect that children with lower baseline calcium intake might benefit more from supplementation. While we did not find evidence of this, there were few studies performed in children with very low baseline calcium intake ‐ the majority were performed in participants in whom the mean baseline calcium intake was close to or above 700 mg/day. Only three studies had baseline intakes below 500 mg/day. Our power to detect effect modification by very low baseline calcium intake (< 500 mg/day) was limited. There were also few studies in which participants could be analysed by whether they were purely post‐pubertal and only a single study with only an upper limb outcome in purely peripubertal children. Given that it appears that calcium accumulation in the skeleton accelerates during puberty (Abrams 1996; Bonjour 1991), the absence of sufficient data in the peripubertal period is an important gap to be filled by further research. Other gaps were related to ethnicity and the impact of physical activity. Relatively few studies were in non‐Caucasian populations, which resulted in single studies with smaller numbers of participants for some outcomes in ethnicity subgroups. For example, at the femoral neck there was only a single study of Arabs/Jews with a wide confidence interval for the point estimate, though the magnitude of the treatment effect point estimate was larger than that seen in Caucasians. While no effect modification by physical activity was observed, there were only two studies to assess this at the lumbar spine, femoral neck and upper limb. Individual results from studies which were not included in the meta‐analysis suggest that effect modification could occur at other sites, but more studies are needed to assess this. The methods of assessing physical activity and calcium intake across the different studies were also variable, making classification into subgroups problematic.
Authors' conclusions
Implications for practice.
While there is a small effect of calcium supplementation at the upper limb, the resultant increase in BMD is unlikely to result in a clinically significant decrease in fracture risk. The results of this review do not support the use of calcium supplementation in healthy children as a public health intervention. However, these results cannot be extrapolated to children with medical conditions affecting bone metabolism.
Implications for research.
While long‐term fracture studies are desirable to properly assess any effect on fracture risk reduction, for reasons discussed above we recognise that these are unlikely to be feasible. The absence of sufficient data children with very low calcium intakes and in the peripubertal period are important gaps to be filled by further research. Long‐term calcium supplement studies over the period of peak bone mineral content velocity, perhaps particularly in children with very low calcium intake, would be desirable. Other gaps were related to ethnicity, the impact of physical activity, and the provision of information from follow‐up after supplementation ceases. Given the small treatment effects seen with calcium supplementation, it may also be appropriate to explore possible alternative nutritional interventions, such as vitamin D supplementation (Moyer‐Mileur 2003; Zhu 2004 b) and fruit and vegetable intake (Jones 2001).
Feedback
Feedback from Tanis Fenton, 5 January 2010
Summary
Date of Submission: 05‐Jan‐2010
Name: Tanis Fenton
Email Address: tanisfenton@shaw.ca
Personal Description: Occupation Nutrition Researcher
Feedback: To the Editor:
In the meta‐analysis on role of calcium supplementation in children, Winzenberg et al (1) used standardised mean differences (SMD) to summarize their results and to base their conclusions. Although the use of SMD is recognized as a valid approach in summarizing mean differences across trials in the Cochrane Review methodology (1), its primary purpose is for comparing variables with different units and measurement scales of different length (2). The SMD is calculated by dividing the group differences by the standard deviation. This converts a variable which has units to a unitless score. In other words, a variable which once had clinical meaning becomes clinically meaningless.
In Winzenberg et al.?s meta‐analysis, all measurements of bone mineral density (BMD) by the included studies were reported as grams per square centimetre (mg/cm2). Under these circumstances, we believe that the use of SMDs is unnecessary. An alternate approach is to summarize the treatment effects as absolute differences. We have re‐constructed Table 2 from the meta‐analysis by calculating the effect size at the end of supplementation period in terms of g/cm2, the usual units of measurement for BMD (published on‐line at: http://www.bmj.com/cgi/eletters/333/7572/775). We hope that our re‐constructed Table will help clinicians better‐appraise the magnitude of effect size for this meta‐analysis.
In regards to interpreting the results from the Table, all bone sites show consistent increase in BMD at the end of a median calcium supplementation period of one year. We disagree with Winzenberg et al.?s claim that the observed relative increase in upper limb body BMD is not clinically important. Not only is this result statistically significant, but a yearly 0.007 g/cm2 increase (or a 1.8% relative increase) in BMD is a clinically meaningful change. If this increase continued throughout childhood, it would likely translate to a substantial gain in bone strength.
We are concerned that the results of Winzenberg et al.?s meta‐analysis could be construed to imply calcium is not important in childhood, even though the meta‐analysis focused on the role of calcium supplementation and did not address calcium requirements. This interpretation of the results was promoted by the accompanying Editorial in the BMJ(3). It was written by a member of the Physicians Committee for Responsible Medicine, a group that promotes vegan diets devoid of dairy products. This thinking is at odds with the American Association of Clinical Endocrinologists (4), the National Institutes of Health Consensus Development Panel on Osteoporosis Prevention, Diagnosis and Therapy (5), the Institute of Medicine (6), and the Scientific Advisory Council of Osteoporosis Canada (7). These groups recommend adequate intakes of calcium and vitamin D, combined with weight bearing physical activity, throughout childhood to promote the attainment of an optimal peak bone mass. It is likely that calcium intake is a necessary but not sufficient condition for the development of a strong skeleton, as physical activity and calcium both play key roles in the attainment of a high peak bone mass (8).
Until we are absolutely certain about what the minimum and optimum combinations of calcium, vitamin D, foods from plant sources and physical activity are required to achieve a bone mass that will sustain the bones of individuals through their older ages without fragility fractures, it seems prudent to continue to follow the consensus‐based recommendations for intakes of calcium and vitamin D.
Sincerely,
Tanis R. Fenton, PhD, RD
Department of Community Health Sciences
University of Calgary
Michael Eliasziw, PhD
Department of Community Health Sciences
University of Calgary
Calgary AB, Canada
David A. Hanley, MD, FRCPC
Departments of Medicine, Oncology and Community Health Sciences Division of Endocrinology and Metabolism University of Calgary
References
1. Winzenberg T, Shaw K, Fryer J, Jones G. Effects of calcium supplementation on bone density in healthy children: meta‐analysis of randomised controlled trials. BMJ 2006; 333:775.
2. Cohen J. Statistical Power Analysis for the Behavioral Sciences. New York: Academic Press; 1977.
3. Lanou AJ. Bone health in children. BMJ 2006; 333:763‐4.
4. Hodgson SF, Watts NB, Bilezikian JP, Clarke BL, Gray TK, Harris DW et al. American Association of Clinical Endocrinologists medical guidelines for clinical practice for the prevention and treatment of postmenopausal osteoporosis: 2001 edition, with selected updates for 2003. Endocr Pract 2003; 9:544‐64.
5. Osteoporosis prevention, diagnosis, and therapy. JAMA 2001; 285:785‐95.
6. Institute of Medicine (IOM). Dietary Reference Intakes for calcium, phosphorus, magnesium, vitamin D and fluoride. The National Academies Press; 1997.
7. Brown JP, Josse RG. 2002 clinical practice guidelines for the diagnosis and management of osteoporosis in Canada. CMAJ 2002; 167:S1‐34.
8. Courteix D, Jaffre C, Lespessailles E, Benhamou L. Cumulative effects of calcium supplementation and physical activity on bone accretion in premenarchal children: a double‐blind randomised placebo‐controlled trial. Int J Sports Med 2005; 26:332‐8.
Reply
To the editor
Thank you for the opportunity to respond to the letter from your e‐mail of 5th January 2010.
Addressing the points raised in the letter:
It is valid to use SMDs. While SMDs require a greater degree of interpretation, because of the recognised variation between methods of measuring bone density we remain of the opinion that this was the most appropriate approach to use in our analysis.
We were surprised at the marked difference in results described by the letter authors in their table compared to our findings. We therefore repeated our analyses for these three outcomes using the alternative method of weighted mean differences using the inverse variance method and using a fixed effect model as there was no statistical heterogeneity for any result1. The results of these analyses are given in detail in figures 1‐3 and are entirely consistent with our original analyses using SMDs2,3. Results at the femoral neck and lumbar spine were not statistically significant (p=0.2 and 0.22 respectively) but the distal radius result was significant (p=0.01). This contrasts with the p‐values reported in the letter. Moreover, our re‐analysis gives weighted mean differences substantially less for femoral neck and lumbar spine than provided by the letter authors (6.83 and 5.73 g/cm2 compared to the results given in the letter of 11.7 and 15.2 for femoral neck and lumbar spine respectively) and somewhat less at the upper limb (5.52 g/cm2 vs. 7.0 g/cm2).
As we do not have details of the letter authors’ analysis approach, we cannot be certain of the reason for the differences between their analyses and ours. We, however, do stand by our results which are consistent regardless of whether standardised or weighted mean differences are used and which use well established methods as outlined in the Cochrane handbook of Systematic Reviews1.
The remaining issues raised in the letter relate to interpretation of our original findings. We argue in our original paper and continue to maintain that:
There are no statistically significant effects of calcium supplementation at the femoral neck or lumbar, two sites of key clinical importance.
The small persistent increase seen at the distal radius is not clinically significant in terms of reducing childhood fracture risk.
Our subgroup analyses by study duration (<24 months compared to 24 months or more) do not support additive effects on BMD occurring with increased duration of supplementation (as postulated by the letter authors).
We cannot speak for the authors of BMJ editorials accompanying the version of our review published in the BMJ. However, none of the authors of our review have any conflict of interest with our published work, including membership of the Physicians Committee for Responsible Medicine.
We agree that calcium is important for bone health. However, our data do not demonstrate improvements in BMD likely to be of clinical or public health significance from calcium supplementation even with dietary calcium intakes as low as 594 mg/day. Thus, we maintain that potential measures for improving peak bone mass besides calcium supplementation merit urgent exploration.
Yours sincerely
Dr Tania Winzenberg
Professor Graeme Jones
Ms Jayne Fryer
Dr Kelly Shaw
References
1. Higgins JPT, Green S (editors). Cochrane Handbook for Systematic Reviews of Interventions Version 5.0.2 [updated September 2009]. The Cochrane Collaboration, 2009. Available from www.cochrane‐handbook.org. Last Accessed 8th February 2010.
2. Winzenberg T, Shaw K, Fryer J, Jones G. Effects of calcium supplementation on bone density in healthy children: meta‐analysis of randomised controlled trials. Bmj. 2006 Oct 14;333:775.
3. Winzenberg TM, Shaw K, Fryer J, Jones G. Calcium supplementation for improving bone mineral density in children. The Cochrane Database of Systematic Reviews. 2006;2006:Art. No.: CD005119. DOI: 10.1002/14651858.CD005119.pub2.
Contributors
Dr Tania Winzenberg
Professor Graeme Jones
Ms Jayne Fryer
Dr Kelly Shaw
What's new
| Date | Event | Description |
|---|---|---|
| 19 February 2010 | Feedback has been incorporated | Feedback from Tanis Fenton, 05 January 2010 |
| 3 October 2008 | Amended | CMSG ID: A005‐R |
History
Protocol first published: Issue 1, 2005 Review first published: Issue 2, 2006
| Date | Event | Description |
|---|---|---|
| 3 October 2008 | Amended | Converted to new review format. |
Acknowledgements
Thank you to Louise Falzon for her assistance with the design and implementation of the search strategy for this protocol; to Lara Maxwell for co‐ordinating assistance with several parts of this review; to George Wells for statistical advice and to Guangju Zhai for assistance with translations.
Data and analyses
Comparison 1. Calcium supplementation vs placebo.
| Outcome or subgroup title | No. of studies | No. of participants | Statistical method | Effect size |
|---|---|---|---|---|
| 1 Femoral neck BMD (mg/cm2) at end supplementation (all data) | 10 | 1073 | Std. Mean Difference (IV, Fixed, 95% CI) | 0.07 [‐0.05, 0.19] |
| 2 Femoral Neck BMD (mg/cm2) at longest point after cessation of supplement (all data) | 5 | 617 | Std. Mean Difference (IV, Fixed, 95% CI) | 0.10 [‐0.06, 0.26] |
| 3 Lumbar spine BMD (mg/cm2) at end supplementation (all data) | 11 | 1164 | Std. Mean Difference (IV, Fixed, 95% CI) | 0.08 [‐0.04, 0.20] |
| 4 Lumbar Spine BMD (mg/cm2) at longest point after cessation of supplement (all data) | 5 | 617 | Std. Mean Difference (IV, Fixed, 95% CI) | 0.01 [‐0.15, 0.17] |
| 5 Total Body BMC (mg) at end supplementation (all data) | 9 | 953 | Std. Mean Difference (IV, Fixed, 95% CI) | 0.14 [0.01, 0.27] |
| 6 Distal Radius BMD (mg/cm2) at end supplementation (all data) | 9 | 1140 | Std. Mean Difference (IV, Fixed, 95% CI) | 0.15 [0.04, 0.27] |
| 7 Distal Radius BMD (mg/cm2) at longest point after cessation of supplement | 4 | 455 | Std. Mean Difference (IV, Fixed, 95% CI) | 0.21 [0.03, 0.40] |
| 8 Upper Limb BMD (mg/cm2) at end supplementation (all data) | 12 | 1579 | Std. Mean Difference (IV, Fixed, 95% CI) | 0.14 [0.04, 0.24] |
| 9 Upper Limb BMD (mg/cm2) at longest point after cessation of supplement (all data) | 6 | 840 | Std. Mean Difference (IV, Fixed, 95% CI) | 0.14 [0.01, 0.28] |
| 10 Femoral neck BMD (mg/cm2) (end trial) by baseline calcium intake | 10 | 1073 | Std. Mean Difference (IV, Fixed, 95% CI) | 0.07 [‐0.05, 0.19] |
| 10.1 Low baseline calcium | 5 | 516 | Std. Mean Difference (IV, Fixed, 95% CI) | ‐0.02 [‐0.19, 0.16] |
| 10.2 High baseline calcium | 5 | 557 | Std. Mean Difference (IV, Fixed, 95% CI) | 0.15 [‐0.02, 0.32] |
| 11 Lumbar spine BMD (mg/cm2) (end trial) by baseline calcium intake | 11 | 1164 | Std. Mean Difference (IV, Fixed, 95% CI) | 0.08 [‐0.04, 0.20] |
| 11.1 Low baseline calcium | 5 | 516 | Std. Mean Difference (IV, Fixed, 95% CI) | 0.03 [‐0.14, 0.21] |
| 11.2 High baseline calcium | 6 | 648 | Std. Mean Difference (IV, Fixed, 95% CI) | 0.12 [‐0.04, 0.28] |
| 12 Total Body BMC (mg) (end trial) by baseline calcium intake | 9 | 953 | Std. Mean Difference (IV, Fixed, 95% CI) | 0.14 [0.01, 0.27] |
| 12.1 Low baseline calcium | 4 | 265 | Std. Mean Difference (IV, Fixed, 95% CI) | 0.11 [‐0.13, 0.35] |
| 12.2 High baseline calcium | 6 | 688 | Std. Mean Difference (IV, Fixed, 95% CI) | 0.15 [0.00, 0.31] |
| 13 Distal radius BMD (mg/cm2) (end trial) by baseline calcium intake | 9 | 1140 | Std. Mean Difference (IV, Fixed, 95% CI) | 0.15 [0.04, 0.27] |
| 13.1 Low baseline calcium | 3 | 406 | Std. Mean Difference (IV, Fixed, 95% CI) | 0.26 [0.06, 0.45] |
| 13.2 High baseline calcium | 6 | 734 | Std. Mean Difference (IV, Fixed, 95% CI) | 0.10 [‐0.05, 0.24] |
| 14 Upper limb BMD (mg/cm2) (end trial) by baseline calcium intake | 12 | 1579 | Std. Mean Difference (IV, Fixed, 95% CI) | 0.14 [0.04, 0.24] |
| 14.1 Low baseline calcium | 6 | 845 | Std. Mean Difference (IV, Fixed, 95% CI) | 0.17 [0.04, 0.31] |
| 14.2 High baseline calcium | 6 | 734 | Std. Mean Difference (IV, Fixed, 95% CI) | 0.10 [‐0.05, 0.24] |
| 15 Femoral neck BMD (mg/cm2) at longest point after supplement ceased by baseline calcium intake | 5 | 617 | Std. Mean Difference (IV, Random, 95% CI) | 0.11 [‐0.07, 0.29] |
| 15.1 Low baseline calcium | 3 | 406 | Std. Mean Difference (IV, Random, 95% CI) | 0.02 [‐0.18, 0.21] |
| 15.2 High baseline calcium | 2 | 211 | Std. Mean Difference (IV, Random, 95% CI) | 0.24 [‐0.17, 0.66] |
| 16 Lumbar spine BMD (mg/cm2) at longest point after supplement ceased by baseline calcium intake | 5 | 617 | Std. Mean Difference (IV, Fixed, 95% CI) | 0.01 [‐0.15, 0.17] |
| 16.1 Low baseline calcium | 3 | 406 | Std. Mean Difference (IV, Fixed, 95% CI) | ‐0.02 [‐0.21, 0.18] |
| 16.2 High baseline calcium | 2 | 211 | Std. Mean Difference (IV, Fixed, 95% CI) | 0.06 [‐0.21, 0.33] |
| 17 Distal radius BMD (mg/cm2) at longest point after supplement ceased by baseline calcium intake | 4 | 455 | Std. Mean Difference (IV, Fixed, 95% CI) | 0.21 [0.03, 0.40] |
| 17.1 Low baseline calcium | 2 | 244 | Std. Mean Difference (IV, Fixed, 95% CI) | 0.19 [‐0.06, 0.44] |
| 17.2 High baseline calcium | 2 | 211 | Std. Mean Difference (IV, Fixed, 95% CI) | 0.24 [‐0.03, 0.51] |
| 18 Upper limb BMD (mg/cm2) at longest point after supplement ceased by baseline calcium intake | 6 | 840 | Std. Mean Difference (IV, Fixed, 95% CI) | 0.19 [0.05, 0.32] |
| 18.1 Low baseline calcium | 4 | 629 | Std. Mean Difference (IV, Fixed, 95% CI) | 0.17 [0.01, 0.32] |
| 18.2 High baseline calcium | 2 | 211 | Std. Mean Difference (IV, Fixed, 95% CI) | 0.24 [‐0.03, 0.51] |
| 19 Femoral neck BMD (mg/cm2) (at end supplementation) by sex | 10 | 1073 | Std. Mean Difference (IV, Fixed, 95% CI) | 0.07 [‐0.05, 0.19] |
| 19.1 Male | 2 | 375 | Std. Mean Difference (IV, Fixed, 95% CI) | ‐0.05 [‐0.26, 0.15] |
| 19.2 Female | 6 | 524 | Std. Mean Difference (IV, Fixed, 95% CI) | 0.19 [0.02, 0.37] |
| 19.3 Mixed | 2 | 174 | Std. Mean Difference (IV, Fixed, 95% CI) | ‐0.03 [‐0.32, 0.27] |
| 20 Lumbar spine BMD (mg/cm2) (at end supplementation) by sex | 11 | 1164 | Std. Mean Difference (IV, Fixed, 95% CI) | 0.08 [‐0.04, 0.20] |
| 20.1 Male | 2 | 375 | Std. Mean Difference (IV, Fixed, 95% CI) | 0.06 [‐0.14, 0.26] |
| 20.2 Female | 7 | 615 | Std. Mean Difference (IV, Fixed, 95% CI) | 0.11 [‐0.05, 0.27] |
| 20.3 Mixed | 2 | 174 | Std. Mean Difference (IV, Fixed, 95% CI) | 0.03 [‐0.27, 0.33] |
| 21 Total Body BMC (mg) (at end supplementation) by sex | 9 | 953 | Std. Mean Difference (IV, Fixed, 95% CI) | 0.14 [0.01, 0.27] |
| 21.1 Male | 1 | 143 | Std. Mean Difference (IV, Fixed, 95% CI) | 0.06 [‐0.27, 0.39] |
| 21.2 Female | 7 | 632 | Std. Mean Difference (IV, Fixed, 95% CI) | 0.18 [0.03, 0.34] |
| 21.3 Mixed | 1 | 178 | Std. Mean Difference (IV, Fixed, 95% CI) | 0.05 [‐0.25, 0.34] |
| 22 Distal Radius BMD (mg/cm2) (at end supplementation) by sex | 9 | 1140 | Std. Mean Difference (IV, Fixed, 95% CI) | 0.15 [0.04, 0.27] |
| 22.1 Male | 1 | 143 | Std. Mean Difference (IV, Fixed, 95% CI) | ‐0.05 [‐0.38, 0.27] |
| 22.2 Female | 4 | 501 | Std. Mean Difference (IV, Fixed, 95% CI) | 0.14 [‐0.04, 0.32] |
| 22.3 Mixed | 4 | 496 | Std. Mean Difference (IV, Fixed, 95% CI) | 0.22 [0.05, 0.40] |
| 23 Upper Limb BMD (mg/cm2) (at end supplementation) by sex | 12 | 1579 | Std. Mean Difference (IV, Fixed, 95% CI) | 0.14 [0.04, 0.24] |
| 23.1 Male | 3 | 459 | Std. Mean Difference (IV, Fixed, 95% CI) | 0.03 [‐0.15, 0.21] |
| 23.2 Female | 6 | 624 | Std. Mean Difference (IV, Fixed, 95% CI) | 0.15 [‐0.01, 0.31] |
| 23.3 Mixed | 4 | 496 | Std. Mean Difference (IV, Fixed, 95% CI) | 0.22 [0.05, 0.40] |
| 24 Femoral neck BMD (mg/cm2) at longest point after supplement ceased by sex | 5 | 617 | Std. Mean Difference (IV, Fixed, 95% CI) | 0.10 [‐0.06, 0.26] |
| 24.1 Male | 1 | 226 | Std. Mean Difference (IV, Fixed, 95% CI) | ‐0.03 [‐0.29, 0.23] |
| 24.2 Female | 2 | 221 | Std. Mean Difference (IV, Fixed, 95% CI) | 0.31 [0.04, 0.58] |
| 24.3 Mixed | 2 | 170 | Std. Mean Difference (IV, Fixed, 95% CI) | 0.01 [‐0.29, 0.31] |
| 25 Lumbar spine BMD (mg/cm2) at longest point after supplement ceased by sex | 5 | 617 | Std. Mean Difference (IV, Fixed, 95% CI) | 0.01 [‐0.15, 0.17] |
| 25.1 Male | 1 | 226 | Std. Mean Difference (IV, Fixed, 95% CI) | 0.05 [‐0.22, 0.31] |
| 25.2 Female | 2 | 221 | Std. Mean Difference (IV, Fixed, 95% CI) | 0.04 [‐0.22, 0.31] |
| 25.3 Mixed | 2 | 170 | Std. Mean Difference (IV, Fixed, 95% CI) | ‐0.07 [‐0.38, 0.23] |
| 26 Upper limb BMD (mg/cm2) at longest point after supplement ceased by sex | 6 | 840 | Std. Mean Difference (IV, Random, 95% CI) | 0.19 [0.05, 0.32] |
| 26.1 Male | 2 | 310 | Std. Mean Difference (IV, Random, 95% CI) | 0.08 [‐0.32, 0.49] |
| 26.2 Female | 2 | 200 | Std. Mean Difference (IV, Random, 95% CI) | 0.30 [0.02, 0.58] |
| 26.3 Mixed | 3 | 330 | Std. Mean Difference (IV, Random, 95% CI) | 0.16 [‐0.06, 0.37] |
| 27 Femoral neck BMD (mg/cm2) (at end supplementation) by pubertal status | 9 | 977 | Std. Mean Difference (IV, Fixed, 95% CI) | 0.07 [‐0.06, 0.19] |
| 27.1 Pre‐pubertal | 5 | 557 | Std. Mean Difference (IV, Fixed, 95% CI) | 0.07 [‐0.10, 0.24] |
| 27.2 Peri‐pubertal | 0 | 0 | Std. Mean Difference (IV, Fixed, 95% CI) | 0.0 [0.0, 0.0] |
| 27.3 Post‐pubertal | 2 | 274 | Std. Mean Difference (IV, Fixed, 95% CI) | 0.10 [‐0.14, 0.34] |
| 27.4 Mixed | 2 | 146 | Std. Mean Difference (IV, Fixed, 95% CI) | 0.00 [‐0.32, 0.33] |
| 28 Lumbar spine BMD (mg/cm2) (at end supplementation) by pubertal status | 10 | 1068 | Std. Mean Difference (IV, Fixed, 95% CI) | 0.09 [‐0.03, 0.21] |
| 28.1 Pre‐pubertal | 5 | 557 | Std. Mean Difference (IV, Fixed, 95% CI) | 0.06 [‐0.10, 0.23] |
| 28.2 Peri‐pubertal | 0 | 0 | Std. Mean Difference (IV, Fixed, 95% CI) | 0.0 [0.0, 0.0] |
| 28.3 Post‐pubertal | 2 | 274 | Std. Mean Difference (IV, Fixed, 95% CI) | 0.11 [‐0.12, 0.35] |
| 28.4 Mixed | 3 | 237 | Std. Mean Difference (IV, Fixed, 95% CI) | 0.11 [‐0.14, 0.37] |
| 29 Total body BMC (mg) (at end supplementation) by pubertal status | 8 | 853 | Std. Mean Difference (IV, Fixed, 95% CI) | 0.16 [0.02, 0.29] |
| 29.1 Pre‐pubertal | 3 | 311 | Std. Mean Difference (IV, Fixed, 95% CI) | 0.18 [‐0.05, 0.41] |
| 29.2 Peri‐pubertal | 0 | 0 | Std. Mean Difference (IV, Fixed, 95% CI) | 0.0 [0.0, 0.0] |
| 29.3 Post‐pubertal | 2 | 274 | Std. Mean Difference (IV, Fixed, 95% CI) | 0.14 [‐0.10, 0.37] |
| 29.4 Mixed | 3 | 268 | Std. Mean Difference (IV, Fixed, 95% CI) | 0.15 [‐0.09, 0.39] |
| 30 Distal radius BMD (mg/cm2) (at end supplementation) by pubertal status | 9 | 1140 | Std. Mean Difference (IV, Fixed, 95% CI) | 0.15 [0.04, 0.27] |
| 30.1 Pre‐pubertal | 4 | 439 | Std. Mean Difference (IV, Fixed, 95% CI) | 0.08 [‐0.11, 0.27] |
| 30.2 Peri‐pubertal | 1 | 177 | Std. Mean Difference (IV, Fixed, 95% CI) | 0.23 [‐0.06, 0.53] |
| 30.3 Post‐pubertal | 2 | 274 | Std. Mean Difference (IV, Fixed, 95% CI) | 0.08 [‐0.16, 0.31] |
| 30.4 Mixed | 2 | 250 | Std. Mean Difference (IV, Fixed, 95% CI) | 0.31 [0.06, 0.56] |
| 31 Upper limb BMD (mg/cm2) (at end supplementation) by pubertal status | 12 | 1579 | Std. Mean Difference (IV, Fixed, 95% CI) | 0.14 [0.04, 0.24] |
| 31.1 Pre‐pubertal | 7 | 878 | Std. Mean Difference (IV, Fixed, 95% CI) | 0.09 [‐0.05, 0.22] |
| 31.2 Peri‐pubertal | 1 | 177 | Std. Mean Difference (IV, Fixed, 95% CI) | 0.23 [‐0.06, 0.53] |
| 31.3 Post‐pubertal | 2 | 274 | Std. Mean Difference (IV, Fixed, 95% CI) | 0.08 [‐0.16, 0.31] |
| 31.4 Mixed | 2 | 250 | Std. Mean Difference (IV, Fixed, 95% CI) | 0.31 [0.06, 0.56] |
| 32 Femoral neck BMD (mg/cm2) (at end supplementation) by ethnicity | 7 | 838 | Std. Mean Difference (IV, Fixed, 95% CI) | 0.05 [‐0.09, 0.19] |
| 32.1 Caucasian | 5 | 658 | Std. Mean Difference (IV, Fixed, 95% CI) | 0.05 [‐0.10, 0.21] |
| 32.2 Chinese | 1 | 84 | Std. Mean Difference (IV, Fixed, 95% CI) | ‐0.01 [‐0.44, 0.41] |
| 32.3 Other | 1 | 96 | Std. Mean Difference (IV, Fixed, 95% CI) | 0.09 [‐0.31, 0.49] |
| 33 Lumbar spine BMD (mg/cm2) (at end supplementation) by ethnicity | 8 | 929 | Std. Mean Difference (IV, Fixed, 95% CI) | 0.08 [‐0.05, 0.21] |
| 33.1 Caucasian | 6 | 749 | Std. Mean Difference (IV, Fixed, 95% CI) | 0.09 [‐0.06, 0.24] |
| 33.2 Chinese | 1 | 84 | Std. Mean Difference (IV, Fixed, 95% CI) | 0.03 [‐0.39, 0.46] |
| 33.3 Other | 1 | 96 | Std. Mean Difference (IV, Fixed, 95% CI) | 0.0 [‐0.40, 0.40] |
| 34 Total body BMC (mg) (at end supplementation) by ethnicity | 6 | 708 | Std. Mean Difference (IV, Fixed, 95% CI) | 0.12 [‐0.03, 0.27] |
| 34.1 Caucasian | 5 | 608 | Std. Mean Difference (IV, Fixed, 95% CI) | 0.14 [‐0.02, 0.31] |
| 34.2 Other | 1 | 100 | Std. Mean Difference (IV, Fixed, 95% CI) | ‐0.00 [‐0.39, 0.39] |
| 35 Distal radius BMD (mg/cm2) (at end supplementation) by ethnicity | 8 | 1009 | Std. Mean Difference (IV, Fixed, 95% CI) | 0.15 [0.02, 0.27] |
| 35.1 Caucasian | 5 | 603 | Std. Mean Difference (IV, Fixed, 95% CI) | 0.07 [‐0.09, 0.23] |
| 35.2 Chinese | 2 | 246 | Std. Mean Difference (IV, Fixed, 95% CI) | 0.14 [‐0.11, 0.39] |
| 35.3 Other | 1 | 160 | Std. Mean Difference (IV, Fixed, 95% CI) | 0.44 [0.12, 0.75] |
| 36 Upper limb BMD (mg/cm2) (at end supplementation) by ethnicity | 10 | 1400 | Std. Mean Difference (IV, Fixed, 95% CI) | 0.13 [0.03, 0.24] |
| 36.1 Caucasian | 6 | 835 | Std. Mean Difference (IV, Fixed, 95% CI) | 0.06 [‐0.08, 0.20] |
| 36.2 Chinese | 3 | 405 | Std. Mean Difference (IV, Fixed, 95% CI) | 0.15 [‐0.04, 0.35] |
| 36.3 Other | 1 | 160 | Std. Mean Difference (IV, Fixed, 95% CI) | 0.44 [0.12, 0.75] |
| 37 Femoral neck BMD (mg/cm2) at longest point after supplementation ceased by ethnicity | 5 | 617 | Std. Mean Difference (IV, Random, 95% CI) | 0.11 [‐0.07, 0.29] |
| 37.1 Caucasian | 3 | 437 | Std. Mean Difference (IV, Random, 95% CI) | 0.13 [‐0.17, 0.44] |
| 37.2 Chinese | 1 | 84 | Std. Mean Difference (IV, Random, 95% CI) | 0.0 [‐0.43, 0.43] |
| 37.3 Other | 1 | 96 | Std. Mean Difference (IV, Random, 95% CI) | 0.14 [‐0.26, 0.54] |
| 38 Lumbar spine BMD (mg/cm2) at longest point after supplementation ceased by ethnicity | 5 | 617 | Std. Mean Difference (IV, Fixed, 95% CI) | 0.01 [‐0.15, 0.17] |
| 38.1 Caucasian | 3 | 437 | Std. Mean Difference (IV, Fixed, 95% CI) | 0.05 [‐0.13, 0.24] |
| 38.2 Chinese | 1 | 84 | Std. Mean Difference (IV, Fixed, 95% CI) | ‐0.20 [‐0.63, 0.23] |
| 38.3 Other | 1 | 96 | Std. Mean Difference (IV, Fixed, 95% CI) | 0.0 [‐0.40, 0.40] |
| 39 Distal radius BMD (mg/cm2) at longest point after supplementation ceased by ethnicity | 4 | 455 | Std. Mean Difference (IV, Fixed, 95% CI) | 0.21 [0.03, 0.40] |
| 39.1 Caucasian | 2 | 211 | Std. Mean Difference (IV, Fixed, 95% CI) | 0.24 [‐0.03, 0.51] |
| 39.2 Chinese | 1 | 84 | Std. Mean Difference (IV, Fixed, 95% CI) | ‐0.02 [‐0.45, 0.41] |
| 39.3 Other | 1 | 160 | Std. Mean Difference (IV, Fixed, 95% CI) | 0.31 [‐0.01, 0.62] |
| 40 Upper limb BMD (mg/cm2) at longest point after supplementation ceased by ethnicity | 6 | 840 | Std. Mean Difference (IV, Fixed, 95% CI) | 0.19 [0.05, 0.32] |
| 40.1 Caucasian | 3 | 437 | Std. Mean Difference (IV, Fixed, 95% CI) | 0.25 [0.06, 0.44] |
| 40.2 Chinese | 2 | 243 | Std. Mean Difference (IV, Fixed, 95% CI) | ‐0.01 [‐0.26, 0.24] |
| 40.3 Other | 1 | 160 | Std. Mean Difference (IV, Fixed, 95% CI) | 0.31 [‐0.01, 0.62] |
| 41 Femoral neck BMD (mg/cm2) (at end supplementation) by physical activity level | 2 | 216 | Std. Mean Difference (IV, Random, 95% CI) | 0.29 [‐0.24, 0.83] |
| 41.1 High | 2 | 129 | Std. Mean Difference (IV, Random, 95% CI) | 0.41 [‐0.65, 1.47] |
| 41.2 Low | 2 | 87 | Std. Mean Difference (IV, Random, 95% CI) | 0.20 [‐0.61, 1.00] |
| 42 Lumbar spine BMD (mg/cm2) (at end supplementation) by physical activity level | 2 | 216 | Std. Mean Difference (IV, Random, 95% CI) | 0.16 [‐0.34, 0.65] |
| 42.1 High | 2 | 129 | Std. Mean Difference (IV, Random, 95% CI) | 0.19 [‐0.65, 1.02] |
| 42.2 Low | 2 | 87 | Std. Mean Difference (IV, Random, 95% CI) | 0.12 [‐0.78, 1.01] |
| 43 Total body BMC (mg) (at end supplementation) by physical activity level | 4 | 463 | Std. Mean Difference (IV, Fixed, 95% CI) | 0.18 [‐0.01, 0.37] |
| 43.1 High | 4 | 254 | Std. Mean Difference (IV, Fixed, 95% CI) | 0.22 [‐0.04, 0.48] |
| 43.2 Low | 4 | 209 | Std. Mean Difference (IV, Fixed, 95% CI) | 0.13 [‐0.14, 0.41] |
| 44 Distal radius BMD (mg/cm2) (at end supplementation) by physical activity level | 2 | 216 | Std. Mean Difference (IV, Random, 95% CI) | 0.09 [‐0.32, 0.50] |
| 44.1 High | 2 | 129 | Std. Mean Difference (IV, Random, 95% CI) | ‐0.06 [‐0.43, 0.31] |
| 44.2 Low | 2 | 87 | Std. Mean Difference (IV, Random, 95% CI) | 0.22 [‐0.72, 1.16] |
| 45 Upper limb BMD (mg/cm2) (at end supplementation) by physical activity level | 2 | 216 | Std. Mean Difference (IV, Random, 95% CI) | 0.09 [‐0.32, 0.50] |
| 45.1 High | 2 | 129 | Std. Mean Difference (IV, Random, 95% CI) | ‐0.06 [‐0.43, 0.31] |
| 45.2 Low | 2 | 87 | Std. Mean Difference (IV, Random, 95% CI) | 0.22 [‐0.72, 1.16] |
| 46 Femoral neck BMD (mg/cm2) at end supplementation by calcium threshold | 10 | 1073 | Std. Mean Difference (IV, Fixed, 95% CI) | 0.07 [‐0.05, 0.19] |
| 46.1 Above | 8 | 893 | Std. Mean Difference (IV, Fixed, 95% CI) | 0.07 [‐0.06, 0.21] |
| 46.2 Below | 2 | 180 | Std. Mean Difference (IV, Fixed, 95% CI) | 0.04 [‐0.25, 0.33] |
| 47 Lumbar spine BMD (mg/cm2) at end supplementation by calcium threshold | 11 | 1164 | Std. Mean Difference (IV, Fixed, 95% CI) | 0.08 [‐0.04, 0.20] |
| 47.1 Above | 8 | 893 | Std. Mean Difference (IV, Fixed, 95% CI) | 0.08 [‐0.05, 0.21] |
| 47.2 Below | 3 | 271 | Std. Mean Difference (IV, Fixed, 95% CI) | 0.08 [‐0.16, 0.32] |
| 48 Total body BMC (mg) at end supplementation by calcium threshold | 9 | 953 | Std. Mean Difference (IV, Fixed, 95% CI) | 0.14 [0.01, 0.27] |
| 48.1 Above | 4 | 407 | Std. Mean Difference (IV, Fixed, 95% CI) | 0.21 [0.01, 0.41] |
| 48.2 Below | 5 | 546 | Std. Mean Difference (IV, Fixed, 95% CI) | 0.09 [‐0.08, 0.26] |
| 49 Distal radius BMD (mg/cm2) at end supplementation by calcium threshold | 9 | 1140 | Std. Mean Difference (IV, Fixed, 95% CI) | 0.15 [0.04, 0.27] |
| 49.1 Above | 6 | 734 | Std. Mean Difference (IV, Fixed, 95% CI) | 0.10 [‐0.05, 0.24] |
| 49.2 Below | 3 | 406 | Std. Mean Difference (IV, Fixed, 95% CI) | 0.26 [0.06, 0.45] |
| 50 Upper limb BMD (mg/cm2) at end supplementation by calcium threshold | 12 | 1579 | Std. Mean Difference (IV, Fixed, 95% CI) | 0.14 [0.04, 0.24] |
| 50.1 Above | 8 | 1014 | Std. Mean Difference (IV, Fixed, 95% CI) | 0.08 [‐0.04, 0.21] |
| 50.2 Below | 4 | 565 | Std. Mean Difference (IV, Fixed, 95% CI) | 0.23 [0.07, 0.40] |
| 51 Femoral neck BMD (mg/cm2) at longest point after supplementation ceased end by calcium threshold | 5 | 617 | Std. Mean Difference (IV, Random, 95% CI) | 0.11 [‐0.07, 0.29] |
| 51.1 Above | 3 | 437 | Std. Mean Difference (IV, Random, 95% CI) | 0.13 [‐0.17, 0.44] |
| 51.2 Below | 2 | 180 | Std. Mean Difference (IV, Random, 95% CI) | 0.08 [‐0.22, 0.37] |
| 52 Lumbar spine BMD (mg/cm2) at longest point after supplementation ceased end by calcium threshold | 5 | 617 | Std. Mean Difference (IV, Fixed, 95% CI) | 0.01 [‐0.15, 0.17] |
| 52.1 Above | 3 | 437 | Std. Mean Difference (IV, Fixed, 95% CI) | 0.05 [‐0.13, 0.24] |
| 52.2 Below | 2 | 180 | Std. Mean Difference (IV, Fixed, 95% CI) | ‐0.09 [‐0.39, 0.20] |
| 53 Distal radius BMD (mg/cm2) at longest point after supplementation ceased end by calcium threshold | 4 | 455 | Std. Mean Difference (IV, Fixed, 95% CI) | 0.21 [0.03, 0.40] |
| 53.1 Above | 2 | 211 | Std. Mean Difference (IV, Fixed, 95% CI) | 0.24 [‐0.03, 0.51] |
| 53.2 Below | 2 | 244 | Std. Mean Difference (IV, Fixed, 95% CI) | 0.19 [‐0.06, 0.44] |
| 54 Upper limb BMD (mg/cm2) at longest point after supplementation ceased end by calcium threshold | 6 | 840 | Std. Mean Difference (IV, Fixed, 95% CI) | 0.19 [0.05, 0.32] |
| 54.1 Above | 3 | 437 | Std. Mean Difference (IV, Fixed, 95% CI) | 0.25 [0.06, 0.44] |
| 54.2 Below | 3 | 403 | Std. Mean Difference (IV, Fixed, 95% CI) | 0.12 [‐0.08, 0.31] |
| 55 Femoral neck BMD (mg/cm2) at end supplementation by duration of supplementation (< 24 months vs >= 24 months) | 10 | 1073 | Std. Mean Difference (IV, Fixed, 95% CI) | 0.07 [‐0.05, 0.19] |
| 55.1 <24 months duration | 8 | 935 | Std. Mean Difference (IV, Fixed, 95% CI) | 0.08 [‐0.05, 0.21] |
| 55.2 >= 24 months duration | 2 | 138 | Std. Mean Difference (IV, Fixed, 95% CI) | ‐0.03 [‐0.36, 0.30] |
| 56 Lumbar spine BMD (mg/cm2) at end supplementation by duration of supplementation (< 24 months vs >= 24 months) | 11 | 1164 | Std. Mean Difference (IV, Fixed, 95% CI) | 0.08 [‐0.04, 0.20] |
| 56.1 <24 months duration | 8 | 935 | Std. Mean Difference (IV, Fixed, 95% CI) | 0.07 [‐0.06, 0.20] |
| 56.2 >= 24 months duration | 3 | 229 | Std. Mean Difference (IV, Fixed, 95% CI) | 0.11 [‐0.15, 0.37] |
| 57 Total body BMC (mg) at end supplementation by duration of supplementation (< 24 months vs >= 24 months) | 9 | 953 | Std. Mean Difference (IV, Fixed, 95% CI) | 0.14 [0.01, 0.27] |
| 57.1 <24 months duration | 7 | 814 | Std. Mean Difference (IV, Fixed, 95% CI) | 0.13 [‐0.01, 0.27] |
| 57.2 >= 24 months duration | 2 | 139 | Std. Mean Difference (IV, Fixed, 95% CI) | 0.22 [‐0.12, 0.55] |
| 58 Distal radius BMD (mg/cm2) at end supplementation by duration of supplementation (< 24 months vs >= 24 months) | 9 | 1140 | Std. Mean Difference (IV, Fixed, 95% CI) | 0.15 [0.04, 0.27] |
| 58.1 <24 months duration | 7 | 873 | Std. Mean Difference (IV, Fixed, 95% CI) | 0.15 [0.01, 0.28] |
| 58.2 >= 24 months duration | 2 | 267 | Std. Mean Difference (IV, Fixed, 95% CI) | 0.18 [‐0.06, 0.42] |
| 59 Upper limb BMD (mg/cm2) at end supplementation by duration of supplementation (< 24 months vs >= 24 months) | 12 | 1579 | Std. Mean Difference (IV, Fixed, 95% CI) | 0.14 [0.04, 0.24] |
| 59.1 <24 months duration | 9 | 1264 | Std. Mean Difference (IV, Fixed, 95% CI) | 0.13 [0.02, 0.24] |
| 59.2 >= 24 months duration | 3 | 315 | Std. Mean Difference (IV, Fixed, 95% CI) | 0.17 [‐0.06, 0.39] |
| 60 Femoral neck BMD (mg/cm2) at longest point after supplementation ceased end by duration of supplementation (24 | 5 | 617 | Std. Mean Difference (IV, Fixed, 95% CI) | 0.10 [‐0.06, 0.26] |
| 60.1 <24 months duration | 4 | 531 | Std. Mean Difference (IV, Fixed, 95% CI) | 0.11 [‐0.06, 0.28] |
| 60.2 >= 24 months duration | 1 | 86 | Std. Mean Difference (IV, Fixed, 95% CI) | 0.01 [‐0.41, 0.44] |
| 61 Lumbar spine BMD (mg/cm2) at longest point after supplementation ceased end by duration of supplementation (24 | 5 | 617 | Std. Mean Difference (IV, Fixed, 95% CI) | 0.01 [‐0.15, 0.17] |
| 61.1 <24 months duration | 4 | 531 | Std. Mean Difference (IV, Fixed, 95% CI) | 0.01 [‐0.16, 0.18] |
| 61.2 >= 24 months duration | 1 | 86 | Std. Mean Difference (IV, Fixed, 95% CI) | 0.05 [‐0.38, 0.47] |
| 62 Distal radius BMD (mg/cm2) at longest point after supplementation ceased end by duration of supplementation (2 | 4 | 455 | Std. Mean Difference (IV, Fixed, 95% CI) | 0.21 [0.03, 0.40] |
| 62.1 <24 months duration | 3 | 369 | Std. Mean Difference (IV, Fixed, 95% CI) | 0.25 [0.05, 0.46] |
| 62.2 >= 24 months duration | 1 | 86 | Std. Mean Difference (IV, Fixed, 95% CI) | 0.05 [‐0.37, 0.47] |
| 63 Upper limb BMD (mg/cm2) at longest point after supplementation ceased end by duration of supplementation (24) | 6 | 840 | Std. Mean Difference (IV, Fixed, 95% CI) | 0.19 [0.05, 0.32] |
| 63.1 <24 months duration | 5 | 754 | Std. Mean Difference (IV, Fixed, 95% CI) | 0.20 [0.06, 0.34] |
| 63.2 >= 24 months duration | 1 | 86 | Std. Mean Difference (IV, Fixed, 95% CI) | 0.05 [‐0.37, 0.47] |
| 64 Femoral neck BMD (mg/cm2) at end supplementation by duration of supplementation (< 18months vs >= 18months) | 10 | 1073 | Std. Mean Difference (IV, Fixed, 95% CI) | 0.07 [‐0.05, 0.19] |
| 64.1 <18months duration | 6 | 795 | Std. Mean Difference (IV, Fixed, 95% CI) | 0.10 [‐0.05, 0.24] |
| 64.2 >= 18 months duration | 4 | 278 | Std. Mean Difference (IV, Fixed, 95% CI) | ‐0.01 [‐0.24, 0.23] |
| 65 Lumbar spine BMD (mg/cm2) at end supplementation by duration of supplementation (< 18months vs >= 18months) | 11 | 1164 | Std. Mean Difference (IV, Fixed, 95% CI) | 0.08 [‐0.04, 0.20] |
| 65.1 <18months duration | 6 | 795 | Std. Mean Difference (IV, Fixed, 95% CI) | 0.08 [‐0.07, 0.22] |
| 65.2 >= 18 months duration | 5 | 369 | Std. Mean Difference (IV, Fixed, 95% CI) | 0.09 [‐0.11, 0.30] |
| 66 Total body BMC (mg) at end supplementation by duration of supplementation (< 18months vs >= 18months) | 9 | 953 | Std. Mean Difference (IV, Fixed, 95% CI) | 0.14 [0.01, 0.27] |
| 66.1 <18months duration | 7 | 814 | Std. Mean Difference (IV, Fixed, 95% CI) | 0.13 [‐0.01, 0.27] |
| 66.2 >= 18 months duration | 2 | 139 | Std. Mean Difference (IV, Fixed, 95% CI) | 0.22 [‐0.12, 0.55] |
| 67 Distal radius BMD (mg/cm2) at end supplementation by duration of supplementation (< 18months vs >= 18months) | 9 | 1140 | Std. Mean Difference (IV, Fixed, 95% CI) | 0.15 [0.04, 0.27] |
| 67.1 <18 months duration | 5 | 627 | Std. Mean Difference (IV, Fixed, 95% CI) | 0.15 [‐0.01, 0.31] |
| 67.2 >= 18 months duration | 4 | 513 | Std. Mean Difference (IV, Fixed, 95% CI) | 0.16 [‐0.01, 0.34] |
| 68 Upper limb BMD (mg/cm2) at end supplementation by duration of supplementation (< 18months vs >= 18months) | 12 | 1579 | Std. Mean Difference (IV, Fixed, 95% CI) | 0.14 [0.04, 0.24] |
| 68.1 <18 months duration | 6 | 859 | Std. Mean Difference (IV, Fixed, 95% CI) | 0.12 [‐0.02, 0.26] |
| 68.2 >= 18 months duration | 6 | 720 | Std. Mean Difference (IV, Fixed, 95% CI) | 0.16 [0.01, 0.30] |
| 69 Femoral neck BMD (mg/cm2) at longest point after cessation of supplementation by duration of supplementation | 5 | 617 | Std. Mean Difference (IV, Random, 95% CI) | 0.11 [‐0.07, 0.29] |
| 69.1 <18 months duration | 3 | 447 | Std. Mean Difference (IV, Random, 95% CI) | 0.17 [‐0.12, 0.46] |
| 69.2 >= 18 months duration | 2 | 170 | Std. Mean Difference (IV, Random, 95% CI) | 0.01 [‐0.29, 0.31] |
| 70 Lumbar spine BMD (mg/cm2) at longest point after cessation of supplementation by duration of supplementation | 5 | 617 | Std. Mean Difference (IV, Fixed, 95% CI) | 0.01 [‐0.15, 0.17] |
| 70.1 <18 months duration | 3 | 447 | Std. Mean Difference (IV, Fixed, 95% CI) | 0.04 [‐0.14, 0.23] |
| 70.2 >= 18 months duration | 2 | 170 | Std. Mean Difference (IV, Fixed, 95% CI) | ‐0.07 [‐0.38, 0.23] |
| 71 Distal radius BMD (mg/cm2) at longest point after cessation of supplementation by duration of supplementation | 4 | 455 | Std. Mean Difference (IV, Fixed, 95% CI) | 0.21 [0.03, 0.40] |
| 71.1 <18 months duration | 2 | 285 | Std. Mean Difference (IV, Fixed, 95% CI) | 0.33 [0.10, 0.57] |
| 71.2 >= 18 months duration | 2 | 170 | Std. Mean Difference (IV, Fixed, 95% CI) | 0.02 [‐0.29, 0.32] |
| 72 Upper limb BMD (mg/cm2) at longest point after cessation of supplementation by duration of supplementation | 6 | 840 | Std. Mean Difference (IV, Fixed, 95% CI) | 0.19 [0.05, 0.32] |
| 72.1 <18 months duration | 3 | 511 | Std. Mean Difference (IV, Fixed, 95% CI) | 0.30 [0.13, 0.48] |
| 72.2 >= 18 months duration | 3 | 329 | Std. Mean Difference (IV, Fixed, 95% CI) | 0.01 [‐0.21, 0.22] |
| 73 Femoral neck BMD (mg/cm2) at end supplementation by milk extract vs other calcium supplement | 10 | 1073 | Std. Mean Difference (IV, Random, 95% CI) | 0.07 [‐0.05, 0.19] |
| 73.1 milk extract | 3 | 425 | Std. Mean Difference (IV, Random, 95% CI) | 0.15 [‐0.16, 0.46] |
| 73.2 other calcium supplementation | 7 | 648 | Std. Mean Difference (IV, Random, 95% CI) | 0.05 [‐0.10, 0.21] |
| 74 Lumbar spine BMD (mg/cm2) at end supplementation by milk extract vs other calcium supplement | 11 | 1164 | Std. Mean Difference (IV, Fixed, 95% CI) | 0.08 [‐0.04, 0.20] |
| 74.1 milk extract | 3 | 425 | Std. Mean Difference (IV, Fixed, 95% CI) | 0.07 [‐0.13, 0.26] |
| 74.2 other calcium supplementation | 8 | 739 | Std. Mean Difference (IV, Fixed, 95% CI) | 0.09 [‐0.06, 0.23] |
| 75 Upper limb BMD (mg/cm2) at end supplementation by milk extract vs other calcium supplement | 12 | 1579 | Std. Mean Difference (IV, Fixed, 95% CI) | 0.14 [0.04, 0.24] |
| 75.1 milk extract | 3 | 425 | Std. Mean Difference (IV, Fixed, 95% CI) | 0.03 [‐0.17, 0.22] |
| 75.2 other calcium supplementation | 9 | 1154 | Std. Mean Difference (IV, Fixed, 95% CI) | 0.18 [0.06, 0.29] |
| 76 Femoral neck BMD (mg/cm2) after supplementation ceased by milk extract vs other calcium supplement | 5 | 617 | Std. Mean Difference (IV, Random, 95% CI) | 0.11 [‐0.07, 0.29] |
| 76.1 milk extract | 2 | 351 | Std. Mean Difference (IV, Random, 95% CI) | 0.19 [‐0.28, 0.65] |
| 76.2 other calcium supplementation | 3 | 266 | Std. Mean Difference (IV, Random, 95% CI) | 0.06 [‐0.18, 0.30] |
| 77 Lumbar spine BMD (mg/cm2) after supplementation ceased by milk extract vs other calcium supplement | 5 | 617 | Std. Mean Difference (IV, Fixed, 95% CI) | 0.01 [‐0.15, 0.17] |
| 77.1 milk extract | 2 | 351 | Std. Mean Difference (IV, Fixed, 95% CI) | 0.06 [‐0.15, 0.27] |
| 77.2 other calcium supplementation | 3 | 266 | Std. Mean Difference (IV, Fixed, 95% CI) | ‐0.05 [‐0.29, 0.19] |
| 78 Upper limb BMD (mg/cm2) after supplementation ceased by milk extract vs other calcium supplement | 6 | 840 | Std. Mean Difference (IV, Fixed, 95% CI) | 0.14 [0.01, 0.28] |
| 78.1 milk extract | 2 | 351 | Std. Mean Difference (IV, Fixed, 95% CI) | 0.20 [‐0.01, 0.41] |
| 78.2 other calcium supplementation | 4 | 489 | Std. Mean Difference (IV, Fixed, 95% CI) | 0.10 [‐0.07, 0.28] |
| 79 Upper limb BMD (mg/cm2) by calcium intake (lowest quartile vs above lowest quartile) | 12 | 1579 | Std. Mean Difference (IV, Fixed, 95% CI) | 0.14 [0.04, 0.24] |
| 79.1 Lowest quartile | 4 | 565 | Std. Mean Difference (IV, Fixed, 95% CI) | 0.23 [0.07, 0.40] |
| 79.2 Above lowest quartile | 8 | 1014 | Std. Mean Difference (IV, Fixed, 95% CI) | 0.08 [‐0.04, 0.21] |
1.1. Analysis.
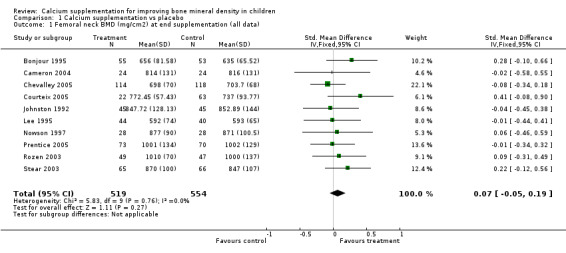
Comparison 1 Calcium supplementation vs placebo, Outcome 1 Femoral neck BMD (mg/cm2) at end supplementation (all data).
1.2. Analysis.
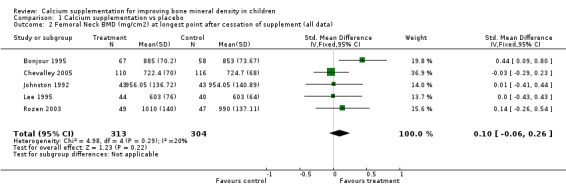
Comparison 1 Calcium supplementation vs placebo, Outcome 2 Femoral Neck BMD (mg/cm2) at longest point after cessation of supplement (all data).
1.3. Analysis.

Comparison 1 Calcium supplementation vs placebo, Outcome 3 Lumbar spine BMD (mg/cm2) at end supplementation (all data).
1.4. Analysis.

Comparison 1 Calcium supplementation vs placebo, Outcome 4 Lumbar Spine BMD (mg/cm2) at longest point after cessation of supplement (all data).
1.5. Analysis.

Comparison 1 Calcium supplementation vs placebo, Outcome 5 Total Body BMC (mg) at end supplementation (all data).
1.6. Analysis.

Comparison 1 Calcium supplementation vs placebo, Outcome 6 Distal Radius BMD (mg/cm2) at end supplementation (all data).
1.7. Analysis.
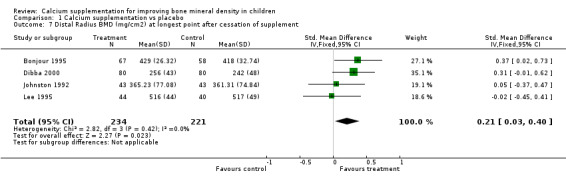
Comparison 1 Calcium supplementation vs placebo, Outcome 7 Distal Radius BMD (mg/cm2) at longest point after cessation of supplement.
1.8. Analysis.

Comparison 1 Calcium supplementation vs placebo, Outcome 8 Upper Limb BMD (mg/cm2) at end supplementation (all data).
1.9. Analysis.

Comparison 1 Calcium supplementation vs placebo, Outcome 9 Upper Limb BMD (mg/cm2) at longest point after cessation of supplement (all data).
1.10. Analysis.
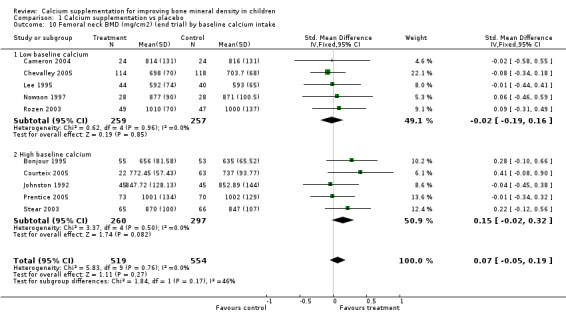
Comparison 1 Calcium supplementation vs placebo, Outcome 10 Femoral neck BMD (mg/cm2) (end trial) by baseline calcium intake.
1.11. Analysis.

Comparison 1 Calcium supplementation vs placebo, Outcome 11 Lumbar spine BMD (mg/cm2) (end trial) by baseline calcium intake.
1.12. Analysis.
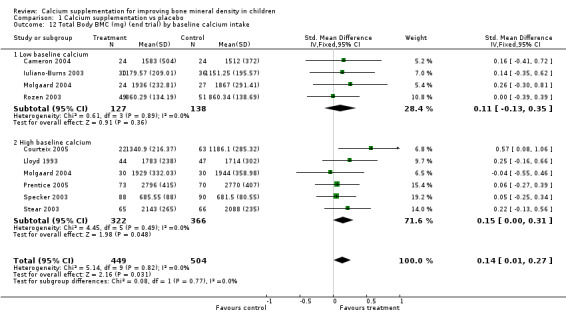
Comparison 1 Calcium supplementation vs placebo, Outcome 12 Total Body BMC (mg) (end trial) by baseline calcium intake.
1.13. Analysis.

Comparison 1 Calcium supplementation vs placebo, Outcome 13 Distal radius BMD (mg/cm2) (end trial) by baseline calcium intake.
1.14. Analysis.
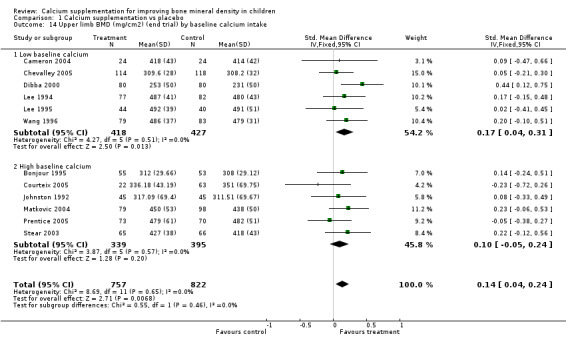
Comparison 1 Calcium supplementation vs placebo, Outcome 14 Upper limb BMD (mg/cm2) (end trial) by baseline calcium intake.
1.15. Analysis.

Comparison 1 Calcium supplementation vs placebo, Outcome 15 Femoral neck BMD (mg/cm2) at longest point after supplement ceased by baseline calcium intake.
1.16. Analysis.
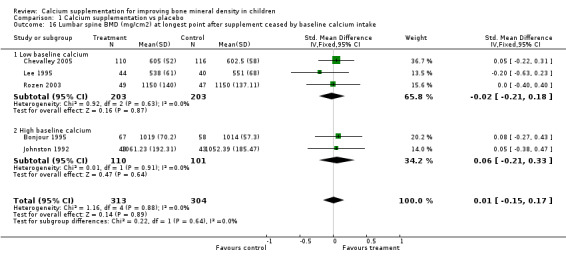
Comparison 1 Calcium supplementation vs placebo, Outcome 16 Lumbar spine BMD (mg/cm2) at longest point after supplement ceased by baseline calcium intake.
1.17. Analysis.

Comparison 1 Calcium supplementation vs placebo, Outcome 17 Distal radius BMD (mg/cm2) at longest point after supplement ceased by baseline calcium intake.
1.18. Analysis.
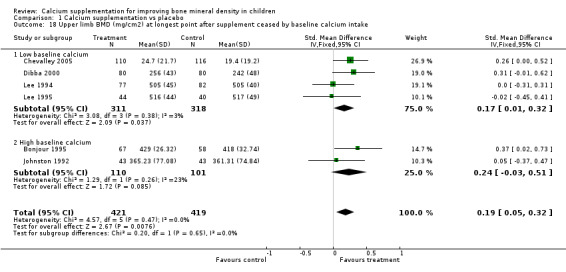
Comparison 1 Calcium supplementation vs placebo, Outcome 18 Upper limb BMD (mg/cm2) at longest point after supplement ceased by baseline calcium intake.
1.19. Analysis.
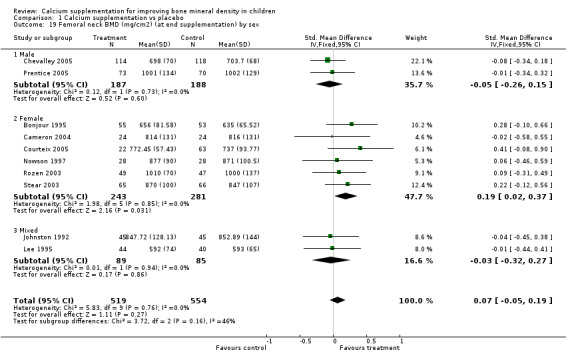
Comparison 1 Calcium supplementation vs placebo, Outcome 19 Femoral neck BMD (mg/cm2) (at end supplementation) by sex.
1.20. Analysis.
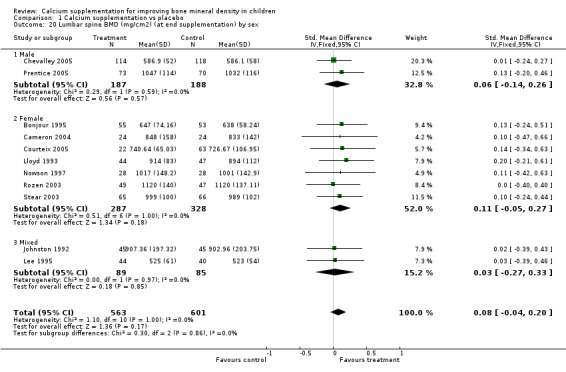
Comparison 1 Calcium supplementation vs placebo, Outcome 20 Lumbar spine BMD (mg/cm2) (at end supplementation) by sex.
1.21. Analysis.

Comparison 1 Calcium supplementation vs placebo, Outcome 21 Total Body BMC (mg) (at end supplementation) by sex.
1.22. Analysis.
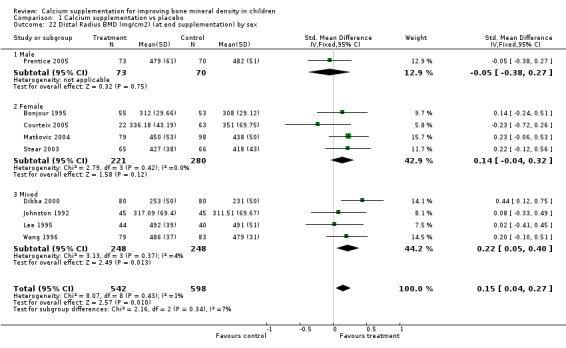
Comparison 1 Calcium supplementation vs placebo, Outcome 22 Distal Radius BMD (mg/cm2) (at end supplementation) by sex.
1.23. Analysis.
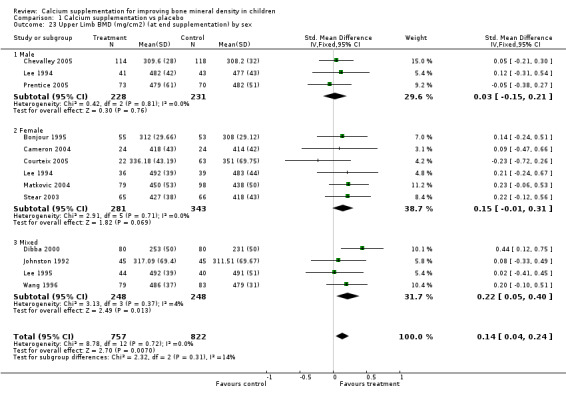
Comparison 1 Calcium supplementation vs placebo, Outcome 23 Upper Limb BMD (mg/cm2) (at end supplementation) by sex.
1.24. Analysis.

Comparison 1 Calcium supplementation vs placebo, Outcome 24 Femoral neck BMD (mg/cm2) at longest point after supplement ceased by sex.
1.25. Analysis.

Comparison 1 Calcium supplementation vs placebo, Outcome 25 Lumbar spine BMD (mg/cm2) at longest point after supplement ceased by sex.
1.26. Analysis.
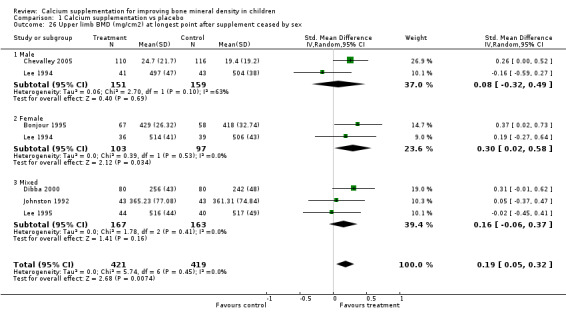
Comparison 1 Calcium supplementation vs placebo, Outcome 26 Upper limb BMD (mg/cm2) at longest point after supplement ceased by sex.
1.27. Analysis.

Comparison 1 Calcium supplementation vs placebo, Outcome 27 Femoral neck BMD (mg/cm2) (at end supplementation) by pubertal status.
1.28. Analysis.

Comparison 1 Calcium supplementation vs placebo, Outcome 28 Lumbar spine BMD (mg/cm2) (at end supplementation) by pubertal status.
1.29. Analysis.

Comparison 1 Calcium supplementation vs placebo, Outcome 29 Total body BMC (mg) (at end supplementation) by pubertal status.
1.30. Analysis.
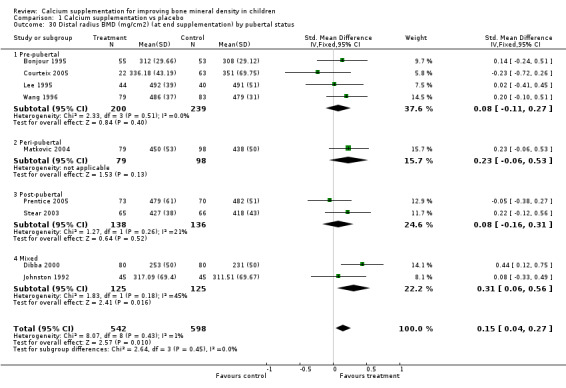
Comparison 1 Calcium supplementation vs placebo, Outcome 30 Distal radius BMD (mg/cm2) (at end supplementation) by pubertal status.
1.31. Analysis.

Comparison 1 Calcium supplementation vs placebo, Outcome 31 Upper limb BMD (mg/cm2) (at end supplementation) by pubertal status.
1.32. Analysis.

Comparison 1 Calcium supplementation vs placebo, Outcome 32 Femoral neck BMD (mg/cm2) (at end supplementation) by ethnicity.
1.33. Analysis.
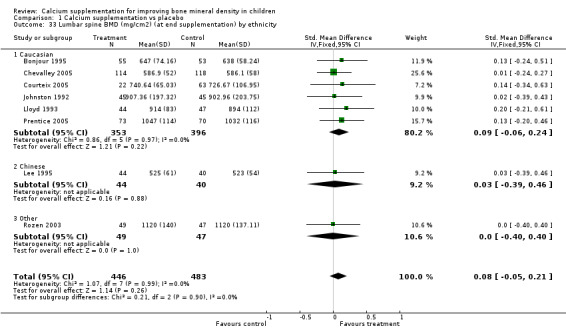
Comparison 1 Calcium supplementation vs placebo, Outcome 33 Lumbar spine BMD (mg/cm2) (at end supplementation) by ethnicity.
1.34. Analysis.
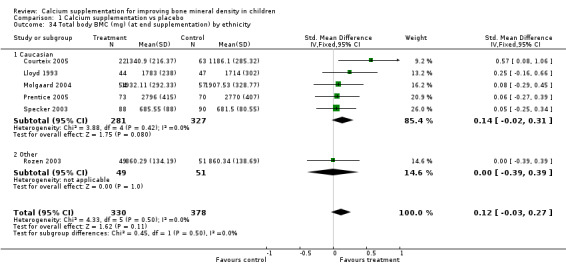
Comparison 1 Calcium supplementation vs placebo, Outcome 34 Total body BMC (mg) (at end supplementation) by ethnicity.
1.35. Analysis.

Comparison 1 Calcium supplementation vs placebo, Outcome 35 Distal radius BMD (mg/cm2) (at end supplementation) by ethnicity.
1.36. Analysis.
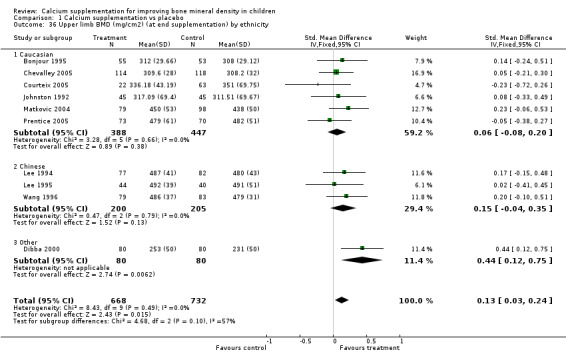
Comparison 1 Calcium supplementation vs placebo, Outcome 36 Upper limb BMD (mg/cm2) (at end supplementation) by ethnicity.
1.37. Analysis.

Comparison 1 Calcium supplementation vs placebo, Outcome 37 Femoral neck BMD (mg/cm2) at longest point after supplementation ceased by ethnicity.
1.38. Analysis.

Comparison 1 Calcium supplementation vs placebo, Outcome 38 Lumbar spine BMD (mg/cm2) at longest point after supplementation ceased by ethnicity.
1.39. Analysis.
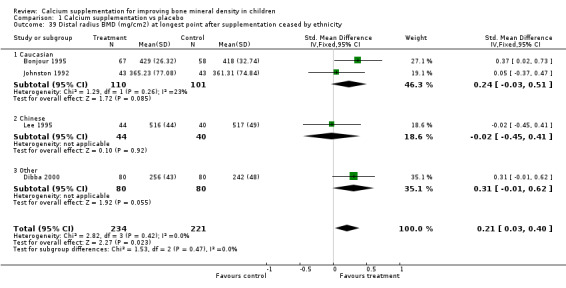
Comparison 1 Calcium supplementation vs placebo, Outcome 39 Distal radius BMD (mg/cm2) at longest point after supplementation ceased by ethnicity.
1.40. Analysis.
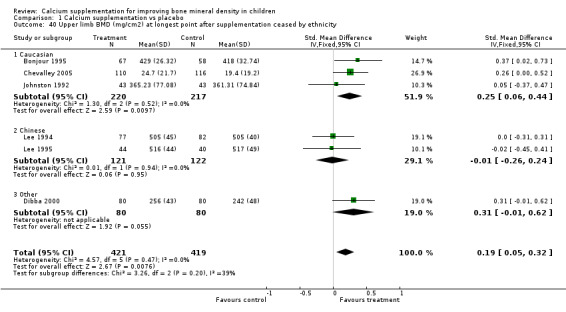
Comparison 1 Calcium supplementation vs placebo, Outcome 40 Upper limb BMD (mg/cm2) at longest point after supplementation ceased by ethnicity.
1.41. Analysis.
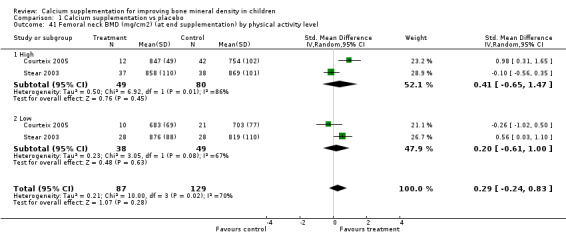
Comparison 1 Calcium supplementation vs placebo, Outcome 41 Femoral neck BMD (mg/cm2) (at end supplementation) by physical activity level.
1.42. Analysis.
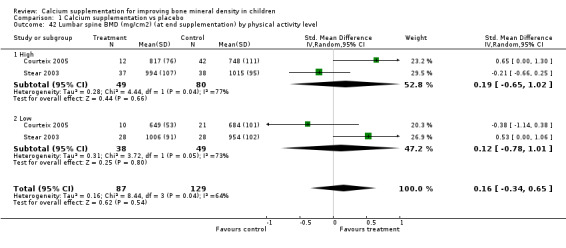
Comparison 1 Calcium supplementation vs placebo, Outcome 42 Lumbar spine BMD (mg/cm2) (at end supplementation) by physical activity level.
1.43. Analysis.

Comparison 1 Calcium supplementation vs placebo, Outcome 43 Total body BMC (mg) (at end supplementation) by physical activity level.
1.44. Analysis.

Comparison 1 Calcium supplementation vs placebo, Outcome 44 Distal radius BMD (mg/cm2) (at end supplementation) by physical activity level.
1.45. Analysis.
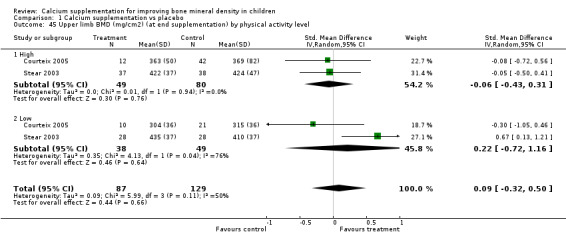
Comparison 1 Calcium supplementation vs placebo, Outcome 45 Upper limb BMD (mg/cm2) (at end supplementation) by physical activity level.
1.46. Analysis.
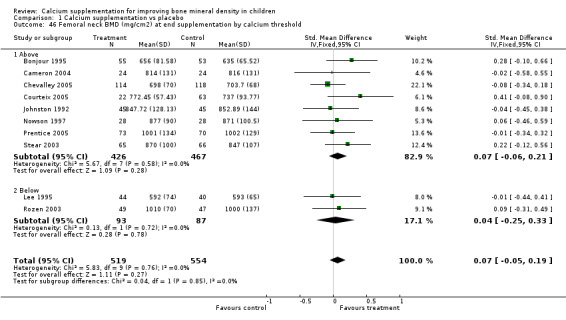
Comparison 1 Calcium supplementation vs placebo, Outcome 46 Femoral neck BMD (mg/cm2) at end supplementation by calcium threshold.
1.47. Analysis.

Comparison 1 Calcium supplementation vs placebo, Outcome 47 Lumbar spine BMD (mg/cm2) at end supplementation by calcium threshold.
1.48. Analysis.
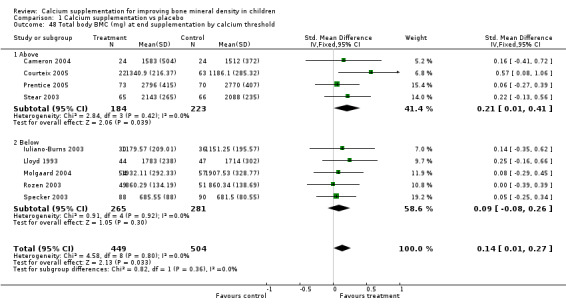
Comparison 1 Calcium supplementation vs placebo, Outcome 48 Total body BMC (mg) at end supplementation by calcium threshold.
1.49. Analysis.

Comparison 1 Calcium supplementation vs placebo, Outcome 49 Distal radius BMD (mg/cm2) at end supplementation by calcium threshold.
1.50. Analysis.
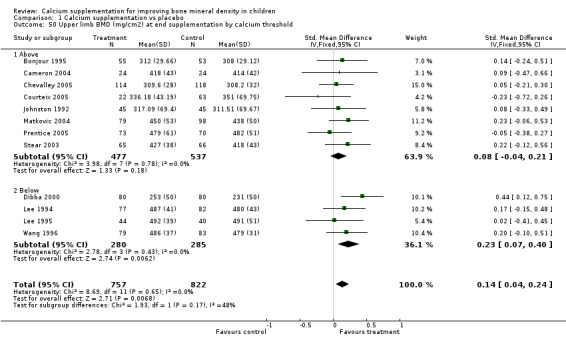
Comparison 1 Calcium supplementation vs placebo, Outcome 50 Upper limb BMD (mg/cm2) at end supplementation by calcium threshold.
1.51. Analysis.

Comparison 1 Calcium supplementation vs placebo, Outcome 51 Femoral neck BMD (mg/cm2) at longest point after supplementation ceased end by calcium threshold.
1.52. Analysis.
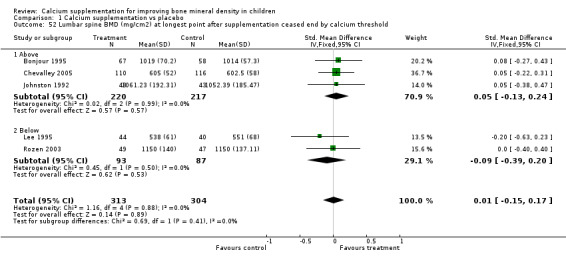
Comparison 1 Calcium supplementation vs placebo, Outcome 52 Lumbar spine BMD (mg/cm2) at longest point after supplementation ceased end by calcium threshold.
1.53. Analysis.
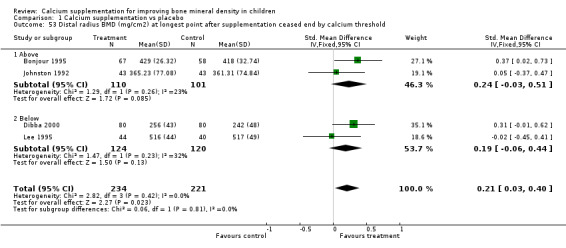
Comparison 1 Calcium supplementation vs placebo, Outcome 53 Distal radius BMD (mg/cm2) at longest point after supplementation ceased end by calcium threshold.
1.54. Analysis.

Comparison 1 Calcium supplementation vs placebo, Outcome 54 Upper limb BMD (mg/cm2) at longest point after supplementation ceased end by calcium threshold.
1.55. Analysis.

Comparison 1 Calcium supplementation vs placebo, Outcome 55 Femoral neck BMD (mg/cm2) at end supplementation by duration of supplementation (< 24 months vs >= 24 months).
1.56. Analysis.
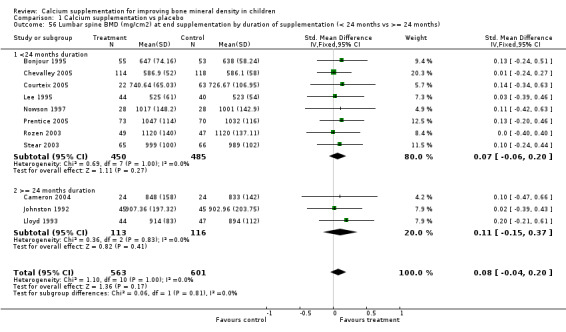
Comparison 1 Calcium supplementation vs placebo, Outcome 56 Lumbar spine BMD (mg/cm2) at end supplementation by duration of supplementation (< 24 months vs >= 24 months).
1.57. Analysis.
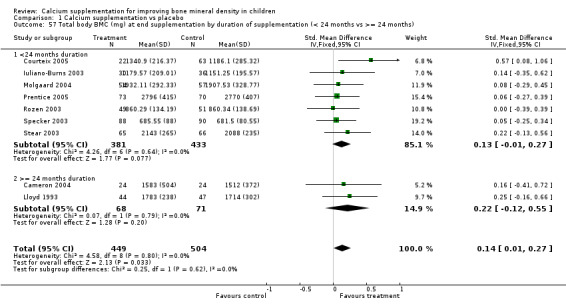
Comparison 1 Calcium supplementation vs placebo, Outcome 57 Total body BMC (mg) at end supplementation by duration of supplementation (< 24 months vs >= 24 months).
1.58. Analysis.

Comparison 1 Calcium supplementation vs placebo, Outcome 58 Distal radius BMD (mg/cm2) at end supplementation by duration of supplementation (< 24 months vs >= 24 months).
1.59. Analysis.

Comparison 1 Calcium supplementation vs placebo, Outcome 59 Upper limb BMD (mg/cm2) at end supplementation by duration of supplementation (< 24 months vs >= 24 months).
1.60. Analysis.

Comparison 1 Calcium supplementation vs placebo, Outcome 60 Femoral neck BMD (mg/cm2) at longest point after supplementation ceased end by duration of supplementation (24.
1.61. Analysis.

Comparison 1 Calcium supplementation vs placebo, Outcome 61 Lumbar spine BMD (mg/cm2) at longest point after supplementation ceased end by duration of supplementation (24.
1.62. Analysis.
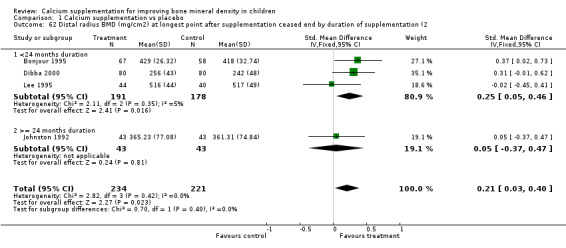
Comparison 1 Calcium supplementation vs placebo, Outcome 62 Distal radius BMD (mg/cm2) at longest point after supplementation ceased end by duration of supplementation (2.
1.63. Analysis.

Comparison 1 Calcium supplementation vs placebo, Outcome 63 Upper limb BMD (mg/cm2) at longest point after supplementation ceased end by duration of supplementation (24).
1.64. Analysis.

Comparison 1 Calcium supplementation vs placebo, Outcome 64 Femoral neck BMD (mg/cm2) at end supplementation by duration of supplementation (< 18months vs >= 18months).
1.65. Analysis.
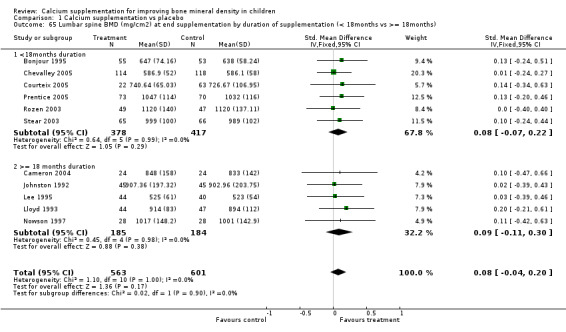
Comparison 1 Calcium supplementation vs placebo, Outcome 65 Lumbar spine BMD (mg/cm2) at end supplementation by duration of supplementation (< 18months vs >= 18months).
1.66. Analysis.

Comparison 1 Calcium supplementation vs placebo, Outcome 66 Total body BMC (mg) at end supplementation by duration of supplementation (< 18months vs >= 18months).
1.67. Analysis.

Comparison 1 Calcium supplementation vs placebo, Outcome 67 Distal radius BMD (mg/cm2) at end supplementation by duration of supplementation (< 18months vs >= 18months).
1.68. Analysis.
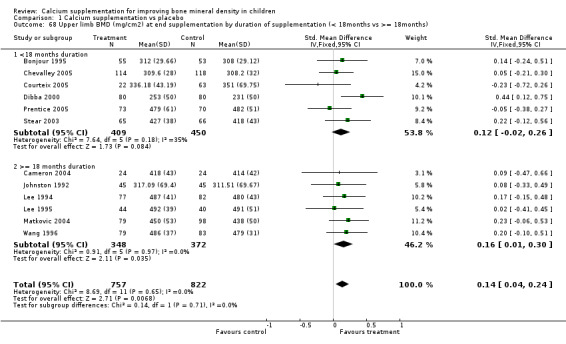
Comparison 1 Calcium supplementation vs placebo, Outcome 68 Upper limb BMD (mg/cm2) at end supplementation by duration of supplementation (< 18months vs >= 18months).
1.69. Analysis.

Comparison 1 Calcium supplementation vs placebo, Outcome 69 Femoral neck BMD (mg/cm2) at longest point after cessation of supplementation by duration of supplementation.
1.70. Analysis.
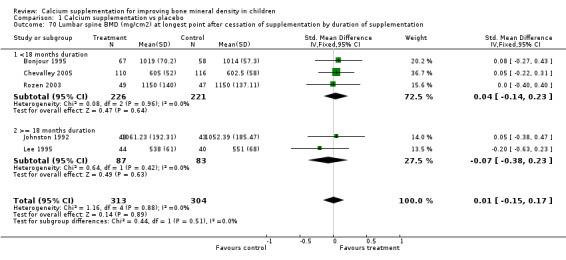
Comparison 1 Calcium supplementation vs placebo, Outcome 70 Lumbar spine BMD (mg/cm2) at longest point after cessation of supplementation by duration of supplementation.
1.71. Analysis.
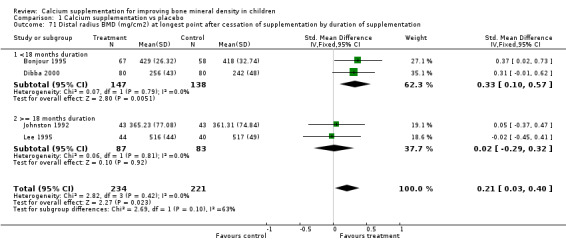
Comparison 1 Calcium supplementation vs placebo, Outcome 71 Distal radius BMD (mg/cm2) at longest point after cessation of supplementation by duration of supplementation.
1.72. Analysis.

Comparison 1 Calcium supplementation vs placebo, Outcome 72 Upper limb BMD (mg/cm2) at longest point after cessation of supplementation by duration of supplementation.
1.73. Analysis.
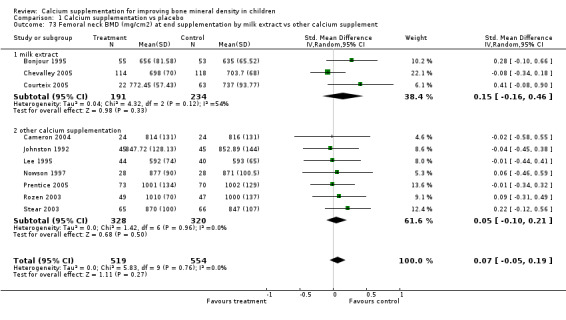
Comparison 1 Calcium supplementation vs placebo, Outcome 73 Femoral neck BMD (mg/cm2) at end supplementation by milk extract vs other calcium supplement.
1.74. Analysis.
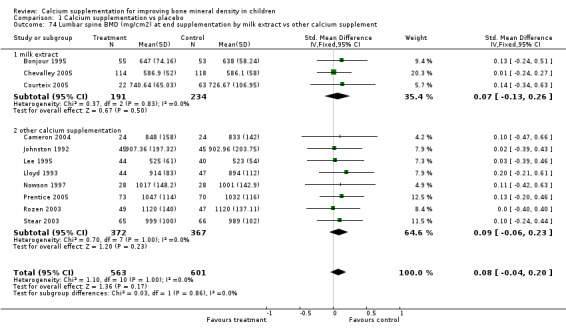
Comparison 1 Calcium supplementation vs placebo, Outcome 74 Lumbar spine BMD (mg/cm2) at end supplementation by milk extract vs other calcium supplement.
1.75. Analysis.
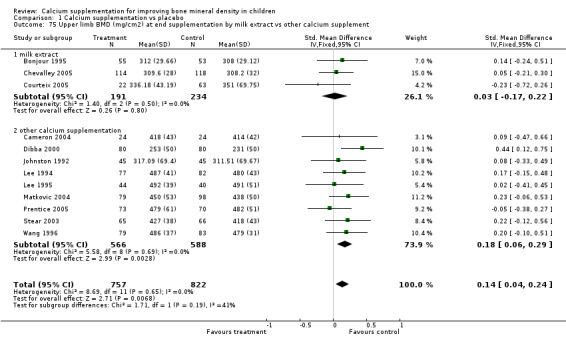
Comparison 1 Calcium supplementation vs placebo, Outcome 75 Upper limb BMD (mg/cm2) at end supplementation by milk extract vs other calcium supplement.
1.76. Analysis.

Comparison 1 Calcium supplementation vs placebo, Outcome 76 Femoral neck BMD (mg/cm2) after supplementation ceased by milk extract vs other calcium supplement.
1.77. Analysis.
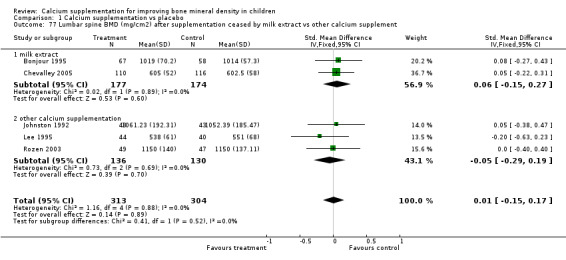
Comparison 1 Calcium supplementation vs placebo, Outcome 77 Lumbar spine BMD (mg/cm2) after supplementation ceased by milk extract vs other calcium supplement.
1.78. Analysis.

Comparison 1 Calcium supplementation vs placebo, Outcome 78 Upper limb BMD (mg/cm2) after supplementation ceased by milk extract vs other calcium supplement.
1.79. Analysis.

Comparison 1 Calcium supplementation vs placebo, Outcome 79 Upper limb BMD (mg/cm2) by calcium intake (lowest quartile vs above lowest quartile).
Characteristics of studies
Characteristics of included studies [ordered by study ID]
Bonjour 1995.
| Methods | STUDY DESIGN: randomised controlled trial
LOCATION AND SETTING: Community (Youth Health Service), Switzerland
DURATION OF SUPPLEMENTATION: 1 year
DURATION OF FOLLOW‐UP: 8 years
QUALITY ASSESSMENT: Moderate risk of bias
RANDOMISED: States random but no description
ALLOCATION CONCEALMENT: Yes
BLINDING OF SUBJECT: Yes
DESCRIPTION OF WITHDRAWALS/DROPOUTS: Yes TYPE OF ANALYSIS: Available data and treatment received COMPLIANCE: Assessed CONFOUNDERS MEASURED: pubertal status, spontaneous calcium intake |
|
| Participants | N SCREENED: unknown N RANDOMISED: 149 N COMPLETED: 144 (1 year); 122 (8 years) M=0% F=100% ETHNICITY: CAUCASIAN MEAN BASELINE AGE (yrs): 7.93 BASELINE AGE RANGE (yrs): 6.6‐9.4 INCLUSION CRITERIA: healthy prepubertal, Caucasian females EXCLUSION CRITERIA: no parental approval, ratio weight/height < 3rd or > 97th percentile according to Geneva reference values, presence of physical signs of puberty, chronic disease, gastro‐intestinal disease capable of inducing malabsorption, congenital or acquired bone disease, regular use of medication. BASELINE CALCIUM INTAKE (mg/day): 752 PUBERTAL STATUS: prepubertal | |
| Interventions | 1. Foods supplemented by milk extract (850 mg Calcium per day) 2. Unsupplemented foods CO‐INTERVENTIONS: Nil | |
| Outcomes | BONE MEASURES: SITES AREAL BONE MINERAL DENSITY: distal radial metaphysis, diaphysis of radius, femoral neck, femoral trochanter, femoral diaphysis and L2‐4 vertebrae. BONE MINERAL CONTENT: distal radial metaphysis, diaphysis of radius, femoral neck, femoral trochanter, femoral diaphysis and L2‐4 vertebrae. BONE AREA: distal radial metaphysis, diaphysis of radius, femoral neck, femoral trochanter, femoral diaphysis and L2‐4 vertebrae. METHOD OF MEASUREMENT: DXA FOLLOW‐UP ASSESSMENT POINTS(yrs): 0, 1, 2, 4.5, 8.5 OTHER OUTCOMES MEASURED: weight, height BONE MEASURES INCLUDED IN STUDY ANALYSES: AREAL BONE MINERAL DENSITY: distal radial metaphysis, diaphysis of radius, femoral neck, femoral trochanter, femoral diaphysis and L2‐4 vertebrae, mean of the 6 sites. . BONE MINERAL CONTENT: L2‐4 vertebrae, mean of all 6 sites BONE AREA: femoral diaphysis and L2‐4 vertebrae, mean of the 6 sites. SUB‐GROUPS IDENTIFIED: Spontaneous calcium intake (defined by median); early vs late menarcheal age | |
| Notes | ||
| Risk of bias | ||
| Bias | Authors' judgement | Support for judgement |
| Allocation concealment? | Low risk | A ‐ Adequate |
Cameron 2004.
| Methods | STUDY DESIGN: randomised controlled trial
LOCATION AND SETTING: Community (Twin register), Australia
DURATION OF SUPPLEMENTATION: 2 years
DURATION OF FOLLOW‐UP: 2 years
QUALITY ASSESSMENT: Moderate risk of bias
RANDOMISED: States random but no description
ALLOCATION CONCEALMENT: Not described or unclear
BLINDING OF SUBJECT: Yes
DESCRIPTION OF WITHDRAWALS/DROPOUTS: Yes TYPE OF ANALYSIS: Available Data COMPLIANCE: Assessed CONFOUNDERS MEASURED: spontaneous calcium intake, physical activity, medical history and medication use. |
|
| Participants | N SCREENED: unknown N RANDOMISED: 128 N COMPLETED: 104 (6 months); 48 (2 years) M=0% F=100% ETHNICITY: unknown MEAN BASELINE AGE (yrs): 10.3 BASELINE AGE RANGE (yrs): 8‐13 INCLUSION CRITERIA: premenarcheal female twins EXCLUSION CRITERIA: nil BASELINE CALCIUM INTAKE (mg/day): 716 PUBERTAL STAGE: prepubertal | |
| Interventions | 1. Calcium carbonate 1200 mg 2. Placebo CO‐INTERVENTIONS: Nil | |
| Outcomes | BONE MEASURES: SITES AREAL BONE MINERAL DENSITY: total hip, femoral neck, total forearm and L2‐4 vertebrae. BONE MINERAL CONTENT: total body METHOD OF MEASUREMENT: DXA FOLLOW‐UP ASSESSMENT POINTS(yrs): 0, 0.5, 1, 1.5, 2 OTHER OUTCOMES MEASURED: weight, height, fat mass, lean mass BONE MEASURES INCLUDED IN ANALYSES: AREAL BONE MINERAL DENSITY: total hip, femoral neck, total forearm and L2‐4 vertebrae. BONE MINERAL CONTENT: total body SUB‐GROUPS IDENTIFIED: Menarche vs premenarche | |
| Notes | ||
| Risk of bias | ||
| Bias | Authors' judgement | Support for judgement |
| Allocation concealment? | Unclear risk | B ‐ Unclear |
Chevalley 2005.
| Methods | STUDY DESIGN: randomised controlled trial
LOCATION AND SETTING: Community (Public Youth Health Service), Switzerland
DURATION OF SUPPLEMENTATION: 1 year
DURATION OF FOLLOW‐UP: 2 years
QUALITY ASSESSMENT: Moderate risk of bias
RANDOMISED: States random but no description
ALLOCATION CONCEALMENT: Not described or unclear
BLINDING OF SUBJECT: Unclear
DESCRIPTION OF WITHDRAWALS/DROPOUTS: Yes TYPE OF ANALYSIS: Available Data COMPLIANCE: Assessed CONFOUNDERS MEASURED: spontaneous calcium intake, physical activity, |
|
| Participants | N SCREENED: unknown N RANDOMISED: 235 N COMPLETED: 232 (1 year); 172 (2 years) M=100% F=0% ETHNICITY: CAUCASIAN MEAN BASELINE AGE (yrs): 7.44 BASELINE AGE RANGE (yrs): 6.5‐8.5 INCLUSION CRITERIA: healthy prepubertal, Caucasian males with spontatneous calcium intake below the 75th centile of a community sample of 990 boys EXCLUSION CRITERIA: ratio weight/height < 3rd or > 97th percentile according to Geneva reference values, presence of physical signs of puberty, chronic disease, gastro‐intestinal disease capable of inducing malabsorption, congenital or acquired bone disease, regular use of medication. BASELINE CALCIUM INTAKE (mg/day): 752 PUBERTAL STAGE: prepubertal | |
| Interventions | 1. Foods supplemented by calcium phosphate milk extract (850 mg Calcium per day) 2. Unsupplemented foods CO‐INTERVENTIONS: Nil | |
| Outcomes | BONE MEASURES MEASURED: SITES
AREAL BONE MINERAL DENSITY: distal radial metaphysis, diaphysis of radius, femoral neck, femoral trochanter, femoral diaphysis and L2‐4 vertebrae.
BONE MINERAL CONTENT: total body, distal radial metaphysis, diaphysis of radius, femoral neck, femoral trochanter, femoral diaphysis and L2‐4 vertebrae.
BONE AREA: distal radial metaphysis, diaphysis of radius, femoral neck, femoral trochanter, femoral diaphysis and L2‐4 vertebrae.
METHOD OF MEASUREMENT: DXA
FOLLOW‐UP ASSESSMENT POINTS(yrs): 0, 1, 2
OTHER OUTCOMES MEASURED: weight, height
BONE MEASURES INCLUDED IN ANALYSES:
AREAL BONE MINERAL DENSITY: distal radial metaphysis, diaphysis of radius, femoral neck, femoral trochanter, femoral diaphysis and L2‐4 vertebrae, mean at the 5 appendicular sites.
BONE MINERAL CONTENT: distal radial metaphysis, diaphysis of radius, femoral neck, femoral trochanter, femoral diaphysis and L2‐4 vertebrae, mean at the 5 appendicular sites.
BONE AREA: distal radial metaphysis, diaphysis of radius, femoral neck, femoral trochanter, femoral diaphysis and L2‐4 vertebrae, mean at the 5 appendicular sites. SUB‐GROUPS IDENTIFIED: physical activity levels and spontaneous calcium intake (defined by above and below median) |
|
| Notes | ||
| Risk of bias | ||
| Bias | Authors' judgement | Support for judgement |
| Allocation concealment? | Unclear risk | B ‐ Unclear |
Courteix 2005.
| Methods | STUDY DESIGN: randomised controlled trial
LOCATION AND SETTING: Community (school and sports clubs), France
DURATION OF SUPPLEMENTATION: 1 year
DURATION OF FOLLOW‐UP: 1 year
QUALITY ASSESSMENT: low risk of bias
RANDOMISED: random and description consistent with this
ALLOCATION CONCEALMENT: Yes
BLINDING OF SUBJECT: Yes
DESCRIPTION OF WITHDRAWALS/DROPOUTS: Yes TYPE OF ANALYSIS: Available Data COMPLIANCE: Assessed CONFOUNDERS MEASURED: physical activity, pubertal status, spontaneous calcium intake |
|
| Participants | N SCREENED: 138 N RANDOMISED: 113 N COMPLETED: 85 (1 year) M=0% F=100% ETHNICITY: CAUCASIAN MEAN BASELINE AGE (yrs): 9.91 BASELINE AGE RANGE (yrs): 8‐13 INCLUSION CRITERIA: healthy Caucasian females, age 8‐13, prepubescent and not expected to reach menarche before end of first year of study EXCLUSION CRITERIA: children with swimming as a physical activity BASELINE CALCIUM INTAKE (mg/day): 994 PUBERTAL STAGE: prepubertal | |
| Interventions | 1. 800 mg/day calcium as calcium phosphate 2. Placebo CO‐INTERVENTIONS: Nil | |
| Outcomes | BONE MEASURES: SITES
AREAL BONE MINERAL DENSITY: total body, dominant hip (femoral neck, trochanter and Ward's triangle), non‐dominant radius (1/3, mid and distal) and L2‐4 vertebrae.
BONE MINERAL CONTENT: total body, dominant hip (femoral neck, trochanter and Ward's triangle), non‐dominant radius (1/3, mid and distal) and L2‐4 vertebrae.
METHOD OF MEASUREMENT: DXA
FOLLOW‐UP ASSESSMENT POINTS(yrs): 0, 1
OTHER OUTCOMES MEASURED: BMI, height, bone age, fat mass, lean mass
BONE MEASURES INCLUDED IN ANALYSES:
AREAL BONE MINERAL DENSITY: total body, dominant hip (femoral neck, trochanter and Ward's triangle), non‐dominant radius (1/3, mid and distal) and L2‐4 vertebrae.
BONE MINERAL CONTENT: total body, dominant hip (femoral neck, trochanter and Ward's triangle), non‐dominant radius (1/3, mid and distal) and L2‐4 vertebrae. SUB‐GROUPS IDENTIFIED: exercise (7.2 hours exercise per week) and sedentary (1.2 hours exercise per week) |
|
| Notes | ||
| Risk of bias | ||
| Bias | Authors' judgement | Support for judgement |
| Allocation concealment? | Low risk | A ‐ Adequate |
Dibba 2000.
| Methods | STUDY DESIGN: randomised controlled trial
LOCATION AND SETTING: Community (rural village), Gambia
DURATION OF SUPPLEMENTATION: 1 year
DURATION OF FOLLOW‐UP: 3 years
QUALITY ASSESSMENT: Low risk of bias
RANDOMISED: random and description consistent with this
ALLOCATION CONCEALMENT: Yes
BLINDING OF SUBJECT: Yes
DESCRIPTION OF WITHDRAWALS/DROPOUTS: Yes TYPE OF ANALYSIS: Intention‐to‐treat COMPLIANCE: Assessed CONFOUNDERS MEASURED: tanner stage status, spontaneous calcium intake, baseline serum vitamin D, grip strength |
|
| Participants | N SCREENED: 162 N RANDOMISED: 160 N COMPLETED: 160 M=50% F=50% ETHNICITY: Gambian MEAN BASELINE AGE (yrs): 10.3 BASELINE AGE RANGE (yrs): 8.3‐11.9 INCLUSION CRITERIA: 8.3‐11.9 y.o children in a single rural village, healthy, no history of medical condition known to affect calcium or bone metabolism, no recent fracture, no alcohol, antacids, calcium or other nutritional supplements, non‐smoking. EXCLUSION CRITERIA: see inclusion criteria BASELINE CALCIUM INTAKE (mg/day): 338 PUBERTAL STAGE: mixed | |
| Interventions | 1. Calcium carbonate 1000mg 5 days per week 2. Placebo CO‐INTERVENTIONS: Nil | |
| Outcomes | BONE MEASURES: SITES
AREAL BONE MINERAL DENSITY: midshaft and distal radius (left arm).
BONE MINERAL CONTENT: midshaft and distal radius (left arm).
BONE WIDTH: midshaft and distal radius (left arm).
METHOD OF MEASUREMENT: SPA
FOLLOW‐UP ASSESSMENT POINTS(yrs): 0, 1, 2, 3
OTHER OUTCOMES MEASURED: weight, height, triceps skinfold thickness, plasma osteocalcin (n=100 only)
BONE MEASURES INCLUDED IN ANALYSES:
AREAL BONE MINERAL DENSITY: midshaft and distal radius (left arm).
BONE MINERAL CONTENT: midshaft and distal radius (left arm).
BONE WIDTH: midshaft and distal radius (left arm). SUB‐GROUPS IDENTIFIED: sex |
|
| Notes | ||
| Risk of bias | ||
| Bias | Authors' judgement | Support for judgement |
| Allocation concealment? | Low risk | A ‐ Adequate |
Iuliano‐Burns 2003.
| Methods | STUDY DESIGN: randomised controlled trial
LOCATION AND SETTING: Community (school), Australia
DURATION OF SUPPLEMENTATION: 8.5 months
DURATION OF FOLLOW‐UP: 8.5 months
QUALITY ASSESSMENT: High risk of bias
RANDOMISED: random and description consistent with this
ALLOCATION CONCEALMENT: Not described or unclear
BLINDING OF SUBJECT: Yes
DESCRIPTION OF WITHDRAWALS/DROPOUTS: No TYPE OF ANALYSIS: Available Data COMPLIANCE: Assessed CONFOUNDERS MEASURED: Tanner stage, spontaneous calcium intake, physical activity |
|
| Participants | N SCREENED: 75 N RANDOMISED: 72 N COMPLETED: 66 (8.5 months) M=0% F=100% ETHNICITY: Asian 15%, 85% not stated MEAN BASELINE AGE (yrs): 8.86 BASELINE AGE RANGE (yrs): 7‐11 INCLUSION CRITERIA: girls aged 7‐11 EXCLUSION CRITERIA: BMI> 4SD above the mean; > 10 hr/week of weight‐bearing exercise BASELINE CALCIUM INTAKE (mg/day): 674 PUBERTAL STAGE: mixed | |
| Interventions | 1. Foods fortified by 2 g milk minerals (400 mg calcium/day) 2. Unsupplemented foods CO‐INTERVENTIONS: Moderate‐impact (ground reaction forces 2‐4 times body weight) vs low‐impact exercise (ground reaction forces approximately equal to body weight) 20 min 3 times per week. | |
| Outcomes | BONE MEASURES: SITES
BONE MINERAL CONTENT: total body, leg, femur, tibia/fibula, humerus, ulna/radius and lumbar spine. METHOD OF MEASUREMENT: DXA FOLLOW‐UP ASSESSMENT POINTS(yrs): 0, 0.7 OTHER OUTCOMES MEASURED: body composition, weight, sitting and standing height, limb lengths BONE MEASURES INCLUDED IN ANALYSES: BONE MINERAL CONTENT: total body, leg, femur, tibia/fibula, humerus, ulna/radius and lumbar spine. SUB‐GROUPS IDENTIFIED: by exercise intervention |
|
| Notes | ||
| Risk of bias | ||
| Bias | Authors' judgement | Support for judgement |
| Allocation concealment? | Unclear risk | B ‐ Unclear |
Johnston 1992.
| Methods | STUDY DESIGN: randomised controlled trial
LOCATION AND SETTING: Community (Twin register), USA
DURATION OF SUPPLEMENTATION: 3 years
DURATION OF FOLLOW‐UP: 6 years
QUALITY ASSESSMENT: Moderate risk of bias
RANDOMISED: States random but no description
ALLOCATION CONCEALMENT: Not described or unclear
BLINDING OF SUBJECT: Yes
DESCRIPTION OF WITHDRAWALS/DROPOUTS: Yes TYPE OF ANALYSIS: Available Data COMPLIANCE: Assessed CONFOUNDERS MEASURED: physical activity, Tanner stage, spontaneous calcium intake, smoking, alcohol consumption |
|
| Participants | N SCREENED: 142 N RANDOMISED: 140 N COMPLETED: 90 (3 years); 84 (6 years) M=39% F=61% ETHNICITY: CAUCASIAN MEAN BASELINE AGE (yrs): 10 BASELINE AGE RANGE (yrs): 6‐14 INCLUSION CRITERIA: healthy, Caucasian, monozygotic twins aged 6‐14 EXCLUSION CRITERIA: baseline calcium intake > 1200 mg. BASELINE CALCIUM INTAKE (mg/day): 919 PUBERTAL STAGE: mixed | |
| Interventions | 1. 1000mg calcium daily as calcium citrate malate 2. Placebo CO‐INTERVENTIONS: Nil | |
| Outcomes | BONE MEASURES: SITES
AREAL BONE MINERAL DENSITY: distal radius, midshaft radius, femoral neck, Ward's triangle, greater trochanter and L2‐4 vertebrae.
BONE MINERAL CONTENT: distal radius, midshaft radius, femoral neck, Ward's triangle, greater trochanter and L2‐4 vertebrae.
BONE AREA: distal radius, midshaft radius, femoral neck, Ward's triangle, greater trochanter and L2‐4 vertebrae.
METHOD OF MEASUREMENT: SPA for radius, DXA for other sites
FOLLOW‐UP ASSESSMENT POINTS(yrs): 0, 0.5, 1,2 and 3 for radius, 0 and 3 for other sites
OTHER OUTCOMES MEASURED: weight, height, urinary calcium and creatinine, serum osteocalcin, tartrate resistant acid phosphatase and dietary calcium absorption by calcium‐44 enrichment.
BONE MEASURES INCLUDED IN ANALYSES:
AREAL BONE MINERAL DENSITY: distal radius, midshaft radius, femoral neck, Ward's triangle, greater trochanter and L2‐4 vertebrae.
BONE MINERAL CONTENT: distal radius, midshaft radius, femoral neck, Ward's triangle, greater trochanter and L2‐4 vertebrae.
BONE AREA: distal radius, midshaft radius, femoral neck, Ward's triangle, greater trochanter and L2‐4 vertebrae. SUB‐GROUPS IDENTIFIED: Prepubertal vs peri/post‐pubertal |
|
| Notes | ||
| Risk of bias | ||
| Bias | Authors' judgement | Support for judgement |
| Allocation concealment? | Unclear risk | B ‐ Unclear |
Lee 1994.
| Methods | STUDY DESIGN: randomised controlled trial
LOCATION AND SETTING: Community (school), China
DURATION OF SUPPLEMENTATION: 1.5 years
DURATION OF FOLLOW‐UP: 2.5 years
QUALITY ASSESSMENT: Moderate risk of bias
RANDOMISED: States random but no description
ALLOCATION CONCEALMENT: Not described or unclear
BLINDING OF SUBJECT: Yes
DESCRIPTION OF WITHDRAWALS/DROPOUTS: Yes TYPE OF ANALYSIS: Available Data COMPLIANCE: Assessed CONFOUNDERS MEASURED: physical activity, spontaneous calcium intake, baseline serum vitamin D (n=18), |
|
| Participants | N SCREENED: unknown N RANDOMISED: 163 N COMPLETED: 162 (1.5 years); 159 (2.5 years) M=54% F=46% ETHNICITY: Chinese MEAN BASELINE AGE (yrs): 7.18 BASELINE AGE RANGE (yrs): 7 year olds only INCLUSION CRITERIA:7 year old, healthy, low (< 300 mg/day) habitual calcium intake EXCLUSION CRITERIA: recent fracture or metabolic disease known to affect bone mass BASELINE CALCIUM INTAKE (mg/day): 277 PUBERTAL STAGE: | |
| Interventions | 1. 300 mg/day calcium as calcium carbonate 2. Placebo CO‐INTERVENTIONS: Nil | |
| Outcomes | BONE MEASURES: SITES
AREAL BONE MINERAL DENSITY: midshaft radius
BONE MINERAL CONTENT: midshaft radius
BONE WIDTH : midshaft radius
METHOD OF MEASUREMENT: SPA
FOLLOW‐UP ASSESSMENT POINTS: 0, 6‐monthly until 2.5 years
OTHER OUTCOMES MEASURED: weight, height
BONE MEASURES INCLUDED IN ANALYSES:
AREAL BONE MINERAL DENSITY: midshaft radius
BONE MINERAL CONTENT: midshaft radius
BONE WIDTH : midshaft radius SUB‐GROUPS IDENTIFIED: Males and females |
|
| Notes | Randomised by school class. | |
| Risk of bias | ||
| Bias | Authors' judgement | Support for judgement |
| Allocation concealment? | Unclear risk | B ‐ Unclear |
Lee 1995.
| Methods | STUDY DESIGN: randomised controlled trial
LOCATION AND SETTING: Community (Well‐baby clinic), hong Kong
DURATION OF SUPPLEMENTATION: 1.5 years
DURATION OF FOLLOW‐UP: 3 years
QUALITY ASSESSMENT: Moderate risk of bias
RANDOMISED: States random but no description
ALLOCATION CONCEALMENT: Not described or unclear
BLINDING OF SUBJECT: Yes
DESCRIPTION OF WITHDRAWALS/DROPOUTS: Yes TYPE OF ANALYSIS: Available Data COMPLIANCE: Assessed CONFOUNDERS MEASURED: physical activity, serum vitamin D (n=20), spontaneous calcium intake, dietary protein and energy intake, Tanner stage (at end of follow‐up only). |
|
| Participants | N SCREENED: unknown N RANDOMISED: 109 N COMPLETED: 84 (1.5 years); 84 (3 years) M=57% F=43% ETHNICITY: Chinese MEAN BASELINE AGE (yrs): not given BASELINE AGE RANGE (yrs): 7 year olds only INCLUSION CRITERIA: 7‐year olds, no recent metabolic disorder or fracture that might directly or indirectly affect bone metabolism, normal growth since birth. EXCLUSION CRITERIA: see above BASELINE CALCIUM INTAKE (mg/day): 567 PUBERTAL STAGE: assume prepubertal (age=7) | |
| Interventions | 1. Calcium 300mg/day as calcium carbonate 2. Placebo CO‐INTERVENTIONS: Nil | |
| Outcomes | BONE MEASURES: SITES
AREAL BONE MINERAL DENSITY: distal radius, femoral neck and L2‐4 vertebrae.
BONE MINERAL CONTENT: distal radius, femoral neck and L2‐4 vertebrae.
BONE AREA: distal radius, femoral neck and L2‐4 vertebrae.
METHOD OF MEASUREMENT: SPA radius, DXA other sites
FOLLOW‐UP ASSESSMENT POINTS(yrs): 0, 6‐montly until 3 years
OTHER OUTCOMES MEASURED: weight, height
BONE MEASURES INCLUDED IN ANALYSES:
AREAL BONE MINERAL DENSITY: distal radius, femoral neck and L2‐4 vertebrae.
BONE MINERAL CONTENT: distal radius, femoral neck and L2‐4 vertebrae.
BONE AREA: distal radius, femoral neck and L2‐4 vertebrae SUB‐GROUPS IDENTIFIED: Nil |
|
| Notes | ||
| Risk of bias | ||
| Bias | Authors' judgement | Support for judgement |
| Allocation concealment? | Unclear risk | B ‐ Unclear |
Lloyd 1993.
| Methods | STUDY DESIGN: randomised controlled trial
LOCATION AND SETTING: Community (schools), USA
DURATION OF SUPPLEMENTATION: 2 years
DURATION OF FOLLOW‐UP: 2 years
QUALITY ASSESSMENT: Moderate risk of bias
RANDOMISED: States random but no description
ALLOCATION CONCEALMENT: Not described or unclear
BLINDING OF SUBJECT: Yes
DESCRIPTION OF WITHDRAWALS/DROPOUTS: Yes TYPE OF ANALYSIS: Available Data COMPLIANCE: Assessed CONFOUNDERS MEASURED: Tanner stage, Integrated Estrogen Exposure Score, spontaneous calcium intake, Urinary estradiol, testosterone, cortisol, luteinizing hormone and follicle‐stimulating hormone . |
|
| Participants | N SCREENED: unknown N RANDOMISED: 112 N COMPLETED: 94 (1.5 years); 91 (2 years) M=0% F=100% ETHNICITY: CAUCASIAN MEAN BASELINE AGE (yrs): 11.9 BASELINE AGE RANGE (yrs): unknown INCLUSION CRITERIA: white female descendants of Northern Europeans, premenarcheal EXCLUSION CRITERIA: Not between 80‐120% of ideal body weight for height; regular medication; medical history known to affect bone development; known eating disorder. BASELINE CALCIUM INTAKE (mg/day): 976 PUBERTAL STAGE: mixed | |
| Interventions | 1. 500 mg/day calcium as calcium citrate malate 2. Placebo CO‐INTERVENTIONS: Nil | |
| Outcomes | BONE MEASURES: SITES
AREAL BONE MINERAL DENSITY: Total body, pelvis and lumbar spine.
BONE MINERAL CONTENT: Total body, pelvis and lumbar spine.
BONE AREA: Total body, pelvis and lumbar spine.
METHOD OF MEASUREMENT: DXA
FOLLOW‐UP ASSESSMENT POINTS(yrs): 0, 6‐monthly to 2 years
OTHER OUTCOMES MEASURED: weight, height, urinary calcium & creatinine
BONE MEASURES INCLUDED IN ANALYSES:
AREAL BONE MINERAL DENSITY: Total body, pelvis and lumbar spine.
BONE MINERAL CONTENT: Total body, pelvis and lumbar spine.
BONE AREA: Total body, pelvis and lumbar spine. SUB‐GROUPS IDENTIFIED: Above and below median Tanner score and median dietary calcium intake |
|
| Notes | Randomisation stratified by BMI and baseline lumbar spine BMD | |
| Risk of bias | ||
| Bias | Authors' judgement | Support for judgement |
| Allocation concealment? | Unclear risk | B ‐ Unclear |
Matkovic 2004.
| Methods | STUDY DESIGN: randomised controlled trial
LOCATION AND SETTING: Community (school), USA
DURATION OF SUPPLEMENTATION: 7 years
DURATION OF FOLLOW‐UP: 7 years
QUALITY ASSESSMENT: High risk of bias
RANDOMISED: States random but no description
ALLOCATION CONCEALMENT: Not described or unclear
BLINDING OF SUBJECT: Yes
DESCRIPTION OF WITHDRAWALS/DROPOUTS: No TYPE OF ANALYSIS: Available Data COMPLIANCE: Assessed CONFOUNDERS MEASURED: physical activity; dietary calcium, protein, energy intake; 24 hour urinary sodium; skeletal age, urinary and fecal calcium, serum calcium, serum vitamin D. |
|
| Participants | N SCREENED: unknown N RANDOMISED: 354 N COMPLETED: 220 (4 year); 179 (7 years) M=0% F=100% ETHNICITY: white MEAN BASELINE AGE (yrs): 10.8 BASELINE AGE RANGE (yrs): unknown INCLUSION CRITERIA: white, normal physical and mental health, pubertal stage 2, calcium intake <1480 mg/day, female EXCLUSION CRITERIA: history of metabolic bone, kidney, liver or celiac disease; use of oral corticosteroids, hormones, diuretics or antiseizure medications,; other current systemic, chronic disease; and the presence of clinically significant abnormal laboratory data on screening BASELINE CALCIUM INTAKE (mg/day): 837 PUBERTAL STAGE: peripubertal (Tanner stage 2) | |
| Interventions | 1. 1000 mg/day calcium as calcium citrate malate 2. Placebo CO‐INTERVENTIONS: Nil | |
| Outcomes | BONE MEASURES: SITES AREAL BONE MINERAL DENSITY: distal radius, radius at 33% of the radius length, total body. BONE AREA: distal radius, radius at 33% of the radius length, total body. METHOD OF MEASUREMENT: DXA FOLLOW‐UP ASSESSMENT POINTS(yrs): 0, 1, 2, 4.5, 8.5 OTHER OUTCOMES MEASURED: metacarpal cortical index at 4 and 7 years, weight, height, body composition, serum osteocalcin and PTH and urinary N‐telopeptides. BONE MEASURES INCLUDED IN ANALYSES: AREAL BONE MINERAL DENSITY: distal radius, radius at 33% of the radius length, total body. BONE AREA: distal radius, radius at 33% of the radius length, total body. SUB‐GROUPS IDENTIFIED: nil | |
| Notes | ||
| Risk of bias | ||
| Bias | Authors' judgement | Support for judgement |
| Allocation concealment? | Unclear risk | B ‐ Unclear |
Molgaard 2004.
| Methods | STUDY DESIGN: randomised controlled trial
LOCATION AND SETTING: Population‐based, Denmark
DURATION OF SUPPLEMENTATION: 1 years
DURATION OF FOLLOW‐UP: 2 years
QUALITY ASSESSMENT: Moderate risk of bias
RANDOMISED: States random but no description
ALLOCATION CONCEALMENT: Not described or unclear
BLINDING OF SUBJECT: Yes
DESCRIPTION OF WITHDRAWALS/DROPOUTS: Yes TYPE OF ANALYSIS: Available Data COMPLIANCE: Assessed CONFOUNDERS MEASURED: pubertal status, spontaneous calcium intake, physical activity, serum vitamin D |
|
| Participants | N SCREENED: 241 N RANDOMISED: 113 N COMPLETED: 111 (1 year); M=0% F=100% ETHNICITY: white MEAN BASELINE AGE (yrs): 13.2 BASELINE AGE RANGE (yrs): 12‐14 INCLUSION CRITERIA: 12 years old +/‐ 6 months, girls EXCLUSION CRITERIA: nonwhite ethnic origin, abnormal weight for height (< 3rd, > 97th percentile), diseases or intake of drugs with a potential effect on bones. Two groups recruited by calcium intake (high between 40th and 60th percentile = 1000‐1304 mg/day by FFQ; low < 20th percentile, < 713 mg/day) BASELINE CALCIUM INTAKE (mg/day): 841 PUBERTAL STAGE: mixed | |
| Interventions | 1. 500 mg/day of calcium as calcium carbonate 2. Placebo CO‐INTERVENTIONS: Nil | |
| Outcomes | BONE MEASURES: SITES
AREAL BONE MINERAL DENSITY: total body.
BONE MINERAL CONTENT: total body.
BONE AREA: total body.
METHOD OF MEASUREMENT: DXA
FOLLOW‐UP ASSESSMENT POINTS(yrs): 0, 1
OTHER OUTCOMES MEASURED: weight, height, serum alkaline phosphatase
BONE MEASURES INCLUDED IN ANALYSES:
AREAL BONE MINERAL DENSITY: total body.
BONE MINERAL CONTENT: total body.
BONE AREA: total body. SUB‐GROUPS IDENTIFIED: Spontaneous calcium intake (defined as high between 40th and 60th percentile = 1000‐1304 mg/day by FFQ; low < 20th percentile, < 713 mg/day) |
|
| Notes | Study also gives results as size‐adjusted BMC ie BMC adjusted for bone area, weight and height. In second year of follow‐up, all participants were given supplements and no results are reported from the second year. | |
| Risk of bias | ||
| Bias | Authors' judgement | Support for judgement |
| Allocation concealment? | Unclear risk | B ‐ Unclear |
Nowson 1997.
| Methods | STUDY DESIGN: randomised controlled trial
LOCATION AND SETTING: Community (Twin register), Australia
DURATION OF SUPPLEMENTATION: 1.5 years
DURATION OF FOLLOW‐UP: 1.5 years
QUALITY ASSESSMENT: Moderate risk of bias
RANDOMISED: States random but no description
ALLOCATION CONCEALMENT: Not described or unclear
BLINDING OF SUBJECT: Yes
DESCRIPTION OF WITHDRAWALS/DROPOUTS: Yes TYPE OF ANALYSIS: Available Data COMPLIANCE: Assessed CONFOUNDERS MEASURED: physical activity, pre vs post menarcheal, spontaneous calcium intake |
|
| Participants | N SCREENED: unknown N RANDOMISED: 110 N COMPLETED: 56 (1.5 years); M=0% F=100% ETHNICITY: not stated MEAN BASELINE AGE (yrs): 14 BASELINE AGE RANGE (yrs): 10‐17 INCLUSION CRITERIA: female twin pairs EXCLUSION CRITERIA: none stated BASELINE CALCIUM INTAKE (mg/day): 734 PUBERTAL STAGE: mixed | |
| Interventions | 1. 1000 mg/day calcium as calcium carbonate/calcium lactate gluconate combination 2. Placebo CO‐INTERVENTIONS: Nil | |
| Outcomes | BONE MEASURES: SITES
AREAL BONE MINERAL DENSITY: forearm, femoral neck, Ward's triangle, total hip and L2‐4 vertebrae.
BONE MINERAL CONTENT: total body METHOD OF MEASUREMENT: DXA FOLLOW‐UP ASSESSMENT POINTS(yrs): 0 (all sites), 6‐monthly to 1.5 (hip and spine) OTHER OUTCOMES MEASURED: weight, height, fat mass, lean mass BONE MEASURES INCLUDED IN ANALYSES: AREAL BONE MINERAL DENSITY: forearm, femoral neck, Ward's triangle, total hip and L2‐4 vertebrae. BONE MINERAL CONTENT: total body SUB‐GROUPS IDENTIFIED: Pre vs post menarcheal |
|
| Notes | ||
| Risk of bias | ||
| Bias | Authors' judgement | Support for judgement |
| Allocation concealment? | Unclear risk | B ‐ Unclear |
Prentice 2005.
| Methods | STUDY DESIGN: randomised controlled trial
LOCATION AND SETTING: Community (college), UK
DURATION OF SUPPLEMENTATION: 1.06 years
DURATION OF FOLLOW‐UP: 1.06 years
QUALITY ASSESSMENT: Moderate risk of bias
RANDOMISED: random and description consistent with this
ALLOCATION CONCEALMENT: Not described or unclear
BLINDING OF SUBJECT: Yes
DESCRIPTION OF WITHDRAWALS/DROPOUTS: Yes TYPE OF ANALYSIS: Available Data COMPLIANCE: Assessed CONFOUNDERS MEASURED: physical activity, ethnic group, medical history, smoking and alcohol intake, consumption of dietary supplements and antacids, calcium intake, plasma testosterone concentration. |
|
| Participants | N SCREENED: unknown N RANDOMISED: 150 N COMPLETED: 143 (1 year) M=100% F=0% ETHNICITY: 90% white MEAN BASELINE AGE (yrs): 16.8 BASELINE AGE RANGE (yrs): 16‐18 INCLUSION CRITERIA: male sixth form students aged 16‐18 EXCLUSION CRITERIA: any medical problem, history of eating disorders, medication known to affect bone metabolism BASELINE CALCIUM INTAKE (mg/day): 1198 PUBERTAL STAGE: post‐pubertal (assumed from age) | |
| Interventions | 1. 1000 mg/day calcium as calcium carbonate 2. Placebo CO‐INTERVENTIONS: Exercise in low physical activity group | |
| Outcomes | BONE MEASURES: SITES AREAL BONE MINERAL DENSITY: left hip (total, femoral neck, greater trochanter, intertrochanter) and non‐dominant forearm (total, ultradistal and 1/3 sites of radius). BONE MINERAL CONTENT: total body, left hip (total, femoral neck, greater trochanter, intertrochanter) and non‐dominant forearm (total, ultradistal and 1/3 sites of radius). BONE AREA: left hip (total, femoral neck, greater trochanter, intertrochanter) and non‐dominant forearm (total, ultradistal and 1/3 sites of radius). METHOD OF MEASUREMENT: DXA FOLLOW‐UP ASSESSMENT POINTS(yrs): 0, 0.43, 1.06 OTHER OUTCOMES MEASURED: weight, height, fat mass, lean mass BONE MEASURES INCLUDED IN ANALYSES: AREAL BONE MINERAL DENSITY: left hip (total, femoral neck, greater trochanter, intertrochanter) and non‐dominant forearm (total, ultradistal and 1/3 sites of radius). BONE MINERAL CONTENT: total body, left hip (total, femoral neck, greater trochanter, intertrochanter) and non‐dominant forearm (total, ultradistal and 1/3 sites of radius). BONE AREA: left hip (total, femoral neck, greater trochanter, intertrochanter) and non‐dominant forearm (total, ultradistal and 1/3 sites of radius). SUB‐GROUPS IDENTIFIED: High vs low physical activity; above and below median calcium intake | |
| Notes | Study also gives results as size‐adjusted BMC ie BMC adjusted for bone area, weight and height | |
| Risk of bias | ||
| Bias | Authors' judgement | Support for judgement |
| Allocation concealment? | Unclear risk | B ‐ Unclear |
Rodda 2004.
| Methods | STUDY DESIGN: randomised controlled trial
LOCATION AND SETTING: Community (schools), Australia
DURATION OF SUPPLEMENTATION: 1‐4 years
DURATION OF FOLLOW‐UP: 4 years
QUALITY ASSESSMENT: Moderate risk of bias
RANDOMISED: States random but no description
ALLOCATION CONCEALMENT: Not described or unclear
BLINDING OF SUBJECT: Yes
DESCRIPTION OF WITHDRAWALS/DROPOUTS: No TYPE OF ANALYSIS: not stated COMPLIANCE: not stated CONFOUNDERS MEASURED: Pubertal status, no others stated |
|
| Participants | N SCREENED: unknown N RANDOMISED: 93 N COMPLETED: unknown M=0% F=100% ETHNICITY: Chinese 43%, anglocelt 57% MEAN BASELINE AGE (yrs): not stated BASELINE AGE RANGE (yrs): 10‐12 INCLUSION CRITERIA: healthy girls EXCLUSION CRITERIA: not stated BASELINE CALCIUM INTAKE (mg/day): not stated PUBERTAL STAGE: not stated | |
| Interventions | 1. Calcium carbonate 1200 mg/day 2. Placebo CO‐INTERVENTIONS: Nil | |
| Outcomes | BONE MEASURES: SITES AREAL BONE MINERAL DENSITY: total body and lumbar spine. BONE MINERAL CONTENT: total body and lumbar spine METHOD OF MEASUREMENT: DXA FOLLOW‐UP ASSESSMENT POINTS(yrs): 0, yearly up to 4 years OTHER OUTCOMES MEASURED: bone age, height, weight, sitting height, date of menarche, bone age BONE MEASURES INCLUDED IN ANALYSES: AREAL BONE MINERAL DENSITY: total body and lumbar spine. BONE MINERAL CONTENT: total body and lumbar spine SUB‐GROUPS IDENTIFIED: Chinese vs Anglocelt ethnicity | |
| Notes | Information about this study is limited as it has only been published as an abstract and no further information was available. | |
| Risk of bias | ||
| Bias | Authors' judgement | Support for judgement |
| Allocation concealment? | Unclear risk | B ‐ Unclear |
Rozen 2003.
| Methods | STUDY DESIGN: randomised controlled trial
LOCATION AND SETTING: Community (school), Israel
DURATION OF SUPPLEMENTATION: 1 years
DURATION OF FOLLOW‐UP: 4.5 years
QUALITY ASSESSMENT: High risk of bias
RANDOMISED: States random but no description
ALLOCATION CONCEALMENT: Not described or unclear
BLINDING OF SUBJECT: Yes
DESCRIPTION OF WITHDRAWALS/DROPOUTS: No TYPE OF ANALYSIS: Available Data and treatment received COMPLIANCE: Assessed CONFOUNDERS MEASURED: spontaneous calcium intake, serum vitamin D |
|
| Participants | N SCREENED: unknown N RANDOMISED: 112 N COMPLETED: 100 (1 year); 96 (4.5 years) M=0% F=100% ETHNICITY: 76% Jewish, 24% arab MEAN BASELINE AGE (yrs): 14.85 BASELINE AGE RANGE (yrs): 12‐17 INCLUSION CRITERIA: girls, calcium intake < 800 mg; >= 1 year post menarcheal, age < 15.5, no chronic disease, nonsmoking and no use of contraceptives. EXCLUSION CRITERIA: Pregnancy between cessation of supplementation and follow‐up (for follow‐up study) BASELINE CALCIUM INTAKE (mg/day): 582 PUBERTAL STAGE: post pubertal | |
| Interventions | 1. 1000 mg/day calcium as calcium carbonate 2. Placebo CO‐INTERVENTIONS: Nil | |
| Outcomes | BONE MEASURES: SITES AREAL BONE MINERAL DENSITY: total body, lumbar spine (L2‐4) and femoral neck BONE MINERAL CONTENT: total body, lumbar spine (L2‐4) and femoral neck METHOD OF MEASUREMENT: DXA FOLLOW‐UP ASSESSMENT POINTS(yrs): 0, 0.5,1, 4.5 OTHER OUTCOMES MEASURED: weight, height, bone‐specific alkaline phosphatase, urinary deoxypyridinline cross‐links, serum PTH and osteocalcin. BONE MEASURES INCLUDED IN ANALYSES: AREAL BONE MINERAL DENSITY: total body, lumbar spine (L2‐4) and femoral neck BONE MINERAL CONTENT: total body, lumbar spine (L2‐4) and femoral neck SUB‐GROUPS IDENTIFIED: < 24 months post‐menarche vs > 24 months post‐menarche | |
| Notes | ||
| Risk of bias | ||
| Bias | Authors' judgement | Support for judgement |
| Allocation concealment? | Unclear risk | B ‐ Unclear |
Specker 2003.
| Methods | STUDY DESIGN: randomised controlled trial
LOCATION AND SETTING: Community (child care centres), USA
DURATION OF SUPPLEMENTATION: 1 years
DURATION OF FOLLOW‐UP: 1 years
QUALITY ASSESSMENT: Moderate risk of bias
RANDOMISED: States random but no description
ALLOCATION CONCEALMENT: Not described or unclear
BLINDING OF SUBJECT: unclear
DESCRIPTION OF WITHDRAWALS/DROPOUTS: Yes TYPE OF ANALYSIS: Available Data COMPLIANCE: Assessed CONFOUNDERS MEASURED: spontaneous calcium intake, physical activity by accelerometer |
|
| Participants | N SCREENED: unknown N RANDOMISED: 239 N COMPLETED: 178 (1 year) M= 53% F= 47% ETHNICITY: white 94%, other 6% MEAN BASELINE AGE (yrs): 3.92 BASELINE AGE RANGE (yrs): 3‐5 INCLUSION CRITERIA: enrolled in child care centre, no known disorders that affected bone metabolism EXCLUSION CRITERIA: see inclusion criteria BASELINE CALCIUM INTAKE (mg/day): 946 PUBERTAL STAGE: prepubertal | |
| Interventions | 1. 1000 mg/day calcium as calcium carbonate 2. Placebo CO‐INTERVENTIONS: Gross motor vs fine motor exercise 30 min per day 5 days per week | |
| Outcomes | BONE MEASURES: SITES
BONE MINERAL CONTENT: total body, arm, leg
BONE AREA: total body, arm, leg
METHOD OF MEASUREMENT: DXA
FOLLOW‐UP ASSESSMENT POINTS(yrs): 0, 1
OTHER OUTCOMES MEASURED: weight, height, fat mass, lean mass, distal tibial periosteal and endosteal circumferences, cortical thickness and cortical area.
BONE MEASURES INCLUDED IN ANALYSES:
BONE MINERAL CONTENT: total body, arm, leg
BONE AREA: total body, arm, leg SUB‐GROUPS IDENTIFIED: By exercise intervention |
|
| Notes | ||
| Risk of bias | ||
| Bias | Authors' judgement | Support for judgement |
| Allocation concealment? | Unclear risk | B ‐ Unclear |
Stear 2003.
| Methods | STUDY DESIGN: randomised controlled trial
LOCATION AND SETTING: Community (college), UK
DURATION OF SUPPLEMENTATION: 15.5 months
DURATION OF FOLLOW‐UP: 15.5 months
QUALITY ASSESSMENT: High risk of bias
RANDOMISED: States random but no description
ALLOCATION CONCEALMENT: Yes
BLINDING OF SUBJECT: Yes
DESCRIPTION OF WITHDRAWALS/DROPOUTS: No TYPE OF ANALYSIS: Available Data and treatment received COMPLIANCE: Assessed CONFOUNDERS MEASURED: spontaneous calcium intake and physical activity |
|
| Participants | N SCREENED: unknown N RANDOMISED: 144 N COMPLETED: 131 (15.5 months) M=0% F=100% ETHNICITY: not stated MEAN BASELINE AGE (yrs): 17.3 BASELINE AGE RANGE (yrs): 16‐18 INCLUSION CRITERIA: female sixth form college students EXCLUSION CRITERIA: any medical problem, history of eating disorders, medication known to interfere with bone metabolism BASELINE CALCIUM INTAKE (mg/day): 938 PUBERTAL STAGE: post pubertal | |
| Interventions | 1. 1000 mg/day of calcium as calcium carbonate 2. Placebo CO‐INTERVENTIONS: exercise (45 min 3 times per week aerobics with moderate to high impact movements) and no exercise groups | |
| Outcomes | BONE MEASURES: SITES
AREAL BONE MINERAL DENSITY: unpublished data femoral neck, lumbar spine, distal radius.
BONE MINERAL CONTENT: total body, spine, radius (total, ultradistal, distal third), hip (total, femoral neck, trochanter, intertrochanter), lumbar spine
BONE AREA: total body, spine, radius (total, ultradistal, distal third), hip (total, femoral neck, trochanter, intertrochanter), lumbar spine
METHOD OF MEASUREMENT: DXA
FOLLOW‐UP ASSESSMENT POINTS(yrs): 0, 1.29
OTHER OUTCOMES MEASURED: weight, height,
BONE MEASURES INCLUDED IN ANALYSES:
AREAL BONE MINERAL DENSITY: unpublished data femoral neck, lumbar spine, distal radius.
BONE MINERAL CONTENT: total body, spine, radius (total, ultradistal, distal third), hip (total, femoral neck, trochanter, intertrochanter), lumbar spine
BONE AREA: total body, spine, radius (total, ultradistal, distal third), hip (total, femoral neck, trochanter, intertrochanter), lumbar spine SUB‐GROUPS IDENTIFIED: Exercise groups; high compliance groups for calcium and exercise |
|
| Notes | Compliance to exercise was poor; only 27% of subjects attended more than 50% of the intervention target. Study also gives results as size‐adjusted BMC ie BMC adjusted for bone area, weight and height | |
| Risk of bias | ||
| Bias | Authors' judgement | Support for judgement |
| Allocation concealment? | Low risk | A ‐ Adequate |
Wang 1996.
| Methods | STUDY DESIGN: randomised controlled trial
LOCATION AND SETTING: Community (school), China
DURATION OF SUPPLEMENTATION: 1.5 years
DURATION OF FOLLOW‐UP: 1.5 years
QUALITY ASSESSMENT: High risk of bias
RANDOMISED: States random but no description
ALLOCATION CONCEALMENT: Not described or unclear
BLINDING OF SUBJECT: Yes
DESCRIPTION OF WITHDRAWALS/DROPOUTS: No TYPE OF ANALYSIS: Available Data COMPLIANCE: Not reported CONFOUNDERS MEASURED: serum vitamin D, physical activity, spontaneous calcium intake |
|
| Participants | N SCREENED: unknown N RANDOMISED: 163 N COMPLETED: 162 (1.5 years) M=54% F=46% ETHNICITY: Chinese MEAN BASELINE AGE (yrs): 7.2 BASELINE AGE RANGE (yrs): not stated INCLUSION CRITERIA: healthy, no metabolic disease or recent medication related to bone metabolism EXCLUSION CRITERIA: see inclusion criteria BASELINE CALCIUM INTAKE (mg/day): 277 PUBERTAL STAGE: prepubertal (assumed from age) | |
| Interventions | 1. 300 mg/day calcium as calcium carbonate 2. Placebo CO‐INTERVENTIONS: Nil | |
| Outcomes | BONE MEASURES: SITES
AREAL BONE MINERAL DENSITY: distal radius.
BONE MINERAL CONTENT: distal radius.
BONE WIDTH: distal radius .
METHOD OF MEASUREMENT: SPA
FOLLOW‐UP ASSESSMENT POINTS(yrs): 0, 1, 2, 4.5, 8.5
OTHER OUTCOMES MEASURED: weight, height
BONE MEASURES INCLUDED IN ANALYSES:
AREAL BONE MINERAL DENSITY: distal radius.
BONE MINERAL CONTENT: distal radius.
BONE WIDTH: distal radius . SUB‐GROUPS IDENTIFIED: nil |
|
| Notes | Chinese language paper. | |
| Risk of bias | ||
| Bias | Authors' judgement | Support for judgement |
| Allocation concealment? | Unclear risk | B ‐ Unclear |
Characteristics of excluded studies [ordered by study ID]
| Study | Reason for exclusion |
|---|---|
| Abrams 2001 | Not a randomised controlled trial |
| Adiyaman 2004 | Not a randomised controlled trial |
| Albertson 1997 | Not a randomised controlled trial |
| Ali 2001 | Not a randomised controlled trial |
| Anderson 2001 | Not a randomised controlled trial |
| Andon 1994 | Not a randomised controlled trial |
| Anonymous 1992 | Not a randomised controlled trial |
| Anonymous 1993a | Not a randomised controlled trial |
| Anonymous 1993b | Not a randomised controlled trial |
| Anonymous 1994 | Not a randomised controlled trial |
| Anonymous 1997a | Not a randomised controlled trial |
| Anonymous 1997b | Not a randomised controlled trial |
| Anonymous 1998 | Not a randomised controlled trial |
| Anonymous 2000 | Not a randomised controlled trial |
| Anonymous 2004 | Not a randomised controlled trial |
| Antoniazzi 2003 | Condition predisposing to osteoporosis (participants undergoing treatment with gonadotrophin‐releasing hormone agonist treatment) |
| Antoniazzi 1999 | Condition predisposing to osteoporosis (participants undergoing treatment with gonadotrophin‐releasing hormone agonist treatment) |
| Appleby 1998 | Not a randomised controlled trial |
| Ausenhus 1988 | Not a randomised controlled trial |
| Badenhop 2004 | Not a randomised controlled trial |
| Barker 1998 | No placebo used |
| Barr 1998 | Not a randomised controlled trial |
| Barr 2001 | Not a randomised controlled trial |
| Bateson 2002 | Not a randomised controlled trial |
| Berthier 1994 | Not a randomised controlled trial |
| Black 2002 | Not a randomised controlled trial |
| Blalock 2002 | No calcium intervention |
| Bonjour 1999 | Not a randomised controlled trial |
| Bonofiglio 2004 | Not a randomised controlled trial |
| Boot 1997 | Not a randomised controlled trial |
| Bourges | Not a randomised controlled trial |
| Brown 2004 | No calcium intervention |
| Burckhardt 2001 | Not a randomised controlled trial |
| Cadogan 1997 | No placebo used |
| Carter 2001 | Not a randomised controlled trial |
| Chan 1987 | Trial in lactating adolscents ie condition predisposing to bone loss |
| Chan 1991 | Not a randomised controlled trial |
| Chan 1995 | No placebo used |
| Cheng 1999 | Not a randomised controlled trial |
| Chevalley 2004 | Not a randomised controlled trial |
| Clements 1991 | Not a randomised controlled trial |
| DeBar 2004 | No calcium intervention |
| DiMeglio 2005 | No calcium intervention |
| Dowd 2001 | Not a randomised controlled trial |
| Du 2002 | Not a randomised controlled trial |
| Du 2004 | No placebo used |
| Edwards 1998 | Not a randomised controlled trial |
| El‐Husseini 2004 | Condition presiposing to osteoporosis (renal transplantion) |
| Elgan 2002 | Not a randomised controlled trial |
| Feskanich 1997 | Not a randomised controlled trial |
| Fischer 1999a | No placebo |
| Fischer 1999b | Duplicate paper to Fischer 1999a |
| Fisher 2004 | Not a randomised controlled trial |
| Fujita 1992 | Not a randomised controlled trial |
| Gharib 2004 | Not a randomised controlled trial |
| Gibbons 2004 | Active placebo used (400 mg calcium) |
| Ginty 2004 | Not a randomised controlled trial |
| Goulding 2004 | Not a randomised controlled trial |
| Griffiths 1998 | Not a randomised controlled trial |
| Grossklaus 1998 | Not a randomised controlled trial |
| Gulati 2005 | Not a randomised controlled trial |
| Hampton 2004 | Not a randomised controlled trial |
| Harel 1998 | Not a randomised controlled trial |
| Henderson 1994 | Not a randomised controlled trial |
| Hidvegi 2003 | Not a randomised controlled trial |
| Homik 2005 | Not a randomised controlled trial |
| Hoppe 2000 | Not a randomised controlled trial |
| Hosokawa 1996 | Not a randomised controlled trial |
| Howat 2001 | Not a randomised controlled trial |
| Iki 2003 | Not a randomised controlled trial |
| Ilich 1996 | Not a randomised controlled trial |
| Infante 2000 | Not a randomised controlled trial |
| Kalkwarf 1997 | Adult participants and participants lactating |
| Kalkwarf 2003 | Not a randomised controlled trial |
| Kalusk 2001 | Not a randomised controlled trial |
| Kanis 1994 | Not a randomised controlled trial |
| Kardinaal 1999 | Not a randomised controlled trial |
| Kasper 2001 | Not a randomised controlled trial |
| Kerstetter 1995 | Not a randomised controlled trial |
| Koenig 2000 | Not a randomised controlled trial |
| Kowalski 2004 | Not a randomised controlled trial |
| Kreipe 1995 | Not a randomised controlled trial |
| Kubota 2003 | Not a randomised controlled trial |
| Kun 2001 | Not a randomised controlled trial |
| Lappe 2004 | No bone outcome measures (trial of calcium effect on wieght gain) |
| LaRosa 2004 | Not a randomised controlled trial |
| Lau 1992 | No placebo and no randomisation |
| Lau 2004 | No placebo used |
| Lee 1993 | Not a randomised controlled trial |
| Lee 2003 | Not a randomised controlled trial |
| Levers‐Landis 2003 | Not a randomised controlled trial |
| Li 2002 | No placebo used |
| Lloyd 2000 | Not a randomised controlled trial |
| Lloyd 2002 | Not a randomised controlled trial |
| Lysen 1997 | Not a randomised controlled trial |
| Ma 2004 | Not a randomised controlled trial |
| Mackelvie 2001 | Not a randomised controlled trial |
| Magee 1996 | No placebo used |
| Maggiolini 1999 | Not a randomised controlled trial |
| Mahana 1988 | Not a randomised controlled trial |
| Mallet 2000 | Not a randomised controlled trial |
| Mallet 2003 | Not a randomised controlled trial |
| Marrero 2004 | Not a randomised controlled trial |
| Martin 2004 | Not a randomised controlled trial |
| Matkovic 1990 | Inadequate randomisation |
| Matkovic 2002 | Not a randomised controlled trial |
| McCulloch 1990 | Not a randomised controlled trial |
| Meier 2004 | Participants were adults. |
| Merrilees 2000 | No placebo used |
| Meschino 2004 | Not a randomised controlled trial |
| Moelgaard 2001 | Not a randomised controlled trial |
| Monge 2001 | Not a randomised controlled trial |
| Moya 1997 | Not a randomised controlled trial |
| Moyer‐Mileur 2003 | Intervention combined vitamin D and calcium with no capacity to seperate calcium effect. |
| Naunton 2004 | Not a randomised controlled trial |
| Neville 2002 | Not a randomised controlled trial |
| New 1998 | Not a randomised controlled trial |
| NIH 2001 | Not a randomised controlled trial |
| Novotny 2004 | Not a randomised controlled trial |
| Nowson 1995 | Duplicate data (conference abstract) |
| O' Brien 1998 | Not a randomised controlled trial |
| Oellingrath 1989 | Not a randomised controlled trial |
| Ohgitani 1997 | No BMD or BMC outcomes |
| Oria 2003 | Not a randomised controlled trial |
| Parr 2002 | Not a randomised controlled trial |
| Pena 2004 | Not a randomised controlled trial |
| Peterson 2000 | No calcium intervention |
| Piaseu 2002 | No calcium intervention |
| Picard 1988 | Not a randomised controlled trial |
| Portsmouth 1994 | Not a randomised controlled trial |
| Prestridge 1993 | Condition predisposing to osteoporosis (very low birth weight infants) |
| Prynne 2004 | Not a randomised controlled trial |
| Purdie 1994 | Not a randomised controlled trial |
| Recker 1993 | Not a randomised controlled trial |
| Reid 1998 | Not a randomised controlled trial |
| Remer 2002 | Not a randomised controlled trial |
| Renner 1991a | Not a randomised controlled trial |
| Renner 1991b | Not a randomised controlled trial |
| Renner 1994 | Not a randomised controlled trial |
| Renner 1998 | No placebo or randomisation |
| Roberts 2000 | Not a randomised controlled trial |
| Robertson 2005 | Not a randomised controlled study |
| Roux 1995 | Not a randomised controlled trial |
| Rozen 2001 | Not a randomised controlled trial |
| Ruiz 1995 | Not a randomised controlled trial |
| Runyan 2003 | Not a randomised controlled trial |
| Sagara 2002 | Not a randomised controlled trial |
| Saggese | Not a randomised controlled trial |
| Sakkers 2004 | No calcium intervention |
| Scholz 1993 | Not a randomised controlled trial |
| Schonau 2004 | Not a randomised controlled trial |
| Smart 1994 | Not a randomised controlled trial |
| Solomons 1996 | No a randomised controlled study |
| Soroko 1994 | Not a randomised controlled trial |
| Specker 1997 | No placebo |
| Specker 1999 | No calcium intervention |
| Specker 2002 | Duplicate data (conference abstract) |
| Stallings 1994 | Not a randomised controlled trial |
| Szumera 2004 | Not a randomised controlled trial |
| Taha 2001 | Not a randomised controlled trial |
| Teegarden 1994 | Not a randomised controlled trial |
| Teegarden 1999 | Not a randomised controlled trial |
| Teesalu 1996 | Not a randomised controlled trial |
| ter Meulen 2004 | Condition predisposing to osteoporosis (renal transplantation) |
| Torres 2004 | Condition predisposing to osteoporosis (renal transplanation) |
| Tortolani 2002 | Not a randomised controlled trial |
| Tounian 2003 | Not a randomised controlled trial |
| Tsukahara 1997 | Not a randomised controlled trial |
| Tucker 2003 | Not a randomised controlled trial |
| Turner 1992 | Not a randomised controlled trial |
| Turner 2000 | Not a randomised controlled trial |
| Tussing 2005 | Not a randomised controlled trial |
| Tylavsky 1992 | Not a randomised controlled trial |
| Ulrich 1996 | Not a randomised controlled trial |
| Valerio 2004 | Not a randomised controlled trial |
| VandenBergh 1995 | Not a randomised controlled trial |
| Vigano 2004 | Not a randomised controlled trial |
| Volek 2003 | Outcomes measured at less than 6 months from baseline |
| Wallace 2002 | Not a randomised controlled trial |
| Wang 1999 | Not a randomised controlled trial |
| Wang 2003 | Not a randomised controlled trial |
| Wastney 2003 | Not a randomised controlled trial |
| Weaver 1999 | Not a randomised controlled trial |
| Welten 1995 | Not a randomised controlled trial |
| Welten 1997 | Not a randomised controlled trial |
| Whiting 2001 | Not a randomised controlled trial |
| Whiting 2004 | Not a randomised controlled trial |
| Winters‐Stone 2004 | Participants aged > 18 years |
| Yeste 2004 | Not a randomised controlled trial |
| Zacharin 2004 | Not a randomised controlled trial |
| Zanchetta 1995 | Not a randomised controlled trial |
| Zhang 2003 | No placebo used |
| Zhu 2003 | No placebo used |
| Zhu 2004 | No placebo used |
| Zhu 2004 b | Not a randomised controlled trial |
| Ziccardi 2004 | Not a randomised controlled trial |
| Zwart 2004 | No calcium intervention |
| Zwiauer 2003 | Not a randomised controlled trial |
Contributions of authors
Tania Winzenberg ‐ wrote review protocol, reviewed articles to decide on inclusion, performed data extraction and quality assessment of articles, performed the analysis and wrote the discussion of review results with the input of other authors. She will also be responsible for regularly updating and improving the review, as per Cochrane requirements.
Kelly Shaw ‐ reviewed articles to decide on inclusion, performed data extraction and quality assessment of articles, and had input into writing of discussion of review results.
Jayne Fryer ‐ provided advice on statistical analysis and input into writing of review methods, results and discussion.
Graeme Jones ‐ is the content expert in pediatric bone health for the review. He provided input into design of the protocol, was the deciding reviewer for any differences in data extraction between TW and KS, assisted with the analysis and with writing the discussion of review results.
Sources of support
Internal sources
Menzies Research Institute, Australia.
External sources
No sources of support supplied
Declarations of interest
None known.
Edited (no change to conclusions), comment added to review
References
References to studies included in this review
Bonjour 1995 {published data only}
- Bonjour JP, Carrie AL, Clavien H, Ferrari S, Slosman D, Theintz G, Rizzoli R. Calcium‐fortified aliments selectively increase radial and femoral bone mass in prepubertal girls: a double‐blind randomized trial.. Journal of Bone and Mineral Research 1995;10S:S152. [Google Scholar]
- Bonjour JP, Carrie AL, Ferrari S, Clavien H, Slosman D, Theintz G, et al. Calcium‐enriched foods and bone mass growth in prepubertal girls: a randomized, double‐blind, placebo‐controlled trial. Journal of Clinical Investigation 1997;99:1287‐1294. [DOI] [PMC free article] [PubMed] [Google Scholar]
- Bonjour JP, Chevalley T, Ammann P, Slosman D, Rizzoli R. Gain in bone mineral mass in prepubertal girls 3.5 years after discontinuation of calcium supplementation: a follow‐up study. Lancet 2001;358:1208‐1212. [DOI] [PubMed] [Google Scholar]
- Chevalley T, Bonjour JP, Hans D, Slosman D, Rizzoli R. Interdependence between calcium intake and menarcheal age on bone mass gain: a 8 years follow‐up from pre‐puberty to post‐menarche. Journal of Bone and Mineral Research 2003;18:S33. [Google Scholar]
- Chevalley T, Rizzoli R, Hans D, Ferrari S, Bonjour JP. Interaction between calcium intake and menarcheal age on bone mass gain: an eight‐year follow‐up study from prepuberty to postmenarche. Journal of Clinical Endocrinology and Metabolism 2005;90(1):44‐51. [DOI] [PubMed] [Google Scholar]
Cameron 2004 {published data only}
- Cameron MA, Paton LM, Nowson CA, Margerison C, Frame M, Wark JD. The effect of calcium supplementation on bone density in premenarcheal females: a co‐twin approach. Journal of Clinical Endocrinology and Metabolism 2004;89:4916‐22. [DOI] [PubMed] [Google Scholar]
Chevalley 2005 {published data only}
- Chevalley T, Bonjour JP, Ferrari S, Hans D, Rizzoli R. Skeletal site selectivity in the effects of calcium supplementation on areal bone mineral density gain: a randomized, double‐blind, placebo‐controlled trial in prepubertal boys. Journal of Clinical Endocrinology and Metabolism 2005. [DOI] [PubMed] [Google Scholar]
Courteix 2005 {published and unpublished data}
- Courteix D, Jaffre C, Lespessailles E, Benhamou L. Cumulative effects of calcium supplementation and physical activity on bone accretion in premenarchal children: a double‐blind randomised placebo‐controlled trial. International Journal of Sports Medicine 2005;26:332‐8. [DOI] [PubMed] [Google Scholar]
Dibba 2000 {published data only}
- Dibba B, Prentice A, Ceesay M, Mendy M, Darboe S, Stirling DM, et al. Bone mineral contents and plasma osteocalcin concentrations of Gambian children 12 and 24 mo after the withdrawal of a calcium supplement. American Journal of Clinical Nutrition 2002;76:681‐6. [DOI] [PubMed] [Google Scholar]
- Dibba B, Prentice A, Ceesay M, Stirling DM, Cole TJ, Poskitt EM. Effect of calcium supplementation on bone mineral accretion in gambian children accustomed to a low‐calcium diet. American Journal of Clinical Nutrition 2000;71:544‐9. [DOI] [PubMed] [Google Scholar]
Iuliano‐Burns 2003 {published data only}
- Iuliano‐Burns S, Saxon L, Naughton G, Gibbons K, Bass SL. Regional specificity of exercise and calcium during skeletal growth in girls: a randomized controlled trial. Journal of Bone and Mineral Research 2003;18:156‐162. [DOI] [PubMed] [Google Scholar]
Johnston 1992 {published and unpublished data}
- Johnston CC, Jr, Miller JZ, Slemenda CW, Reister TK, Hui S, Christian JC, Peacock, M. Calcium supplementation and increases in bone mineral density in children. New England Journal of Medicine 1992;327:82‐87. [DOI] [PubMed] [Google Scholar]
- Slemenda CW, Peacock M, Hui S, Zhou L, Johnston CC. Reduced rates of skeletal remodeling are associated with increased bone mineral density during the development of peak skeletal mass. Journal of Bone and Mineral Research 1997;12:676‐82. [DOI] [PubMed] [Google Scholar]
- Slemenda CW, Reister TK, Peacock M, Johnston CC. Bone growth in children following the cessation of calcium supplementation. Journal of Bone and Mineral Research 1993;8:S154. [Google Scholar]
Lee 1994 {published data only}
- Lee WT, Leung SS, Leung DM, Wang SH, Xu YC, Zeng WP, et al. Bone mineral acquisition in low calcium intake children following the withdrawal of calcium supplement. Acta Paediatrica 1997;86:570‐6. [DOI] [PubMed] [Google Scholar]
- Lee WTK, Leung SSF, Wang SH, Xu YC, Zeng WP, Lau J, et al. Double‐blind, controlled calcium supplementation and bone mineral accretion in children accustomed to a low‐calcium diet. AM.‐J.‐CLIN. American Journal of Clinical Nutrition 1994;60:744‐750. [DOI] [PubMed] [Google Scholar]
Lee 1995 {published data only}
- Lee WT, Leung SS, Leung DM, Cheng JC. A follow‐up study on the effects of calcium‐supplement withdrawal and puberty on bone acquisition of children. American Journal of Clinical Nutrition 1996;64:71‐7. [DOI] [PubMed] [Google Scholar]
- Lee WT, Leung SS, Leung DM, Tsang HS, Lau J, Cheng JC. A randomized double‐blind controlled calcium supplementation trial, and bone and height acquisition in children. British Journal of Nutrition 1995;74:125‐139. [DOI] [PubMed] [Google Scholar]
Lloyd 1993 {published data only}
- Lloyd T, Andon MB, Rollings N, Martel JK, Landis JR, Demers LM, et al. Calcium supplementation and bone mineral density in adolescent girls. Journal of the American Medical Association 1993;270:841‐844. [PubMed] [Google Scholar]
- Lloyd T, Martel JK, Rollings N, Andon MB, Kulin H, Demers LM, et al. The effect of calcium supplementation and Tanner Stage on bone density, content and area in teenage women. Osteoporosis International 1996;6:276‐283. [DOI] [PubMed] [Google Scholar]
- Lloyd T, Rollings N, Andon MB, Eggli DF, Mauger E, Chinchilli VM. Enhanced bone gain in early adolesence due to calcium supplementation does not persist in late adolesence. Journal of Bone and Mineral Research 1996:S154. [Google Scholar]
- Lloyd T, Rollings N, Chinchilli VM, Martel JK, Eggli DF, Demers LM, et al. The effect of starting calcium supplementation at age 12 or at age 14 on bone acquisition in teenage girls.. Journal of Bone and Mineral Research 1995;10:S152. [Google Scholar]
Matkovic 2004 {published data only}
- Landoll JD, Badenhop‐Stevens NE, Ha E, Mobley SL, Clairmont A, Matkovic V. Forearm pQCT measurements in young adult women accustomed to different calcium intakes during adolescence. Journal of Bone and Mineral Research 2003;18:S182. [Google Scholar]
- Matkovic V, Badenhop‐Stevens N, Landoll JD, Goel P, Li B. Long term effect of calcium supplementation and dairy products on bone mass of young females. Journal of Bone and Mineral Research 2002:S172. [Google Scholar]
- Matkovic V, Goel PK, Badenhop‐Stevens NE, Landoll JD, Li B, Ilich JZ, et al. Calcium supplementation and bone mineral density in females from childhood to young adulthood: a randomized controlled trial. American Journal of Clinical Nutrition 2005;81(1):175‐88. [DOI] [PubMed] [Google Scholar]
- Matkovic V, Landoll JD, Badenhop‐Stevens NE, Ha EY, Crncevic‐Orlic Z, Li B, et al. Nutrition influences skeletal development from childhood to adulthood: a study of hip, spine, and forearm in adolescent females. Journal of Nutrition 2004;134:701S‐705S. [DOI] [PubMed] [Google Scholar]
Molgaard 2004 {published data only}
- Molgaard C, Thomsen BL, Michaelsen KF. Effect of habitual dietary calcium intake on calcium supplementation in 12‐14‐y‐old girls. American Journal of Clinical Nutrition 2004;80(5):1422‐7. [DOI] [PubMed] [Google Scholar]
Nowson 1997 {published data only}
- Nowson CA, Green RM, Hopper JL, Sherwin AJ, Young D, Kaymakci B, et al. A co‐twin study of the effect of calcium supplementation on bone density during adolescence. Osteoporosis International 1997;7:219‐25. [DOI] [PubMed] [Google Scholar]
Prentice 2005 {published and unpublished data}
- Prentice A, Ginty F, Stear SJ, Jones SC, Laskey MA, Cole TJ. Calcium supplementation increases stature and bone mineral mass of 16‐18 year old boys*. Journal of Clinical Endocrinology and Metabolism 2005. [DOI] [PubMed] [Google Scholar]
Rodda 2004 {published data only}
- Rodda C, Urdampilleta M, Hu J, Strauss B, Briganti E, Gilfillan C. Ethnic differences in effect of calcium supplementation on bone density in peripubertal girls in a double‐blind, placebo‐controlled randomised trial. Australian and New Zealand Bone Mineral Society 2004 Annual Scientific Meeting Final Program and Abstract Book 2004:50. [Google Scholar]
Rozen 2003 {published data only}
- Dodiuk‐Gad RP, Rozen GS, Rennert G, Rennert HS, Ish‐Shalom S. Sustained effect of short‐term calcium supplementation on bone mass in adolescent girls with low calcium intake. American Journal of Clinical Nutrition 2005;81(1):168‐74. [DOI] [PubMed] [Google Scholar]
- Rozen GS, Rennert G, Dodiuk‐Gad RP, Rennert HS, Ish‐Shalom N, Diab G, et al. Calcium supplementation provides an extended window of opportunity for bone mass accretion after menarche. American Journal of Clinical Nutrition 2003;78:993‐8. [DOI] [PubMed] [Google Scholar]
Specker 2003 {published data only}
- Specker B, Binkley T. Randomized trial of physical activity and calcium supplementation on bone mineral content in 3‐ to 5‐year‐old children. Journal of Bone and Mineral Research 2003;18:885‐92. [DOI] [PubMed] [Google Scholar]
Stear 2003 {published and unpublished data}
- Stear SJ, Prentice A, Jones SC, Cole, TJ. Effect of a calcium and exercise intervention on the bone mineral status of 16‐18‐y‐old adolescent girls.. American Journal of Clinical Nutrition 2003;77:985‐992. [DOI] [PubMed] [Google Scholar]
Wang 1996 {published data only}
- Wang S, Xue Y, Li D, Shu S, Zhen W. Effect of calcium supplmentation on bone mineral content in children accustomed to low calcium diet. Acta Nutrimenta Sinica 1996;18(1):97‐102. [Google Scholar]
References to studies excluded from this review
Abrams 2001 {published data only}
- Abrams S. Calcium turnover and nutrition through the life cycle. Proceedings of the Nutrition Society 2001;60:283‐289. [DOI] [PubMed] [Google Scholar]
Adiyaman 2004 {published data only}
- Adiyaman P, Ocal G, Berberoglu M, Evliyaoglu O, Aycan Z, Cetinkaya E. The clinical and radiological assessment of cyclic intravenous pamidronate administration in children with osteogenesis imperfecta. Turkish Journal of Pediatrics 2004; Vol. 46, issue 4:322‐328. [PubMed]
Albertson 1997 {published data only}
- Albertson AM, Tobelmann RC, Marquart L. Estimated dietary calcium intake and food sources for adolescent females: 1980‐92. Journal of Adolescent Health 1997;20:20‐26. [DOI] [PubMed] [Google Scholar]
Ali 2001 {published data only}
- Ali N, Siktberg L. Osteoporosis prevention in female adolescents: calcium intake and exercise participation. Pediatric Nursing 2001;27:132. [PubMed] [Google Scholar]
Anderson 2001 {published data only}
- Anderson JJ. Calcium requirements during adolescence to maximize bone health. JOURNAL OF THE AMERICAN COLLEGE OF NUTRITION 2001;20:186S‐191S. [DOI] [PubMed] [Google Scholar]
Andon 1994 {published data only}
- Andon MB, Lloyd T, Matkovic V. Supplementation trials with calcium citrate malate: evidence in favor of increasing the calcium RDA during childhood and adolescence. Journal of Nutrition 1994;124(Suppl):1412S‐1417S. [DOI] [PubMed] [Google Scholar]
Anonymous 1992 {published data only}
- Anonymous. Maximizing peak bone mass: calcium supplementation increases bone mineral density in children. Nutrition Reviews 1992;50:335‐337. [DOI] [PubMed] [Google Scholar]
Anonymous 1993a {published data only}
- Anonymous. Calcium supplementation in teenage girls. Nurses' Drug Alert 1993;17:77. [Google Scholar]
Anonymous 1993b {published data only}
- Anonymous. Osteoporosis prevention: giving young girls calcium supplements can be helpful. School Nurse News 1993;10:7. [Google Scholar]
Anonymous 1994 {published data only}
- Anonymous. ADA supports efforts to reduce osteoporosis risk and recommends improvements for child nutrition programs. Journal of the American Dietetic Association 1994;94:606. [DOI] [PubMed] [Google Scholar]
Anonymous 1997a {published data only}
- Anonymous. Intake of dietary calcium to reduce the incidence of osteoporosis. Council on Scientific Affairs, American Medical Association. Archives of Family Medicine 1997;6:495‐9. [DOI] [PubMed] [Google Scholar]
Anonymous 1997b {published data only}
- Anonymous. Teens, calcium and osteoporosis. Journal of the American Dental Association 1997;128:154. [DOI] [PubMed] [Google Scholar]
Anonymous 1998 {published data only}
- Anonymous. Food labeling: health claims; calcium consumption by adolescents and adults, bone density and the risk of fractures‐‐FDA. Interim final rule. Federal Register 1998;63:34101‐4. [PubMed] [Google Scholar]
Anonymous 2000 {published data only}
- Anonymous. Osteoporosis prevention, diagnosis, and therapy. NIH Consensus Statement 2000;17:1‐45. [PubMed] [Google Scholar]
Anonymous 2004 {published data only}
- Anonymous. Soft Drinks in Schools. Pediatrics 2004;113(1 I):152‐154. [PubMed] [Google Scholar]
Antoniazzi 2003 {published data only}
- Antoniazzi F, Zamboni G, Bertoldo F, Lauriola S, Mengarda F, Pietrobelli A, et al. Bone mass at final height in precocious puberty after gonadotropin‐releasing hormone agonist with and without calcium supplementation. Journal of Clinical Endocrinology and Metabolism 2003;88:1096‐101. [DOI] [PubMed] [Google Scholar]
Antoniazzi 1999 {published data only}
- Antoniazzi F, Bertoldo F, Lauriola S, Sirpresi S, Gasperi E, Zamboni G, et al. Prevention of bone demineralization by calcium supplementation in precocious puberty during gonadotropin‐releasing hormone agonist treatment.. Journal of Clinical Endocrinology and Metabolism 1999;84:1992‐1996. [DOI] [PubMed] [Google Scholar]
Appleby 1998 {published data only}
- Appleby P. Milk intake and bone mineral acquisition in adolescent girls. Adding milk to adolescent diet may not be best means of preventing osteoporosis.[comment]. British Medical Journal 1998;316:1747; author reply 1747‐8. [PubMed] [Google Scholar]
Ausenhus 1988 {published data only}
- Ausenhus MK. Osteoporosis: prevention during the adolescent and young adult years. Nurse Practitioner 1988;13:42. [PubMed] [Google Scholar]
Badenhop 2004 {published data only}
- Badenhop‐Stevens N, Matkovic V. Calcium needs in children. Orthopaedic Nursing 2004;23(4):228‐34. [DOI] [PubMed] [Google Scholar]
Barker 1998 {published data only}
- Barker M, Lambert HL, Cadogan J, Jones N, Wallace F, Eastell R. Milk supplementation and bone growth in adolescent girls; is the effect ephemeral?. Bone 1998;23:S606. [Google Scholar]
Barr 1998 {published data only}
- Barr SI, McKay HA. Nutrition, exercise, and bone status in youth. International Journal of Sport Nutrition 1998;8:124‐142. [DOI] [PubMed] [Google Scholar]
Barr 2001 {published data only}
- Barr SI, Petit MA, Vigna YM, Prior JC. Eating attitudes and habitual calcium intake in peripubertal girls are associated with initial bone mineral content and its change over 2 years. Journal of Bone and Mineral Research 2001;16:940‐947. [DOI] [PubMed] [Google Scholar]
Bateson 2002 {published data only}
- Bateson A, Finch P. Professional. Do adolescents eat enough calcium?. Community Practitioner 2002;75:428‐31. [Google Scholar]
Berthier 1994 {published data only}
- Berthier AM. Milk products: effective prevention against osteoporosis. Revue‐Laitiere‐Francaise 1994:56. [Google Scholar]
Black 2002 {published data only}
- Black RE, Williams SM, Jones IE, Goulding A. Children who avoid drinking cow milk have low dietary calcium intakes and poor bone health. American Journal of Clinical Nutrition 2002;76:675‐680. [DOI] [PubMed] [Google Scholar]
Blalock 2002 {published data only}
- Blalock SJ, DeVellis BM, Patterson CC, Campbell MK, Orenstein DR, A. Effects of an osteoporosis prevention program incorporating tailored educational materials.. American Journal of Health Promotion 2002;16:146‐156. [DOI] [PubMed] [Google Scholar]
Bonjour 1999 {published data only}
- Bonjour JP, Rizzoli R. [The property of calcium in the child and the adolescent: importance in the acquisition of bone mineral density]. Archives de pediatrie 1999;6 (Suppl 2):155s‐157s. [DOI] [PubMed] [Google Scholar]
Bonofiglio 2004 {published data only}
- Bonofiglio D, Garofalo C, Catalano S, Marsico S, Aquila S, Ando S. Low calcium intake is associated with decreased adrenal androgens and reduced bone age in premenarcheal girls in the last pubertal stages. Journal of Bone and Mineral Metabolism 2004;22(1):64‐70. [DOI] [PubMed] [Google Scholar]
Boot 1997 {published data only}
- Boot AM, Ridder MA, Pols HA, Krenning EP, Muinck Keizer Schrama SM. Bone mineral density in children and adolescents: relation to puberty, calcium intake, and physical activity. Journal of Clinical Endocrinology and Metabolism 1997;82:57‐62. [DOI] [PubMed] [Google Scholar]
Bourges {published data only}
- Bourges O, Dorgeret S, Alberti C, Hugot JP, Sebag G, Cezard JP. [Low bone mineral density in children with Crohn's disease].[see comment]. Archives de Pediatrie 2004;11(7):800‐806. [DOI] [PubMed] [Google Scholar]
Brown 2004 {published data only}
- Brown SJ, Schoenly L. Test of an educational intervention for osteoporosis prevention with U.S. adolescents. Orthopaedic Nursing 2004;23(4):245‐51. [DOI] [PubMed] [Google Scholar]
Burckhardt 2001 {published data only}
- Burckhardt P, Dawson‐Hughes B, Heaney RP. Nutritional aspects of osteoporosis. In: Specker B, Wosje K editor(s). A critical appraisal of the evidence relating calcium and dairy intake to bone health in early life. San Diego: Academic Press, 2001:107‐123. [Google Scholar]
Cadogan 1997 {published data only}
- Cadogan J, Eastell R, Jones N, Barker ME. Milk intake and bone mineral acquisition in adolescent girls: randomised, controlled intervention trial. British Medical Journal 1997;315:1255‐1260. [DOI] [PMC free article] [PubMed] [Google Scholar]
Carter 2001 {published data only}
- Carter LM, Whiting SJ, Drinkwater DT, Zello GA, Faulkner RA, Bailey DA. Self‐reported calcium intake and bone mineral content in children and adolescents. Journal of the American College of Nutrition 2001;20:502‐9. [DOI] [PubMed] [Google Scholar]
Chan 1987 {published data only}
- Chan GM, McMurry M, Westover K, et al. Effects of increased dietary calcium intake upon the calcium and bone mineral status of lactating adolescent and adult women. American Journal of Clinical Nutrition 1987;46:319‐323. [DOI] [PubMed] [Google Scholar]
Chan 1991 {published data only}
- Chan GM. Dietary calcium and bone mineral status of children and adolescents. American Journal of Diseases of Children 1991;145:631‐634. [DOI] [PubMed] [Google Scholar]
Chan 1995 {published data only}
- Chan GM, Hoffman K, McMurry M. Effects of dairy products on bone and body composition in pubertal girls.. Journal of Pediatrics 1995;126:551‐56. [DOI] [PubMed] [Google Scholar]
Cheng 1999 {published data only}
- Cheng JC, Maffulli N, Leung SS, Lee WT, Lau JT, Chan KM. Axial and peripheral bone mineral acquisition: a 3‐year longitudinal study in Chinese adolescents. European Journal of Pediatrics 1999;158:506‐12. [DOI] [PubMed] [Google Scholar]
Chevalley 2004 {published data only}
- Chevalley T, Bonjour JP, Rizzoli R. [Modifying bone mass in child and adolescent: why?] [Ameliorer la masse osseuse chez l'enfant et l'adolescent: pourquoi, comment?]. Schweizerische Rundschau fur Medizin Praxis 2004;93:415‐21. [DOI] [PubMed] [Google Scholar]
Clements 1991 {published data only}
- Clements D, Harding K. Strategies for preventing osteoporosis.[comment]. British Medical Journal 1991;303:1060. [DOI] [PMC free article] [PubMed] [Google Scholar]
DeBar 2004 {published data only}
- DeBar LL, Ritenbaugh C, Vuckovic N, Stevens VJ, Aickin M, Elliot D, et al. YOUTH: decisions and challenges in designing an osteoporosis prevention intervention for teen girls. Preventive Medicine 2004;39(5):1047‐55. [DOI] [PubMed] [Google Scholar]
DiMeglio 2005 {published data only}
- DiMeglio LA, Ford L, McClintock C, Peacock M. A comparison of oral and intravenous bisphosphonate therapy for children with osteogenesis imperfecta.. Journal of Pediatric Endocrinology & Metabolism 2005;18(1):43‐53. [DOI] [PubMed] [Google Scholar]
Dowd 2001 {published data only}
- Dowd R. Role of calcium, vitamin D, and other essential nutrients in the prevention and treatment of osteoporosis. Nursing Clinics of North America 2001;36:417‐431. [PubMed] [Google Scholar]
Du 2002 {published data only}
- Du XQ, Greenfield H, Fraser DR, Ge KY, Liu ZH, He W. Milk consumption and bone mineral content in Chinese adolescent girls. Bone 2002;30:521‐528. [DOI] [PubMed] [Google Scholar]
Du 2004 {published data only}
- Du XQ, Zhu K, Trube A, Zhang Q, Ma GS, Hu XQ, et al. School‐milk intervention trial enhances growth and bone mineral accretion in Chinese girls aged 10‐12 years in Beijing. British Journal of Nutrition 2004;92:159‐168. [DOI] [PubMed] [Google Scholar]
Edwards 1998 {published data only}
- Edwards M. Health promotion: maximising bone mass in young women. Community Practitioner 1998;71:256‐9. [Google Scholar]
El‐Husseini 2004 {published data only}
- El‐Husseini AA, El‐Agroudy AE, El‐Sayed MF, Sobh MA, Ghoneim MA. Treatment of osteopenia and osteoporosis in renal transplant children and adolescents. Pediatric Transplantation 2004;8(4):357‐361. [DOI] [PubMed] [Google Scholar]
Elgan 2002 {published data only}
- Elgan C, Dykes AK, Samsioe G. Bone mineral density and lifestyle among female students aged 16‐24 years. Gynecological Endocrinology 2002;16:91‐98. [DOI] [PubMed] [Google Scholar]
Feskanich 1997 {published data only}
- Feskanich D, Willett WC, Stampfer MJ, Colditz GA. Milk, dietary calcium, and bone fractures in women: a 12‐year prospective study. American Journal of Public Health 1997;87:992‐7. [DOI] [PMC free article] [PubMed] [Google Scholar]
Fischer 1999a {published data only}
- Fischer GS, Milinarsky TA, Giadrosich RV, Casanova ZD. Effects of calcium supplementation on bone density in girls. Revista‐Medica‐de‐Chile 1999;127:23‐27. [PubMed] [Google Scholar]
Fischer 1999b {published data only}
- Fischer S, Milinarsky A, Giadrosich V, Casanova D. [Calcium supplementation and bone absorptiometry in girls]. Revista Medica de Chile 1999;127:23‐7. [PubMed] [Google Scholar]
Fisher 2004 {published data only}
- Fisher JO, Mitchell DC, Smiciklas‐Wright H, Mannino ML, Birch LL. Meeting calcium recommendations during middle childhood reflects mother‐daughter beverage choices and predicts bone mineral status. American Journal of Clinical Nutrition 2004;79:698‐706. [DOI] [PMC free article] [PubMed] [Google Scholar]
Fujita 1992 {published data only}
- Fujita T, Fukase M. Comparison of osteoporosis and calcium intake between Japan and the United States. Proceedings of the Society for Experimental Biology & Medicine 1992;200:149‐152. [DOI] [PubMed] [Google Scholar]
Gharib 2004 {published data only}
- Gharib S. An IV drug for osteoporosis?. Harvard Health Letter 2004;29(8):8. [PubMed] [Google Scholar]
Gibbons 2004 {published data only}
- Gibbons MJ, Gilchrist NL, Frampton C, Maguire P, Reilly PH, March RL, et al. The effects of a high calcium dairy food on bone health in pre‐pubertal children in New Zealand. Asia Pacific Journal of Clinical Nutrition 2004;13(4):341‐7. [PubMed] [Google Scholar]
Ginty 2004 {published data only}
- Ginty F, Prentice A. Can osteoporosis be prevented with dietary strategies during adolescence?[comment]. British Journal of Nutrition 2004;92:5‐6. [DOI] [PubMed] [Google Scholar]
Goulding 2004 {published data only}
- Goulding A, Rockell JEP, Black RE, Grant AM, Jones IE, Williams SM. Children who avoid drinking cow's milk are at increased risk for prepubertal bone fractures. Journal of the American Dietetic Association 2004;104:250‐253. [DOI] [PubMed] [Google Scholar]
Griffiths 1998 {published data only}
- Griffiths ID, Francis RM. Milk intake and bone mineral acquisition in adolescent girls. Results in two groups are not so different. British Medical Journal 1998;316:1747. [PubMed] [Google Scholar]
Grossklaus 1998 {published data only}
- Grossklaus R. [The significance of milk and dairy product consumption in the prevention of osteoporosis.]. Molkerei Zeitung Welt der Milch 1998;52:9‐11. [Google Scholar]
Gulati 2005 {published data only}
- Gulati S, Gulati K. Bone disease in nephrotic syndrome ‐ Prevention is better than cure. Pediatric Nephrology 2005;20(1):111‐112. [DOI] [PubMed] [Google Scholar]
Hampton 2004 {published data only}
- Hampton T. Experts urge early investment in bone health. Journal of the American Medical Association 2004;291(7):811‐2. [DOI] [PubMed] [Google Scholar]
Harel 1998 {published data only}
- Harel Z, Riggs S, Vaz R, White L, Menzies G. Adolescents and calcium: what they do and do not know and how much they consume. Journal of Adolescent Health 1998;22:225‐8. [DOI] [PubMed] [Google Scholar]
Henderson 1994 {published data only}
- Henderson RC, Hayes PR. Bone mineralization in children and adolescents with a milk allergy. Bone and Mineral 1994;27:1‐12. [DOI] [PubMed] [Google Scholar]
Hidvegi 2003 {published data only}
- Hidvegi E, Arato A, Cserhati E, Horvath C, Szabo A. Slight decrease in bone mineralization in cow milk‐sensitive children. Journal of Pediatric Gastroenterology and Nutrition 2003;36:44‐49. [DOI] [PubMed] [Google Scholar]
Homik 2005 {published data only}
- Homik J, Suarez‐Almazor ME, Shea B, Cranney A, Wells G, Tugwell P. Calcium and vitamin D for corticosteroid‐induced osteoporosis.. Cochrane Database of Systematic Reviews 2005, Issue 4. [DOI] [PMC free article] [PubMed] [Google Scholar]
Hoppe 2000 {published data only}
- Hoppe C, Molgaard C, Michaelsen KF. Bone size and bone mass in 10‐year‐old Danish children: effect of current diet. Osteoporosis International 2000;11:1024‐1030. [DOI] [PubMed] [Google Scholar]
Hosokawa 1996 {published data only}
- Hosokawa M, Yanagi H, Kawanami K, Tanaka K, Kobayashi K, Amagai H, et al. [Relationship between dietary life style in youth and osteoporosis]. Nippon‐Koshu‐Eisei‐Zasshi 1996;43:606‐614. [PubMed] [Google Scholar]
Howat 2001 {published data only}
- Howat PM, Crombie A, Brooks ER. Dietary/supplement intake and bone mineral density. Journal of the American Dietetic Association 2001;101:520‐521. [DOI] [PubMed] [Google Scholar]
Iki 2003 {published data only}
- Iki M. [Evidence‐based evaluation of preventive procedures for osteoporosis, osteoporotic fractures and other diseases]. Nippon Eiseigaku Zasshi ‐ Japanese Journal of Hygiene 2003;58:311‐6. [DOI] [PubMed] [Google Scholar]
Ilich 1996 {published data only}
- Ilich JZ, Badenhop NE, Matkovic V. Primary prevention of osteoporosis: pediatric approach to disease of the elderly. Womens Health Issues 1996;6:194‐203. [DOI] [PubMed] [Google Scholar]
Infante 2000 {published data only}
- Infante D, Tormo R. Risk of inadequate bone mineralization in diseases involving long‐term suppression of dairy products. Journal of Pediatric Gastroenterology and Nutrition 2000;30:310‐313. [DOI] [PubMed] [Google Scholar]
Kalkwarf 1997 {published data only}
- Kalkwarf HJ, Specker BL, Bianchi DC, Ranz JHM. The effect of calcium supplementation on bone density during lactation and after weaning.[see comment].. New England Journal of Medicine 1997;337:523‐528. [DOI] [PubMed] [Google Scholar]
Kalkwarf 2003 {published data only}
- Kalkwarf HJ, Khoury JC, Lanphear BP. Milk intake during childhood and adolescence, adult bone density, and osteoporotic fractures in US women.[see comment]. American Journal of Clinical Nutrition 2003;77:257‐65. [DOI] [PubMed] [Google Scholar]
Kalusk 2001 {published data only}
- Kalusk DN, Basch CE, Zybert P, Deckelbaum RJ, Shea S. Calcium intake in preschool children ‐ A study of dietary patterns in a low socioeconomic community. Public Health Reviews 2001;29:71‐83. [PubMed] [Google Scholar]
Kanis 1994 {published data only}
- Kanis JA. Calcium nutrition and its implications for osteoporosis. 1. Children and healthy adults. European‐Journal‐of‐Clinical‐Nutrition 1994;48:757‐767. [PubMed] [Google Scholar]
Kardinaal 1999 {published data only}
- Kardinaal AF, Ando S, Charles P, Charzewska J, Rotily M, Vaananen K, et al. Dietary calcium and bone density in adolescent girls and young women in Europe. Journal of Bone and Mineral Research 1999;14:583‐592. [DOI] [PubMed] [Google Scholar]
Kasper 2001 {published data only}
- Kasper MJ, Peterson MG, Allegrante JP. The need for comprehensive educational osteoporosis prevention programs for young women: results from a second osteoporosis prevention survey. Arthritis & Rheumatism 2001;45:28‐34. [DOI] [PubMed] [Google Scholar]
Kerstetter 1995 {published data only}
- Kerstetter JE, Insogna K. Do dairy products improve bone density in adolescent girls?. Nutrition Reviews 1995;53:328‐332. [DOI] [PubMed] [Google Scholar]
Koenig 2000 {published data only}
- Koenig J, Elmadfa I. Status of calcium and vitamin D of different population groups in Austria. International Journal for Vitamin and Nutrition Research 2000;70:214‐220. [DOI] [PubMed] [Google Scholar]
Kowalski 2004 {published data only}
- Kowalski IM, Siwik P, Skibniewska K. Compression fractures of the spine ‐ Juvenile osteopeny. Eurorehab. Issue 2004;2(pp 53‐59). [Google Scholar]
Kreipe 1995 {published data only}
- Kreipe RE. Bone mineral density in adolescents. Pediatric Annals 1995;24:308‐15. [DOI] [PubMed] [Google Scholar]
Kubota 2003 {published data only}
- Kubota M. [Optimization of calcium intake for the prevention of osteoporosis and osteoporotic fractures: a review of the evidence]. Nippon Eiseigaku Zasshi ‐ Japanese Journal of Hygiene 2003;58:317‐27. [DOI] [PubMed] [Google Scholar]
Kun 2001 {published data only}
- Kun Z, Greenfield H, Xueqin D, Fraser DR. Improvement of bone health in childhood and adolescence. Nutrition Research Reviews 2001;14:119‐151. [DOI] [PubMed] [Google Scholar]
Lappe 2004 {published data only}
- Lappe JM, Rafferty KA, Davies KM, Lypaczewski G. Girls on a high‐calcium diet gain weight at the same rate as girls on a normal diet: A pilot study. Journal of the American Dietetic Association 2004;104:1361‐1367. [DOI] [PubMed] [Google Scholar]
LaRosa 2004 {published data only}
- LaRosa DF, Apter AJ. Preventing and managing osteoporosis in patients with asthma and COPD.. Journal of Respiratory Diseases 2004;25(10):426‐8. [Google Scholar]
Lau 1992 {published data only}
- Lau EMC, Lee WTK, Leung S, Cheng J. Milk supplementation ‐ A feasible and effective way to enhance bone gain for Chinese adolescents in Hong Kong?. Journal of Applied Nutrition 1992;44:16‐21. [Google Scholar]
Lau 2004 {published data only}
- Lau EMC, Lynn H, Chan YH, Lau W, Woo J. Benefits of milk powder supplementation on bone accretion in Chinese children. Osteoporosis International 2004;15:654‐658. [DOI] [PubMed] [Google Scholar]
Lee 1993 {published data only}
- Lee WT, Leung SS, Lui SS, Lau J. Relationship between long‐term calcium intake and bone mineral content of children aged from birth to 5 years. British Journal of Nutrition 1993;70:235‐248. [DOI] [PubMed] [Google Scholar]
Lee 2003 {published data only}
- Lee SM, Reicks M. Environmental and behavioral factors are associated with the calcium intake of low‐income adolescent girls. Journal of the American Dietetic Association 2003;103:1526‐1529. [DOI] [PubMed] [Google Scholar]
Levers‐Landis 2003 {published data only}
- Levers‐Landis CE, Burant C, Drotar D, Morgan L, Trapl ES, Kent Kwoh C. Social support, knowledge, and self‐efficacy as correlates of osteoporosis preventive behaviors among preadolescent females. Journal of Pediatric Psychology 2003;28:335‐345. [DOI] [PubMed] [Google Scholar]
Li 2002 {published data only}
- Li J, Li H, Wang S. [Effects of calcium supplementation on bone mineral accretion in adolescents]. Wei Sheng Yan Jiu 2002;31:363‐6. [PubMed] [Google Scholar]
Lloyd 2000 {published data only}
- Lloyd T, Chinchilli VM, Johnson Rollings N, Kieselhorst K, Eggli DF, Marcus R. Adult female hip bone density reflects teenage sports‐exercise patterns but not teenage calcium intake. Pediatrics 2000;106:40‐44. [DOI] [PubMed] [Google Scholar]
Lloyd 2002 {published data only}
- Lloyd T, Beck TJ, Lin HM, Tulchinsky M, Eggli DF, Oreskovic TL, et al. Modifiable determinants of bone status in young women. Bone 2002;30:416‐421. [DOI] [PubMed] [Google Scholar]
Lysen 1997 {published data only}
- Lysen VC, Walker R. Osteoporosis risk factors in eighth grade students. Journal of School Health 1997;67:317‐21. [DOI] [PubMed] [Google Scholar]
Ma 2004 {published data only}
- Ma D, Jones G. Soft drink and milk consumption, physical activity, bone mass, and upper limb fractures in children: a population‐based case‐control study. Calcified Tissue International 2004;75(4):286‐91. [DOI] [PubMed] [Google Scholar]
Mackelvie 2001 {published data only}
- Mackelvie KJ, McKay HA, Khan KM, Crocker PR. Lifestyle risk factors for osteoporosis in Asian and Caucasian girls. Medicine and Science in Sports and Exercise 2001;33:181‐1824. [DOI] [PubMed] [Google Scholar]
Magee 1996 {published data only}
- Magee M, Moyer‐Mileur L, Chan, G. Bone mineralization and dietary intake in adolescent females following cessation of dairy supplementation.. Journal of the American Dietetic Association 1996;96(9 Suppl):A‐56. [Google Scholar]
Maggiolini 1999 {published data only}
- Maggiolini M, Bonofiglio D, Giorno A, Catalano S, Marsico S, Aquila S, et al. The effect of dietary calcium intake on bone mineral density in healthy adolescent girls and young women in southern Italy. International Journal of Epidemiology 1999;28:479‐484. [DOI] [PubMed] [Google Scholar]
Mahana 1988 {published data only}
- Mahana D. [Risk of osteoporosis in Chilean adolescents caused by low calcium ingestion]. Revista‐Medica‐de‐Chile 1988;116:482‐483. [PubMed] [Google Scholar]
Mallet 2000 {published data only}
- Mallet E. [Do children and adolescents need supplements during puberty of calcium and vitamin D?].[comment]. Archives de Pediatrie 2000;7:117‐20. [DOI] [PubMed] [Google Scholar]
Mallet 2003 {published data only}
- Mallet E. [Osteoporosis in adolescents]. Archives de Pediatrie 2003;10 Suppl 1:204s‐205s. [DOI] [PubMed] [Google Scholar]
Marrero 2004 {published data only}
- Marrero Montelongo M, Navarro Rodriguez MC, Lainez Sevillano P, Torres Garcia M, Serra Majem L. Present intake of calcium from lactic products in the 6 to 75 year old Canary Islands population. Data from the Canary Islands Nutritional Survey (ENCA). [Spanish]. Revista Espanola de Enfermedades Metabolicas Oseas 2004;13(2):25‐29. [Google Scholar]
Martin 2004 {published data only}
- Martin JT, Coviak CP, Gendler P, Kim KK, Cooper K, Rodrigues‐Fisher L. Female adolescents' knowledge of bone health promotion behaviors and osteoporosis risk factors. Orthopaedic Nursing 2004;23(4):235‐44. [DOI] [PubMed] [Google Scholar]
Matkovic 1990 {published data only}
- Matkovic V, Fontana D, Tominac C, Goel P, Chesnut CH, 3rd. Factors that influence peak bone mass formation: a study of calcium balance and the inheritance of bone mass in adolescent females.. American Journal of Clinical Nutrition 1990;52:878‐88. [DOI] [PubMed] [Google Scholar]
Matkovic 2002 {published data only}
- Matkovic V, Badenhop Stevens N, Ha E, Crncevic Orlic Z, Clairmont A. Nutrition and Bone Health in Children and Adolescents. Clinical Reviews in Bone and Mineral Metabolism 2002;1:233‐248. [Google Scholar]
McCulloch 1990 {published data only}
- McCulloch R, Bailey D, Houston S, Dodd B. Effects of physical activity, dietary calcium intake and selected lifestyle factors on bone density in young women. Canadian Medical Association Journal 1990;142:221‐227. [PMC free article] [PubMed] [Google Scholar]
Meier 2004 {published data only}
- Meier C, Woitge HW, Witte K, Lemmer B, Seibel MJ. Supplementation with oral vitamin d3 and calcium during winter prevents seasonal bone loss: a randomized controlled open‐label prospective trial. Journal of Bone and Mineral Research 2004;19(8):1221‐30.. [DOI] [PubMed] [Google Scholar]
Merrilees 2000 {published data only}
- Merrilees MJ, Smart EJ, Gilchrist NL, Frampton C, Turner JG, Hooke E, et al. Effects of dairy food supplements on bone mineral density in teenage girls. European Journal of Nutrition 2000;39:256‐262. [DOI] [PubMed] [Google Scholar]
Meschino 2004 {published data only}
- Meschino J. Calcium Supplementation Increases Bone Density in Teenage Girls. Dynamic Chiropractic 2004;22. [Google Scholar]
Moelgaard 2001 {published data only}
- Moelgaard C, Thomsen BL, Michaelsen KF. The Influence of Calcium Intake and Physical Activity on Bone Mineral Content and Bone Size in Healthy Children and Adolescents. Osteoporosis International 2001;12:887‐894. [DOI] [PubMed] [Google Scholar]
Monge 2001 {published data only}
- Monge Rojas R, Nunez HP. Dietary calcium intake by a group of 13 18‐year‐old Costa Rican teenagers. Archivos Latinoamericanos De Nutricion 2001;51:127‐131. [PubMed] [Google Scholar]
Moya 1997 {published data only}
- Moya M. [Calcium supplements in pediatrics: facts and fiction]. Anales Espanoles de Pediatria 1997;46:427. [PubMed] [Google Scholar]
Moyer‐Mileur 2003 {published data only}
- Moyer‐Mileur LJ, Xie B, Ball SD, Pratt T. Bone mass and density response to a 12‐month trial of calcium and vitamin D supplement in preadolescent girls. Journal of Musculoskeletal Neuronal Interactions 2003;3:63‐70. [PubMed] [Google Scholar]
Naunton 2004 {published data only}
- Naunton M, Peterson GM, Jones G, Griffin GM, Bleasel MD. Multifaceted educational program increases prescribing of preventive medication for corticosteroid induced osteoporosis. Journal of Rheumatology 2004;31(3):550‐6. [PubMed] [Google Scholar]
Neville 2002 {published data only}
- Neville CE, Robson PJ, Murray LJ, Strain JJ, Twisk J, Gallagher AM, et al. The effect of nutrient intake on bone mineral status in young adults: The Northern Ireland young hearts project. Calcified Tissue International 2002;70:89‐98. [DOI] [PubMed] [Google Scholar]
New 1998 {published data only}
- New S, Ferns G, Starkey B. Milk intake and bone mineral acquisition in adolescent girls. Increases in bone density may be result of micronutrients in additional cereal. British Medical Journal 1998;316:1747. [PMC free article] [PubMed] [Google Scholar]
NIH 2001 {published data only}
- NIH Consensus Development Panel on Osteoporosis Prevention D, Therapy. Osteoporosis prevention, diagnosis, and therapy.[see comment]. Journal of the American Medical Association 2001;285:785‐95. [DOI] [PubMed] [Google Scholar]
Novotny 2004 {published data only}
- Novotny R, Daida YG, Grove JS, Acharya S, Vogt TM, Paperny D. Adolescent dairy consumption and physical activity associated with bone mass. Preventive Medicine 2004;39:355‐360. [DOI] [PubMed] [Google Scholar]
Nowson 1995 {published data only}
- Nowson CA, Green RM, Guest CS, Larkins RG, Sherwin AJ, Hopper JL, et al. The effect of calcium supplementation for 18 months on bone mass in adolescent female twins. Proceedings‐of‐the‐Nutrition‐Society‐of‐Australia 1995;19:56. [Google Scholar]
O' Brien 1998 {published data only}
- O' Brien KO, Abrams SA, Liang LK, Ellis KJ, Gagel RF. Bone turnover response to changes in calcium intake is altered in girls and adult women in families with histories of osteoporosis. Journal of Bone and Mineral Research 1998;13:491‐499. [DOI] [PubMed] [Google Scholar]
Oellingrath 1989 {published data only}
- Oellingrath IM. [Can calcium in the diet prevent osteoporosis and high blood pressure?]. Meieriposten 1989;78:33‐36. [Google Scholar]
Ohgitani 1997 {published data only}
- Ohgitani S, Fujii Y, Fujita T. [Effects of calcium supplementation using AAACa or milk on nocturnal bone resorption in young women]. [Japanese].. Nippon Ronen Igakkai Zasshi ‐ Japanese Journal of Geriatrics. 1997;34:743‐747. [DOI] [PubMed] [Google Scholar]
Oria 2003 {published data only}
- Oria E. Preventive and nutritional factors of osteoporosis. [Spanish]. Anales del Sistema Sanitario de Navarra 2003;26:81‐90. [PubMed] [Google Scholar]
Parr 2002 {published data only}
- Parr RM, Dey A, McCloskey EV, Aras N, Balogh A, Borelli A, et al. Contribution of calcium and other dietary components to global variations in bone mineral density in young adults. Food and Nutrition Bulletin 2002;23(Suppl 3):180‐184. [PubMed] [Google Scholar]
Pena 2004 {published data only}
- Pena MJM, Gonzalez‐Montero R. Management of the metabolic alterations in children infected with HIV. [Spanish, English]. Nutrition & Metabolic Disorders in HIV Infection 2004;3(2):361‐371. [Google Scholar]
Peterson 2000 {published data only}
- Peterson BA, Klesges RC, Kaufman EM, Cooper TV, Vukadinovich CM. The effects of an educational intervention on calcium intake and bone mineral content in young women with low calcium intake.. American Journal of Health Promotion 2000;14:149‐156. [DOI] [PubMed] [Google Scholar]
Piaseu 2002 {published data only}
- Piaseu N, Schepp K, Belza B. Causal analysis of exercise and calcium intake behaviors for osteoporosis prevention among young women in Thailand.. Health Care for Women International 2002;23:364‐376. [DOI] [PubMed] [Google Scholar]
Picard 1988 {published data only}
- Picard D, Ste‐Marie LG, Coutu D, Carrier L, Chartrand R, Lepage R, et al. Premenopausal bone mineral content relates to height, weight and calcium intake during early adulthood. Bone and Mineral 1988;4:299‐309. [PubMed] [Google Scholar]
Portsmouth 1994 {published data only}
- Portsmouth K, Henderson K, Graham N, Price R, Cole J, Allen J. Dietary calcium intake in 18‐year‐old women: comparison with recommended daily intake and dietary energy intake. Journal of Advanced Nursing 1994;20:1073‐8. [DOI] [PubMed] [Google Scholar]
Prestridge 1993 {published data only}
- Prestridge LL, Schanler RJ, Shulman RJ, Burns PA, Laine LL. Effect of parenteral calcium and phosphorus therapy on mineral retention and bone mineral content in very low birth weight infants. Journal of Pediatrics 1993;122:761‐8. [DOI] [PubMed] [Google Scholar]
Prynne 2004 {published data only}
- Prynne CJ, Ginty F, Paul AA, Bolton‐Smith C, Stear SJ, Jones SC, et al. Dietary acid‐base balance and intake of bone‐related nutrients in Cambridge teenagers.. European Journal of Clinical Nutrition 2004;58(11):1462‐71. [DOI] [PubMed] [Google Scholar]
Purdie 1994 {published data only}
- Purdie DW. Bone density and milk. Target schoolchildren for intervention.[comment]. British Medical Journal 1994;308:1566. [PMC free article] [PubMed] [Google Scholar]
Recker 1993 {published data only}
- Recker RR. Prevention of osteoporosis: calcium nutrition. Osteoporosis International 1993;3 Suppl 1:163‐5. [DOI] [PubMed] [Google Scholar]
Reid 1998 {published data only}
Remer 2002 {published data only}
- Remer T, Boye KR, Manz F. Long‐term increase in bone mass through high calcium intake before puberty. Lancet 2002;359:2037‐2038. [DOI] [PubMed] [Google Scholar]
Renner 1991a {published data only}
- Renner E, Knie G, Schatz H, Stracke H, Weber K, Minne HW, et al. On the incidence of osteoporosis in relation to the calcium intake with milk and milk products. International‐Dairy‐Journal 1991;1:77‐82. [Google Scholar]
Renner 1991b {published data only}
- Renner E, Knie G, Stracke H. Effect of calcium intake through milk and dairy products on bone mineral content and incidence of osteoporosis. Milchwissenschaft Giessen 1991. [Google Scholar]
Renner 1994 {published data only}
- Renner E. Dairy calcium, bone metabolism, and prevention of osteoporosis. Journal of Dairy Science 1994;77:3498‐505. [DOI] [PubMed] [Google Scholar]
Renner 1998 {published data only}
- Renner E, Hermes M, Stracke H. Bone mineral density of adolescents as affected by calcium intake through milk and milk products. International Dairy Journal 1998;8:759‐764. [Google Scholar]
Roberts 2000 {published data only}
- Roberts SB, Heyman MB. Micronutrient shortfalls in young children's diets: common, and owing to inadequate intakes both at home and at child care centers. Nutrition Reviews 2000;58:27‐29. [DOI] [PubMed] [Google Scholar]
Robertson 2005 {published data only}
- Robertson L. 4 proven steps to stronger bones and a healthier body: don't assume that the calcium you consume ends up in your bones. Vibrant Life 2005;21(1):10‐2. [Google Scholar]
Roux 1995 {published data only}
- Roux C. Calcium supplementation for the prevention and treatment of osteoporosis. Revue du Rhumatisme 1995;62:729‐732. [PubMed] [Google Scholar]
Rozen 2001 {published data only}
- Rozen GS, Rennert G, Rennert HS, Diab G, Daud D, Ish‐Shalom S. Calcium intake and bone mass development among Israeli adolescent girls. Journal of the American College of Nutrition 2001;20:219‐24. [DOI] [PubMed] [Google Scholar]
Ruiz 1995 {published data only}
- Ruiz JC, Mandel C, Garabedian M. Influence of spontaneous calcium intake and physical exercise on the vertebral and femoral bone mineral density of children and adolescents. Journal of Bone and Mineral Research 1995;10:675‐82. [DOI] [PubMed] [Google Scholar]
Runyan 2003 {published data only}
- Runyan SM, Stadler DD, Bainbridge CN, Miller SC, Moyer‐Mileur LJ. Familial resemblance of bone mineralization, calcium intake, and physical activity in early‐adolescent daughters, their mothers, and maternal grandmothers. Journal of the American Dietetic Association 2003;103:1320‐1325. [DOI] [PubMed] [Google Scholar]
Sagara 2002 {published data only}
- Sagara T, Nishijo M, Hirokawa W, Morikawa Y, Miura K, Tabata M, et al. [The effects of nutrition and life‐style on calcaneal bone mass in high school students]. Nippon‐Koshu‐Eisei‐Zasshi 2002;49:389‐398. [PubMed] [Google Scholar]
Saggese {published data only}
- Saggese G, Betelloni S, Baroncelli GI, Perri G, Calderazzi A. Mineral metabolism and calcitriol therapy in idiopathic juvenile osteoporosis. American Journal of Diseases of Children 1991;149:457‐462. [DOI] [PubMed] [Google Scholar]
Sakkers 2004 {published data only}
- Sakkers R, Kok D, Engelbert R, Dongen A, Jansen M, Pruijs H, et al. Skeletal effects and functional outcome with olpadronate in children with osteogenesis imperfecta: a 2‐year randomised placebo‐controlled study.. Lancet 2004:1427‐31. [DOI] [PubMed] [Google Scholar]
Scholz 1993 {published data only}
- Scholz Ahrens KE, Jaeger W, Barth CA. Milch und Milchprodukte in der Praevention der Osteoporose. [Milk and dairy products in the prevention of osteoporosis.]. Molkerei Zeitung Welt der Milch 1993;47:5‐8. [Google Scholar]
Schonau 2004 {published data only}
- Schonau E. The peak bone mass concept: Is it still relevant?. Pediatric Nephrology 2004;19(8):825‐831. [DOI] [PubMed] [Google Scholar]
Smart 1994 {published data only}
- Smart EJ, Gilchrist NL, Turner JC, March R, Maguire P, Sadler WA, et al. The effects of dairy supplementation on bone mineral density on teenage girls: baseline randomisation data. Proceedings of the Nutrition Society of New Zealand 1994;19:73‐80. [Google Scholar]
Solomons 1996 {published data only}
- Solomons NW, Kirstetter J, Insogna K. The effects of dairy products on body composition, bone mineralization, and weight in adolescent girls. Nutrition Reviews 1996;54:64‐65. [DOI] [PubMed] [Google Scholar]
Soroko 1994 {published data only}
- Soroko S, Holbrook TL, Edelstein S, Barrett‐Connor E. Lifetime milk consumption and bone mineral density in older women. American Journal of Public Health 1994;84:1319‐22. [DOI] [PMC free article] [PubMed] [Google Scholar]
Specker 1997 {published data only}
- Specker BL, Beck A, Kalkwarf H, Ho M. Randomized trial of varying mineral intake on total body bone mineral accretion during the first year of life. Pediatrics 1997;99:E12. [DOI] [PubMed] [Google Scholar]
Specker 1999 {published data only}
- Specker BL, Mulligan L, Ho M. Longitudinal Study of Calcium Intake, Physical Activity, and Bone Mineral Content in Infants 6‐18 Months of Age. Journal of Bone and Mineral Research 1999;14:569‐576. [DOI] [PubMed] [Google Scholar]
Specker 2002 {published data only}
- Specker B, Binkley T, Wermers J. Randomized trial of physical activity and calcium supplementation on BMC in 3‐5 year old healthy children: the South Dakota Children's Health Study. Journal of Bone and Mineral Research 2002;19:S. [DOI] [PubMed] [Google Scholar]
Stallings 1994 {published data only}
- Stallings VA, Oddleifson NW, Negrini BY, Zemel BS, Wellens R. Bone mineral content and dietary calcium intake in children prescribed a low‐lactose diet. Journal of Pediatric Gastroenterology and Nutrition 1994;18:440‐445. [DOI] [PubMed] [Google Scholar]
Szumera 2004 {published data only}
- Szumera M, Sikorska‐Wisniewska G, Gumkowska‐Kaminska B, Landowski P, Korzon M. Does a gluten‐free diet and therapy influence a bone mineralisation in children with celiac disease?. [Polish]. Pediatria Wspolczesna 2004;6(3):289‐293. [Google Scholar]
Taha 2001 {published data only}
- Taha W, Chin D, Silverberg AI, Lashiker L, Khateeb N, Anhalt H. Reduced spinal bone mineral density in adolescents of an Ultra‐Orthodox Jewish community in Brooklyn. Pediatrics 2001;107:E79. [DOI] [PubMed] [Google Scholar]
Teegarden 1994 {published data only}
- Teegarden D, Weaver CM. Calcium supplementation increases bone density in adolescent girls.. Nutrition Reviews. 1994;52:171‐173. [DOI] [PubMed] [Google Scholar]
Teegarden 1999 {published data only}
- Teegarden D, Lyle RM, Proulx WR, Johnston CC, Weaver CM. Previous milk consumption is associated with greater bone density in young women. American Journal of Clinical Nutrition 1999;69:1014‐1017. [DOI] [PubMed] [Google Scholar]
Teesalu 1996 {published data only}
- Teesalu S, Vihalemm T, Vaasa IO. Nutrition in prevention of osteoporosis. Scandinavian Journal of Rheumatology ‐ Supplement 1996;103:81‐2:81‐2; discussion 83. [DOI] [PubMed] [Google Scholar]
ter Meulen 2004 {published data only}
- ter Meulen CG, Riemsdijk I, Hene RJ, Christiaans MH, Borm GF, Corstens FH, et al. 36. No important influence of limited steroid exposure on bone mass during the first year after renal transplantation: a prospective, randomized, multicenter study. Transplantation 2004;78(1):101‐6. [DOI] [PubMed] [Google Scholar]
Torres 2004 {published data only}
- Torres A, Garcia S, Gomez A, Gonzalez A, Barrios Y, Concepcion MT, et al. Treatment with intermittent calcitriol and calcium reduces bone loss after renal transplantation. Kidney International 2004;65(2):705‐12. [DOI] [PubMed] [Google Scholar]
Tortolani 2002 {published data only}
- Tortolani PJ, McCarthy EF, Sponseller PD. Bone mineral density deficiency in children. Journal of the American Academy of Orthopaedic Surgeons 2002;10:57‐66. [DOI] [PubMed] [Google Scholar]
Tounian 2003 {published data only}
- Tounian P. [Nutritional risk in children]. Archives de Pediatrie 2003;10 Suppl 1:28s‐29s. [DOI] [PubMed] [Google Scholar]
Tsukahara 1997 {published data only}
- Tsukahara N, Sato K, Ezawa I. Effects of physical characteristics and dietary habits on bone mineral density in adolescent girls. Journal of Nutritional Science and Vitaminology 1997;43:643‐655. [DOI] [PubMed] [Google Scholar]
Tucker 2003 {published data only}
- Tucker KL. Does milk intake in childhood protect against later osteoporosis?[comment]. American Journal of Clinical Nutrition 2003;77:10‐1. [DOI] [PubMed] [Google Scholar]
Turner 1992 {published data only}
- Turner JG, Gilchrist NL, Ayling EM, Hassall AJ, Hooke EA, Sadler WA. Factors affecting bone mineral density in high school girls. New Zealand Medical Journal 1992;105:95‐96. [PubMed] [Google Scholar]
Turner 2000 {published data only}
- Turner P. Types of activity, fitness levels and calcium intake amongst 14‐16 year old scholars: sufficient for bone health?. Advances in Physiotherapy 2000;2:51‐62. [Google Scholar]
Tussing 2005 {published data only}
- Tussing L, Chapman‐Novakofski K. Osteoporosis prevention education: behavior theories and calcium intake. Journal of the American Dietetic Association 2005;105(1):92‐7. [DOI] [PubMed] [Google Scholar]
Tylavsky 1992 {published data only}
- Tylavsky FA, Anderson JJ, Talmage RV, Taft TN. Are calcium intakes and physical activity patterns during adolescence related to radial bone mass of white college‐age females?. Osteoporosis International 1992;2:232‐40. [DOI] [PubMed] [Google Scholar]
Ulrich 1996 {published data only}
- Ulrich CM, Georgiou CC, Snow Harter CM, Gillis DE. Bone mineral density in mother‐daughter pairs: relations to lifetime exercise, lifetime milk consumption, and calcium supplements. American Journal of Clinical Nutrition 1996;63:72‐79. [DOI] [PubMed] [Google Scholar]
Valerio 2004 {published data only}
- Valerio G, Puente A, Buono P, Esposito A, Zanatta M, Mozzillo E, et al. Quantitative ultrasound of proximal phalanxes in patients with type 1 diabetes mellitus. Diabetes Research & Clinical Practice 2004;64(3):161‐166. [DOI] [PubMed] [Google Scholar]
VandenBergh 1995 {published data only}
- VandenBergh MF, DeMan SA, Witteman JC, Hofman A, Trouerbach WT, Grobbee DE. Physical activity, calcium intake, and bone mineral content in children in The Netherlands. Journal of Epidemiology and Community Health 1995;49:299‐304. [DOI] [PMC free article] [PubMed] [Google Scholar]
Vigano 2004 {published data only}
- Vigano A, Mora S. Adverse effects of antiretroviral therapy: Focus on bone density. Expert Opinion on Drug Safety 2004;3(3):199‐208. [DOI] [PubMed] [Google Scholar]
Volek 2003 {published data only}
- Volek JS, Gomes AL, Scheett TP, Sharman MJ, French DN, Rubin MR, et al. Increasing fluid milk favorably affects bone mineral density responses to resistance training in adolescent boys. Journal of the American Dietetic Association 2003;103:1353‐1356. [DOI] [PubMed] [Google Scholar]
Wallace 2002 {published data only}
- Wallace LS, Ballard JE. Lifetime physical activity and calcium intake related to bone density in young women. Journal of Womens Health and Gender‐based Medicine 2002;11:389‐98. [DOI] [PubMed] [Google Scholar]
Wang 1999 {published data only}
- Wang MC, Moore EC, Crawford PB, Hudes M, Sabry ZI, Marcus R, et al. Influence of Pre‐adolescent Diet on Quantitative Ultrasound Measurements of the Calcaneus in Young Adult Women. Osteoporosis International 1999;9:532‐535. [DOI] [PubMed] [Google Scholar]
Wang 2003 {published data only}
- Wang MC, Crawford PB, Hudes M, Loan M, Siemering K, Bachrach LK. Diet in midpuberty and sedentary activity in prepuberty predict peak bone mass. American Journal of Clinical Nutrition 2003;77:495‐503. [DOI] [PubMed] [Google Scholar]
Wastney 2003 {published data only}
Weaver 1999 {published data only}
- Weaver CM, Peacock M, Johnston CC, Jr. Adolescent nutrition in the prevention of postmenopausal osteoporosis. Journal of Clinical Endocrinology & Metabolism 1999;84:1839‐1843. [DOI] [PubMed] [Google Scholar]
Welten 1995 {published data only}
- Welten DC, Kemper HC, Post GB, Staveren WA. A meta‐analysis of the effect of calcium intake on bone mass in young and middle aged females and males. Journal of Nutrition 1995;125:2802‐13. [DOI] [PubMed] [Google Scholar]
Welten 1997 {published data only}
- Welten DC, Kemper HC, Post GB, Staveren WA, Twisk JW. Longitudinal development and tracking of calcium and dairy intake from teenager to adult. European Journal of Clinical Nutrition 1997;51:612‐8. [DOI] [PubMed] [Google Scholar]
Whiting 2001 {published data only}
- Whiting SJ, Healey A, Psiuk S, Mirwald R, Kowalski K, Bailey DA. Relationship between carbonated and other low nutrient dense beverages and bone mineral content of adolescents. Nutrition Research 2001;21:1107‐1115. [Google Scholar]
Whiting 2004 {published data only}
- Whiting SJ, Vatanparast H, Baxter‐Jones A, Faulkner RA, Mirwald R, Bailey DA. Factors that affect bone mineral accrual in the adolescent growth spurt. Journal of Nutrition 2004;134:696S‐700S. [DOI] [PubMed] [Google Scholar]
Winters‐Stone 2004 {published data only}
- Winters‐Stone KM, Snow CM. One year of oral calcium supplementation maintains cortical bone density in young adult female distance runners. International Journal of Sport Nutrition and Exercise Metabolism 2004;14(1):7‐17. [DOI] [PubMed] [Google Scholar]
Yeste 2004 {published data only}
- Yeste D, Almar J, Clemente M, Gussinye M, Audi L, Carrascosa A. Areal bone mineral density of the lumbar spine in 80 premature newborns. A prospective and longitudinal study. Journal of Pediatric Endocrinology & Metabolism 2004;17(7):959‐966. [DOI] [PubMed] [Google Scholar]
Zacharin 2004 {published data only}
Zanchetta 1995 {published data only}
- Zanchetta JR, Plotkin H, Alvarez Filgueira ML. Bone mass in children: normative values for the 2‐20‐year‐old population. Bone 1995;16:393S‐399S. [DOI] [PubMed] [Google Scholar]
Zhang 2003 {published data only}
- Zhang Q, Ma GS, Greenfield H, Du XQ, Zhu K, Fraser DR. Effects of fortified milk consumption on regional bone mineral accrual in Chinese girls. Asia Pacific Journal of Clinical Nutrition 2003;12 Suppl:S46. [Google Scholar]
Zhu 2003 {published data only}
- Zhu K, Greenfield H, Du X, Zhang Q, Fraser DR. Effects of milk supplementation on cortical bone gain in Chinese girls aged 10‐12 years. Asia Pacific Journal of Clinical Nutrition 2003;12 Suppl:S47. [PubMed] [Google Scholar]
Zhu 2004 {published data only}
- Zhu K, Greenfield H, Zhang Q, Ma G, Zhang Z, Hu X, et al. Bone mineral accretion and growth in Chinese adolescent girls following the withdrawal of school milk intervention: preliminary results after two years. Asia Pacific Journal of Clinical Nutrition 2004;13:S83. [Google Scholar]
Zhu 2004 b {published data only}
- Zhu K, Du X, Greenfield H, Zhang Q, Ma G, Hu X, et al. Bone mass in Chinese premenarcheal girls: the roles of body composition, calcium intake and physical activity. British Journal of Nutrition 2004;92(6):985‐93. [DOI] [PubMed] [Google Scholar]
Ziccardi 2004 {published data only}
- Ziccardi SL, Sedlak CA, Doheny MO. Knowledge and health beliefs of osteoporosis in college nursing students. Orthopaedic Nursing 2004;23(2):128‐33. [DOI] [PubMed] [Google Scholar]
Zwart 2004 {published data only}
- Zwart SR, Hargens AR, Smith SM. The ratio of animal protein intake to potassium intake is a predictor of bone resorption in space flight analogues and in ambulatory subjects. American Journal of Clinical Nutrition 2004;80(4):1058‐65. [DOI] [PubMed] [Google Scholar]
Zwiauer 2003 {published data only}
- Zwiauer K. Dietary calcium for children and prevention of osteoporosis. Journal fur Ernahrungsmedizin 2003;5:30‐34. [Google Scholar]
Additional references
1993
- Consensus development conference: diagnosis, prophylaxis, and treatment of osteoporosis.. American Journal of Medicine 1993;94:646‐50. [DOI] [PubMed] [Google Scholar]
Abrams 1996
- Abrams SA, O'Brien KO, Stuff JE. Changes in calcium kinetics associated with menarche.. Journal of Clinical Endocrinology and Metabolism 1996;81(6):20117‐2020. [DOI] [PubMed] [Google Scholar]
Alderson 2002
- Alderson P, Green S. Additional Module 1: Meta‐analysis of Continuous Data [http://www.cochrane‐net.org/openlearning/HTML/modA1.htm]. Cochrane Collaboration: open learning material for reviewers 2002.
Bailey 1999
- Bailey DA, McKay HA, Mirwald RL, Crocker PR, Faulkner RA. A six‐year longitudinal study of the relationship of physical activity to bone mineral accrual in growing children: the university of Saskatchewan bone mineral accrual study. Journal of Bone and Mineral Research 1999;14:1672‐9. [DOI] [PubMed] [Google Scholar]
Bonjour 1991
- Bonjour JP, Theintz G, Buchs B, Slosman D, Rizzoli R. Critical years and stages of puberty for spinal and femoral bone mass accumulation during adolescence.. Journal of Clinical Endocrinology and Metabolism 1991;73(3):555‐563. [DOI] [PubMed] [Google Scholar]
Bonjour 1997
- Bonjour JP, Carrie AL, Ferrari S, Clavien H, Slosman D, Theintz G, et al. Calcium‐enriched foods and bone mass growth in prepubertal girls: a randomized, double‐blind, placebo‐controlled trial. Journal of Clinical Investigation 1997;99:1287‐1294. [DOI] [PMC free article] [PubMed] [Google Scholar]
Bradney 1998
- Bradney M, Pearce G, Naughton G, Sullivan C, Bass S, Beck T, et al. Moderate exercise during growth in prepubertal boys: changes in bone mass, size, volumetric density, and bone strength: a controlled prospective study. Journal of Bone and Mineral Research 1998;13:1814‐21. [DOI] [PubMed] [Google Scholar]
Cooley 2001
- Cooley H, Jones G. A population‐based study of fracture incidence in southern Tasmania: lifetime fracture risk and evidence for geographic variations within the same country.. Osteoporosis International 2001;12(2):124‐130. [DOI] [PubMed] [Google Scholar]
Favus 2003
- Favus MJ. Primer on the metabolic bone diseases and disorders of mineral metabolism. 5th ed.. Lippincott Williams & Wilkins, 2003. [Google Scholar]
French 2000
- French SA, Fulkerson JA, Story M. Increasing weight‐bearing physical activity and calcium intake for bone mass growth in children and adolescents: a review of intervention trials.. Preventive Medicine 2000;31(6):722‐31. [DOI] [PubMed] [Google Scholar]
Fuchs 2001
- Fuchs RK, Bauer JJ, Snow CM. Jumping improves hip and lumbar spine bone mass in prepubescent children: a randomized controlled trial. Journal of Bone and Mineral Research 2001;16:148‐56. [DOI] [PubMed] [Google Scholar]
Gilsanz 1998
- Gilsanz V. Bone density in children: a review of the available techniques and indications.. European Journal of Radiology 1998;26(2):177‐182. [DOI] [PubMed] [Google Scholar]
Goulding 1998
- Goulding A, Cannan R, Williams SM, Gold EJ, Taylor RW, Lewis‐Barned NJ. Bone mineral density in girls with forearm fractures. Journal of Bone and Mineral Research 1998;13:143‐8. [DOI] [PubMed] [Google Scholar]
Goulding 2001
- Goulding A, Jones IE, Taylor RW, Williams SM, Manning PJ. Bone mineral density and body composition in boys with distal forearm fractures: a dual‐energy x‐ray absorptiometry study. Journal of Pediatrics 2001;139:509‐15. [DOI] [PubMed] [Google Scholar]
Hansen 1991
- Hansen MA, Overgaard K, Riis BJ, Christiansen C. Role of peak bone mass and bone loss in postmenopausal osteoporosis: 12 year study. British Medical Journal 1991;303:961‐4. [DOI] [PMC free article] [PubMed] [Google Scholar]
Heaney 2001
- Heaney RP, Abrams S, Dawson‐Hughes B, Looker A, Marcus R, Matkovic V, Weaver C. Peak bone mass.. Osteoporosis International 2001;11(2):985‐1009. [DOI] [PubMed] [Google Scholar]
Heinonen 2000
- Heinonen A, Sievanen H, Kannus P, Oja P, Pasanen M, Vuori I. High‐impact exercise and bones of growing girls: a 9‐month controlled trial. Osteoporosis International 2000;11:1010‐7. [DOI] [PubMed] [Google Scholar]
Jackman 1997
- Jackman LA, Millane SS, Martin BR, Wood OB, McCabe GP, Peacock M, Weaver CM:. Calcium retention in relation to calcium intake and postmenarcheal age in adolescent females.. American Journal of Clinical Nutrition 1997;66(2):327‐333. [DOI] [PubMed] [Google Scholar]
Jadad 1996
- Jadad AR, Moore RA, Carroll D, Jenkinson C, Reynolds DJ, Gavaghan DJ, et al. Assessing the quality of reports of randomized clinical trials: is blinding necessary?. Controlled Clinical Trials 1996;17:1‐12. [DOI] [PubMed] [Google Scholar]
Javaid 2002
- Javaid MK, Cooper C. Prenatal and childhood influences on osteoporosis. Best Practice and Research in Clinical Endocrinology and Metabolism 2002;16:349‐67. [DOI] [PubMed] [Google Scholar]
Jones 1994
- Jones G, Nguyen T, Sambrook PN, Kelly PJ, Gilbert C, Eisman JA. Symptomatic fracture incidence in elderly men and women: the Dubbo Osteoporosis Epidemiology Study (DOES). Osteoporosis International 1994;4:277‐82. [DOI] [PubMed] [Google Scholar]
Jones 2001
- Jones G, Riley MD, Whiting S. Association between urinary potassium, urinary sodium, current diet, and bone density in prepubertal children.. American Journal of Clinical Nutrition 2001;73:839‐44. [DOI] [PubMed] [Google Scholar]
Jones 2002
- Jones G, Cooley HM. Symptomatic fracture incidence in those under 50 years of age in southern Tasmania.. Journal of Paediatrics and Child Health 2002;38(3):278‐283. [DOI] [PubMed] [Google Scholar]
Juni 2001
- Juni P, Altman DG, Egger M. Systematic reviews in health care: Assessing the quality of controlled clinical trials.. British Medical Journal 2001;323:42‐6. [DOI] [PMC free article] [PubMed] [Google Scholar]
Lanou 2005
- Lanou AJ, Berkow SE, Barnard ND. Calcium, dairy products, and bone health in children and young adults: a reevaluation of the evidence.. Pediatrics 2005;115(3):736‐743. [DOI] [PubMed] [Google Scholar]
Ma 2003
- Ma D, Jones G. The association between bone mineral density, metacarpal morphometry, and upper limb fractures in children: a population‐based case‐control study. Journal of Clinical Endocrinology and Metabolism 2003;88:1486‐91. [DOI] [PubMed] [Google Scholar]
MacKelvie 2003
- MacKelvie KJ, Khan KM, Petit MA, Janssen PA, McKay HA. A school‐based exercise intervention elicits substantial bone health benefits: a 2‐year randomized controlled trial in girls. Pediatrics 2003;112:e447. [DOI] [PubMed] [Google Scholar]
Marshall 1996
- Marshall D, Johnell O, Wedel H. Meta‐analysis of how well measures of bone mineral density predict occurrence of osteoporotic fractures. British Medical Journal 1996;312:1254‐9. [DOI] [PMC free article] [PubMed] [Google Scholar]
Matkovic 1992
- Matkovic V, Heaney RP. Calcium balance during human growth: evidence for threshold behavior.. American Journal of Clinical Nutrition 1992;55(5):992‐996. [DOI] [PubMed] [Google Scholar]
Morris 1997
- Morris FL, Naughton GA, Gibbs JL, Carlson JS, Wark JD. Prospective ten‐month exercise intervention in premenarcheal girls: positive effects on bone and lean mass. Journal of Bone and Mineral Research 1997;12:1453‐62. [DOI] [PubMed] [Google Scholar]
NIH 2000
- Osteoporosis Prevention, Diagnosis and Therapy.. NIH Consensus Statement 2000;17:1‐45. [PubMed] [Google Scholar]
Prentice 1994
- Prentice A, Parsons TJ, Cole TJ. Uncritical use of bone mineral density in absorptiometry may lead to size‐related artifacts in the identification of bone mineral determinants.. American Journal of Clinical Nutrition 1994;60(6):837‐842. [DOI] [PubMed] [Google Scholar]
Riis 1996
- Riis BJ, Hansen MA, Jensen AM, Overgaard K, Christiansen C. Low bone mass and fast rate of bone loss at menopause: equal risk factors for future fracture: a 15‐year follow‐up study. Bone 1996;19:9‐12. [DOI] [PubMed] [Google Scholar]
Robinson 2002
- Robinson KA, Dickersin K. Development of a highly sensitive search strategy for the retrieval of controlled trials using PubMed. International Journal of Epidemiology 2002;31:150‐3. [DOI] [PubMed] [Google Scholar]
Shea 2004
- Shea B, Wells G, Cranney A, Zytaruk N, Robinson V, Griffith L, Hamel C, Ortiz Z, Peterson J, Adachi J, et al. Calcium supplementation on bone loss in postmenopausal women.. Cochrane Database Syst Rev 2004 2004;2004(1):CD004526. [DOI] [PubMed] [Google Scholar]
Sundberg 2001
- Sundberg M, Gardsell P, Johnell O, Karlsson MK, Ornstein E, Sandstedt B, et al. Peripubertal moderate exercise increases bone mass in boys but not in girls: a population‐based intervention study. Osteoporosis International 2001;12:230‐8. [DOI] [PubMed] [Google Scholar]
Tugwell 2004
- Tugwell, P (Ed). Evidence‐based Rheumatology.. London: BMJ Publishing Group, 2004. [ISBN 0 7279 1446 4.] [Google Scholar]
Woolf 2003
- Woolf AD, Pfleger B. Burden of major musculoskeletal conditions.. Bulletin of the World Health Organization 2003;81(9):646‐56. [PMC free article] [PubMed] [Google Scholar]
Wosje 2000
- Wosje KS, Specker BL. Role of calcium in bone health during childhood.. Nutrition Reviews 2000;58(9):253‐68. [DOI] [PubMed] [Google Scholar]