Abstract
Object
Recent studies have demonstrated the epigenetic regulation of immune responses. However, the potential role of N6-methyladenosine methylation (m6A) in the tumor microenvironment (TME) remains unknown.
Method
In this study, the m6A modification patterns of LUAD samples were comprehensively evaluated by combining TCGA and GEO data, while these modification patterns were systematically linked to the characteristics of immune infiltrating cells in TME. The m6A score was constructed using the principal component analysis algorithm to quantify the m6A modification mode of a single tumor.
Result
There were three distinct patterns of m6A modification identified. The characteristics of TME cell infiltration in these three patterns were highly consistent with these three immune phenotypes of the tumors, including immune rejection, immune-inflammatory, and immune inert phenotypes. Low m6A scores were characterized by immune activation and poor survival rate. Besides, m6A scores were associated with tumor mutational load (TMB) and were able to increase the ability of TMB to predict immunotherapy. Two immunotherapy cohorts confirmed that the patients with lower m6A scores demonstrated significant therapeutic advantages and clinical benefits. m6A modifications play an important role in the development of TME diversity. Assessing the m6A modification pattern of individual tumors can deepen the understanding as to the characteristics of TME infiltration and guide more effective immunotherapy strategies.
Introductions
Lung cancer (LC) is one of the common malignant tumors, and lung adenocarcinoma (LUAD) is the most common pathological type [1–4]. Although immunotherapy has gradually become a focus of LUAD treatment, the lack of efficacy indicators and the limited beneficiaries have become the challenges we face [5]. Therefore, it is urgent to find effective solutions. There are more than 100 RNA modifications in organisms [6, 7]. The most common internal modifications of mRNA include N6—adenylate methylation(m6A), N1—adenylate methylation(m1A), and 5—methylcytosine (m5C), etc [8]. These modifications contribute to maintaining mRNA stability and are associated with a variety of diseases such as tumors, neurological diseases, and embryonic development(9). m6A is a methyl insertion on the N atom of adenosine 6, which is considered to be the most significant and abundant form of internal modification in eukaryotic cells. It widely exists in mRNA, lncRNA, and miRNA [9–12]. The methylation modification of m6A has been proved to be reversible, which requires the participation of methyltransferase, demethylase, and methylated reading protein [13]. The methyltransferase such as METTL3, METTL14, WTAP and KIAA1492 form complexes, which can make m6A modifications of mRNA bases and play a catalytic role [13]. Demethylases such as FTO and ALKBH5 play a role in removal. Such methylated reading proteins as YTHDF1, YTHDF2, YTHDF1, YTHDF3, YTHDC1, YTHDC2, and HNRNPA2B1 can recognize the m6A motif, thus affecting the function of m6A [13]. There is mounting evidence showing that the m6A modification gene is closely related to the occurrence and development of tumors, playing a dual role in promoting cancer and inhibiting cancer. Besides, its expression level often affects the pathological evolution of tumors [9].
Tumor tissue includes tumor cells, stromal cells, immune cells, and TME [14]. There is increasing evidence that the diversity of TME plays an important role in the tumor evolution process and immunotherapy, etc [15]. The integrated analysis of TME and m6A modifications has the potential to identify different immune phenotypes of tumors and to improve the guidance and prediction of immunotherapy. A research in this project shows that a comprehensive evaluation of LUAD-m6A modification patterns was performed and a scoring system was established to quantify the m6A modification patterns of patients (The process of this study is described in S1 and S2 Figs).
Materials and methods
Data source
The LUAD expression data and complete clinical information were sourced from the cancer genome atlas (TCGA) database and the Gene Expression Omnibus (GEO) database. Transcriptomic expression data (Fragments Per Kilobase of exon model per Million mapped fragments) and the corresponding clinical information data from the TCGA-LUAD dataset, including 535 lung adenocarcinoma tissue samples and 59 paraneoplastic tissue samples, were downloaded from the Genomic Data Commons (GDC https://portal.gdc.cancer.gov/). The transcriptomic expression data was based on the Illumina HiSeq high-throughput sequencing platform. Transcriptomic expression data was annotated according to GENCODE version 29 (https://www.gencodegenes.org/human/). Subsequently, Fragments Per Kilobase of exon model per Million mapped fragments were converted into Transcripts Per Kilobase of exon model per Million mapped reads. A gene expression profile (GSE26939) was downloaded from Gene Expression Omnibus (GEO, http://www.ncbi.nlm.nih.gov/geo/) database by searching for "lung adenocarcinoma" (January 2021). The platform annotation file for GSE26939 is Agilent-UNC-custom-4X44K. The TCGA-LUAD metagenomic data was downloaded from GDC for copy number variation (CNV) analysis.
m6A CNV analysis
This study included twenty-three m6A modification related genes, including 8 methylation transferases (METTL3, METTL3, METTL16, WTAP, VIRMA, ZC3H12, RBM15, RBM15B), 13 methylation reading proteins (YTHDC1, YTHDC2, YTHDF1, YTHDF2, YTHDF3 HNRNPC, FMR1, LRPPRC, HNRNPA2B1, IGFBP1, IGFBP2, IGFBP3, RBMX), and 2 demethylases (FTO, ALKBH5). First of all, the copy number of the m6A regulators was extracted at TCGA-LUAD using PERL software, and the histogram was constructed visually using R software. To explore the relationship between the copy number of 23 m6A regulators and chromosomes, the RCircos package was used to plot the variation in copy number of 23 m6A regulators in 23 pairs of chromosomes. The Wilcox test was performed to compare the differential expression of m6A regulators in TCGA-LUAD using the limma package. Limma package provides a very comprehensive solution to microarrays analysis and RNA-Seq differential analysis [16]. Waterfall plots were drawn with the maftools package to demonstrate the mutation rate of m6A regulators in LUAD. The m6A regulators with higher mutation rates were selected to divide the samples into wild and mutant groups for comparing the relationship between gene and expression. P-value < 0.05 was treated as statistically significant, and the box plot was drawn using the ggpubr package.
m6A regulator analysis
The TCGA-LUAD datasets and GSE26939 datasets were subjected to intersection taking, data merging, data correction, and the removal of normal samples for further analysis. Prognosis-related m6A regulators were selected using the Univariate Cox regression model and the survival package with P-value<0.05 as the cut-off condition. The relationships between prognosis-associated m6A regulators were further demonstrated in the form of network diagrams using the igraph package.
m6A cluster
To further understand the value of m6A regulators, the samples were clustered by the ConsensusClusterPlus package according to the expression of m6A regulators. All samples were set into k [2–9] groups, and after sequential cycling, the most appropriate clustering typing of m6A regulators was obtained according to 3 conditions. The first one is tight intra-typical associations and non-tight inter-typical associations. The second one is that there are not too few samples within each cluster. The last one is an insignificant increase in the area of the cumulative distribution curve. Based on the correlation between the m6A cluster and survival status, the cut-off points for each data set subgroup were determined using the survminer package, while repeated tests were performed for all possible cut-off points to find the maximum rank statistic. Then, the patients were divided into high expression group and low expression group based on the maximum selected log-rank statistic. The survival curves for predictive analysis were generated using the Kaplan-Meier method and the survival package, while the log-rank test was performed to determine the significance of differences, with P-value < 0.05 treated as statistically significant.
GSVA analysis and ssGSEA analysis
To investigate the biological functions among m6A regulators, gene set variation analysis (GSVA) was performed using the GSVA package. GSVA is a non-parametric and unsupervised method mainly used to estimate the changes in pathways and the biological process activity of samples in experimental datasets [17]. Gene sets were downloaded from the MSigDB database (http://www.gsea-msigdb.org/gsea/msigdb) for c5.go.v7.4.symbols, and p-values were adjusted according to the false discovery rate (FDR), with P-value < 0.05 as the cut-off criterion. Heatmaps were plotted using the pheatmap package.
The relative abundance of immune infiltrating cells (immune score) in each sample was quantified using gene enrichment score (NES) and a single sample GSEA (ssGSEA) [18]. The gene set for each TME-infiltrating immune cell type was derived from the study of Charoentong, including activated CD8 T cells, activated dendritic cells, macrophages, natural killer T cells, and regulatory T cells, etc [19]. The correlation between m6A typing and immune scoring was further explored using the limma package, with P- value < 0.05 treated as statistically significant, and box plots were obtained using the ggpubr package.
Differential analysis
Bayesian statistics of the R software limma package were applied to determine the differential genes (DEGs) between the two groupings of m6A, p-values were adjusted according to the false discovery rate (FDR), and the P-values smaller than 0.001 were taken as the screening criteria. The core genes were obtained by taking the intersection of DEGs between different genotypes using the VennDiagram package. Furthermore, GO enrichment analysis and KEGG enrichment analysis were performed through Matescape database (http://metascape.org) to explore the potential biological functions and biological pathways, and potential biological functions and pathways were selected with P -value < 0.05.
Gene cluster
Univariate Cox regression models analysis of DEGs was conducted using survival package to screen out prognosis-related m6A phenotype modifying genes with P-value <0.05. The samples were clustered according to the expression of prognosis-related m6A phenotype modifying genes using the ConsensusClusterPlus package, so as to identify gene clusters for the next step of analysis(the same as step-m6A cluster).
Firstly, the survival package of R software was applied to perform survival analysis to help assess the prognostic value of gene cluster and was divided into high and low expression groups. Besides, survival curves were plotted using the Kaplan-Meier method, and the log-rank test was performed to assess statistical significance, with a P-value < 0.05 treated as statistically significant (the same as step-m6A cluster). After the collection of clinical information (i.e., clinical-stage, T stage, N stage, M stage, age, and sex), the pheatmap package was used to draw a heat map showing the correlation between gene cluster, m6A cluster, and clinical features.
m6A score
In order to quantify the m6A modification pattern of LUAD, a scoring system was established by principal component analysis (PCA) to evaluate the characteristics of LUAD-m6A modification. PCA analysis can be effective in identifying the most dominant elements and structures in the data, removing noise and redundancy, reducing the dimensionality of the original complex data, and revealing the simple structure hidden behind the complex data [20]. Principal component analysis was conducted to construct the scoring system:
m6A score = (PCli * PC2i)
i denotes the expression of the m6A gene
m6A score divided into high and low m6A score groups for further analysis (the same as step-m6A cluster). Firstly, survival analysis was performed using the survival package to help assess the prognostic value of the m6A score group, and survival curves were plotted using the Kaplan-Meier method with Lonkrank test to assess statistical significance (the same as step-m6A cluster), with a smaller P-value than 0.05 considered statistically significant. Further clinical information (pathological staging, survival status) was incorporated, and the survival curves in different pathological staging were plotted using the same method. Then, the correlation between m6A typing, genotyping, m6A score group, and survival status was explored using ggalluvia package for mulberry plots. Furthermore, the differences in m6A scores in different pathological stages and survival status were calculated by counting the differences in m6A scores, percentage plots were plotted using the plyr package, and Box-line plots were plotted using ggpubr package. The differences in m6A scores between different m6A staging and gene were compared using the limma package. P-value < 0.05 was treated as statistically significant.
Correlation between tumor mutation burden and m6A score
The tumor mutational burden (TMB) was defined as the total number of somatic gene coding errors, base substitutions, gene insertion, or the deletion errors as detected per million bases. Firstly, the TMB in each sample was extracted by PERL software. The box line plots and correlation graphs showing the relationship between TMB and m6A score groups were drawn using the ggpubr package. Then, survival analysis was performed using the survival package. All samples were divided into high group(>median value) or low expression group(<median value) according to the expression of TMB. The Kaplan-Meier method was adopted to draw survival curve, and the log-rank test was performed to assess statistical significance. P-value<0.05 was considered statistically significant. The same method was used to plot the survival curves for TMB combined with the m6A score. Finally, waterfall plots were drawn using the maftools package to demonstrate the mutation rates between the high and low m6A score groups.
Analysis of immune°checkpoint
Firstly, the correlation between immune scoring and m6A score was compared using the corrplot package of R software. Then, the samples in the m6A score group and clinical information samples (survival status) were intersected while the data was combined using the R software. The TCIA database (https://tcia.at/home) stores high-throughput sequencing data and immunogenomic analysis results for more than 20 cancers, including the gene expression of relevant tumors, immune infiltrating cell composition, neoantigens, carcinoembryonic antigens, and others. Immunotherapy scoring files were obtained through the TCIA website, and violin plots were drawn using the ggpubr package to compare the relationship between high and low m6A scoring groups and immune checkpoint inhibitors. In addition, the expression of PD-L1 in each sample was further extracted and the correlation between the m6A score and PD-L1s was analyzed using the limma package. A P-value smaller than 0.05 was considered statistically significant.
Statistics analysis
The correlation coefficients between TME infiltrating immune cells and m6A regulator expression were calculated by means of Spearman and distance correlation analysis. The one-way analysis of variance and Kruskal-Wallis test were conducted to compare the differences among three or more groups. The survival curves for analysis were generated using the Kaplan-Meier method, and the log-rank test was performed to determine the significance of differences. Univariate Cox regression models were adopted to calculate hazard ratios (HR) for m6A regulators and m6A-associated genes. All data processing was carried out using R (version 4.0.3) and PERL software (version 5.10.0).
Results
Epigenetic analysis of m6A in lung adenocarcinoma
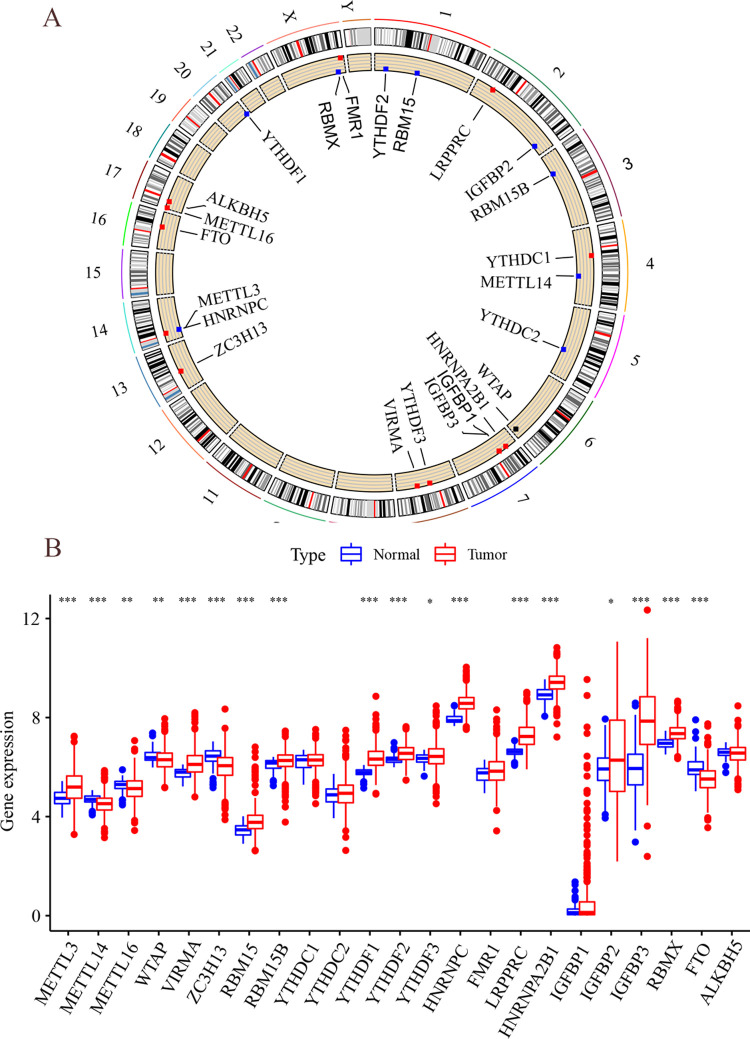
This study involved 23 m6A genes, including 8 methylation transferases, 13 methylation reading proteins, and 2 demethylation enzymes. As shown in Fig 1A, there are 115 samples mutated in 561 samples, with an incidence of 20.5%. A higher mutation rate occurred in ZC3H13 (mutation rate of 3%), while no mutation rate occurred in METTL3 or VIRMA. Copy number variation analysis revealed that the significant increase in copy number occurred in YTHDF1, VIRMA, FMR1, RMR1, METTL3, HNRNPC, RBMX, LRPPRC, and HNRNPA2B1, while extensive copy number deletions were present in YTHDF2, YTHDC1, YTHDC2, RBM15, and METLL14 (Fig 1B). The locations of CNV alterations in m6A regulators on chromosomes are shown in Fig 2A. Both LUAD tissues and adjacent non-cancerous tissues could be identified according to the CNV alterations in chromosomes. To further investigate the relationship between regulators and epigenetics, the expression levels of m6A regulators were further analyzed, as shown in Fig 2B. Most m6A regulators such as METTL3, METTL14, METTL16, WTAP, VIRMA, ZC3H12, RBM15, and RBM15B were differentially expressed in LUAD tissues and adjacent non-cancerous tissues to a significant extent (P<0.05). Copy number variation may lead to the altered expression levels of m6A regulators, and there were highly specific epigenetic alterations in m6A regulators in tumors and adjacent non-cancerous tissues.
Fig 1. Epigenetic results of m6A in lung adenocarcinoma.
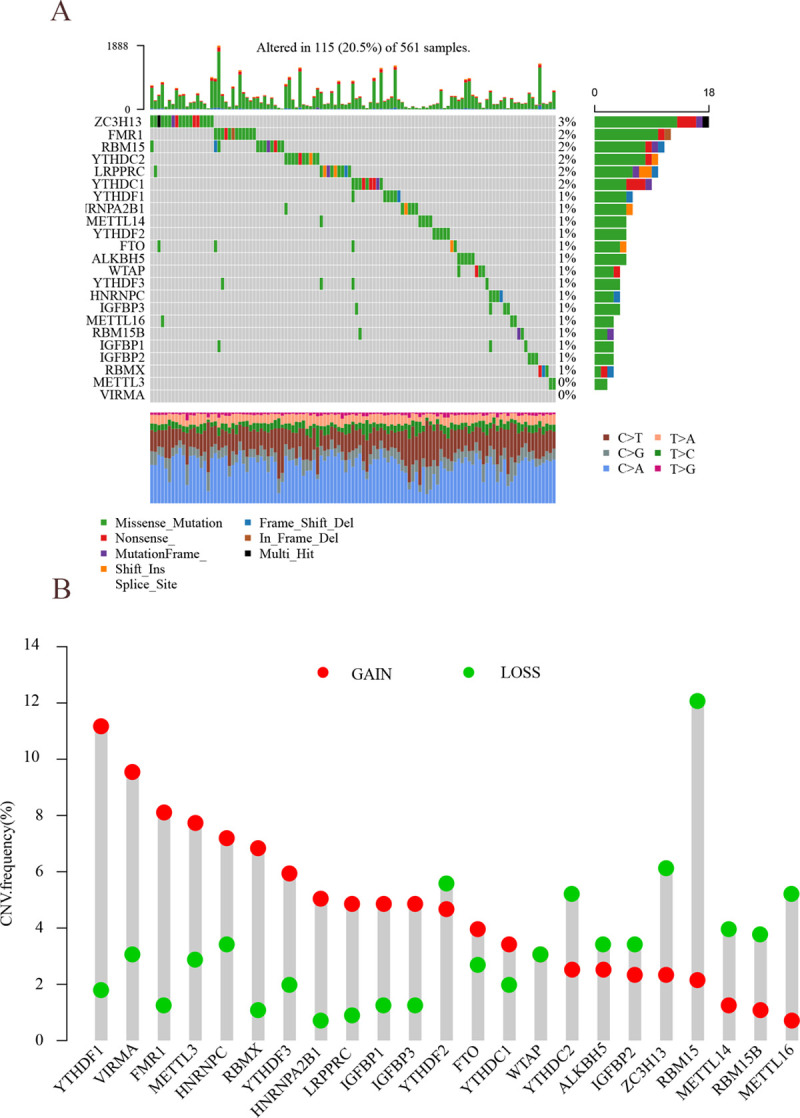
(A) m6A waterfall plot. The right vertical coordinate represents m6A regulators, and the left vertical coordinate represents the mutation rate of m6A regulators in LUAD. (B) m6A copy number variation frequency. The horizontal coordinate represents m6A regulators, the vertical coordinate represents CNV mutation rate, red circles indicate gene amplification, and green circles indicate gene deletion.
Fig 2. Copy number of m6A in chromosomes and analysis of differences.
(A) Copy number circle plot. Distribution of m6A regulators in 22 pairs of autosomes and 1 pair of sex chromosomes, red circles indicate copy number increase, and blue circles indicate copy number decrease. (B) TCGA-m6A differential analysis. Horizontal coordinates indicate m6A regulators, vertical coordinates indicate gene expression, * P < 0.05, * * P < 0.01, and * * * P < 0.001.
m6A regulators
The GEO data with survival time and clinical information was introduced into the study. Univariate regression models revealed that 14 m6A modified regulators (ALKBH5, FMR1, HNRNPA2B1, HNRNPC, IGFBP2, LRPPRC, IGFBP3, METTL3, RBM15, VIRMA, YTHDC1, YTHDC2, YTHDF1, YTHDF2) had a high prognostic value (S1 Table) (P<0.05). As revealed by the network diagram of m6A gene interaction relationship, the m6A modified regulators in the same category had a significant correlation, as did the m6A modified regulators in different categories (Fig 3A). For example, HNRNPCY could inhibit the expression of YTHDC2, FTO, METTL16, and HNRNPCY was co-expressed with LRPPRC, YTHDF3, WTAP, and VIRMA. While HNRNPCY and RBM15 had a high mutation frequency, for which the samples were divided into wild and mutant groups (Fig 3B), with the results suggesting that LRPPRC was significantly up-regulated in the mutant group compared with the wild group (P<0.05). The samples were clustered according to the expression of m6A regulators and then divided into cluster A, cluster B, and cluster C (S2 Table). Cluster A contained 219 samples, cluster B contained 208 samples and cluster C contained 202 samples.
Fig 3. Analysis of m6A regulators.
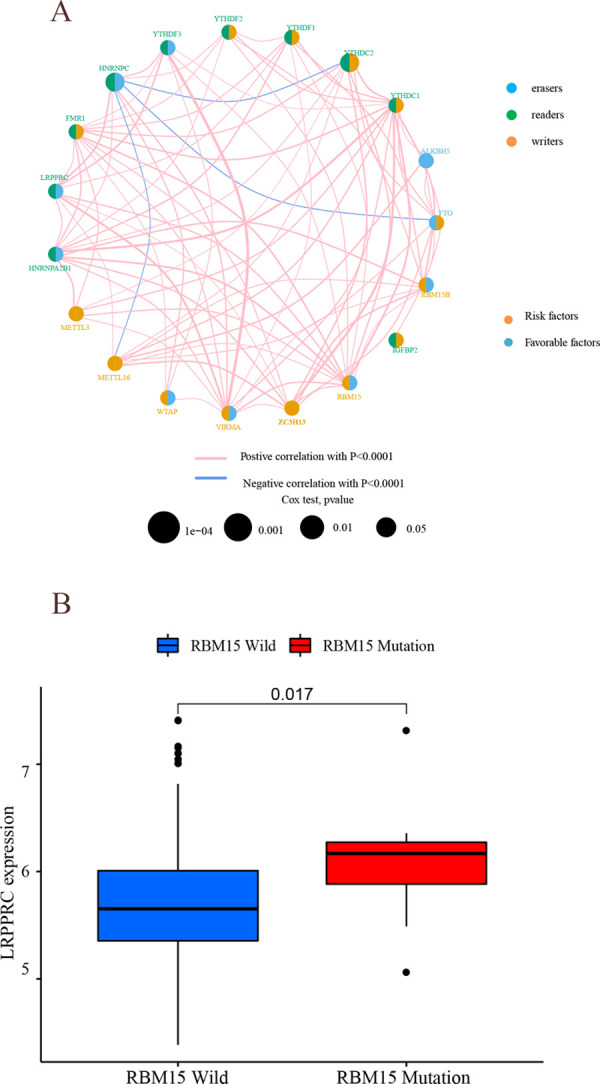
(A) m6Aprognostic network diagram. In the circle corresponding to each m6A modified gene, the yellow part of the left half-circle indicates risk genes, the blue part indicates protection genes, the blue part of the right half-circle indicates demethylase, the green part indicates methylated reading protein, the yellow part indicates methyltransferase, the pink linkage between genes indicates synergism, and the blue linkage indicates repression. (B) Mutation and expression correlation analysis. The horizontal coordinates indicate the RBM15 wild group and mutant group, respectively, while the vertical coordinates indicate the LRPPPC expression.
Functional analysis of m6A cluster
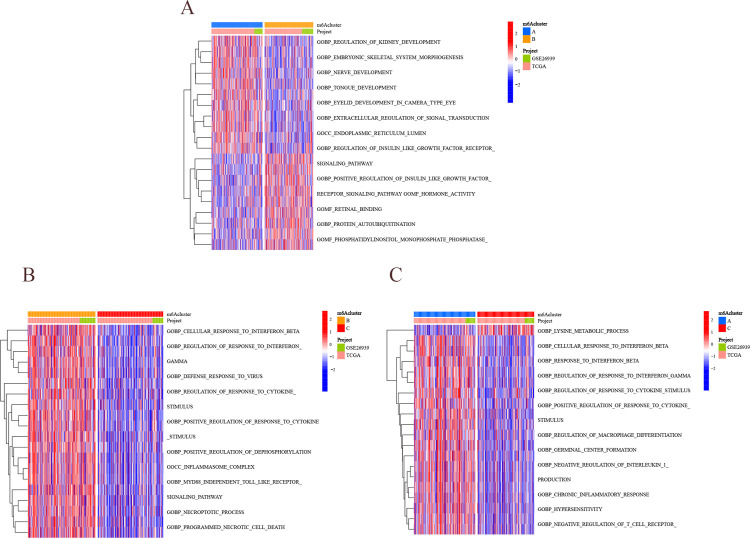
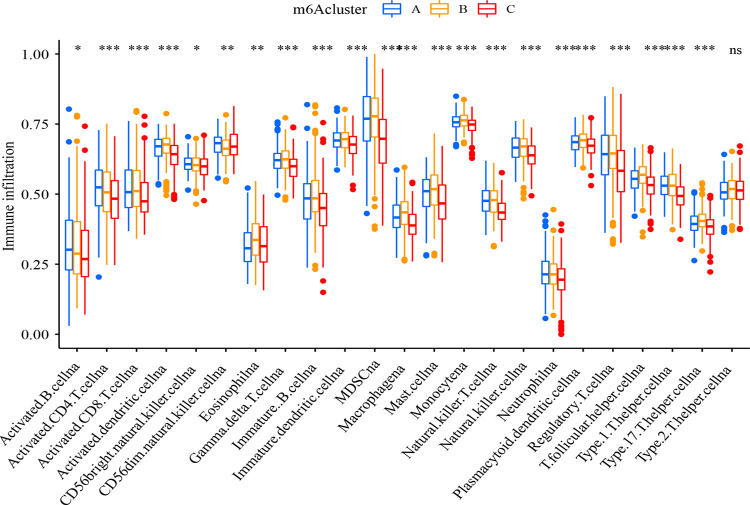
To further explore the potential biological functions among m6A fractions, GSVA analysis was performed (Fig 4A–4C). Cluster A is mainly related to specific immune response and activation, such as the differentiation of helper T lymphocytes and the regulation of related signaling pathways. Cluster B is mainly related to the intrinsic immune response, such as the regulation of TOLL-like receptor signaling pathway and NF-κb transcription factor activity. Subsequently, the relationship between m6A cluster and immune infiltrating cells was further analyzed (Fig 5). It was found out that cluster A had abundant immune infiltrating cells, including CD4+ T lymphocytes, CD8+ T lymphocytes, and regulatory T lymphocytes (P<0.05), all of which were jointly involved in the specific immune response. While cluster B included mast cells, monocytes, γδ T cells, dendritic cells, etc. (P<0.05), as involved in the non-specific immune response. m6A cluster exists with distinctly different cellular infiltration characteristics of the tumor microenvironment. Cluster A is immunoinflammatory, cluster B is immune rejection, and cluster C is immune desert.
Fig 4. Results of m6A typing analysis.
(A) The first row indicates m6A cluster (blue represents cluster A, and yellow represents cluster B), the second row indicates the dataset (green represents GEO dataset, and pink represents TCGA dataset), and the third column indicates the functional enrichment results (red represents positive correlation, and blue represents negative correlation). (B) The first row indicates m6A cluster (red represents cluster B, and yellow represents cluster C), the second row indicates the dataset (green shows GEO dataset, and pink shows TCGA dataset), and the third row indicates the function enrichment result (red indicates positive correlation, and blue indicates negative correlation). (C) The first row indicates the m6A cluster (blue is cluster A, and red is cluster C), the second row indicates the dataset (green is the GEO database, and pink is the TCGA database), and the third row indicates the functional enrichment results (red indicates positive correlation, and blue indicates negative correlation).
Fig 5. Immune cell differential analysis (ssGSEA).
Horizontal coordinates indicate immune infiltrating cells, vertical coordinates indicate immune infiltration abundance, blue boxes indicate cluster A, yellow boxes indicate cluster B, and red boxes indicate cluster C. * P<0.05, * *P<0.01, and * * * P<0.001.
m6A phenotype-related genes
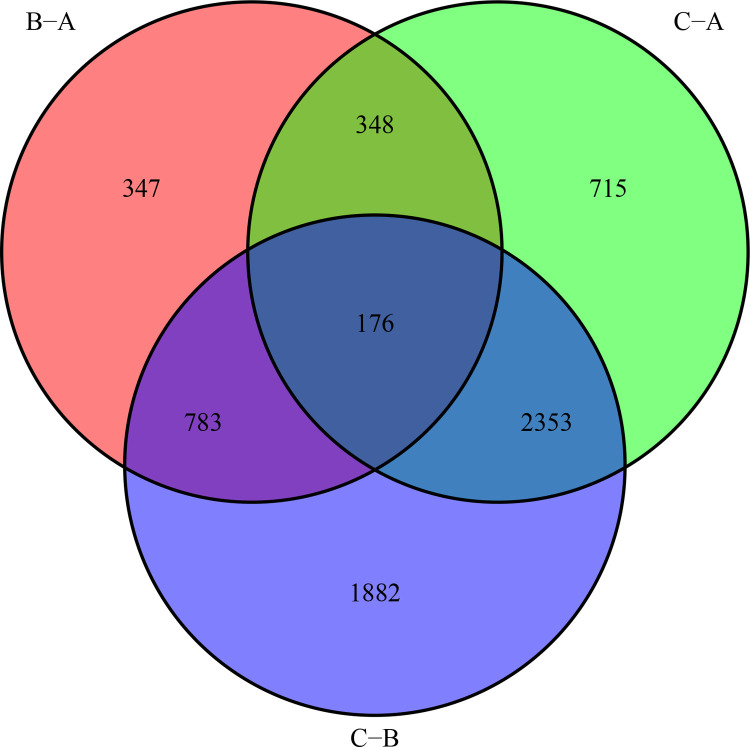
The limma package was applied to perform differential analysis among the m6A cluster (Fig 6). The results showed that there were 1654 differential genes between cluster A-B, 3592 differential genes between cluster A-C, and 5194 differential genes between cluster B-C. The differential genes among m6A typing were taken as common intersection, i.e. 176 differential intersection genes, which were considered as the core genes. The GO analysis and KEGG analysis were performed through the matescape online database, while significant biological functions and pathways were screened at P<0.05. The genes for GO analysis were enriched in the regulatory functions of cytokines and maintenance of cellular homeostasis (Fig 7A). The KEGG functional analysis suggested that they were mainly enriched in the MAPK signaling pathway (Fig 7B), indicating that these core genes were significantly associated with immune regulation.
Fig 6. m6A cluster differential genes.
The red part indicates B-A differential genes, the green part indicates C-A differential genes, and the purple part indicates C-B differential genes.
Fig 7. Functional analysis of differential genes among m6A cluster.
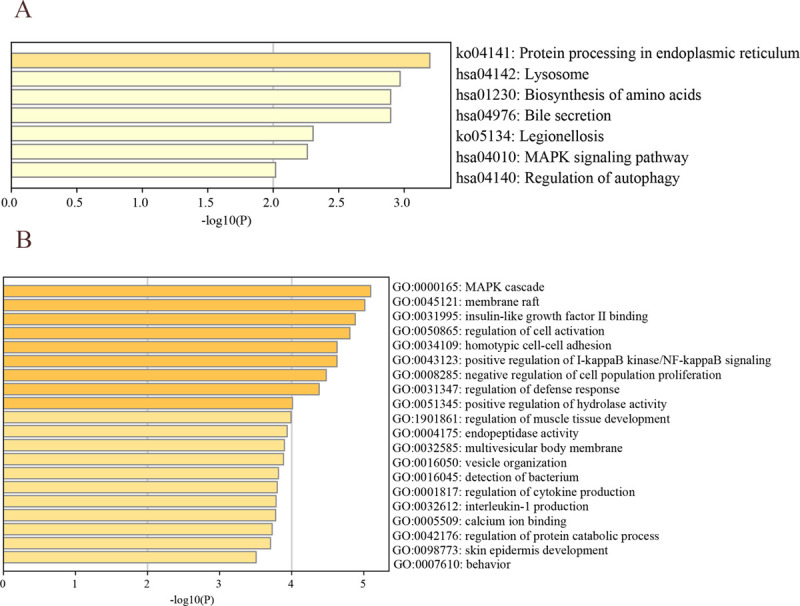
(A) GO functional analysis of core genes. (B) KEGG functional analysis of core genes.
Gene cluster
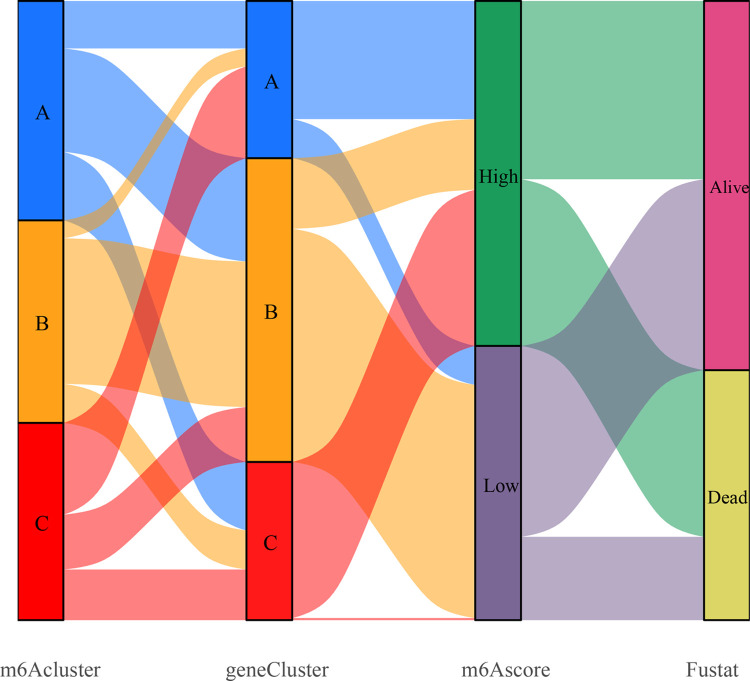
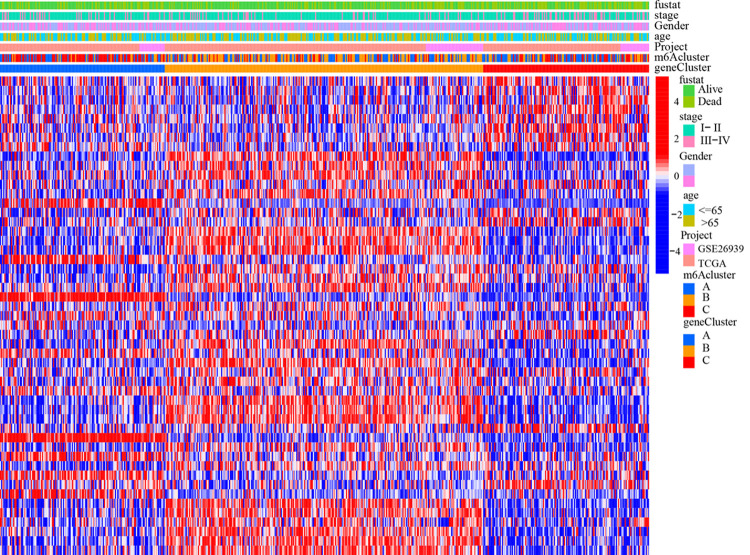
There was no significant difference in survival for the m6A cluster (Fig 8A). According to the expression of core genes (S3 Table), the samples were classified into A, B, and C by cluster analysis (S4 Table). Median survival was significantly different between the 3 groups (P<0.001): cluster B > cluster A > cluster C (Fig 8B). The distribution structure of m6A cluster A (immunoinflammatory type) in genotyping is: cluster B > cluster A >cluster C (Fig 9). The variability of genotypic survival may be associated with the m6A cluster (immunoinflammatory type). The possible reason for this is that immune-inflammatory type tumors have a large number of immune infiltrating cells in the microenvironment, which are sensitive to immune checkpoint inhibitors and have a better prognosis. Furthermore, it was observed that gene cluster B was mainly concentrated in stage I-II (Fig 10), and cluster B had a longer median survival, which may also be related to the fact that the patient was in the early stage of the tumor.
Fig 8. Survival analysis results.
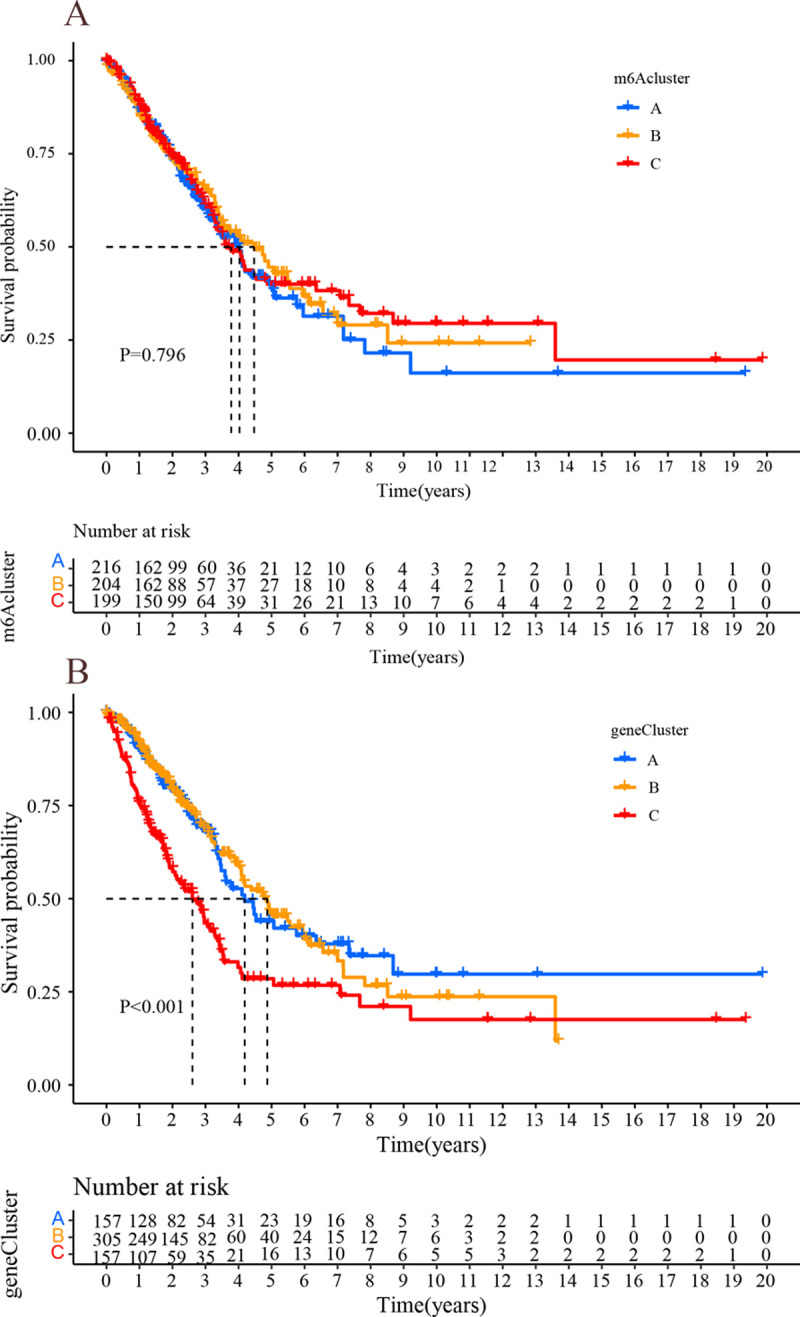
(A) m6A cluster survival analysis: horizontal coordinates indicate survival time, vertical coordinates indicate survival rate, the blue line indicates cluster A, the yellow line indicates cluster B, and the red line indicates cluster C. (B) genecluster survival analysis:horizontal coordinates indicate survival time, vertical coordinates indicate survival rate, the blue line indicates gene cluster A, the yellow line indicates gene cluster B, and the red gene line indicates cluster C.
Fig 9. Genotyping m6A sang-froid.
The first row indicates m6A cluster A, B, and C, the second row indicates gene cluster A, B, and C, the third row indicates high and low m6A scores, and the fourth row indicates survival status (alive, dead), with correlations indicated by connecting lines between different rows.
Fig 10. Gene cluster heatmap different clinical features.
m6A cluster, clinical characteristics and distribution of m6A modified genes in gene cluster.
m6A score
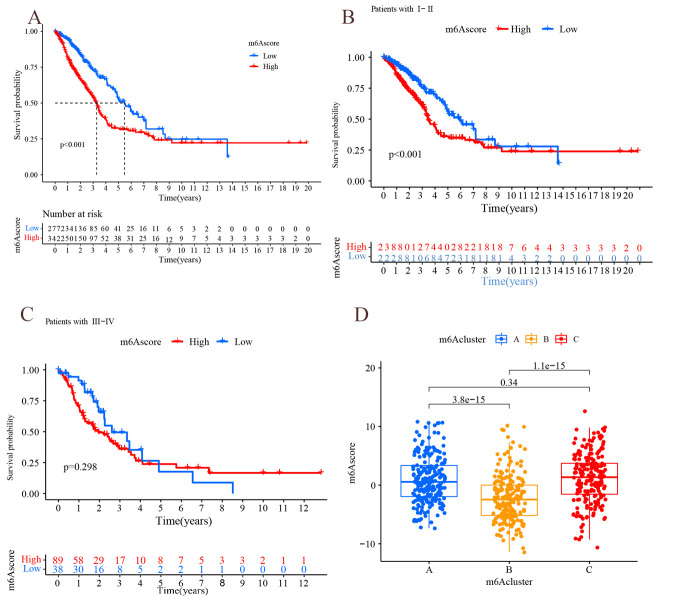
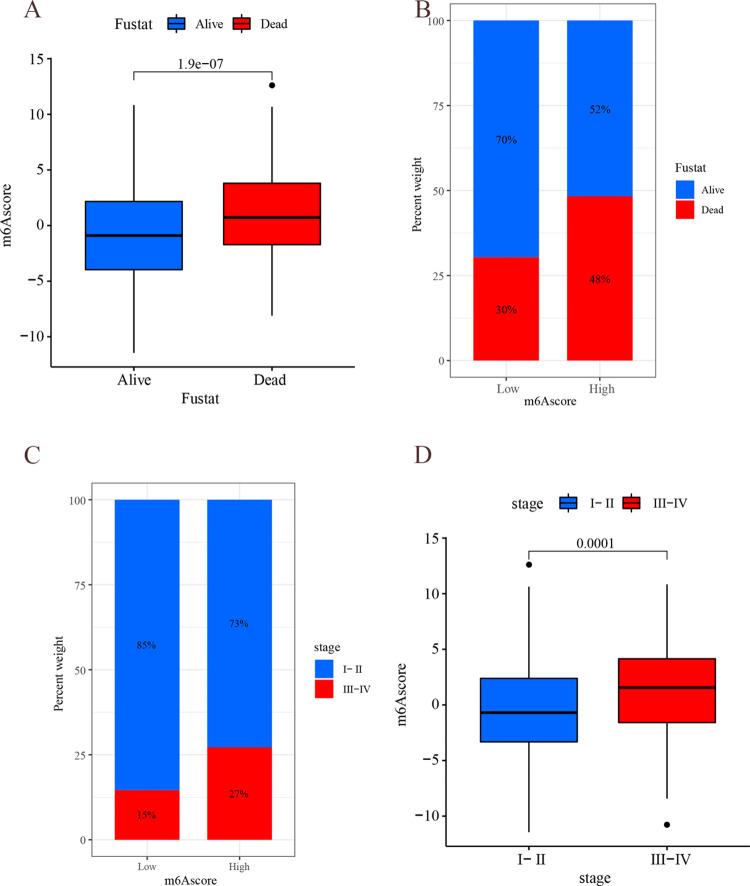
The m6A score was used to quantify the m6A modification pattern, and the samples were divided into high m6A score group and low m6A score group by survminer package (S5 Table). The low m6A score group had a longer survival (Fig 11A, P<0.001) with 70% survival and 30% mortality in the low m6A score group compared to 52% survival and 48% mortality in the high m6A score group (Fig 12A and 12B). In further analysis, there was a significant difference in survival in patients with stage I-II: the lower scoring group had a better prognosis (P<0.001); while there was no significant difference in survival in stage III-IV (Fig 11B and 11C). m6A scores were higher the later the stage was staged (P<0.001), with 85% of stage I-II patients in the low m6A score and 15% of stage III-IV patients in the low m6A score (Fig 12C and 12D). The m6A score may be an independent prognostic factor for patients with early LUAD. In addition, there was significant variability (P<0.001) between the scores of m6A subtype B and type A and C, respectively, further demonstrating that the m6A score can be used to assess m6A subgroup (Fig 11D).
Fig 11. Results of m6A score analysis.
(A) Survival analysis in m6A score subgroup: Horizontal coordinates indicate survival time, vertical coordinates indicate survival rate, red line indicates high m6A score group, and blue line indicates low m6A score group. (B) Survival analysis in m6A scoring groupings(patients with stage I-II): Horizontal coordinates indicate survival status, and vertical coordinates indicate m6A score. (C) Survival analysis in m6A scoring groupings(patients with stage II-III): Horizontal coordinates indicate m6A score, vertical coordinates indicate patient proportion, blue square part indicates survival status, and red square part indicates death status.
Fig 12. Results of m6A score analysis.
(A) The horizontal coordinate indicates the survival state, and the vertical coordinate indicates m6A score. (B) The horizontal coordinate indicates m6A score group(high m6A score group or low m6A score group), and the vertical coordinate indicates survival rate (the red line indicates “Alive”, the blue line indicates “Dead”). (C) The horizontal coordinate indicates m6A score type(the red line indicates stage I-II, the blue line indicates stage III-IV), and the vertical coordinate indicates survival rate. (D) The horizontal coordinate indicates the stage, and the vertical coordinate indicates m6A score.
m6A score and TMB
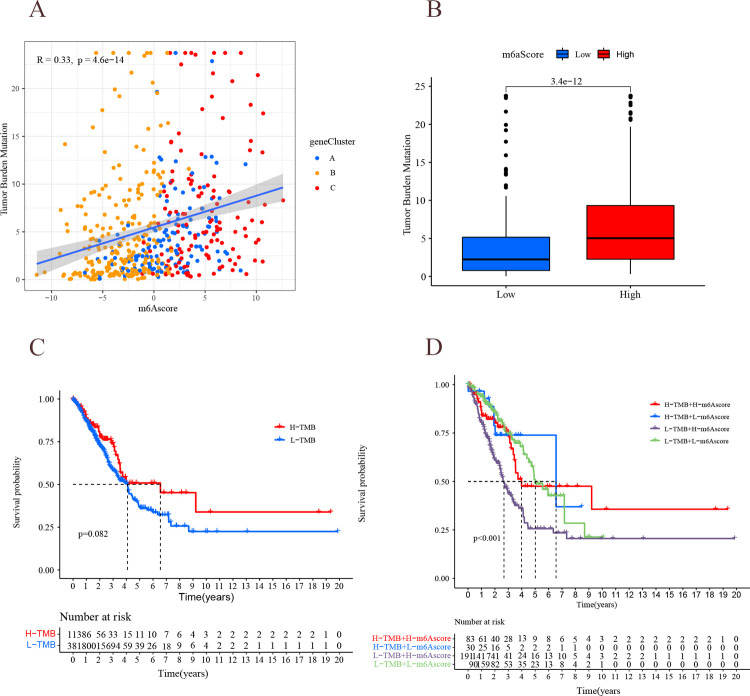
The mutation rates of the high m6A score group and low m6A score group were analyzed separately using the maftools package (Fig 13A and 13B). The high m6A score group (95.62% mutation rate) exhibited a wider range of mutations than the low m6A score group (80% mutation rate). Further analysis revealed a positive correlation between m6A scores and TMB, with high m6A scores showing higher TMB (Fig 14A), which is consistent with previous findings. Then, the high-scoring group did not show higher survival, which is probably because most of the patients in the high-scoring group were in the advanced tumor stage (Fig 14B). The patients with high TMB status had a durable clinical response to anti-PD-1/PD-L1 immunotherapy [8]. Therefore, the above results indirectly demonstrate that tumor m6A-modified genes may be a key factor mediating the clinical efficacy of anti-PD-1/PD-L1 immunotherapy. The survival of LUAD patients was not significantly different between high and low TMB (Fig 14C), but it was further found out that TMB combined with m6A score predicted the survival of LUAD patients differently (Fig 14D): high TMB + low m6A score > low TMB + low m6A score > high TMB + high m6A score > low TMB + low m6A score (P<0.001). It can be speculated that the combined m6A score can improve the sensitivity of TMB to predict immunotherapy in LUAD.
Fig 13. Mutation waterfall plot for high and low m6A score groups.
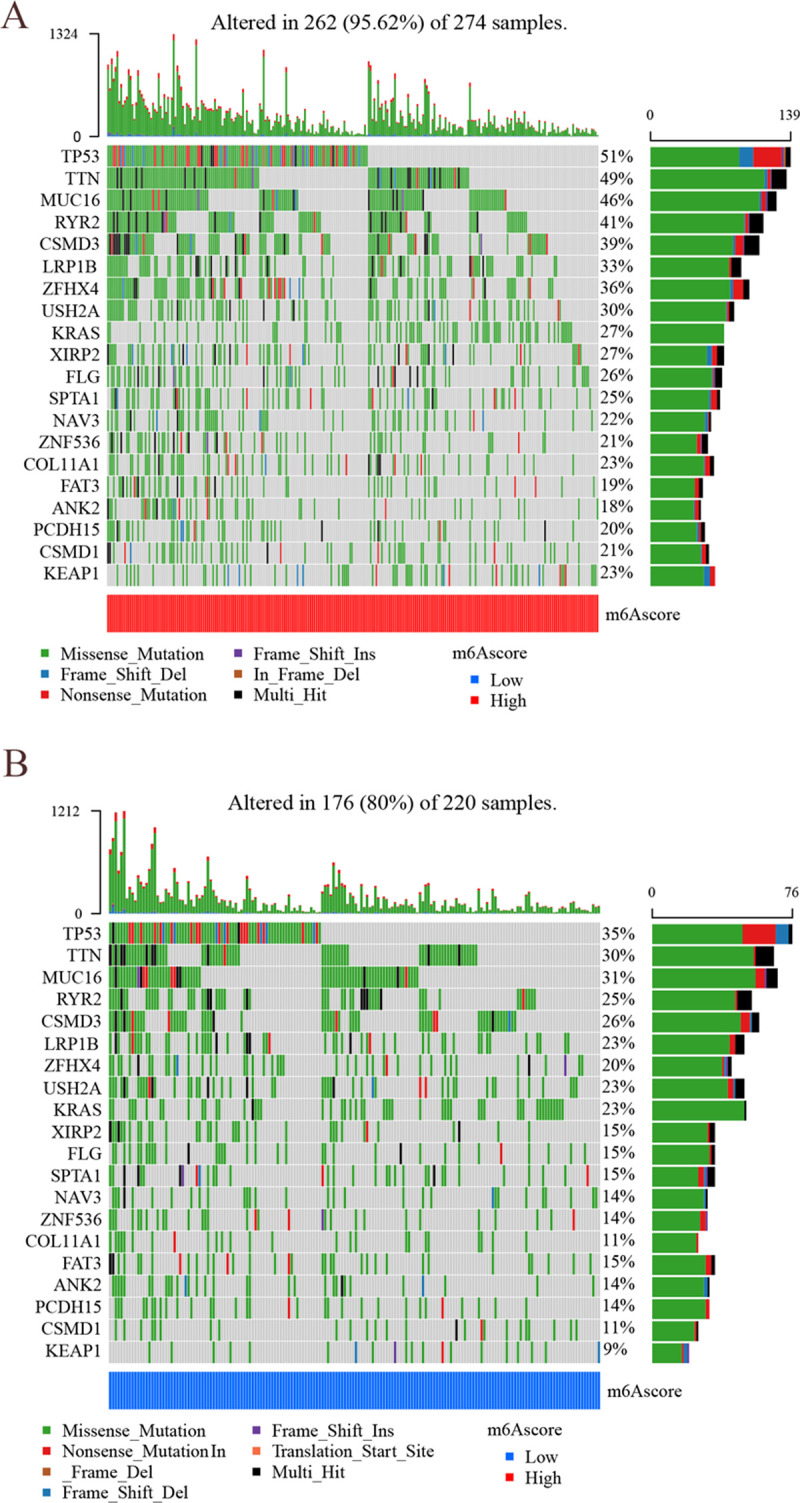
(A) The mutation rates of high m6A score groups. The left vertical coordinate indicates m6A-related modified genes, and the right vertical coordinate indicates gene mutation rate in LUAD. (B) The mutation rates of low m6A score groups. The left vertical coordinate indicates m6A-related modified genes, and the right vertical coordinate indicates gene mutation rate in LUAD.
Fig 14. Relationship between mA6 scoring and TMB.
(A) m6A score and tumor mutation load. Horizontal coordinate indicates m6A score, vertical coordinate indicates TMB, and scatter indicates genecluster. Blue: genecluster A; yellow: genecluster B; red: genecluster C. (B) genecluster-TMB analysis. Horizontal coordinates indicate high and low m6A scores, and vertical coordinates indicate TMB. (C) TMB survival analysis. Horizontal coordinates indicate survival time, and vertical coordinates indicate survival rate. Red line: high TMB group; blue line: low TMB group. (D) TMB combined m6A score survival analysis. Horizontal coordinates indicate survival time, and vertical coordinates indicate survival rate. Red line: high TMB group + high m6A score; blue line: high TMB group + low m6A score; purple line: low TMB group + high m6A score; green line: low TMB group + low m6A score.
Analysis of immune°checkpoint molecules
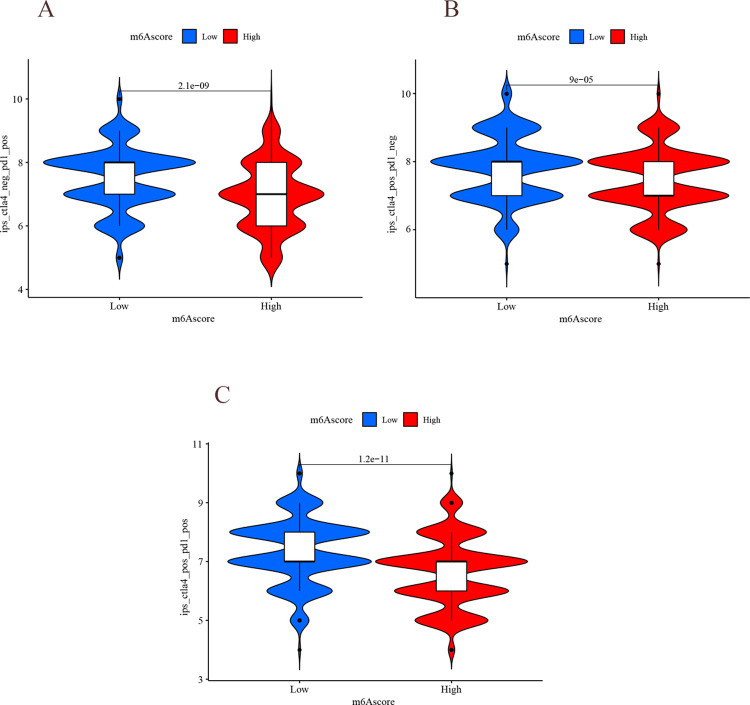
The results of correlation analysis showed a significant negative correlation between immune infiltrating cells and m6A score (Fig 15A), i.e., the lower the m6A score, the more immune infiltrating cells, which is similar to immune-inflammatory tumors, and the better the prognosis, indirectly demonstrating that m6A score can be used to distinguish tumor immune phenotypes. LUAD patients in the low m6A score group had higher expression of PD-L1 (Fig 15B), suggesting a better response to PD-L1/PD-1 immunotherapy. m6A low score group received PD-L1, CTLA-4, and combination therapy with better results than the high m6A score group (Fig 16A–16D, P<0.001). The above results suggest that the m6A score is a potential and reliable biological indicator for prognosis and the clinical efficacy assessment of immunotherapy.
Fig 15. Analysis of immune°immune correlation.
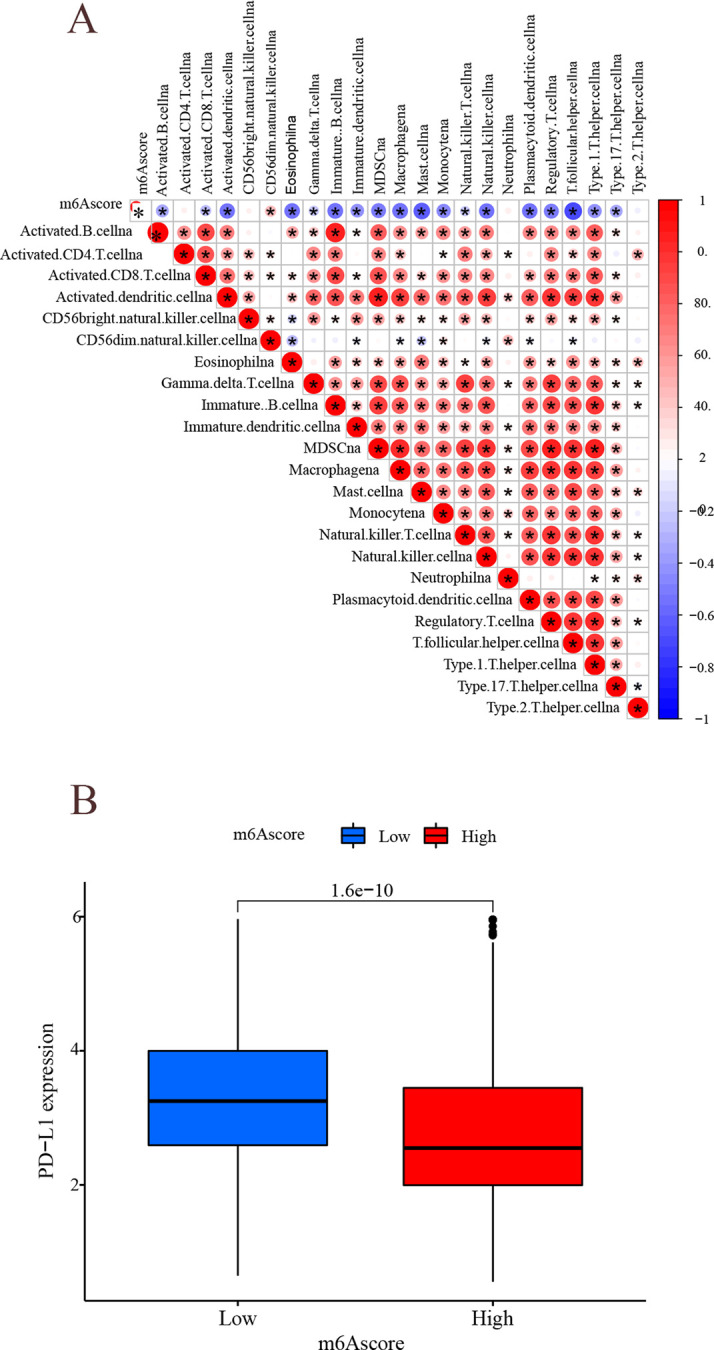
(A) Immunocorrelation analysis. Horizontal and vertical coordinates indicate immune infiltrated cells and m6A score, while the intersecting circles indicate the correlation between them. Besides, red indicates positive correlation, and blue indicates a negative correlation. The darker the color, the larger the circle, and the closer the correlation. (B) The horizontal coordinate represents the m6A subgroup and the vertical coordinate represents PD-L1 expression.
Fig 16. Analysis of immune°checkpoint molecules.
(A) Horizontal coordinate indicates m6A score, and vertical coordinate indicates the effect of PD-L1 treatment. (B) Horizontal coordinates indicate m6A score, and vertical coordinates indicate the effect of CTLA4 treatment. (C) Horizontal coordinates indicate m6A score, and vertical coordinates indicate CTLA4 combined with the effect of PD-L1 treatment.
Discussion
Increasingly, m6A regulators are being studied to play an important role in multiple aspects of inflammation, tumor, and immunity [21]. Current tumor studies have focused on the role of individual genes, but the role of multiple m6A regulators in the tumor microenvironment has been less studied. Exploring the relationship between m6A regulators and tumor microenvironment can not only help us understand the tumor microenvironment and tumor evolution, but also guide the development of immunotherapy protocols more effectively [22].
There are 23 m6A modifier genes included in this study, revealing three different m6A typings of LUAD. These three different patterns of m6A typing have distinctly different immune infiltrating cell characteristics. Cluster A is dominated by adaptive immune activation and corresponds to the immune-inflammatory type. Cluster B is dominated by intrinsic immunity and stromal activation and corresponds to the immune rejection type. Cluster C lacks immune infiltration and antigen presentation and corresponds to the immune desert type. Immunoinflammatory tumors are those in which there are more infiltrating lymphocytes in the tumor microenvironment. The immunorejection tumors are those in which immune cells are embedded in the tumor mesenchyme and appear to penetrate the mesenchyme. In fact, however, they maybe confined to the tumor envelope. The immunodesert tumors are those without immune infiltrating lymphocytes [23, 24]. A further functional analysis also confirms the above findings. Cluster A of the functions performed by m6A cluster is mainly enriched in T lymphocyte regulation and activation related. Cluster B of the biological functions performed by m6A cluster is mainly focused on the intrinsic immune response. In summary, it provides a new direction for the development of immunophenotypic typing under different m6A modifications in LUAD.
In addition, the DEGs of m6A cluster were considered as the core genes of m6A and were shown to be significantly associated with tumor-associated biological pathways. m6A cluster did not show significant differences in survival among m6A type. With the core genes of m6A further used, three gene clusters were identified, possessing characteristic gene clusters with significant differences in survival. In addition, the survival of genotypes was correlated with the immunoinflammatory phenotype, and it is possible that m6A modified regulators play a role in shaping the tumor microenvironment. To further quantify m6A modifications, a set of m6A scores were established that showed a significant negative correlation with immune infiltrating cells. Besides, the lower the m6A score value, the more significant the immune-inflammatory features. m6A score is a reliable tool that can be used to assess m6A-TME. TMB alone is not a good predictor for the effect of immune checkpoint inhibitors, and the combined m6A score can improve the ability of TMB to predict immunotherapy [25–27]. Further studies revealed that higher PD-L1 expression in low m6A received better immunotherapy, suggesting that the lymphoid infiltrating cells in the tumor microenvironment can enhance the efficacy of immune check blocking therapy, while stromal cells can exert an anti-immune check blocker effect.
Conclusions
In clinical practice, the m6A score can be used to comprehensively evaluate the m6A methylation modified regulators and their corresponding TME cell infiltration characteristics in individual patients, so as to determine the immune phenotype of tumors and guide clinical practice more effectively. In addition, the m6A score can be used to predict the clinical response to adjuvant immunotherapy. More importantly, this research provides some new insights into tumor immunotherapy by targeting m6A regulators for altering the m6A modified phenotype to convert cold tumors into hot tumors, which may provide a novel idea for the development of new drug combination strategies in the future.
Supporting information
(TIF)
(TIF)
(DOCX)
(DOCX)
(DOCX)
(DOCX)
(DOCX)
(ZIP)
Acknowledgments
Not applicable. Competing interests. The authors declare that they have no competing interests, and all authors should confirm its accuracy.
Data Availability
All relevant data are within the manuscript and its Supporting Information files.
Funding Statement
This work was supported by Zhejiang Wenzhou Science and Technology Program Project (Y20210877).
References
- 1.Collins LG, Haines C, Perkel R, Enck RE. Lung cancer: diagnosis and management. Am Fam Physician. 2007;75(1):56–63. [PubMed] [Google Scholar]
- 2.Jones GS, Baldwin DR. Recent advances in the management of lung cancer. Clin Med (Lond). 2018;18(Suppl 2):s41–s6. doi: 10.7861/clinmedicine.18-2-s41 [DOI] [PMC free article] [PubMed] [Google Scholar]
- 3.Mao Y, Yang D, He J, Krasna MJ. Epidemiology of Lung Cancer. Surg Oncol Clin N Am. 2016;25(3):439–45. doi: 10.1016/j.soc.2016.02.001 [DOI] [PubMed] [Google Scholar]
- 4.Nasim F, Sabath BF, Eapen GA. Lung Cancer. Med Clin North Am. 2019;103(3):463–73. doi: 10.1016/j.mcna.2018.12.006 [DOI] [PubMed] [Google Scholar]
- 5.Bade BC, Dela Cruz CS. Lung Cancer 2020: Epidemiology, Etiology, and Prevention. Clin Chest Med. 2020;41(1):1–24. doi: 10.1016/j.ccm.2019.10.001 [DOI] [PubMed] [Google Scholar]
- 6.Cantara WA, Crain PF, Rozenski J, McCloskey JA, Harris KA, Zhang X, et al. The RNA Modification Database, RNAMDB: 2011 update. Nucleic Acids Res. 2011;39(Database issue):D195–201. doi: 10.1093/nar/gkq1028 [DOI] [PMC free article] [PubMed] [Google Scholar]
- 7.Chen XY, Zhang J, Zhu JS. The role of m(6)A RNA methylation in human cancer. Mol Cancer. 2019;18(1):103. doi: 10.1186/s12943-019-1033-z [DOI] [PMC free article] [PubMed] [Google Scholar]
- 8.Visvanathan A, Somasundaram K. mRNA Traffic Control Reviewed: N6-Methyladenosine (m(6) A) Takes the Driver’s Seat. Bioessays. 2018;40(1). doi: 10.1002/bies.201700093 [DOI] [PubMed] [Google Scholar]
- 9.Pan Y, Ma P, Liu Y, Li W, Shu Y. Multiple functions of m(6)A RNA methylation in cancer. J Hematol Oncol. 2018;11(1):48. doi: 10.1186/s13045-018-0590-8 [DOI] [PMC free article] [PubMed] [Google Scholar]
- 10.He L, Li H, Wu A, Peng Y, Shu G, Yin G. Functions of N6-methyladenosine and its role in cancer. Mol Cancer. 2019;18(1):176. doi: 10.1186/s12943-019-1109-9 [DOI] [PMC free article] [PubMed] [Google Scholar]
- 11.Lan Q, Liu PY, Haase J, Bell JL, Hüttelmaier S, Liu T. The Critical Role of RNA m(6)A Methylation in Cancer. Cancer Res. 2019;79(7):1285–92. doi: 10.1158/0008-5472.CAN-18-2965 [DOI] [PubMed] [Google Scholar]
- 12.Lin X, Chai G, Wu Y, Li J, Chen F, Liu J, et al. RNA m(6)A methylation regulates the epithelial mesenchymal transition of cancer cells and translation of Snail. Nat Commun. 2019;10(1):2065. doi: 10.1038/s41467-019-09865-9 [DOI] [PMC free article] [PubMed] [Google Scholar] [Retracted]
- 13.Meyer KD, Jaffrey SR. Rethinking m(6)A Readers, Writers, and Erasers. Annu Rev Cell Dev Biol. 2017;33:319–42. doi: 10.1146/annurev-cellbio-100616-060758 [DOI] [PMC free article] [PubMed] [Google Scholar]
- 14.Quail DF, Joyce JA. The Microenvironmental Landscape of Brain Tumors. Cancer Cell. 2017;31(3):326–41. doi: 10.1016/j.ccell.2017.02.009 [DOI] [PMC free article] [PubMed] [Google Scholar]
- 15.Schulz M, Salamero-Boix A, Niesel K, Alekseeva T, Sevenich L. Microenvironmental Regulation of Tumor Progression and Therapeutic Response in Brain Metastasis. Front Immunol. 2019;10:1713. doi: 10.3389/fimmu.2019.01713 [DOI] [PMC free article] [PubMed] [Google Scholar]
- 16.Ritchie ME, Phipson B, Wu D, Hu Y, Law CW, Shi W, et al. limma powers differential expression analyses for RNA-sequencing and microarray studies. Nucleic Acids Res. 2015;43(7):e47. doi: 10.1093/nar/gkv007 [DOI] [PMC free article] [PubMed] [Google Scholar]
- 17.Subramanian A, Tamayo P, Mootha VK, Mukherjee S, Ebert BL, Gillette MA, et al. Gene set enrichment analysis: a knowledge-based approach for interpreting genome-wide expression profiles. Proc Natl Acad Sci U S A. 2005;102(43):15545–50. doi: 10.1073/pnas.0506580102 [DOI] [PMC free article] [PubMed] [Google Scholar]
- 18.Barbie DA, Tamayo P, Boehm JS, Kim SY, Moody SE, Dunn IF, et al. Systematic RNA interference reveals that oncogenic KRAS-driven cancers require TBK1. Nature. 2009;462(7269):108–12. doi: 10.1038/nature08460 [DOI] [PMC free article] [PubMed] [Google Scholar]
- 19.Charoentong P, Finotello F, Angelova M, Mayer C, Efremova M, Rieder D, et al. Pan-cancer Immunogenomic Analyses Reveal Genotype-Immunophenotype Relationships and Predictors of Response to Checkpoint Blockade. Cell Rep. 2017;18(1):248–62. doi: 10.1016/j.celrep.2016.12.019 [DOI] [PubMed] [Google Scholar]
- 20.Ringnér M. What is principal component analysis?. Nat Biotechnol. 2008;26(3):303–4. doi: 10.1038/nbt0308-303 [DOI] [PubMed] [Google Scholar]
- 21.Wang T, Kong S, Tao M, Ju S. The potential role of RNA N6-methyladenosine in Cancer progression. Mol Cancer. 2020;19(1):88. doi: 10.1186/s12943-020-01204-7 [DOI] [PMC free article] [PubMed] [Google Scholar]
- 22.Zhang B, Wu Q, Li B, Wang D, Wang L, Zhou YL. m(6)A regulator-mediated methylation modification patterns and tumor microenvironment infiltration characterization in gastric cancer. Mol Cancer. 2020;19(1):53. doi: 10.1186/s12943-020-01170-0 [DOI] [PMC free article] [PubMed] [Google Scholar]
- 23.Hegde PS, Chen DS. Top 10 Challenges in Cancer Immunotherapy. Immunity. 2020;52(1):17–35. doi: 10.1016/j.immuni.2019.12.011 [DOI] [PubMed] [Google Scholar]
- 24.McDermott DF, Huseni MA, Atkins MB, Motzer RJ, Rini BI, Escudier B, et al. Clinical activity and molecular correlates of response to atezolizumab alone or in combination with bevacizumab versus sunitinib in renal cell carcinoma. Nat Med. 2018;24(6):749–57. doi: 10.1038/s41591-018-0053-3 [DOI] [PMC free article] [PubMed] [Google Scholar]
- 25.Fiala O, Šorejs O, Pešek M, Fínek J. [Immunotherapy in the Treatment of Lung Cancer]. Klin Onkol. 2017;30(Supplementum3):22–31. doi: 10.14735/amko20173S22 [DOI] [PubMed] [Google Scholar]
- 26.González-Cao M, Karachaliou N, Viteri S, Morales-Espinosa D, Teixidó C, Sánchez Ruiz J, et al. Targeting PD-1/PD-L1 in lung cancer: current perspectives. Lung Cancer (Auckl). 2015;6:55–70. doi: 10.2147/LCTT.S55176 [DOI] [PMC free article] [PubMed] [Google Scholar]
- 27.Ma W, Gilligan BM, Yuan J, Li T. Current status and perspectives in translational biomarker research for PD-1/PD-L1 immune checkpoint blockade therapy. J Hematol Oncol. 2016;9(1):47. doi: 10.1186/s13045-016-0277-y [DOI] [PMC free article] [PubMed] [Google Scholar]


