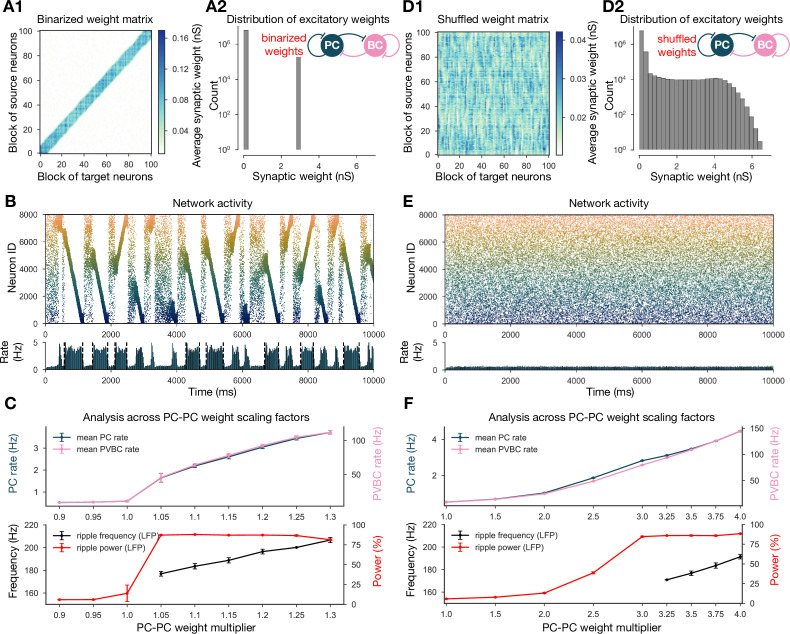
Figure 6. Altering the structure of recurrent excitatory interactions changes the network dynamics but altering the weight statistics has little effect.
(A1) Binarized (largest 3% and remaining 97% nonzero weights averaged separately) recurrent excitatory weight matrix. (Derived from the baseline one shown in Figure 1C.) (A2) Distribution of nonzero synaptic weights in the learned weight matrix shown in (A1). (B) Pyramidal cell (PC) raster plot on top and PC population rate at the bottom (see Figure 2A) from a simulation run with 1.1* the binarized weight matrix shown in (A). (C) Analysis of selected network dynamics indicators across different E-E weight scaling factors (0.9–1.3) as in Figure 3B. (D1) Column-shuffled recurrent excitatory weight matrix. (Derived from the baseline one shown in Figure 1C.) (D2) Distribution of nonzero synaptic weights in the weight matrix shown in (D1) (identical to the distribution of the baseline weight matrix shown in Figure 1C). (E) PC raster plot on top and PC population rate at the bottom from a simulation run with the shuffled weight matrix shown in (D1). (F) Analysis of selected network dynamics indicators across different E-E weight scaling factors (1.0–4.0) as in Figure 3B. Note the significantly extended horizontal scale compared to other cases.

