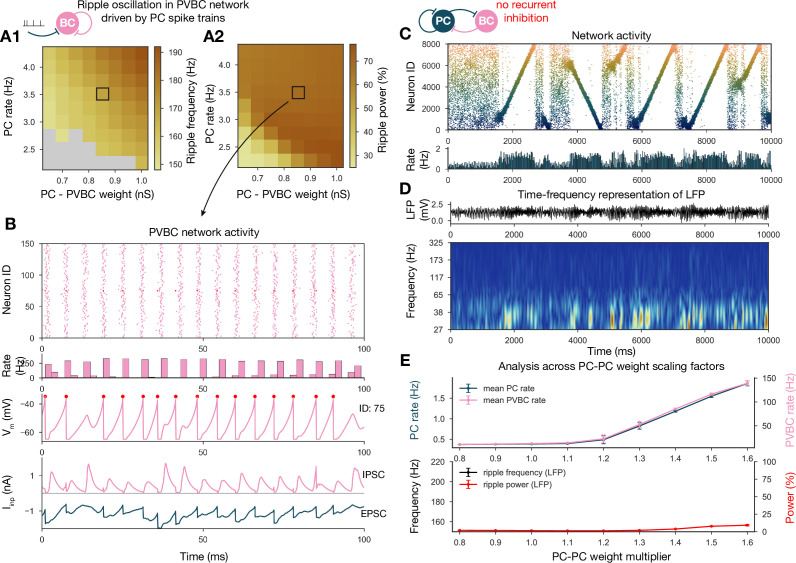
Figure 8. Generation of ripple oscillations relies on recurrent connections within the parvalbumin-containing basket cell (PVBC) population.
(A) Significant ripple frequency (A1) and ripple power (A2) of a purely PVBC network, driven by (independent) spike trains mimicking pyramidal cell (PC) population activity. Gray color in (A1) means no significant ripple peak. (B) From top to bottom: raster plot, mean PVBC rate, voltage trace (of a selected cell), EPSCs, and IPSCs of the selected cell from the middle (100-ms-long window) of a simulation used for (A). Ripple frequency and power corresponding to this simulation are marked with a black rectangle in (A1) and (A2). (C) PC raster plot on top and PC population rate at the bottom from a simulation run with a network with 1.3* baseline E-E weight matrix but without any PVBC-PVBC synapses, featuring stochastic forward and backward replays but no ripple oscillation (see below). (D) Estimated local field potential (LFP) in the top panel and its time-frequency representation (wavelet analysis) below. (Compared to Figure 2B, there is increased power in the gamma range, but no ripple frequency oscillation.) (E) Analysis of selected network dynamics indicators across different E-E weight scaling factors (0.8–1.6) as in Figure 3B.

