Abstract
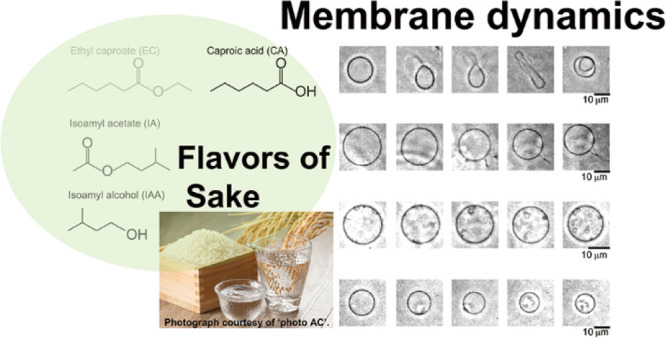
The flavors of ethyl caproate and isoamyl acetate and their precursors are crucial in sake brewing for fermentation and evaluation of the corresponding quality of drinks. However, the quality evaluation of drinks containing these flavors is challenging. Therefore, sake quality was evaluated via dynamic membrane transformation on cell-sized liposomes while adding flavor-containing solutions. Flavor varieties have been reported to influence dynamic shape change patterns. This study reports the observed difference in the dynamic shape change of each flavor. Based on these results, proper quality evaluation of drinks is expected.
Introduction
Ethyl caproate (EC) and isoamyl acetate (IA) are important flavor components in various fermented beverages and foods, including sake.(1−4) Because such flavors improve the quality of fermented beverages, an increase in their productivity is expected.
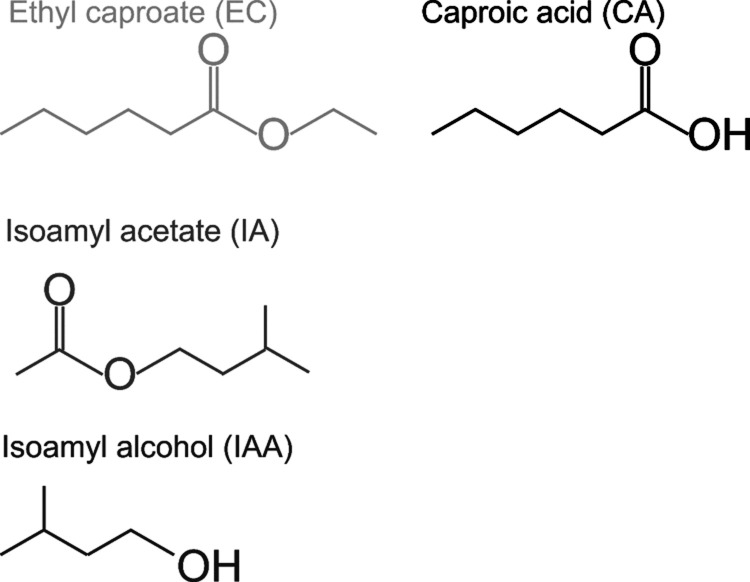
The fermentation of drinks, particularly sake, is difficult; therefore, specific techniques, such as low-temperature brewing, produce rich-flavor molecules, including EC and IA. Because yeast growth is difficult at low temperatures, maintaining a low temperature while brewing is considerably difficult.1 The production pathway of EC and IA is reported in the literature.5 Cerulenin-resistant yeast strains for improving EC production and1,5−8 5,5,5-trifluoro-dl-leucine-resistant yeast strains for improving IA production have been proposed.5,9 EC in yeast results from the condensation of caproic acid (CA) and ethanol.2 Generally, an increase in EC production in yeast is attributed to a mutation in the FAS2 gene.1 Because the FAS2 gene encodes the alpha subunit of fatty acid synthase, FAS2 mutation was assumed to decrease fatty acid synthesis, thereby decreasing the carbon chain elongation and increasing the amounts of CA and caproyl-CoA, along with the EC precursors. Therefore, EC is a subproduct of lipid elongation. IA is synthesized from isoamyl alcohol (IAA) by alcohol acyltransferase.10 CA and IAA are both known as precursors and bad flavors, respectively.5 These key flavor molecules are depicted in Figure 1. Conventionally, the contents of such flavor molecules are measured via gas chromatography (GC) or headspace GC. To measure both good flavors and off-flavors of drinks, stir-bar sorptive extraction procedures with GC/mass spectrometry may be used to measure both good flavors and off-flavors of drinks.11 Here, EC and IA are good flavors, and CA and IAA are off-flavors. Although these methods could measure flavors, the requirement for an expensive machine, the running cost, and a relatively long duration are some disadvantages. Therefore, enzyme detection has been developed to overcome these limitations. Kuribayashi et al. reported the EC content estimation using enzyme procedures for free fatty acids.12 It will help in choosing yeast strains to measure flavors such as EC concentration in sake alcohol drinks.
Figure 1.
Structure of flavor molecules in sake. EC (bright gray), CA (black), IA (gray), and IAA (dark gray).
This study explains the functions of flavor molecules using giant lipid membrane vesicles (liposomes). Previous studies have analyzed the interaction between liposomes and biomolecules such as capsaicin,13 oxidized cholesterol,14−16 local anesthetics,17,18 proteins,19 and polyphenols,.20 Moreover, dynamic shape changes are induced by several stimulations such as differences in protein aggregation level,19,21 different polyphenol structures,20 strength of stimulation on the surfactant,22 and photo-oxidation of lipids.14,23,24
Dynamic shape changes by flavors such as EC, CA, IA, and IAA are attributed to the following reason. The reason is that the radius of flavor molecule-containing lipid vesicles is small in EC, CA, IA, and IAA, and these flavors change the fluidity of membranes.25,26 Therefore, they may interact with membrane lipids and induce dynamic shape changes. This study investigated the dynamic shape changes of cell-sized liposomes induced by certain flavors for potential quality evaluation of drinks. It was observed that ethanol produces dynamic shape changes,22 which are exhibited in flavor molecules such as EC, CA, IA, or IAA in ethanol. Methanol is less effective for membrane dynamics; there was initial employment of methanol as a solvent for flavor molecules, and using ethanol as a solvent in the real world was considered.
Results and Discussion
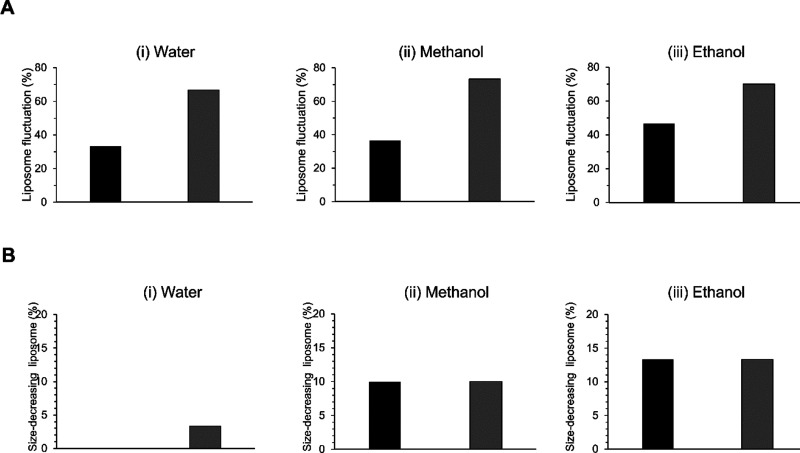
This study aims to determine whether the solvent affects the dynamic shape changes on liposomes made from 1,2-dioleoyl-sn-glycero-3-phosphocholine (DOPC). Aqueous ethanol solution was used as the alcohol beverage. In this study, the ethanol concentration (16.7%) was assumed to be drinkable. The transformations of liposomes were induced by a significant concentration (100%) of ethanol, and no dynamics was observed for low ethanol concentration (10%).22 Then, for comparison, experiments were conducted using an aqueous solution of methanol having the same concentration as the solvent. Solvent-only solutions (as negative controls) and a solution using only glucose as a solute with the solvent as solutions that generate osmotic pressure (as positive controls) were prepared. Then, experiments were conducted to observe the dynamics of the membrane. For a given surface area of vesicles, the osmotic pressure reduces the internal volume, resulting in the production of excess surface area that brings about dynamic shape changes via membrane fluctuation. Moreover, amphoteric molecules, such as surfactants, act on the membrane to increase the membrane area or pull out lipid molecules, resulting in the production or reduction of excess surface area relative to volume, although the internal volume is constant. Furthermore, dynamic shape changes are attributed to the interaction and stimulation of various molecules with membrane lipids.13−22 Consequently, the ratios of liposomes on fluctuation, which is the initial pattern of deformation, are summarized (Figure 2A). The ratio of membrane fluctuation was ∼30, 40, and 50% in water, aqueous methanol solution, and aqueous ethanol solution, respectively. When glucose was added to each solvent, the ratio of membrane fluctuations induced by osmotic pressure was ∼70%, and no substantial difference was noted when different solvents were used.
Figure 2.
Membrane transformations in each solvent. (A) Percentage of liposome fluctuation. (B) Size reduction of liposomes [the ratio of significant size decreasing (over 10%) vesicle]. Black bar indicates solvent and gray bar indicates 2 mM glucose (gray).
The dynamics of reducing the size of membrane vesicles was then explored (Figure 2B). The order of frequency on size was ethanol, methanol, and water in a descending order. This can be owing to the molecular size which follows the same descending order. Moreover, the ease with which the membrane vesicle size was reduced did not significantly vary even when the osmotic pressure was changed, and the difference in solvents seemed large.
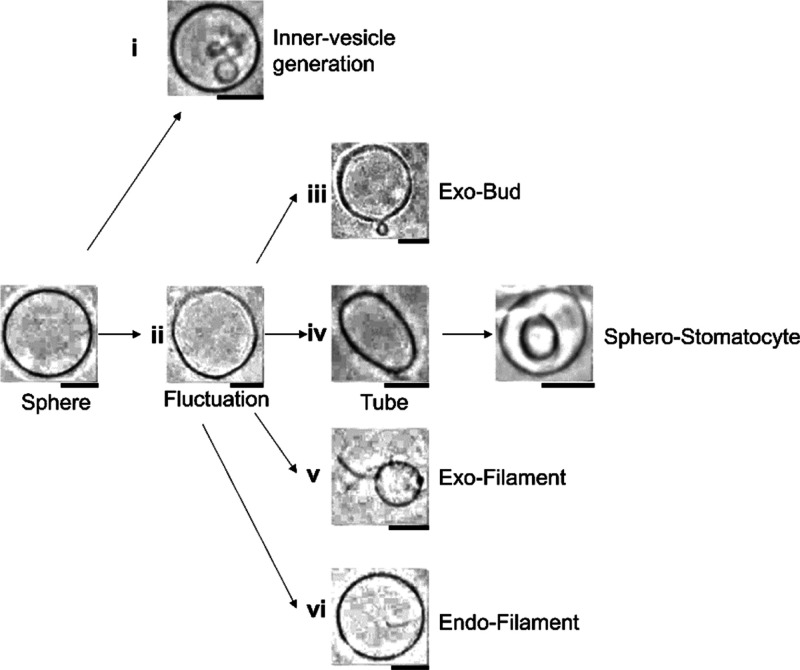
Figure 3 shows the summary of the dynamics of membrane vesicles under ∼10 min of observation. Six dynamic shape changes were observed as follows: (i) Small vesicles (sometimes multiple) appear inside the vesicles over time without fluctuation (Figure 3i) and (ii) the membrane fluctuates (Figure 3ii). After this stage, dynamic shape changes occurred (Figure 3iii–vi). To the best of my knowledge, the osmotic-induced dynamic shape changes of inner vesicle generation (Figure 3i) have not been reported; however, they were similar to the dynamic shape changes previously observed with stimulation via theaflavin on a flavonoid.20
Figure 3.
Typical membrane transformation pathways of liposomes in different solvents and 2 mM glucose solution. Six pathways were observed: (i) inner vesicle generation, (ii) fluctuation, (iii) exo-bud, (iv) tube and sphero-stomatocyte, (v) exo-filament, and (vi) endo filament. Scale bar = 10 μm.
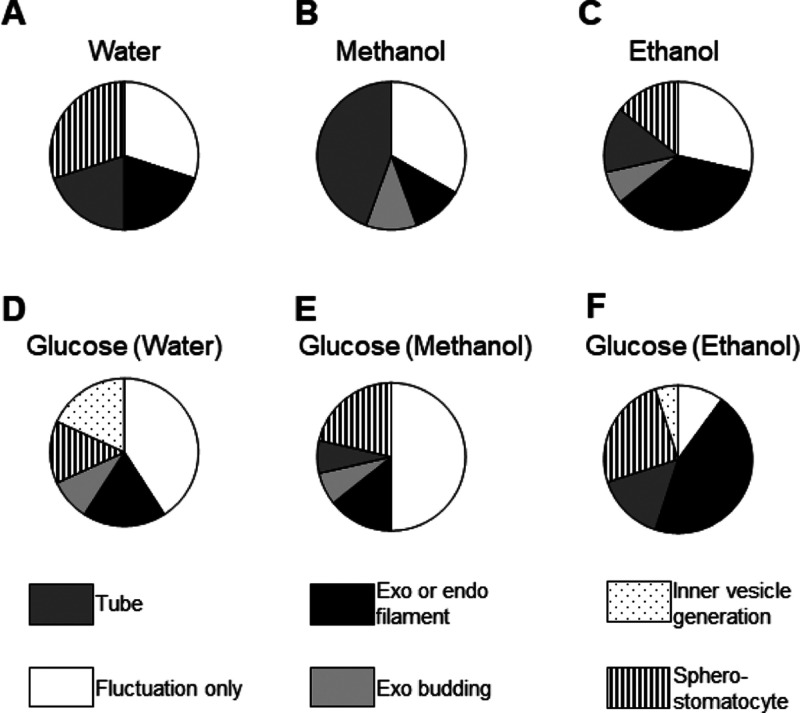
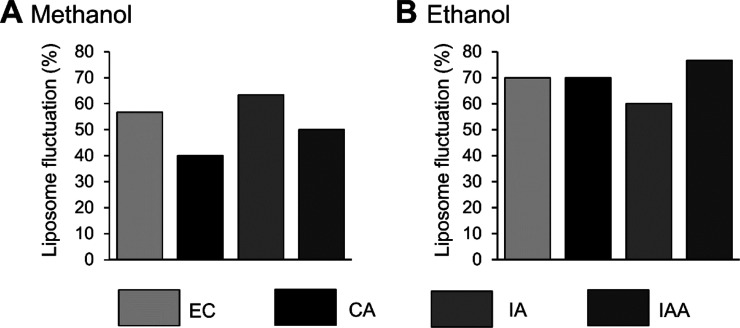
Figure 4 summarizes the rate of membrane deformations with pie charts. A difference in frequency in the appearance of morphological changes on liposome was observed when the solvent underwent dynamic shape changes due to osmotic pressure. A high ratio of sphero-stomatocytes against glucose was observed with both methanol and ethanol. Those are present when the excess surface area created by the osmotic pressure produced by glucose and the solvents is large. These experiments were performed as negative and positive controls for flavor molecule-induced membrane dynamics. Then, the dynamics of the membrane of the DOPC liposomes in the aqueous methanol and ethanol solution containing flavor molecules was observed. The rate at which the membrane fluctuation was observed is shown in Figure 5. The order of the number of fluctuating cell-sized liposomes in methanol is IA > EC > IAA > CA and that in ethanol is IAA > EC = CA > IA. The difference in liposome fluctuation was not as great as when the solvent was not methanol. Additionally, membrane fluctuation rate in ethanol is substantial because ethanol deforms the vesicles. This observation is consistent with previous reports.22
Figure 4.
Effect of solvent on osmotic stress-induced membrane transformation. Distribution profile of transformation pathways of each condition (n ≥ 30). (A) Water, (B) methanol, (C) ethanol, (D) 2 mM glucose in water, (E) 2 mM glucose in methanol, and (F) 2 mM glucose in ethanol.
Figure 5.
Membrane transformations in each solvent. Percentage of fluctuation liposomes induced by flavor molecules in methanol (A) and ethanol (B) solutions.
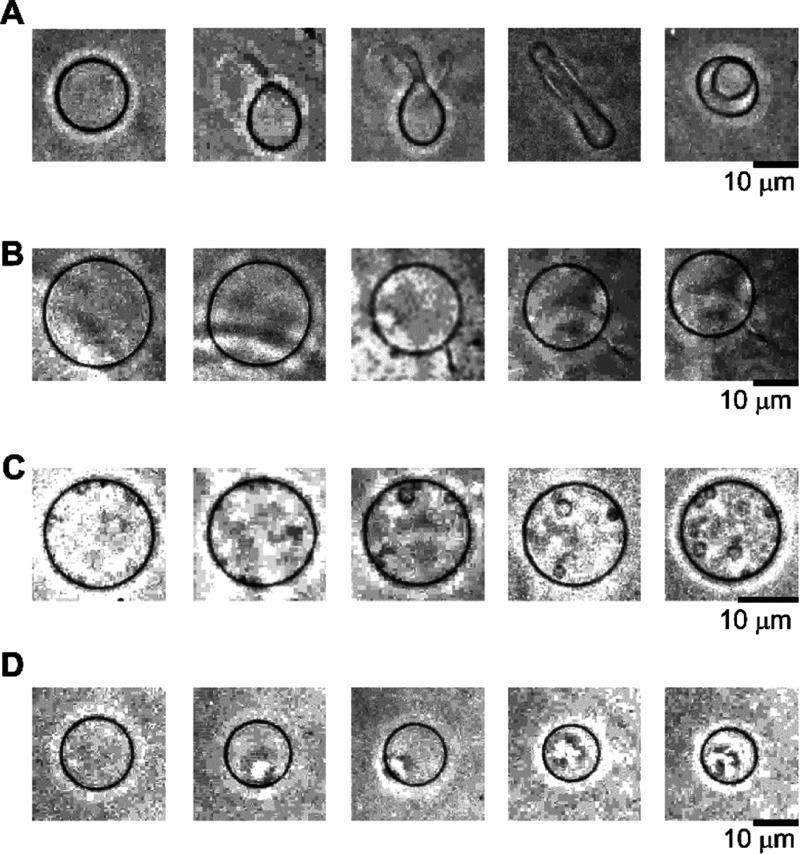
A typical membrane transformation diagram is shown in Figure 6. Initially, the membrane was spherical (circular in the microscopic image) and cell-sized. Two categories of membrane dynamics, with and without fluctuation, were observed. Figure 6A,B shows the results transformed after membrane fluctuation. Microscopic images showed the liposome transformation pathway after fluctuation, which pushed out the vesicles, turned into a tube, and invaded inside (Figure 6A). As shown in Figure 6A, it was possible to observe what became a tube halfway and what was spit out. Figure 6B had a stringlike part that grew, and the original vesicles became smaller. It was also possible to observe a membrane transformation similar to that of Figure 6B (similar to that of Figure 3vi), in which a string was formed inside the vesicles, and the size became smaller. Those existed (sometimes multiple) of small vesicles inside the vesicles over time without fluctuation (Figure 6C). The decrease in size without fluctuation (Figure 6D) was observed frequently.
Figure 6.
Typical membrane transformation pathways of liposomes in response to the presence of different types of flavor molecules. The original state of membrane transformations is sphere liposomes (left liposomes). Some liposomes were fluctuated and transformed. (A) One of the typical pathways and shapes of liposomes was changed to exo-budding, tube, and sphero-stomatocyte after fluctuation. (B) Shape of liposomes changed to mother vesicle with exo-filament. The filament became long. (C) Inner vesicle(s) generation. (D) Size of liposomes was decreased without fluctuation. The images were captured in real time using a phase-contrast microscope recorded at 30 frames per second. They were subsequently processed using the cellSens and ImageJ.
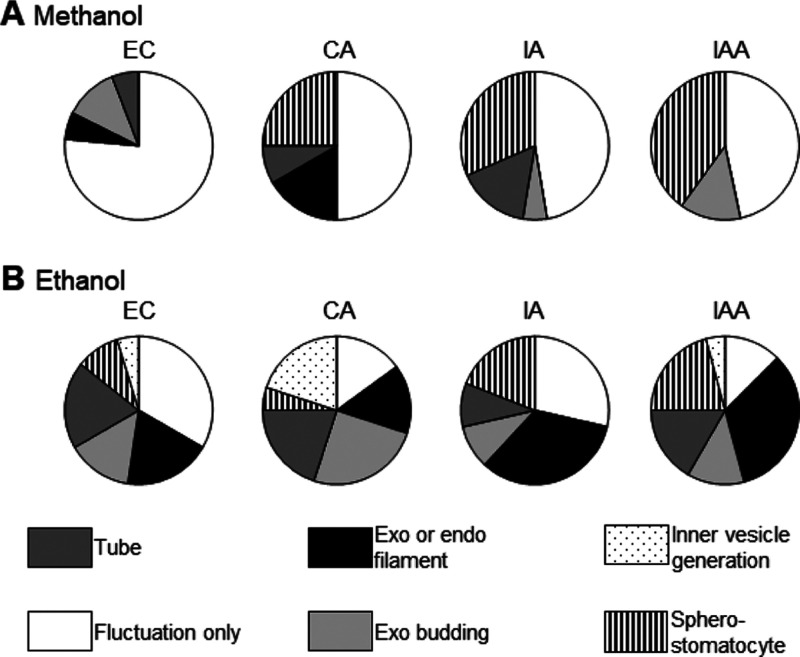
The ratio of membrane transformation dynamics to the fluctuated cell size liposomes is presented in a pie chart (Figure 7). When the solvent was methanol, in EC, the order of the ratio of membrane deformation was only fluctuation > exo-budding > exo/endo filaments > tube, whereas that in CA, it was only fluctuation > sphero-stomatocyte > exo or endo filament > tube. In IA, the membrane deformation order was observed in the order of fluctuation, sphero-stomatocyte, tube, and inner vesicle generation. Fluctuations were the most prominent in IAA, followed by sphero-stomatocyte and exo-budding. When the solvent is ethanol, in EC, fluctuation acquired the first position, and the ratio to form both exo or endo filament and the tube is the second, followed by exo-budding and sphero-stomatocyte. In CA, the order of the ratio of membrane deformation was exo-budding > tube = inner vesicle formation > fluctuation = exo or endo filaments > sphero-stomatocyte. In IA, the ratio of membrane transformation decreased in the order of the formation of exo or endo filament, fluctuation, sphero-stomatocyte, both tube, and exo-budding at the same rate. However, in IAA, the results of membrane transformation decreased in the following order: formation of exo or endo filament > tube = sphero-stomatocyte > exo-budding = fluctuation > inner vesicle generation.
Figure 7.
Flavor-induced membrane transformations. Distribution of membrane transformation pathways induced by the flavor molecules in methanol (A) and ethanol (B) solutions.
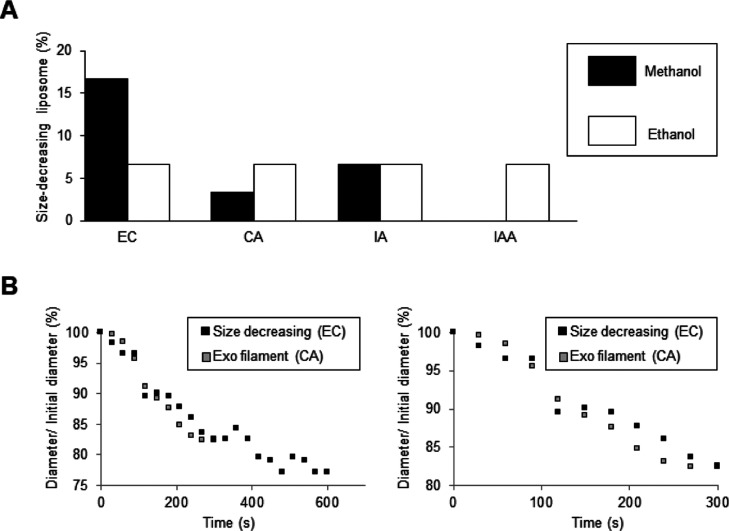
The ratio of membrane dynamics without fluctuation and whose diameter decreased by 10% or more in the observation is summarized in Figure 8A. Methanol solvent is shown by a black bar graph and ethanol by white. When methanol is used as a solvent, the order of EC, IA, and CA was not the same as in IAA, and all flavor molecules had the same ratio as that for the ethanol solvent (Figure 8A white bars). It was also characterizing the decreasing manner, in order to investigate how to reduce the diameter of the cell-sized liposome whose diameter decreases without fluctuation (Figure 8B black square). That is compared with the type of membrane deformation in which the exo-filament for a typical example pathway for reduce the diameter with fluctuation (Figure 8B white square). First, the exo-filament pattern was described. The size of the liposome decreased linearly from 60 s after the string was released to 240 s after the filament was released and became constant after 300 s. The figure on the left of B is focused and enlarged up to 600 s, and then the figure on the right is focused and enlarged up to 300 s. Subsequently, size decrease without fluctuation was explained. Those whose size decreased without fluctuation seemed to have a large decrease time and an almost constant time in some places. Therefore, it was discovered that those whose size decrease without fluctuation have a characteristic size decrease. Next, when the solvent was ethanol, it appeared at a constant frequency in each case, and no difference was seen for each flavor component.
Figure 8.
Size decrease of liposomes. (A) Ratio of significant size decreasing (over 10%) vesicle in the presence of flavor molecules; (B) time-dependent change in the diameter of the liposome in response to EC (black) and CA (gray).
In the first part, the dynamic shape changes of liposomes were researched and stimulated by solvent-containing methanol or ethanol and osmotic condition made by glucose. That was tried to understand the impact of organic solvent on membrane dynamics. The reason to know the facts why was alcoholic drinks containing ethanol as alcohol. As shown by the results in Figure 2A, the frequency of occurrence fluctuation was not so different for the solvent kind, though the presence of osmotic pressure was important. Contrarily, as shown in Figure 2B, the frequency of occurrence of decreasing the size affects the kinds of solvents. The following was hypothesized. These phenomena were caused by differences in fat solubility on solvents. Because ethanol has a relatively long carbon chain rather than methanol, it is susceptible to decrease the dynamic shape change of liposomes caused by the soluble membrane to pull out lipid molecules on membranes to solvents. It was shown for some kinds of observed dynamics (Figure 3) and the frequency of occurrence (Figure 4). It was observed that the same osmotic pressure produced different dynamics of occurrence in line with the kinds of solvents. Significantly, osmotic ethanol solution contains glucose induced in a high ratio of sphero-stomatocyte. This was known and observed to generate an excess surface area of liposomes.19,27 Flavor-induced dynamic shape changes were studied, and the results are shown from Figures 5 to 8. As described above, dynamic shape changes occurred by excess area generation. With the increase in area, there was liposome fluctuation, tubulation, exo-budding, and sphero-stomatocyte. One of the causes of excess area generation was the escape of inner water to reduce the volume. Another cause is an increase in the membrane area even under a constant inner volume. The membrane contains lipids that have hydrophobic properties. Therefore, it was thought that the hydrophobic solute attached to membranes is in contrast to the hydrophilic solute, which neither interacts with membranes nor works as osmotic pressure to pull out the inner solvent of the liposome and reduce the volume. This present study uses four kinds of flavor molecules. Each flavor molecule induced different dynamic shape change patterns based on their chemical structures and characteristics, particularly in hydrophobicity and hydrophilicity. Four flavor molecules were chosen based on their importance on fermentation and their influence on the quality of drinks. Therefore, the characteristics of those flavors are not considered to be based on their hydrophobic or hydrophilic structures (Figure 1). Here, the effects of the structures and physiochemical properties of the flavor molecules on the frequency of occurrence of fluctuation are discussed. Interestingly, the frequency of occurrence of fluctuation corresponded with the length of the carbon chain (Figures 1 and 5A). The melting point of each flavor molecule is minus 67.0 °C, minus 3.0 °C, minus 78.5 °C, and minus 177.2 °C for EC, CA, IA, and IAA, respectively. The properties may not relate to the frequency of occurrence of fluctuation in ethanol or methanol (Figure 5). However, based on the structure, only CA shows acidity in the flavor molecules because it has a carboxylic group (Figure 1). The acidic properties of CA may affect the frequency of occurrence of fluctuation in ethanol at low ratios (Figure 5A). The results indicate that the strength of interaction between the lipids and membrane depends on each flavor molecule. When using ethanol solvent, EC and CA showed the same frequency of fluctuation occurrence, and the total trends were almost reversed (Figure 5). Methanol induces fluctuation (Figure 2A), and when using the methanol solvent, a more effective molecule for membrane fluctuation might be a smaller molecule. The fluctuation frequency was considerably higher when ethanol was used than when methanol was used as a solvent. Comparing the fluctuation frequency of glucose between flavors, while using methanol as the solvent, flavors were fewer than glucose. In contrast, fluctuation frequency of flavors was more than glucose when using ethanol as the solvent. According to these findings, the flavors not only work as osmotic pressure but also interact with membranes to fluctuate after dynamics. The frequency of occurrence on the kinds of membranes dynamics differently corresponds to flavor molecules (Figures 6 and 7). Although the reasons or mechanisms for the results corresponding to each flavor molecule were difficult to realize because of several factors, such as solvent polarity, hydrophobicity, and/or hydrophilicity of flavors, the finding that dynamic shape change difference is observed in each flavor molecule is important. The condition of ethanol solvent was fitted to drinks concentration of ethanol. Because ethanol has the character of soluble membrane lipid and causes fluctuation, the ethanol solvent-containing flavors eventually cause dynamics (Figures 6 and 7). We already reported that to make liposome-containing flavor molecules (EC, CA IA, and IAA) and their strength, the difference between a decrease in the size of liposomes and their concentration depends on these flavors.25,26 Flavor molecules applied from the exterior after creating liposomes were studied in this work. Observation of dynamic shape changes revealed that the difference in frequency of occurrence of dynamic shape changes corresponded with each flavor molecule in each solvent. These dynamics were different from those caused by glucose-induced osmotic stress-busting by glucose.
The compositions of biological membranes are significant for the performance of several functions of life. The membrane properties are according to cell, organism, and membrane type.28 Studies of actual yeast cells reported that cell size differences corresponded to flavor production.25,26,29 Morphological change of liposomes has received considerable attention recently, for example, the morphological change phase diagram is formed by the balance between the surface area and the encapsulation volume in the cell model.30,31 It is well analyzed that the resulting excess surface area and deformation of liposomes due to osmotic pressure make the internal water escape to the surface to reduce the volume, increase the surface area of membrane lipids via isomerization, and so on.31−33 Some studies have shown that membrane deformation occurs because the area of the membrane increases due to stimuli such as heat, and excess surface area is created while maintaining the internal volume.13,15,16,34 It has also been reported that liposome transformation is caused by a specific molecular interaction such as detergent22,35 or polyphenol19,36 with membrane lipid molecules. Recently, the impact of solvent selection on the microfluidic production of liposomes was reported.37 The study reported that reducing the polarity of the solvent increased the liposome particle size. It was also reported by a study aiming to select microorganisms to understand interactions between the organic solvent and lipid membranes.38 Organic solvent serving as a detergent to membranes and producing membrane transformation was also reported,22 and those phenomena were applied to evaluate irritation of the detergents.39 The present study proposes the quality evaluation of drinks using membrane dynamics in the solvent-containing flavor molecules.
Previously, our team had measured the concentration of such flavor molecules in sake. Therefore, the actual concentration was shown as an example of the concentration of such flavors that we reported previously; the actual concentration on the sake was 75, 16, and 100 μM for EC, IA, and IAA, respectively.26 This study is the first to report the dynamic shape changes induced by sake flavor molecules; 2 mM flavor solution was used with the same concentration and compared with glucose as the positive control solution. In the future, the low concentration effect to solve such problems will be investigated. Furthermore, it will be used at nearly the same concentration with this study as pretreatment concentrated sake, such as made in freezing concentration.40
These findings suggest that by utilizing the phenomenon, it will be possible to distinguish different kinds of flavors in beverages to assess the quality of drinks that include glucose and flavors often. Although several flavor molecules can exist in sake, the differences in dynamic shape change can distinguish the flavor constituents of sake, as expected. As this study found that each flavor induced a different dynamic shape change pattern, it can be observed that each pattern on dynamic shape change of liposomes by each sake drink is based on each flavor component, though this is still a hypothesis that needs further investigation. This study found that the frequency of dynamic shape changes varies depending on the type of key flavor molecule on sake drinks. It is not known how much the difference will be or if the difference can be discerned, when this is caused by dynamic shape changes because sake at low concentrations contained more types and various combinations compared to this number. This time, the difference in the key flavor element on sake drinks can cause a difference in the frequency of dynamic shape changes; therefore, the frequency of dynamic shape changes caused by various sakes with different combinations of flavor components will be investigated. This characterizes membranes dynamics individually using a microscope with a magnification of 1000 times. It was thought to apply these phenomena to evaluate the quality of flavors containing drinks to use microscopic observation of 200 or 500 times for a more widely focused area. This study counted sphere liposomes just after mixing the target drinks with the liposome solution and compared the shapes of liposomes after 10 min. It also would be expected to just use a smartphone with some attachment. These applications need a database of membrane shape corresponding to several kinds of drinks. Recently, measurement of membrane response through transduction of mechanical stresses detected several solvents, such as water alcohols (i.e., methanol, ethanol, and 2-propanol), acetone, ethyl acetate, alkanes (i.e., n-hexane and n-heptane), and aromatics (i.e., benzene and toluene).41,42 They reported that membranes are used to detect molecular mass through molecular mass analysis.43 Membrane response patterns have the potential to be used as a sensor. When membrane patterns as a photo picture could determine the quality of membranes, it could detect the quality of drinks without complex chromatography (i.e., GC or liquid chromatography) with its initial cost and relatively higher running cost such as in pure gas or solutions. In an ideal scenario, we would just need to prepare a microscope and a personal computer with artificial intelligence (AI) (for use in analyzing microscopic images), and the ongoing costs would be liposome solution and glassware, both of which are reasonably inexpensive.
In this study, liposomes were made by natural swelling techniques, such as droplet techniques, inverted emulsion techniques, and electroformation techniques for making methods of liposomes.44−47 It was reported that the strength of membrane tension properties has several trends corresponding to these techniques.47 When a database for the investigation of drinks with good reproducibility is made in the future, the production techniques of liposomes will have to be carefully chosen according to the properties of each membrane.
Our institute has supported alcohol producers to produce alcoholic drinks and to help increase the quality. The higher position in the competition is one of the points of quality evaluation. Although the total quality and balance are evaluated for drinks in the latest competition, EC and glucose concentration are crucial considerations. Because of their importance, the study’s findings will be relevant in the proximate future for these two criteria. This research applies not only to material science in terms of membrane properties in organic solvents but also to the potential quality assessment of drinks.
Materials and Methods
Materials
DOPC and IAA were obtained from Tokyo Chemical Industry Co., Ltd. (Japan). CA and chloroform were acquired from Aldrich (USA) and Kanto-Chemical (Japan), respectively. EC, IA, acetone, methanol, and glucose were supplied by Wako Pure Chemical (Japan). Ethanol was acquired from FUJIFILM Wako pure chemical (Japan). Ultrapure water obtained from a Millipore Milli-Q purification system (Millipore, Bedford, MA, USA) was used for reagent preparation and cleaning glassware.
Preparation of Liposomes
The glass test tubes were rinsed with acetone and dried in the draft chamber. Liposomes (lipid vesicle, giant unilamellar vesicles, and model membranes) were prepared to obtain a slightly modified version of our previous study’s method of natural swelling from dry lipid films to make lipid vesicles.14−18 DOPC was dissolved in chloroform in a glass test tube under nitrogen conditions and dried under vacuum for 3 h to form thin lipid films. The films were then hydrated overnight with ultrapure water at room temperature (20 °C). The final concentration of the hydrated film was 0.2 mM.
Preparation of Flavor Solutions
The flavor solutions were prepared by slightly modifying the procedure reported in a study.20 Some steps were modified considering earlier research; for example, EC, CA, IA, and IAA were prepared by dissolving in methanol/ethanol. All stock solutions were prepared at a concentration of 30 mM and stored at 20 °C. For tests, methanol/ethanol was diluted 15 times with Milli-Q water in all solutions. The final working solution had a flavor concentration of 2 mM and a methanol/ethanol concentration of 16.7%.
Microscopic Observation
Equal volumes of the lipid vesicle solution (6 μL) and flavor molecules or glucose solution (6 μL, 2 mM) were poured into a test tube and gently mixed by soft tapping.14,19,20 The aforementioned mixed solution (6 μL) was placed in a silicon well (0.2 mm) in a glass slide and covered with a small coverslip.26 The changes in membrane morphology were observed using a phase-contrast microscope (Olympus BX-53, Japan) at RT.14
Image Analysis
During the observation, images of changes in membrane morphology were recorded on a hard disc drive at 30 frames s–1. The images were then processed using Microsoft Photos and ImageJ. The membrane fluctuation in liposomes was numerically confirmed for each distribution of radius at each 3.6° (r(θ, t) (θ = 2π/n, n = 0, 1, 2, ..., 100)). When the value σ ≤ sqr(r(θ) – ⟨r⟩)2 > /⟨r⟩ is ≥1.3%, the liposome is considered as fluctuating.14−16,20
Acknowledgments
Akira Ogura, Tomoaki Saito, Dr. Seiji Kakuta, and Dr. Tomoko Akada-Fukasawa gave valuable discussion and comments. The author would like to thank Enago (www.enago.jp) for the English language review.
Glossary
Abbreviations
- EC
ethyl caproate
- CA
caproic acid
- IA
isoamyl acetate
- IAA
isoamyl acetate
- DOPC
1,2-dioleoyl-sn-glycero-3-phosphocholine
- AI
artificial intelligence
- GC
gas chromatographic
- HSGC
headspace gas chromatographic
- GC/MS
GC/mass spectrometry
- FFAs
free fatty acids
- RT
room temperature
Author Contributions
The manuscript was written through contributions of all authors. All author has given approval to the final version of the manuscript.
This work was supported by Intelligent Cosmos Award (Intelligent Cosmos Foundation), Konica Minolta Imaging Science Encouragement Award (Konica Minolta Science and Technology Foundation), the Shorai Foundation for Science and Technology, a Grant-in-Aid for Young Scientist Research (20K19699) from Japan Society for the Promotion of Science (JSPS) and Grant of a research challenge, and third term research project from Aomori Prefectural Industrial Technology Research Center.
The author declares no competing financial interest.
References
- Ichikawa E.; Hosokawa N.; Hata Y.; Abe Y.; Suginami K.; Imayasu S. Breeding of a Sake Yeast with Improved Ethyl Caproate Productivity. Agric. Biol. Chem. 1991, 55, 2153–2154. 10.1080/00021369.1991.10870932. [DOI] [Google Scholar]
- Ichikawa E. Sake Yeast with Improved Ethyl Caproate Productivity. Nihon Jozo gakkaishi 1993, 88, 101–105. (in Japanese) 10.6013/jbrewsocjapan1988.88.101. [DOI] [Google Scholar]
- Akita O. Breeding of Sake Yeast Producing a Large Quantity of Aroma. Nihon Jozo gakkaishi 1992, 87, 621–625. (in Japanese) 10.6013/jbrewsocjapan1988.87.621. [DOI] [Google Scholar]
- Verstrepen K. J.; Derdelinckx G.; Dufour J.-P.; Winderickx J.; Thevelein J. M.; Pretorius I. S.; Delvaux F. R. Flavor-active esters: Adding fruitiness to beer. J. Biosci. Bioeng. 2003, 96, 110–118. 10.1016/s1389-1723(03)90112-5. [DOI] [PubMed] [Google Scholar]
- Brett Mason A.; Dufour J. P. Alcohol acetyltransferases and the significance of ester synthesis in yeast. Yeast 2005, 16, 1287–1298. . [DOI] [PubMed] [Google Scholar]
- Tsutsumi S.; Mochizuki M.; Sakai K.; Ieda A.; Ohara R.; Mitsui S.; Ito A.; Hirano T.; Shimizu M.; Kato M. Ability of Saccharomyces cerevisiae MC87-46 to assimilate isomaltose and its effects on sake taste. Sci. Rep. 2019, 9, 13908. 10.1038/s41598-019-50384-w. [DOI] [PMC free article] [PubMed] [Google Scholar]
- Aritomi K.; Hirosawa I.; Hoshida H.; Shiigi M.; Nishizawa Y.; Kashiwagi S.; Akada R. Self-cloning yeast strains containing novel FAS2 mutations produce a higher amount of ethyl caproate in Japanese sake. Biosci. Biotechnol. Biochem. 2004, 68, 206–214. 10.1271/bbb.68.206. [DOI] [PubMed] [Google Scholar]
- Goshima T.; Nakamura R.; Kume K.; Okada H.; Ichikawa E.; Tamura H.; Hasuda H.; Inahashi M.; Okazaki N.; Akao T.; Shimoi H.; Mizunuma M.; Ohya Y.; Hirata D. Identification of a mutation causing a defective spindle assembly checkpoint in high ethyl caproate-producing sake yeast strain K1801. Biosci. Biotechnol. Biochem. 2016, 80, 1657–1662. 10.1080/09168451.2016.1184963. [DOI] [PubMed] [Google Scholar]
- Ashida S.; Ichikawa E.; Suginami K.; Imayasu S. Isolation and application of mutants producing sufficient isoamyl acetate, a sake flavor component. Agric. Biol. Chem. 1987, 51, 2061–2065. 10.1080/00021369.1987.10868367. [DOI] [Google Scholar]
- Mason A. B.; Dufour J.-P. Alcohol acetyltransferases and the significance of ester synthesis in yeast. Yeast 2000, 16, 1287–1298. . [DOI] [PubMed] [Google Scholar]
- Ochiai N.; Sasamoto K.; Takino M.; Yamashita S.; Daishima S.; Heiden A.; Hoffman A. Determination of trace amounts of off-flavor compounds in drinking water by stir bar sorptive extraction and thermal desorption GC-MS. Analyst 2001, 126, 1652–1657. 10.1039/b102962m. [DOI] [PubMed] [Google Scholar]
- Kuribayashi T.; Kaneoke M.; Hirata D.; Watanabe K.-i. Analysis of Free Fatty Acids in Sake by an Enzymatic Method and Its Application for Estimating Ethyl Caproate and Selecting Yeast with High Productivity of the Ester. Biosci. Biotechnol. Biochem. 2012, 76, 391–394. 10.1271/bbb.110698. [DOI] [PubMed] [Google Scholar]
- Sharma N.; Phan H. T. T.; Yoda T.; Shimokawa N.; Vestergaard M. d. C.; Takagi M. Effects of Capsaicin on Biomimetic Membranes. Biomimetics 2019, 4, 17. 10.3390/biomimetics4010017. [DOI] [PMC free article] [PubMed] [Google Scholar]
- Yoda T.; Vestergaard M. d. C.; Akazawa-Ogawa Y.; Yoshida Y.; Hamada T.; Takagi M. Dynamic Response of a Cholesterol-containing Model Membrane to Oxidative Stress. Chem. Lett. 2010, 39, 1273–1274. 10.1246/cl.2010.1273. [DOI] [Google Scholar]
- Vestergaard M. d. C.; Yoda T.; Hamada T.; Akazawa Y.; Yoshida Y.; Takagi M. The effect of oxycholesterols on thermo-induced membrane dynamics. Biochim. Biophys. Acta, Biomembr. 2011, 1808, 2245–2251. 10.1016/j.bbamem.2011.05.002. [DOI] [PubMed] [Google Scholar]
- Yoda T.; Vestergaard M. d. C.; Hamada T.; Le P. T. M.; Takagi M. Thermo-induced Vesicular Dynamics of Membranes Containing Cholesterol Derivatives. Lipids 2012, 47, 813–820. 10.1007/s11745-012-3695-9. [DOI] [PubMed] [Google Scholar]
- Sugahara K.; Shimokawa N.; Takagi M. Destabilization of Phase-separated Structures in Local Anesthetic-containing Model Biomembranes. Chem. Lett. 2015, 44, 1604–1606. 10.1246/cl.150636. [DOI] [Google Scholar]
- Sugahara K.; Shimokawa N.; Takagi M. Thermal Stability of Phase-Separated Domains in Multicomponent Lipid Membranes with Local Anesthetics. Membranes 2017, 7, 33. 10.3390/membranes7030033. [DOI] [PMC free article] [PubMed] [Google Scholar]
- Phan H. T. T.; Hata T.; Morita M.; Yoda T.; Hamada T.; Vestergaard M. d. C.; Takagi M. The effect of oxysterols on the interaction of Alzheimer’s amyloid beta with model membranes. Biochim. Biophys. Acta, Biomembr. 2013, 1828, 2487–2495. 10.1016/j.bbamem.2013.06.021. [DOI] [PubMed] [Google Scholar]
- Phan H. T. T.; Yoda T.; Chahal B.; Morita M.; Takagi M.; Vestergaard M. d. C. Structure-dependent interactions of polyphenols with a biomimetic membrane system. Biochim. Biophys. Acta, Biomembr. 2014, 1838, 2670–2677. 10.1016/j.bbamem.2014.07.001. [DOI] [PubMed] [Google Scholar]
- Vestergaard M. d. C.; Morita M.; Hamada T.; Takagi M. Membrane fusion and vesicular transformation induced by Alzheimer’s Amyloid beta. Biochim. Biophys. Acta, Biomembr. 2013, 1828, 1314–1321. 10.1016/j.bbamem.2013.01.015. [DOI] [PubMed] [Google Scholar]
- Hamada T.; Hagihara H.; Morita M.; Vestergaard M. d. C.; Tsujino Y.; Takagi M. Physicochemical profiling of surgfactant-induced membrane dynamics in a cell-sized liposome. J. Phys. Chem. Lett. 2012, 3, 430–435. 10.1021/jz2016044. [DOI] [PubMed] [Google Scholar]
- Kerdous R.; Heuvingh J.; Bonneau S. Photo-dynamic induction of oxidative stress within cholesterol-containing membranes: shape transitions and permeabilization. Biochim. Biophys. Acta, Biomembr. 2011, 1808, 2965–2972. 10.1016/j.bbamem.2011.08.002. [DOI] [PubMed] [Google Scholar]
- Socrier L.; Rosselin M.; Choteau F.; Durand G.; Morandat S. Cholesterol-nitrone conjugates as protective agents against lipid oxidation: A model membrane study. Biochim. Biophys. Acta, Biomembr. 2017, 1859, 2495–2504. 10.1016/j.bbamem.2017.09.026. [DOI] [PubMed] [Google Scholar]
- Yoda T.; Ogura A.; Saito T. Influence of Ethyl Caproate on the Size of Lipid Vesicles and Yeast Cells. Biomimetics 2020, 5, 16. 10.3390/biomimetics5020016. [DOI] [PMC free article] [PubMed] [Google Scholar]
- Yoda T.; Saito T. Size of Cells and Physicochemical Properties of Membranes are Related to Flavor Production during Sake Brewing in the Yeast Saccharomyces cerevisiae. Membranes 2020, 10, 440. 10.3390/membranes10120440. [DOI] [PMC free article] [PubMed] [Google Scholar]
- Morita M.; Vestergaard M. d.; Hamada T.; Takagi M. Real-time observation of model-membrane dynamics induced by Alzheimer’s amyloid beta. Biophys. Chem. 2010, 147, 81–86. 10.1016/j.bpc.2009.12.004. [DOI] [PubMed] [Google Scholar]
- Singer S. J.; Nicolson G. L. The Fluid Mosaic Model of the Structure of Cell Membranes. Science 1972, 175, 720–731. 10.1126/science.175.4023.720. [DOI] [PubMed] [Google Scholar]
- Chadani T.; Ohnuki S.; Isogai A.; Goshima T.; Kashima M.; Ghanegolmohammadi F.; Nishi T.; Hirata D.; Watanabe D.; Kitamoto K.; Akao T.; Ohya Y. Genome Editing to Generate Sake Yeast Strains with Eight Mutations That Confer Excellent Brewing Characteristics. Cells 2021, 10, 1299. 10.3390/cells10061299. [DOI] [PMC free article] [PubMed] [Google Scholar]
- Miao L.; Seifert U.; Wortis M.; Döbereiner H.-G. Budding transitions of fluid-bilayer vesicles: The effect of area-difference elasticity. Phys. Rev. E: Stat. Phys., Plasmas, Fluids, Relat. Interdiscip. Top. 1994, 49, 5389. 10.1103/physreve.49.5389. [DOI] [PubMed] [Google Scholar]
- Hotani H. Transformation pathways of liposomes. J. Mol. Biol. 1984, 178, 113–120. 10.1016/0022-2836(84)90234-1. [DOI] [PubMed] [Google Scholar]
- Hamada T.; Sato Y. T.; Yoshikawa K.; Nagasaki T. Reversible Photoswitching in a Cell-Sized Vesicle. Langmuir 2005, 21, 7626–7628. 10.1021/la050885y. [DOI] [PubMed] [Google Scholar]
- Ishii K.-i.; Hamada T.; Hatakeyama M.; Sugimoto R.; Nagasaki T.; Takagi M. Reversible Control of Exo- and Endo-Budding Transitions in a Photosensitive Lipid Membrane. ChemBioChem 2009, 10, 251–256. 10.1002/cbic.200800482. [DOI] [PubMed] [Google Scholar]
- Käs J.; Sackmann E. Shape transitions and shape stability of giant phospholipid vesicles in pure water induced by area-to-volume changes. Biophys. J. 1991, 60, 825–844. 10.1016/s0006-3495(91)82117-8. [DOI] [PMC free article] [PubMed] [Google Scholar]
- Hamada T.; Hirabayashi Y.; Ohta T.; Takagi M. Rhythmic pore dynamics in a shrinking lipid vesicle. Phys. Rev. E: Stat., Nonlinear, Soft Matter Phys. 2009, 80, 051921. 10.1103/PhysRevE.80.051921. [DOI] [PubMed] [Google Scholar]
- Tamba Y.; Ohba S.; Kubota M.; Yoshioka H.; Yoshioka H.; Yamazaki M. Single GUV Method Reveals Interaction of Tea Catechin (−)-Epigallocatechin Gallate with Lipid Membranes. Biophys. J. 2007, 92, 3178–3194. 10.1529/biophysj.106.097105. [DOI] [PMC free article] [PubMed] [Google Scholar]
- Webb C.; Khadke S.; Tandrup Schmidt S.; Roces C. B.; Forbes N.; Berrie G.; Perrie Y. The Impact of Solvent Selection: Strategies to Guide the Manufacturing of Liposomes Using Microfluidics. Pharmaceutics 2019, 11, 653. 10.3390/pharmaceutics11120653. [DOI] [PMC free article] [PubMed] [Google Scholar]
- Dyrda G.; Boniewska-Bernacka E.; Man D.; Barchiewicz K.; Słota R. The effect of organic solvents on selected microorganisms and model liposome membrane. Mol. Biol. Rep. 2019, 46, 3225–3232. 10.1007/s11033-019-04782-y. [DOI] [PubMed] [Google Scholar]
- Takagi M.; Hamada T.; Hagiwara H.. Technical irritation evaluation method. JP 2011-110294, 2012, Japan Patent Kokai, 2012-242155A.
- Yoda T.; Miyaki H.; Saito T. Freeze concentrated apple juice maintains its flavor. Sci. Rep. 2021, 11, 12679. 10.1038/s41598-021-92274-0. [DOI] [PMC free article] [PubMed] [Google Scholar]
- Nishikawa M.; Murata T.; Ishihara S.; Shiba K.; Shrestha L. K.; Yoshikawa G.; Minami K.; Ariga K. Discrimination of Methanol from Ethanol in Gasoline Using a Membrane-type Surface Stress Sensor Coated with Copper(I) Complex. Bull. Chem. Soc. Jpn. 2021, 94, 648–654. 10.1246/bcsj.20200347. [DOI] [Google Scholar]
- Osica I.; Melo A. F. A. A.; Lima F. C. D. A.; Shiba K.; Imamura G.; Crespilho F. N.; Betlej J.; Kurzydowski K. J.; Yoshikawa G.; Ariga K. Nanomechanical Recognition and Discrimination of Volatile Molecules by Au Nanocages Deposited on Membrane-Type Surface Stress Sensors. ACS Appl. Nano Mater. 2020, 3, 4061–4068. 10.1021/acsanm.0c00115. [DOI] [Google Scholar]
- Shiba K.; Yoshikawa G. Aero-Thermo-Dynamic Mass Analysis. Sci. Rep. 2016, 6, 28849. 10.1038/srep28849. [DOI] [PMC free article] [PubMed] [Google Scholar]
- Yamada A.; Yamanaka T.; Hamada T.; Hase M.; Yoshikawa K.; Baigl D. Spontaneous Transfer of Phospholipid-Coated Oil-in-Oil and Water-in-Oil Micro-Droplets through an Oil/Water Interface. Langmuir 2006, 22, 9824–9828. 10.1021/la062221+. [DOI] [PubMed] [Google Scholar]
- Hamada T.; Miura Y.; Komatsu Y.; Kishimoto Y.; Vestergaard M. d.; Takagi M. Construction of asymmetric cell-sized lipid vesicles from lipid-coated water-in-oil micro-droplets. J. Phys. Chem. B 2008, 112, 14678–14681. 10.1021/jp807784j. [DOI] [PubMed] [Google Scholar]
- Morita M.; Onoe H.; Yanagisawa M.; Ito H.; Ichikawa M.; Fujiwara K.; Saito H.; Takinoue M. Droplet-Shooting and Size-Filtration (DSSF) Method for Synthesis of Cell-Sized Liposomes with Controlled Lipid Compositions. ChemBioChem 2015, 16, 2029–2035. 10.1002/cbic.201500354. [DOI] [PubMed] [Google Scholar]
- Morita M.; Noda N. Membrane Shape Dynamics-Based Analysis of the Physical Properties of Giant Unilamellar Vesicles Prepared by Inverted Emulsion and Hydration Techniques. Langmuir 2021, 37, 2268–2275. 10.1021/acs.langmuir.0c02698. [DOI] [PubMed] [Google Scholar]


