Abstract
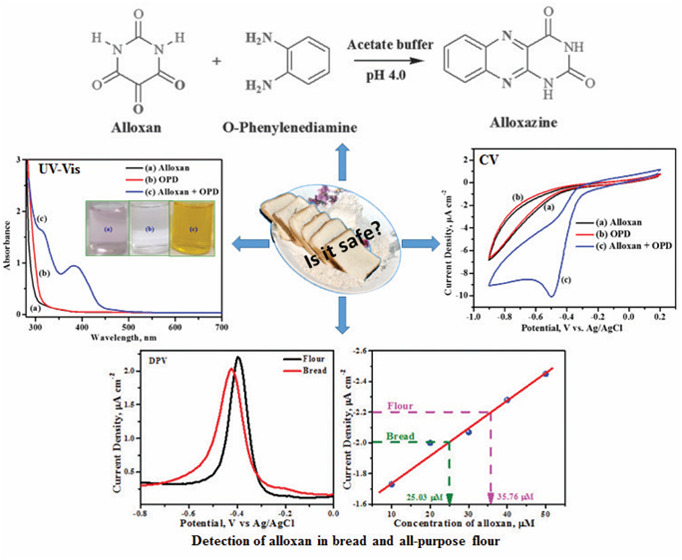
Alloxan is a chemical generally administered to rats to induce diabetes mellitus, and pharmaceutical industries test the efficacy of their diabetic products on these rats. Alloxan is in a redox cycle with dialuric acid; hence, direct estimation of alloxan may not represent the actual concentration of the same in a given matrix. Also, in recent times, alloxan is added to food materials, especially to the all-purpose flour (maida) to bring softness and white color to the flour. Hence, consumption of food items made from such flour could induce diabetic mellitus in individuals, making it imperative to develop an accurate estimation of alloxan in food items. Herein, a voltammetric-based technique is developed to quantify the alloxan in refined wheat flour (maida) using an unmodified glassy carbon electrode (GCE). The electrochemical method offers rapid sensing while the use of an unmodified GCE surface offers repeatability and reproducibility between measurements. First, alloxan is converted to its stable adduct alloxazine by the reaction with o-phenylenediamine. The alloxazine adduct is electrochemically active, and the concentration of alloxan is estimated as a function of alloxazine formed using the voltammetric technique. The common shortfall in alloxan detection mainly involves its short half-life (∼a minute) whereas the alloxazine adduct formed is stable over a period of time. Using the current approach, alloxan concentration ranging from 10 to 600 μM is detected with a sensitivity of 0.0116 μA/μM. A low limit of detection of 1.95 μM with a precision of 1.2% is achieved using the above method. Real sample analysis revealed the presence of alloxan in all-purpose flour (maida—refined wheat flour) and bread purchased from the local market to the values of 35.76 and 25.03 μM, respectively. The same is confirmed using the gold-standard colorimetric technique.
1. Introduction
Alloxan (2,4,5,6-tetraoxypyrimidine) is a chemical used in laboratories to induce experimental diabetes mellitus in animals.1 The reduced product of alloxan is dialuric acid, and both alloxan and dialuric acid exhibit a redox cycle.2 The autooxidation of dialuric acid to alloxan proceeds with the generation of reactive oxygen species, which induce oxidative stress in β-cells causing necrosis of cell tissues.2b,3 Alloxan causes diabetes mellitus as it suppresses insulin secretion by inhibition of the enzyme glucokinase.4 Unfortunately, alloxan is added to wheat and refined wheat (maida) flour as a softener and also to make the flour appear bright white in nature.5 The refined wheat flour (maida) is used as all-purpose flour for making many food items in the bakery including bread.6 Consumption of such food items in a long run may essentially lead to diabetic and other health issues.7 Hence, the development of methodologies capable of detecting alloxan in food materials swiftly and accurately may help health officials and consumers to find adulterated food. The aqueous solution of alloxan is not stable at physiological pH, and the half-life of alloxan in neutral and alkaline solution is estimated to be ∼1 min by Richardson and Cannan.8 Thus, the direct estimation of alloxan using various techniques is prone to give erroneous results. On the other hand, many of the known chromatographic techniques deal with direct detection and estimation of alloxan. Except for a few research articles, all other spectrophotometric techniques report direct estimation of alloxan. Shpigun et al. reported the determination of alloxan by the flow injection method,9 while Raghavamenon et al. reported the fluorometric reversed-phase high-performance liquid chromatography (HPLC) method to detect alloxan at low levels.10 Electrochemical detection of alloxan was carried out on a modified electrode surface by Paramasivam et al.(11) and Monnappa et al.(12)
Like any other method, the rarely used electrochemical techniques for the quantification of alloxan also deal with the detection of less stable alloxan, resulting in poor accuracy. To overcome this issue, in this work, it is proposed to prepare alloxazine, an adduct, resulting from the reaction of alloxan with o-phenylenediamine (OPD). The amount of alloxazine formed depends on the available alloxan and could be estimated by studying the electrochemical and colorimetric behavior of the resulting adduct, alloxazine. A similar indirect estimation of alloxan was reported by Al Shehri et al. and Giaccone et al., where LC–MS/MS and fluorometric methods were used.13 On the other hand, the electrochemical techniques offer a quick turnaround time and require no big instruments or skilled manpower.14 Electrochemical techniques such as cyclic voltammetry (CV) and differential pulse voltammetry (DPV) are employed for the estimation of alloxazine and subsequently the alloxan. The results are compared with colorimetric data, and real sample analysis was carried out using commercially available maida and bread. The electrochemical methods are developed using glassy carbon electrodes (GCEs) without further modification, making it simple, which could later be extended to screen-printed electrodes in the future.
2. Results and Discussion
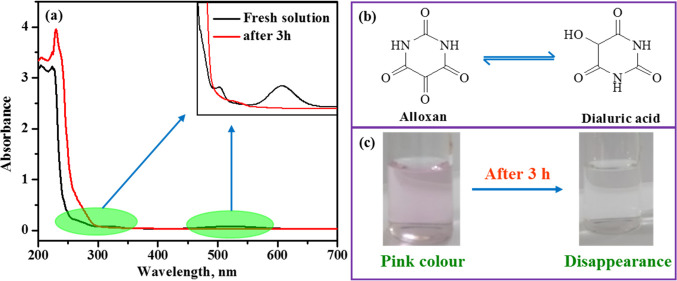
The carcinogenic alloxan, as mentioned earlier, is in a redox cycle with dialuric acid, making it difficult to determine accurately if one concentrates on the concentration of alloxan alone. Figure 1a represents the UV–visible absorption spectrum of freshly prepared 1 mM alloxan (blackline) in acetate buffer with pH 4.0. The spectrum of alloxan shows four distinct absorption bands at 205, 224, 323, and 521 nm. These bands remain stable for approximately 2.5 h and start to disappear, especially the ones at 323 and 521 nm, with the appearance of a new band around 236 nm as is evident from Figure 1b and the inset in Figure 1. Similarly, the aqueous solution of alloxan exhibits pink color and becomes colorless in 2•5–3 h. as evident from Figure 1c. Both the disappearance of pink color and the bands are found to be a function of alloxan concentration; while it takes a long time with high concentration, the fading occurs quickly at very low concentrations. These observations suggest that the alloxan is in a redox cycle with dialuric acid; hence techniques such as chromatography, spectrophotometric, or electrochemical, dealing with detection of alloxan, as such may not yield accurate results, especially at low concentration.
Figure 1.
(a) Absorption spectra of 1 mM alloxan (blackline: freshly prepared in acetate buffer with pH 4.0 and redline: after 3 h), (b) equilibrium between alloxan and dialuric acid, and (c) pictorial representation of discoloration of alloxan after 3 h.
On the other hand, the present work demonstrates an indirect method of estimating alloxan as a function of the amount of the alloxazine adduct formed in an in situ reaction with OPD (the detailed procedure is given in the Experimental Details section) as represented in Scheme 1. The alloxazine adduct is colored, electrochemically active, and is estimated using the voltammetric technique. The voltammetric data are compared with gold-standard UV–vis spectrophotometric methods. First, the alloxazine adduct was synthesized following the literature procedure,15 and after purification, the dry sample was characterized using Fourier transform infrared spectroscopy (FT-IR), NMR, and UV–vis spectroscopy [Supporting Information Figures S1–S4]. For electrochemical experiments, the alloxazine is formed in situ in acetate buffer with pH 4.0, and the thus-formed alloxazine remains in solution till the alloxan concentration reaches approximately 600 μM for 1 mM OPD. The UV–visible and FT-IR spectrum of the thus-formed yellow-colored solution, Supporting Information Figure S3, matches with that of the chemically synthesized alloxazine. All these data confirm that the product formed during the in situ reaction is alloxazine.
Scheme 1. Formation of Alloxazine Adduct Starting from Alloxan and OPD.
2.1. Electrochemical Assay of Alloxan in the Presence of OPD
Compared to alloxan, the adduct alloxazine is electrochemically active. In absence of OPD, alloxan exhibited no obvious response in both anodic and cathodic regions for the potential sweep from −0.2 to 0.85 V, and the corresponding cyclic voltammetric response is represented in Figure 2 (curve a). Thus, direct electrochemical detection of alloxan is quite difficult due to limited electron transfer kinetics; additionally, alloxan degrades slowly to dialuric acid as mentioned earlier. In the present work, alloxan reacts with OPD to form an adduct, alloxazine, and is estimated using the voltammetric technique. The voltammetric detection of alloxan is estimated as a function of the alloxazine adduct formed on an unmodified GCE (working electrode) in 0.1 M acetate buffer (pH 4.0) using cyclic voltammetry with a scan rate of 50 mV s–1. Figure 2 represents the cyclic voltammograms of 0.3 mM alloxan (curve a), 1.0 mM OPD (curve b), and 0.3 mM alloxazine formed in situ (curve c) on the GCE surface. The adduct exhibit cathodic (strong signal) and anodic (weak signal) peaks corresponding to the reduction and oxidation processes at −0.494 V (Ipc = −10.07 μA) and −0.297 V (Ipa = −0.2394 μA) versus Ag/AgCl, respectively. From the figure, it is also clear that both alloxan and OPD have no characteristic redox behavior in GC in the above potential window. The amount of the electroactive alloxazine formed depends on the initial concentration of alloxan while the OPD concentration is maintained constant. The cathodic peak of the adduct being very strong, the concentration of alloxan is estimated as a function of reduction of alloxazine.
Figure 2.
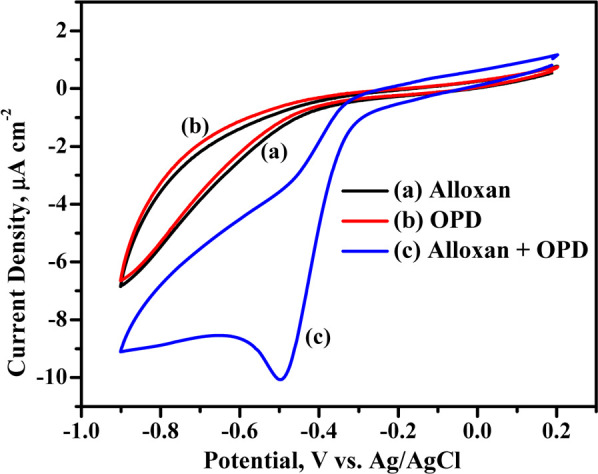
Cyclic voltammograms of 0.3 mM alloxan (curve a), 1 mM OPD (curve b), and alloxan in presence of OPD (curve c) on an unmodified GCE in 0.1 M acetate buffer pH 4.0 at 50 mV s–1.
2.2. Effect of Scan Rates on the Peak Current
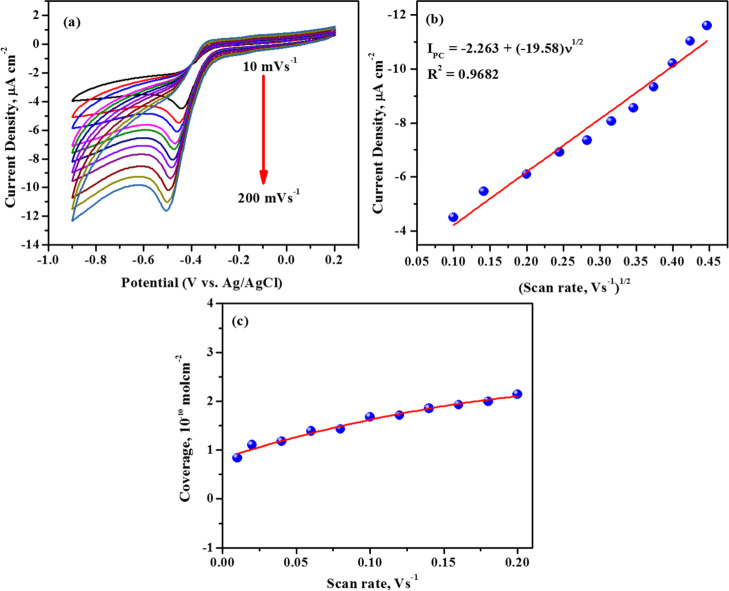
In addition to the UV–vis and FT-IR spectrum, the cyclic voltammograms of alloxazine formed via in situ processes are compared with those of the alloxazine synthesized through the chemical route and are represented in Supporting Information, Figure S5. Keeping all other parameters identical, it is noticed that the cyclic voltammograms of both the samples look similar, indicating that the in situ product is alloxazine only. Having confirmed that the in situ product is alloxazine, the kinetics and mechanistic information of the electrode toward the target analyte were investigated. To comprehend whether the redox behavior of alloxazine is diffusion or an absorption-controlled process, the influence of scan rates on the current density is investigated. Alloxazine is formed in situ as mentioned earlier, and the scan rate is varied from 10 to 200 mV s–1. The resulting voltammograms are depicted in Figure 3a. From the figure, it is evident that the cathodic peak potential shifts toward a more negative side whereas the anodic peak potential is unchanged, indicating that the redox action of alloxazine is quasireversible. A direct correlation of peak current (Ipc) with the scan rate (ν) is illustrated in Supporting Information, Figure S4, which shows an increase in peak current with the increase in the scan rate (Ipc (μA) = −4.54 + (−35.26)ν (V/s); R2 = 0.9922), indicating that the electrode reaction process is adsorption-controlled. Furthermore, the adsorption-controlled process is confirmed by plotting the Ipcversus ν1/2 as depicted in Figure 3b. The plot of Ipcversus ν1/2 is not a straight line, suggesting that the electrode reaction cannot be a diffusing process at the electrode–electrolyte interface. All these observations indicate that the electron transfer process may be occurring via surface-adsorbed species across the electrode interface. The surface coverage was determined by integrating the area under the reduction peak by using the relation16
| 1 |
where Q is the charge obtained by integrating the area under the reduction peak, n is the number of the electrode, F is the Faraday constant, and A is the area of the electrode. The amount of alloxazine compound adsorbed on the electrode surface is found to be 1.41 × 10⁻¹⁰ mol cm–2. Furthermore, the surface coverage at various scan rates is shown in Figure 3c, and it clearly shows that the surface coverage depends on the surface-bound species and is not influenced by the scan rate.17 Hence, it is evident that the electrode phenomenon is dominated by surface-controlled processes, which supports our earlier observation.
Figure 3.
(a) Cyclic voltammograms of 0.3 mM alloxan in the presence of 1 mM OPD on an unmodified GCE in 0.1 M acetate buffer pH 4.0 at scan rates from 10 to 200 mV s–1, (b) peak current as a function of the scan rate, and (c) surface coverage of alloxan as a function of the scan rate.
2.3. Voltammetric Sensing of Alloxan
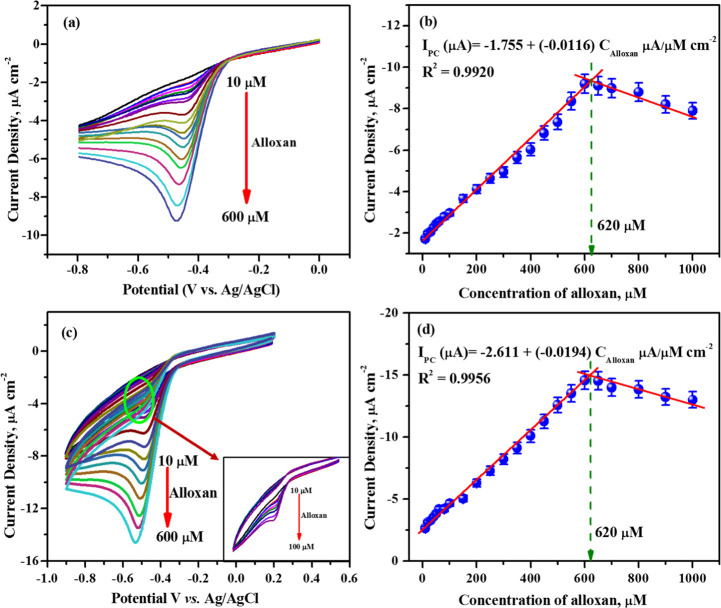
For an analytical quantification of alloxan, differential pulse voltammograms and cyclic voltammograms were recorded by varying the concentrations of alloxan in the presence of 1 mM OPD in 0.1 M acetate buffer. The resulting voltammograms are depicted in Figure 4a,c. Alloxan concentration of 0 to 600 μM is added to 1 mM OPD in a stepwise manner, resulting in an increase in the cathodic peak current due to the formation of an increased number of redox-active species (formation of alloxazine). On further increasing the concentration of alloxan (up to 1000 μM), the peak current remains relatively stable as the alloxazine formed in the in situ reaction starts precipitating out in the electrolyte solution. From differential pulse voltammograms, the plot of current density versus alloxan concentration was found to intercept at an alloxan concentration of 620 μM, suggesting that the in situ reaction leads to the formation of the saturated adduct alloxazine at this concentration and is represented in Figure 4b. The cyclic voltammograms for the above concentration of alloxan also showed similar results; the current density increases with an increase in the formation of the electroactive adduct alloxazine and starts to decrease once the alloxazine precipitates out in the electrolytic solution as represented in Figure 4d.
Figure 4.
(a) Differential pulse voltammograms and (c) Cyclic voltammograms (were recorded at 50 mV s–1) of 0.1 M acetate buffer (pH 4.0) containing 1 mM OPD and various alloxan concentrations (10, 20, 30, 40, 50, 60, 80, 100, 150, 200, 250, 300, 350, 400, 450, 500, 550, and 600 μM) on an unmodified GCE. (b,d) Plot of the peak currents obtained as a function of alloxan concentrations.
The plot of current density versus alloxan concentration from CV was also found to intercept at 620 μM, Figure 4d. Hence, alloxan concentration from 0 to 600 μM is considered for calibration, and the respective linear regression equation from DPV and CV is provided below.
The slope value corresponds to the sensitivity and is found to be 0.0116 μA/μM from DPV while the value 0.0194 μA/μM is obtained from CV. The limit of detection (LOD) was calculated using the following relation, LOD = 3S/m (where S is standard deviation and m is sensitivity) and is found to be 1.95 μM from DPV while 1.86 μM is obtained from CV. The results were compared with the previously reported literature and are presented in Table 1. The current strategy provides synergistically beneficial features in terms of improved sensitivity, linear range, and LOD for the determination of alloxan. The stability and repeatability tests were conducted by CV; 0.3 mM alloxan in the presence of 1 mM OPD was evaluated. After a triplicated collection of cyclic voltammograms, it was found that the peak current was reproducible with a standard deviation of 1.2%.
Table 1. Comparison of Results of the Proposed Method with the Previously Reported Literature on the Determination of Alloxan by Various Methods.
| methods | linear range | LOD | references |
|---|---|---|---|
| UHPLC–MS/MS | 0.88 to 1.02 mg/kg | 0.95 mg/kg | (13b) |
| flow injection method | 0.1 to 1 mM | 36 μM | (18) |
| spectrofluorometry | 0.1 to 9.0 μg/mL | 27 ng/mL | (13a) |
| fluorometric RP-HPLC | 5 nM to 2 mM | 0.1 pmol | (10) |
| derivative voltammetry | 0.3 μM to 3 mM | 50 nM | (20) |
| DPV | 30 μM to 3 mM | 1.2 μM | (11) |
| DPV (CTAB MCPE) | 5 to 80 μM | 1.09 μM | (12) |
| CV (CTAB MCPE) | 8 to 9 μM | 3.64 μM | (12) |
| amperometry (rGO/GCE) | 50 to 750 μM | -- | (11) |
| CV (bare GCE) | 10 to 600 μM | 1.86 μM | present work |
| DPV (bare GCE) | 10 to 600 μM | 1.95 μM | present work |
| UV–visible | 10 to 600 μM | 2.47 μM | present work |
2.4. Colorimetric Assay of Alloxan in the Presence of OPD
Alloxan is a toxic glucose analogue and selectively destroys insulin-producing cells (β-cell) in the pancreas. The gold-standard method for the detection of alloxan includes the colorimetric technique using various coloring agents,21a and in this case, the adduct alloxazine itself is colored and requires no coloring agents for the estimation. The colorimetric detection of alloxan was carried out in the presence and absence of OPD using UV–visible absorption spectroscopy. Figure 5 represents the absorption spectra of 0.3 mM alloxan (curve a), 1.0 mM OPD (curve b), and 0.3 mM alloxazine (curve c) in 0.1 M acetate buffer pH 4.0. The absorption spectrum of alloxan (curve a) shows a very weak absorption peak at 326 and 520 nm whereas the OPD spectrum (curve b) shows no characteristic absorption peak ranging from 250 to 700 nm. The freshly prepared solution of alloxan is pink in color which slowly turns to a colorless solution, indicating the formation of dialuric acid and hence no absorption in the UV–vis range. On the other hand, quinoxaline-based compounds react with OPD to form alpha-diketo compounds which are colored in nature.13a,21 Alloxan contains three adjacent carbonyl functional groups, and two of them react with OPD containing an alpha diamino group; as a result, the light-pale pink color mixture turns yellow and yellow changes to orange-red solution, indicating the formation of the alloxazine adduct. This alloxazine adduct has shown two characteristic maximum absorption peaks at 315 and 382 nm (curve c), which are consistent with the previously reported literature22 and correspond to n → π* and π → π*, respectively. Hence, this is an effective, sensitive, and selective approach for the determination of alloxan in presence of OPD.
Figure 5.
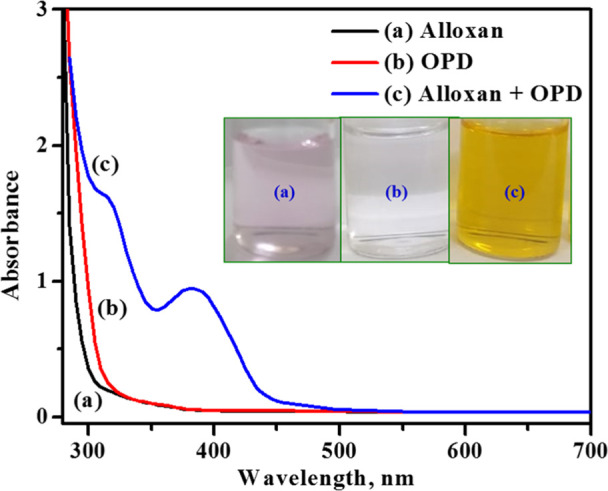
UV–vis spectra of 0.3 mM alloxan (curve a), 1 mM OPD (curve b), and 0.3 mM alloxan + 1 mM OPD in 0.1 M acetate buffer pH 4.0 (curve c).
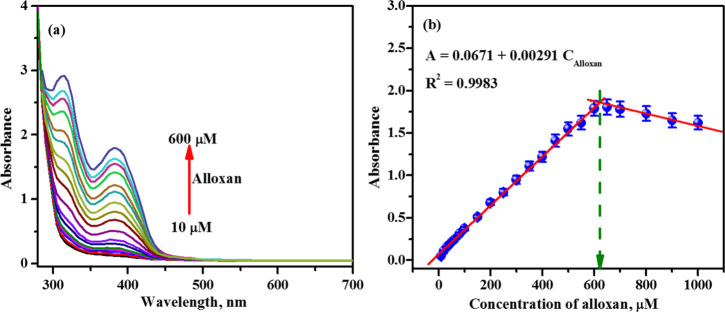
Under the optimal conditions, colorimetric assay was carried out using different concentrations of alloxan in the presence of OPD in 0.1 M acetate buffer pH 4.0. As seen in Figure 6a, upon the increased addition of alloxan (10 to 600 μM) to 1 mM OPD, the absorption intensities at 315 and 382 nm increased gradually, which signifies the formation of the alloxazine adduct. Thereafter, the absorption intensities continuously declined due to the formation of alloxazine precipitate as the concentration of alloxan increased from 600 to 1000 μM. The intercept of the two extrapolated best-fit lines of the absorption intensity (at 382 nm) versus the alloxan concentration (Figure 6b) is found to be 620 μM as before.
Figure 6.
(a) UV–visible absorption spectra of 0.1 M acetate buffer pH 4.0 containing 1 mM OPD and various alloxan concentrations (10, 20, 30, 40, 50, 60, 80, 100, 150, 200, 250, 300, 350, 400, 450, 500, 550, and 600 μM) and (b) plot of the peak currents obtained as a function of alloxan concentration.
A calibration plot was constructed with absorption intensity at 382 nm versus concentration of alloxazine and a straight line was obtained (Figure 6b). The linear regression equation for the plot is found to be A = 0.00291Calloxan + 0.0671, with R2 = 0.9983, while the LOD was calculated to be 2.47 μM. In comparison to other reported methods, this method offers better features in terms of linear range, LOD, and accuracy in the determination of alloxan (Table 1).
2.5. Determination of Alloxan in Food Samples
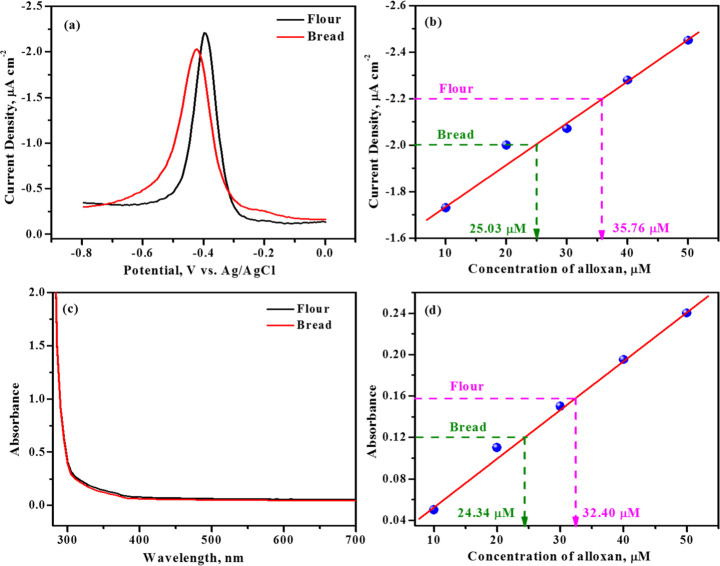
To examine the alloxan content in food samples, white bread and refined flour were purchased and used as received. One gram of the samples was suspended into a known volume of 0.1 M acetate buffer solution pH 4.0 with frequent stirring about 45 min. Then, the mixture was centrifuged, and the supernatant solutions were separated. Subsequently, 1 mM OPD (1 mL) was added to the supernatant solutions (9 mL), and the mixture was allowed to react for 30 min. During this period, it was noticed that the light-pale pink color mixture turned yellow and yellow changed to orange-red solution, indicating the formation of the alloxazine adduct. The amount of alloxan present in food samples was estimated using DPV plots and UV–visible spectra, and the results are shown in Figure 7a–d. The alloxan content in the bread sample was estimated to be 25.03 μM using DPV and 24.34 μM using UV–visible techniques. Similarly, the alloxan content in the refined flour was found to be 35.76 μM using DPV and 32.40 μM using UV–visible spectrophotometry. The percentage recovery for the procured real samples was found to be 96–99%. Experimental results are summarized in Table 2. Thus, the established method could be extended to real (food) sample analysis and is found to be an effective and the most reliable technique for the selective determination of alloxan in food products. Because the developed techniques involve indirect estimation of alloxan, one may not have to worry about the alloxan–dialuric acid equilibrium. The indirect method offers a comparatively better linear range with a quick turnaround time.
Figure 7.
(a,c) Differential pulse voltammograms and UV–visible absorption spectra of alloxan present in refined flour and bread samples under identical conditions. (b,d) corresponding calibration plots.
Table 2. Percentage Recovery of Alloxan Found in Real Samples.
| method | sample act | added (μM) | found (μM) | % recovery |
|---|---|---|---|---|
| DPV | refined flour | 10 | 9.92 | 99.20 |
| 20 | 19.88 | 99.40 | ||
| 30 | 29.91 | 99.70 | ||
| bread | 10 | 9.83 | 98.30 | |
| 20 | 19.77 | 98.85 | ||
| 30 | 29.78 | 99.26 | ||
| UV–visible | refined flour | 10 | 9.89 | 98.90 |
| 20 | 19.67 | 98.35 | ||
| 30 | 29.52 | 98.40 | ||
| bread | 10 | 9.64 | 96.40 | |
| 20 | 19.37 | 96.80 | ||
| 30 | 29.40 | 98.00 |
2.6. Interference Study
In the processed wheat and refined wheat flour, the alloxan gets introduced in two instances: one during the bleaching process and the second instance is when it is added externally to give a soft texture to the flour. Our study indicates that both the refined wheat flour and the bread purchased from local vendors have the presence of alloxan. To ensure that the developed method is insensitive and not affected by the other chemical contents of wheat, the raw wheat grains were ground to a fine powdered form, and similar experiments were carried out on such powders with and without spiking with alloxan.
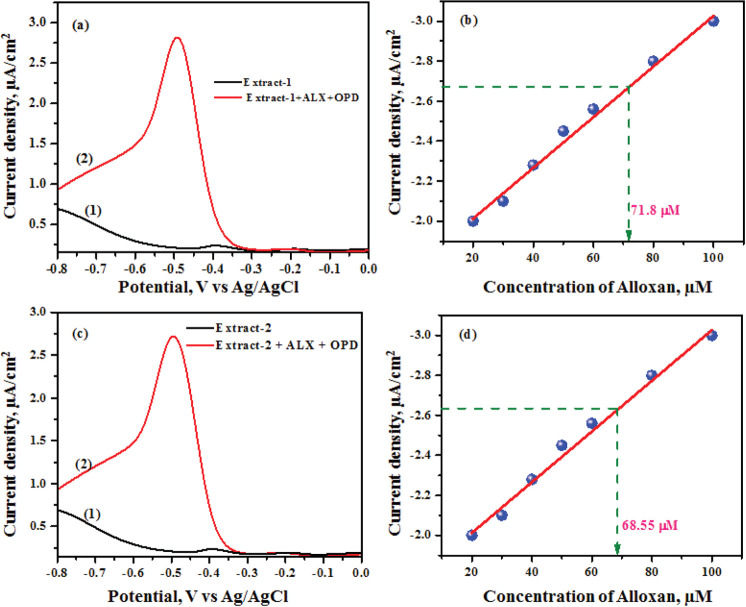
The raw wheat grains were purchased from two different shops in the local market and ground separately into fine powder. The 0.1 M acetate buffer (pH 4.0) extract of the powdered wheat from two different shops was named extract-1 and extract-2. The powdered wheat was also spiked with alloxan and was extracted with 0.1 M acetate buffer as before. Details of the extraction procedure are given in the Experimental Details section. Briefly, either the pure powder or pure powder with a known amount of alloxan is extracted with acetate buffer pH 4.0 and stirred for 1 h. Then, the resulting sample is centrifuged at 10,000 rpm for 10 min. The DPV plots, Figure 8, were recorded using the as-prepared wheat extract to show that the presence of other chemical contents of the wheat does not interfere in the detection of alloxan by the developed technique. The pure wheat extract showed two peaks at −0.2 and −0.4 V, which might be due to the presence of some electroactive species of the wheat, Figure 8a(1),c(1). The extract with a known quantity of alloxan (control sample) exhibits a reduction peak at −0.5 V with a high current corresponding to the formation of alloxazine adduct as shown in Figure 8a(2),c(2). The peak potential and peak current of the alloxazine adduct are not altered in the presence of various chemicals (interfering molecules) of the wheat extract such as fibers, proteins, starch, and so forth. This observation indicates that the chemical components of the wheat do not interfere with the detection of alloxan. Furthermore, the concentration of alloxan was found to be 71.80 and 68.55 μM in extract-1 and extract-2, respectively. The obtained results are more appreciable as compared to the spiked concentration of 70.0 μM.
Figure 8.
(a,c) Differential pulse voltammograms of powdered wheat grains extracts (1) and wheat extracts with alloxan and OPD (2). (b,d) Estimation of the alloxan using the calibration plot.
3. Conclusions
Overall, electrochemical techniques such as DPV and CV were developed for accurate estimation of alloxan using a simple three-electrode system. The demonstrated techniques require no electrode surface modification, offering more accuracy between measurements. In addition, the error in determining alloxan concentration due to the alloxan–dialuric acid equilibrium is avoided. The concentration of alloxan was monitored as a function of the amount of alloxazine adduct formed. The electrochemical data were compared with the data from UV–vis spectrophotometric technique, and it is noticed that the results from both methods complement each other. Both the electrochemical and colorimetric techniques are applicable for alloxan concentrations ranging from 10 to 600 μM. The sensitivity of the DPV method was found to be 0.0116 μA/μM while that of CV was found to be 0.0194 μA/μM. The proposed techniques were extended to find the presence of alloxan in food samples, viz., refined wheat flour (maida) and bread. Using the method, alloxan content corresponding to 35.76 μM is determined in maida and is estimated to be 25.03 μM in bread samples. The proposed methodologies could be extended to other food samples, and in the future, handheld devices could be developed to identify and estimate the presence of alloxan in food products.
4. Experimental Details
4.1. Materials and Reagents
For the electrochemical and UV–visible studies, alloxan [C4H2N2O4, Sigma-Aldrich, 98%], OPD [C6H8N2, Sigma-Aldrich, 99.5%], acetic acid [CH3CO2H, Sigma-Aldrich, 99%], sodium acetate [CH3COONa, Merck, 99%], and so forth were of analytical grade and used without any further purification. For real sample analysis, refined wheat flour (maida) and white bread samples were purchased from the local market. Acetate buffer and other aqueous solutions were prepared by using the ultrapure water from the Siemens Labostar water purification system (resistivity ∼18.2 mS cm–1).
Acetate buffer (pH 4.0 and 0.1 M) was prepared using acetic acid and sodium acetate solution.10 mM alloxan and 10 mM OPD stock solutions were prepared using the aforementioned acetate buffer, and both the solutions were stored in dark bottles to avoid exposure to external light. A series of various concentrations of alloxan (10–600 μM) from 10 mM stock solution was prepared using 0.1 M acetate buffer containing a constant concentration of 1 mM OPD (from 10 mM, 1 mL). For electrochemical studies, the total volume of the solution was maintained to be at 10 mL.
4.2. Spectroscopic and Electrochemical Measurements
UV–visible absorption spectra of alloxan were monitored from the amount of alloxazine formed in situ with OPD using a Synergy H1 Hybrid multi-mode microplate reader. The functional groups present in the as-prepared alloxazine were monitored using a Bruker Optick GmbH system equipped with FT-IR. The identification of the number of protons and carbons was performed using a Bruker Biospin (400 MHz) 1H and 13C nuclear magnetic resonance (NMR) spectrometer.
All the electrochemical experiments were carried out at room temperature using an Autolab PGSTAT-302N instrument from Metrohm using a three-electrode system. The three-electrode system consisting of a GCE (3 mm diameter) as a working electrode, platinum wire as a counter electrode, and a silver–silver chloride electrode (Ag/AgCl) as a reference electrode was used for the investigations. All the solutions were degassed using high-purity nitrogen gas for 5–10 min before the start of the electrochemical measurements.
Before the experiment, the GCE was polished using 0.3 and 0.05 μm alumina slurry on a polishing pad to a mirror finish. The polished GCE was ultrasonically cleaned in ethanol followed by ultrapure water for 2 min and finally dried with high-purity nitrogen gas.
4.3. Colorimetric and Electrochemical Procedure for the Determination of Alloxan
Alloxan was detected as a function of the amount of alloxazine formed in the presence of OPD. In a typical process, an appropriate concentration of alloxan (10 mM, 10–600 μL) was added to OPD (10 mM, 1 mL) containing 0.1 M acetate buffer with pH 4.0 while the total volume of the reaction mixture was replenished to 10 mL. The solution was thoroughly mixed and stirred at room temperature for 10 min. During this time, the light-pale pink color mixture turned yellow and finally changed to orange-red solution, which indicates the formation of the alloxazine adduct (Scheme 1). The properties of the final adduct were examined using electrochemical and UV–visible spectrophotometric studies.
4.4. Food Sample Preparation
For food analysis, refined wheat flour (maida) and white bread samples were purchased from the local market. A known quantity of the sample (1 g) was transferred to a round-bottom flask containing 18 mL of acetate buffer pH 4.0 with frequent stirring for 45 min at room temperature. The mixture was centrifuged at 10,000 rpm for 15 min, and supernatant solutions were collected. Then, 1 mM OPD (1 mL) was added to the supernatant solutions (9 mL) and kept for 30 min to form an alloxazine adduct (observing that initially, the light-pale pink color turned yellow and finally changed to orange-red solution). The orange-red-colored solution was used for the estimation of alloxan in the real sample.
4.5. Powdered Wheat Grain Extracts for the Interference Study
1 g of raw wheat powder was transferred to a beaker containing 20 mL of acetate buffer pH 4.0. The mixture was stirred for 1 h at room temperature and centrifuged at 10,000 rpm for 10 min, and the supernatant solutions were collected. The powdered wheat grain extracts from two different samples were named extract-1 and extract-2. In the controlled experiment, 5 mg of alloxan was added to 1 g of finely powdered wheat, and buffer extract was prepared as before. Then, 1 mM OPD was added into 9 mL of the above supernatant buffer solutions, and the resulting mixture was kept at room temperature for 30 min. During this time the alloxan reacted with OPD to form the alloxazine adduct, as observed from the formation of an orange-red solution, and the resulting solution is subjected to the estimation of alloxan using DPV.
Acknowledgments
M.M. acknowledges the funding support provided by the Council of Scientific and Industrial Research [CSIR-RA fellowship, F. no: 31/020(0197)/2020-EMR-I], New Delhi. CSIR-CECRI Manuscript Communication Number CECRI/PESVC/Pubs./2021-143.
Supporting Information Available
The Supporting Information is available free of charge at https://pubs.acs.org/doi/10.1021/acsomega.1c06313.
Schematic of alloxazine synthesis; 1H NMR, 13C NMR, and FT-IR spectra of alloxazine; FT-IR and UV–vis spectra of alloxan, OPD, and in situ-formed alloxazine; CV plots of pure and in situ-formed alloxazine; plot of peak current versus scan rate; pH optimization; alloxazine adduct stability; and effects of reduction current of alloxazine in different acetate buffers (O2, N2, and dissolved O2 conditions) (PDF)
Author Present Address
∥ Vellore Institute of Technology, Vellore, India
The authors declare no competing financial interest.
Supplementary Material
References
- Bilić N. The mechanism of alloxan toxicity: an indication for alloxan complexes in tissues and alloxan inhibition of 4-acetamido-4’-isothiocyanato-stilbene-2,2′-disulphonic acid (SITS) binding for the liver cell membrane. Diabetologia 1975, 11, 39–43. 10.1007/BF00422816. [DOI] [PubMed] [Google Scholar]
- a Rosso J. A.; Astorga M. A.; Mártire D. O.; Gonzalez M. C. Alloxan-dialuric acid cycling: A complex redox mechanism. Free Radical Res. 2009, 43, 93–99. 10.1080/10715760802616650. [DOI] [PubMed] [Google Scholar]; b Brömme H. J.; Weinandy R.; Peschke E. Influence of oxygen concentration on redox cycling of alloxan and dialuric acid. Horm. Metab. Res. 2005, 37, 729–733. 10.1055/s-2005-921093. [DOI] [PubMed] [Google Scholar]; c Brömme H. J.; Weinandy R.; Peschke D.; Peschke E. Simultaneous quantitative determination of alloxan, GSH and GSSG by HPLC. Estimation of the frequency of redox cycling between alloxan and dialuric acid. Horm. Metab. Res. 2001, 33, 106–109. 10.1055/s-2001-12402. [DOI] [PubMed] [Google Scholar]
- a Winterbourn C. C.; Cowden W. B.; Sutton H. C. Auto-oxidation of dialuric acid, divicine and isouramil. Superoxide dependent and independent mechanisms. Biochem. Pharmacol. 1989, 38, 611–618. 10.1016/0006-2952(89)90206-2. [DOI] [PubMed] [Google Scholar]; b Rašeta M.; Mira P.; Ivan C.; Nebojsa S.; Sasa V.; Biljana M.; Maja K. Antidiabetic effect of two different Ganoderma species tested in alloxan diabetic rats. RSC Adv. 2020, 10, 10382–10393. 10.1039/c9ra10158f. [DOI] [PMC free article] [PubMed] [Google Scholar]; c Kim E.-A.; Seung H. L.; Ji H. L.; Nalae K.; Jae Y. O.; Seun H.; Ginnae A.; Seok C. K.; Shanura P. F.; Seo Y. K.; Sun J. P.; Young T. K.; You J. J. A marine algal polyphenol, dieckol, attenuates blood glucose levels by Akt pathway in alloxan induced hyperglycemia zebrafish model. RSC Adv. 2016, 6, 78570–78575. 10.1039/c6ra12724j. [DOI] [Google Scholar]
- a Szkudelski T. The mechanism of alloxan and streptozotocin action in B cells of the rat pancreas. Physiol. Res. 2001, 50, 537–546. [PubMed] [Google Scholar]; b Gray C. T.; Brooke M. S.; Gerhart J. C. Inhibition of Urease by Alloxan and Alloxanic Acid. Nature 1959, 184, 1936–1937. 10.1038/1841936a0. [DOI] [PubMed] [Google Scholar]
- Joye I. J.; Lagrain B.; Delcour J. A. Use of chemical redox agents and exogenous enzymes to modify the protein network during breadmaking—A review. J. Cereal Sci. 2009, 50, 11–21. 10.1016/j.jcs.2009.04.001. [DOI] [Google Scholar]
- a Shakila M.; Sasikala P. Alloxan in refined flour: A diabetic concern. Int. J. Adv. Innov. Res. 2012, 1, 204–209. [Google Scholar]; b Powrie W. D.Food dispersions. Principles of Food Science, Part I, Food Chemistry; Marcel Dekker, 1976; p 539. [Google Scholar]; c Fennema O. R.Food Additives; Springer, 1985. [Google Scholar]
- a Vieira R.; Souto E. B.; Sánchez-López E.; Machado A.; Severino P.; Jose S.; Santini A.; Silva A.; Fortuna A.; García M.; Souto E. B. Sugar-Lowering Drugs for Type 2 Diabetes Mellitus and Metabolic Syndrome-Strategies for In Vivo Administration: Part-II. J. Clin. Sleep Med. 2019, 8, 1332. 10.3390/jcm8091332. [DOI] [PMC free article] [PubMed] [Google Scholar]; b Federiuk I. F.; Casey H. M.; Quinn M. J.; Wood M. D.; Ward W. K. Induction of type-1 diabetes mellitus in laboratory rats by use of alloxan: route of administration, pitfalls, and insulin treatment. Comp. Med. 2004, 54, 252–257. [PubMed] [Google Scholar]; c Sathish Kumar P.; Kannan N. D. A system-level approach to investigate alloxan-induced toxicity in microtubule-binding protein to lead type 2 diabetes mellitus. Mol. Divers. 2021, 25, 911–924. 10.1007/s11030-020-10075-5. [DOI] [PubMed] [Google Scholar]
- Richardson G. M.; Cannan R. K. The dialuric acid-alloxan equilibrium. Biochem. J. 1929, 23, 68–77. 10.1042/bj0230068. [DOI] [PMC free article] [PubMed] [Google Scholar]
- Shpigun L.; Margolin S.; Suranova M. Flow Injection Determination of Alloxan. J. Flow Inject. Anal. 2008, 25, 53–56. [Google Scholar]
- Raghavamenon A. C.; Dupard-Julien C. L.; Kandlakunta B.; Uppu R. M. Determination of alloxan by fluorometric high-performance liquid chromatography. Toxicol. Mech. Methods 2009, 19, 498–502. 10.3109/15376510903334862. [DOI] [PubMed] [Google Scholar]
- Paramasivam S.; Raju C. V.; Hemalatha S.; Mathiyarasu J.; Kumar S. S. Electrochemical Detection of Alloxan on Reduced Graphene Oxide Modified Glassy Carbon Electrode. Electroanalysis 2020, 32, 1273–1279. 10.1002/elan.201900631. [DOI] [Google Scholar]
- Monnappa A. B.; Manjunatha J. G.; Bhatt A. S. Design of a Sensitive and Selective Voltammetric Sensor Based on a Cationic Surfactant-Modified Carbon Paste Electrode for the Determination of Alloxan. ACS Omega 2020, 5, 23481–23490. 10.1021/acsomega.0c03517. [DOI] [PMC free article] [PubMed] [Google Scholar]
- a Al Shehri Z. S.; Derayea S. M.; El-Maghrabey M. H.; El Hamd M. A. A Flavin Derivative-Based Fluorometric Analysis for the Diabetes Mellitus Inducer, Alloxan, for Its Follow-up in Flour and Flour-Derived Food. Food Anal. Methods 2021, 14, 473–484. 10.1007/s12161-020-01890-5. [DOI] [Google Scholar]; b Giaccone V.; Cammilleri G.; Di Stefano V.; Pitonzo R.; Vella A.; Pulvirenti A.; Lo Dico G. M.; Ferrantelli V.; Macaluso A. First report on the presence of Alloxan in bleached flour by LC-MS/MS method. J. Cereal Sci. 2017, 77, 120–125. 10.1016/j.jcs.2017.06.015. [DOI] [Google Scholar]
- a Ko M.; Lukasz M.; Aileen M. E.; Claudia G. D.; Robert M. S.; Zheng M.; Katherine A. M. Employing Conductive Metal-Organic Frameworks for Voltammetric Detection of Neurochemicals. J. Am. Chem. Soc. 2020, 142, 11717–11733. 10.1021/jacs.9b13402. [DOI] [PubMed] [Google Scholar]; b Kalantari R.; Ryan C.; Hang C.; George Y.; Jiri J.; Mira J. Label-Free Voltammetric Detection Using Individually Addressable Oligonucleotide Microelectrode Arrays. Anal. Chem. 2010, 82, 9028–9033. 10.1021/ac102002k. [DOI] [PubMed] [Google Scholar]
- a Lin K.; Gómez-Bombarelli R.; Beh E. S.; Tong L.; Chen Q.; Valle A.; Aspuru-Guzik A.; Aziz M. J.; Gordon R. G. A redox-flow battery with an alloxazine-based organic electrolyte. Nat. Energy 2016, 1, 16102. 10.1038/nenergy.2016.102. [DOI] [Google Scholar]; b Sun T.; Liu C.; Xu X.; Nian Q.; Zheng S.; Hou X.; Liang J.; Tao Z. Insights into the hydronium-ion storage of alloxazine in mild electrolyte. J. Mater. Chem. A 2020, 8, 21983–21987. 10.1039/d0ta09316e. [DOI] [Google Scholar]
- Sudhesh P.; Balamurugan T.; Berchmans S. Insights into Ferrocene-Mediated Nitric Oxide Sensing - Elucidation of Mechanism and Isolation of Intermediate. Electrochim. Acta 2016, 210, 321–327. 10.1016/j.electacta.2016.05.153. [DOI] [Google Scholar]
- a Areias M. C. C.; Shimizu K.; Compton R. G. Voltammetric detection of glutathione: an adsorptive stripping voltammetry approach. Analyst 2016, 141, 2904–2910. 10.1039/c6an00550k. [DOI] [PubMed] [Google Scholar]; b Areias M. C. C.; Shimizu K.; Compton R. G. Voltammetric Detection of Captopril Using Copper(II) and an Unmodified Glassy Carbon Electrode. Electroanalysis 2016, 28, 1524–1529. 10.1002/elan.201501156. [DOI] [Google Scholar]
- Ruzicka J.; Scampavia L. From flow injection to bead injection. Anal. Chem. 1999, 71, 257a–263a. 10.1021/ac990293i. [DOI] [PubMed] [Google Scholar]
- Murthy A. P.; Duraimurugan K.; Sridhar J.; Madhavan J. Application of derivative voltammetry in the quantitative determination of alloxan at single-walled carbon nanotubes modified electrode. Electrochim. Acta 2019, 317, 182–190. 10.1016/j.electacta.2019.05.163. [DOI] [Google Scholar]
- a Li X.; Zhang S.; Dang Y.; Liu Z.; Zhang Z.; Shan D.; Zhang X.; Wang T.; Lu X. Ultratrace Naked-Eye Colorimetric Ratio Assay of Chromium(III) Ion in Aqueous Solution via Stimuli-Responsive Morphological Transformation of Silver Nanoflakes. Anal. Chem. 2019, 91, 4031–4038. 10.1021/acs.analchem.8b05472. [DOI] [PubMed] [Google Scholar]; b Korzhenevskiĭ D. A.; Selishcheva A. A.; Savel’ev S. V. Measurement of the endogenous alloxane in human blood]. Biomed. Khim. 2009, 55, 343–349. [PubMed] [Google Scholar]
- a Penzkofer A. Absorption Spectroscopic Determination of Solubility of Alloxazine in Aqueous Solutions. J. Anal. Sci., Methods Instrum. 2015, 5, 13–21. 10.4236/jasmi.2015.52002. [DOI] [Google Scholar]; b Penzkofer A. Absorption and emission spectroscopic investigation of alloxazine in aqueous solutions and comparison with lumichrome. J. Photochem. Photobiol., A 2016, 314, 114–124. 10.1016/j.jphotochem.2015.08.011. [DOI] [Google Scholar]
Associated Data
This section collects any data citations, data availability statements, or supplementary materials included in this article.


