Abstract
Oil-well cement physical characteristics considerably change after being carbonated by a CO2-rich solution. In this study, the influence of graphite particles in the characteristics of oil-well cement reacted with a CO2-rich solution at 130 °C and 10 MPa for 10 days was studied. After 10 days of carbonation, incorporating 0.2% by weight of cement (BWOC) of graphite into the cement slurry decreased the carbonation depth by 29.8% as confirmed by the direct measurement and the micro-computerized tomography scan technique. The addition of 0.2% BWOC of graphite also reduced the cement matrix permeability by 31.4% and increased its compressive strength by 16.4% and tensile strength by 23.8% compared to the sample without graphite. The decrease in the cement matrix portlandite concentration and permeability of the samples prepared with graphite contributed to promote the cement matrix carbonation resistance. The microscopic images also proved that the incorporation of graphite delayed the leaching of calcium carbonate, and this is also attributed to decreasing the cement strength deterioration.
1. Introduction
In the last decades, global warming has significantly increased because of the increase in greenhouse gas emission into the atmosphere as a result of the enduring use of fossil fuels as an energy source.1,2
Many previous studies identified CO2 produced from different human activities as the major reason of increasing the intensity of global warming.3 According to Ding et al.4 and Rao et al.,5 CO2 emission is the source of most of the unfavorable impacts of global warming. The increase in CO2 concentration resulted in the global temperature increase from the middle of the 19th century to 2016 by 1 °C.6
Geologic carbon sequestration is an efficient method that injects CO2 into suitable deep geologic formations.7−9 The success of these projects is affected by the rigidity of the underground formation, caprock, and the cement layer.
About 20% of hydrated oil-well cement is portlandite, which is one of the least stable hydration products in a corrosive environment. This is the reason why the oil-well cement corrodes easily after interacting with CO210 and later on results in a deterioration in the cement layer strength and permeability caused by the formation of microcracks.11,12
The impact of the carbonation process on the cement matrix stability was investigated by several previous studies.13−16 The outcomes of these studies supported the hypothesis that the addition of certain complementary materials that are able to decrease the cement portlandite content, and the concentration of the hydration products of high Ca/Si content,17 or the reducing the cement permeability;18 could lead to mitigating the cement carbonation-induced degradation.
Although the use of fly ash and pozzolanic materials significantly decreased the concentration of portlandite in the hydrated cement matrix,19,20 the rheological characteristics of the cement slurry were negatively affected by incorporating these materials, and the use of high concentrations resulted in increasing the microcracks.7 Another disadvantage of using pozzolanic materials is that they have a high content of Al2O3 that leads to ettringite formation.21 The reduction in the water-to-cement ratio had also been considered by other studies as an effective way to increase the cement stability against carbonation; however, the low water content could negatively impact the cement matrix integrity by forming microcracks.22
Recently, Mahmoud and Elkatatny23 suggested the use of nanoclay to enhance the stability of the oil-well cement against carbonation. The outcomes indicate that the use of nanoclay at a concentration of 1.0% by weight of cement (BWOC) is able to decrease the portlandite content and permeability of the hydrated cement, which considerably ameliorates its carbonation resistance. However, the nanoclay particles considerably raised the plastic viscosity of the cement slurry; therefore, it reduced its pumpability.
The effectiveness of incorporating the amorphous-nanosilica-latex (ANL) in enhancing the cement resistance to the carbonation process was studied by Xu et al.24 Their outcomes proved that incorporating the ANL into the cement slurry affected the cement hydration process and enabled the conversion of the low Ca/Si ratio hydration products of portlandite that have low stability in acidic conditions to more stable hydration products. The cement samples prepared with the ANL also have low permeability caused by the film formed by the latex and the pore-filling effect of the nanosilica.
Abid et al.2 evaluated the use of two agricultural wastes of the palm oil fuel ash and rice husk ash with the cement and compared their ability to improve the cement carbonation resistance with that provided by the addition of the nanosilica. The authors reported that the efficiency of the agricultural waste in enhancing the carbonation resistance is significantly less than that of the nanosilica. They reported that the ability of the nanosilica in enhancing the cement carbonation resistance is caused by its ability to quickly increase the cement compressive strength compared to the waste materials that work as retarders.
The improvement in the cement carbonation resistance caused by the addition of various amounts of polypropylene fiber (PPF) was investigated by Mahmoud and Elkatatny.25 The results showed that 0.125% BWOC is the optimum concentration of the PPF that considerably decreased the carbonation depth and increased the cement strength compared to the decrease in the case of using the neat cement.
Graphite powder is a low-cost product that is mainly mined in China, India, and Brazil.26 Several recent studies evaluated the effect of the graphite particles in different properties of the cement paste and matrix.27−30
In this study, the carbonation resistance of the graphite-modified cement reacted with a CO2-rich solution at 130 °C and 10 MPa for 10 days was examined. The alteration in the properties of the cement matrix and the mechanism responsible for improving graphite-based oil-well cement stability against carbonation were also studied.
2. Materials and Methods
2.1. Materials
The procedures of the American Petroleum Institute (API) standards31,32 were followed in this work to make four cement slurries having different concentrations of graphite. The first slurry was the control sample, which was prepared using the Saudi Class G cement, a defoamer, silica flour, a friction-reducing agent, a fluid loss additive, and an expandable agent that were mixed with 44% BWOC of water. The control sample did not contain graphite. The other three samples prepared, Gr1, Gr2, and Gr3, contained the additives used to make the control sample in addition to 0.1, 0.2, and 0.3% BWOC of graphite, respectively, as indicated in Table 1. Class G cement and the other additives except graphite were supplied by Halliburton. The selection of these concentrations of graphite was based on the initial screening that was based on the change of the compressive strength with graphite concentration. The results of that analysis indicated that the use of more than 0.3% of graphite reduced the cement matrix compressive strength considerably; therefore, the maximum concentration of 0.3% of graphite was considered in this study.
Table 1. Cement Slurries’ Composition; All Components Are in % BWOC.
| slurries |
||||
|---|---|---|---|---|
| components | control sample | Gr1 | Gr2 | Gr3 |
| silica flour | 35% | |||
| dispersant (CFR 3) | 0.8% | |||
| expandable agent (MicroBond HT) | 1.0% | |||
| fluid loss controller (HALADVANC 344) | 0.2% | |||
| fluid loss controller (HALADVANC 414) | 0.5% | |||
| defoamer | 4.70E-07% | |||
| graphite | 0% | 0.1% | 0.2% | 0.3% |
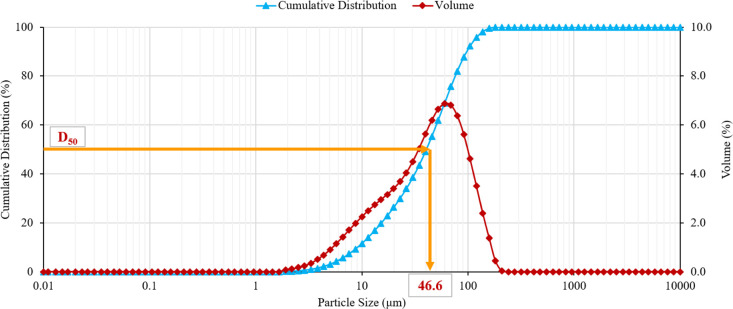
The graphite powder used in this study was obtained from Saudi Arabia. This powder is currently used in Saudi Arabia as an additive to the drilling fluid to mitigate the drilling fluid loss. The graphite powder used in this work has an average particle size (D50) of 46.6 μm as indicated in Figure 1, which shows the volume percentage and cumulative distribution of the graphite powder particles as a function of the particle size. The graphite powder and Class G cement were also characterized by X-ray fluorescence (XRF) analysis to investigate their elemental composition. As indicated in Table 2, the graphite powder consists mainly of carbon (>90%), while Saudi Class G cement has no carbon and consists of 72.1% calcium and 12.1% silica.
Figure 1.
The particle size distribution of the graphite powder used in this study.
Table 2. The Elemental Composition of Saudi Class G Cement and Graphite.
| elements |
||||||||||||||
|---|---|---|---|---|---|---|---|---|---|---|---|---|---|---|
| Na | Mg | Al | Si | S | Cl | K | Ca | C | Ti | Mn | Fe | Zn | Sr | |
| Saudi Class G cement | 0.00 | 1.33 | 2.37 | 12.1 | 2.43 | 0.00 | 0.00 | 72.1 | 0.00 | 0.39 | 0.05 | 9.08 | 0.00 | 0.15 |
| graphite | 1.26 | 0.21 | 0.39 | 4.86 | 0.15 | 0.61 | 0.24 | 1.11 | 90.4 | 0.15 | 0.17 | 0.26 | 0.13 | 0.06 |
2.2. Methodology
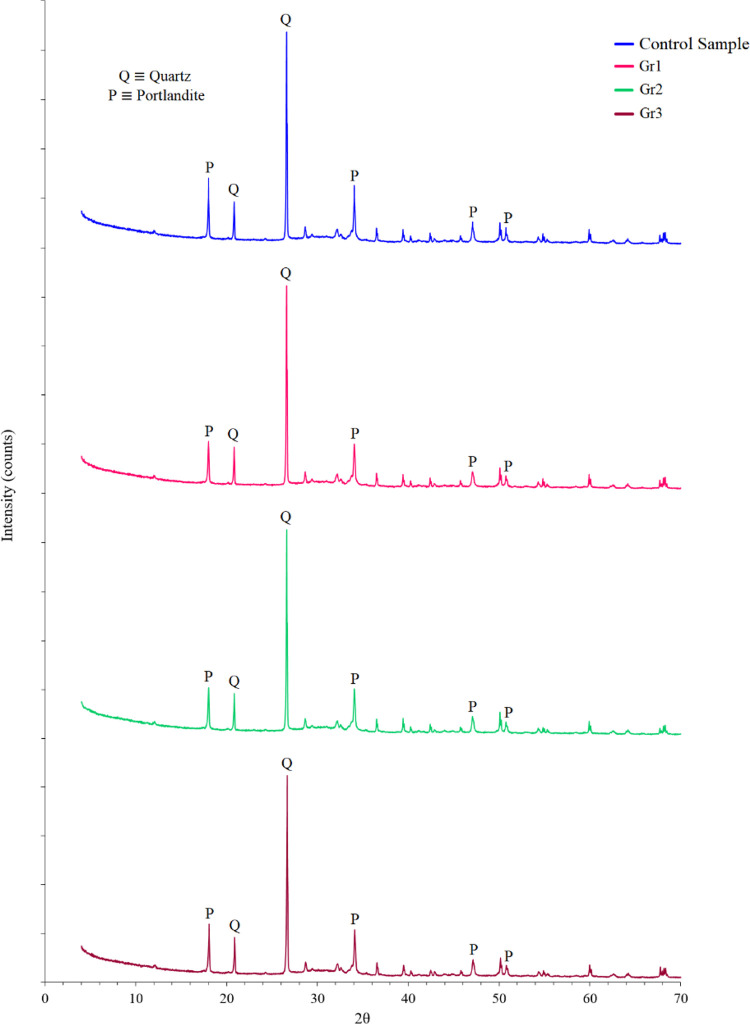
All samples prepared in this study were analyzed using the X-ray diffraction (XRD) technique. As shown in Figure 3, samples Gr1 and Gr2 prepared with 0.1 and 0.2% BWOC of graphite, respectively, have considerably low portlandite concentrations as proven by the reduction in the portlandite peaks at 2θ’s of 18.01, 34.10, 47.12, and 50.81°. The quantitative analysis indicated that the control sample and samples Gr1, Gr2, and Gr3 have portlandite concentrations of 24.5, 19.9, 18.7, and 21.7%, respectively. This confirms the transformation of the high portlandite concentration in samples Gr1 and Gr2 to calcium silicate hydrates (CSH), where these samples have a portlandite content 4.6 and 5.8% less than the portlandite content of the control sample, respectively.
Figure 3.
The XRD patterns for all samples after 24 h of curing.
The domination of portlandite in the control sample and CSH in sample Gr2 was also confirmed by the scanning electron microscope (SEM) imaging technique. As indicated by the SEM images of Figure 2, the large portlandite particles are distributed among the control sample (Figure 2a), while the CSH products are distributed among sample Gr2 with a little presence of portlandite. Since the stability of portlandite in the CO2-rich environment is lower than most of the CSH products, it is anticipated that the cement resistance to the carbonation could be improved after incorporation of graphite into the cement slurry.33
Figure 2.
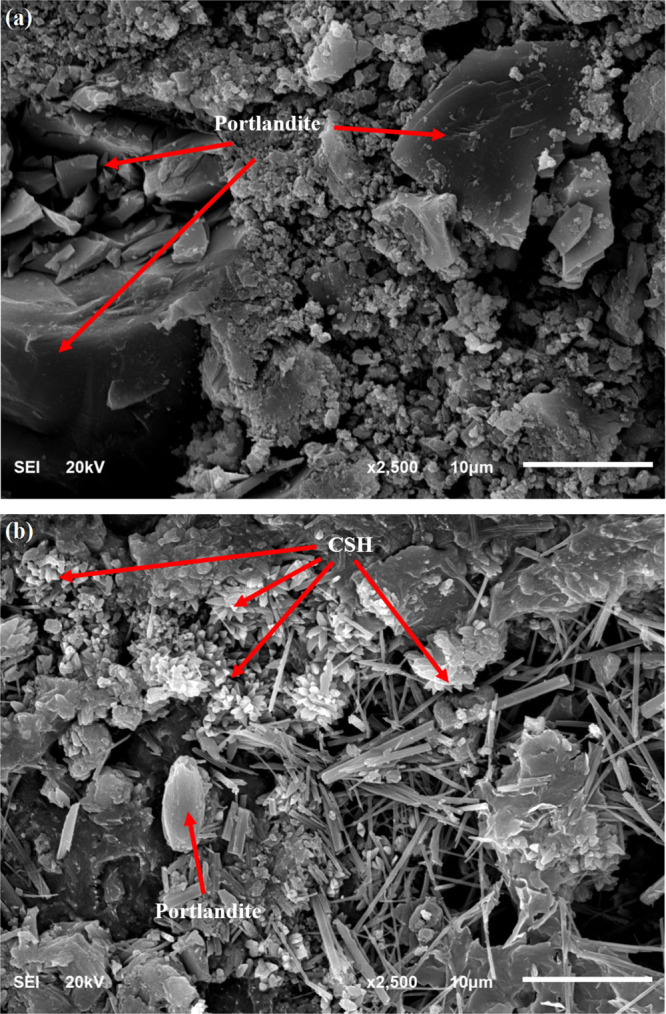
SEM images of samples: (a) control sample and (b) sample Gr2. The control sample is dominated by portlandite, while CSH products dominate sample Gr2.
The use of graphite with a higher concentration, i.e., greater than 0.2%, as in the case of sample Gr3 that was prepared to have 0.3% of graphite, leads to particle agglomeration, which leads to the formation of a cement matrix with an irregular structure that is expected to have low strength. This behavior was noticed before after incorporating high concentrations of nanoclay particles into the cement slurry.34,35
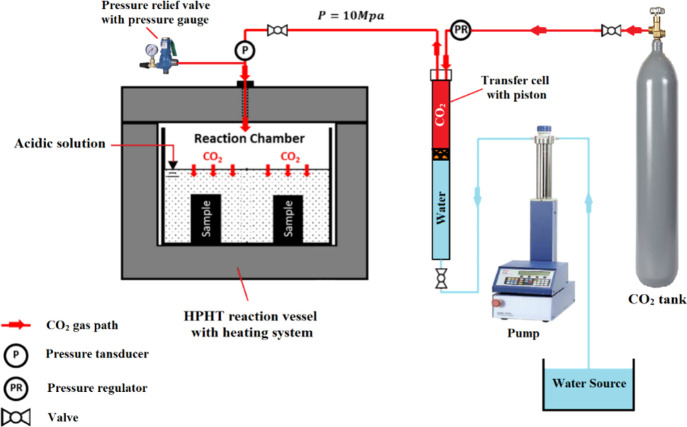
The original compressive and tensile strength and permeability of cement matrices representing all the four cement formulations under study were evaluated after 24 h of preparation and before exposing the samples to the CO2-saturated solution. After that, samples representing all formulations under study were reacted with CO2 after being submerged into deionized water using the high-pressure, high-temperature (HPHT) reaction vessel in Figure 4. The vessel temperature was allowed to increase to 130 °C within 4 h after injecting CO2 into the vessel, while the pressure of the vessel was allowed to raise to 10 MPa and controlled at this level using the pressure relief valve. Then the samples were reacted for 10 days with the CO2-saturated solution; finally, they were removed to study the change in their properties.
Figure 4.
The HPHT reaction system.
The following section discusses the procedures followed to evaluate the changes in the cement properties and the specifications of the samples used for every test; as discussed before, some of these properties were evaluated before and after the carbonation process (i.e., compressive strength, tensile strength, and permeability), while the carbonation depth, carbonation area, and change in the microstructure of the cement were evaluated after cement carbonation.
2.2.1. Carbonation Depth and Carbonated Area
The effect of graphite addition on the carbonation depth and carbonated area of the cement samples was studied using samples with a diameter of 3.81 cm and a length of 7.62 cm. After carbonation, the carbonation depth inside the samples was evaluated using the direct measurement and the micro-computerized tomography (CT) scan technique. After scanning the samples with the CT technique, they were cut at the middle to obtain two small samples with a length of 3.81 cm, and then the carbonation depth measurement was conducted at eight different points along the circumference of every sample. These points are equally apart; so at every 45°, one measurement was taken. The average of these eight measurements is considered as the carbonation depth. The approximate uncarbonated and carbonated areas were then calculated as a percentage of the total core sample area.
2.2.2. Microstructure
The optical microscope was used to study the microstructure of all samples under study to determine the changes in the carbonated region and to investigate the capability of graphite to minimize these changes and to affect the calcium leaching process.
2.2.3. Permeability Measurement
The permeability of the solidified samples was measured following the Hagen–Poiseuille law36,37 and using samples with a diameter and length of 3.81 and 1.52 cm, respectively, before and after carbonation of samples.
2.2.4. Compressive Strength Measurement
The compressive strength was tested before and after carbonation for all samples under study using cubical specimens with edges of 5.08 cm and following the API standard32 and ASTM standard.38 The measurement was performed on three specimens of every sample, and then the average of the three measurements was considered as the representative compressive strength for that sample.
2.2.5. Tensile Strength Measurement
The tensile strength was also tested before and after carbonation. Samples with a diameter of 3.81 cm and a length of 2.29 cm were used for this measurement. The tensile strength was determined indirectly using the Brazilian tensile strength measurement method. For this, every sample was loaded at two opposite points along its circumference until it fails, and then the maximum load the sample resists (P) with the sample length (l) and diameter (d) was substituted into eq 1 to calculate the Brazilian tensile strength.39 For tensile strength measurement, also three measurements were conducted in three different specimens representing every sample, and then the average strength of the three measurements was reported as the average tensile strength.
| 1 |
where σt is the Brazilian tensile strength in MPa; P denotes the maximum load the sample resists in N; and d and l are the sample’s dimension of diameter and length in mm, respectively.
3. Results and Discussion
3.1. Carbonation Depth and Carbonated Area
The real cores in Figure 5 compare the carbonation depth of all samples (control sample, Gr1, Gr2, and Gr3). Sample Gr2 was the best in preventing cement carbonation, and it showed the minimum carbonation depth compared to the others. This indicates that adding 0.2% BWOC of graphite was capable to maximize its ability to resist the CO2-saturated solution attack.
Figure 5.

Carbonation depth of the control, Gr1, Gr2, and Gr3 samples submerged into the CO2-rich solution at 130 °C and 10 MPa for 10 days. The average carbonation depths of the control sample and samples Gr1, Gr2, and Gr3 are 2081, 1600, 1460, and 1788 μm, respectively.
The measured carbonation depth of different samples after 10 days of carbonation is compared in Figure 6. The carbonation depth inside the control sample is 2081 μm; incorporating 0.1% BWOC of graphite into sample Gr1 reduced the carbonation depth to 1600 μm, which is 23% less than that of the control sample. As mentioned earlier, sample Gr2 has the smallest carbonation depth of only 1460 μm, which is 29.8% smaller than that of the control sample. Sample Gr3 experienced a carbonation depth of 1788 μm; although it is 14.1% smaller than that of the control sample, it is 22.5% greater than the carbonation depth of sample Gr2.
Figure 6.
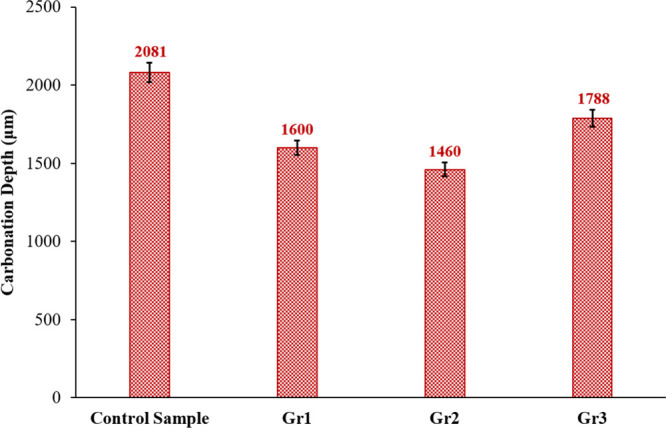
The carbonation depth inside the control, Gr1, Gr2, and Gr3 samples after reacting with the CO2-rich solution at 130 °C and 10 MPa for 10 days.
Figure 7 compares the uncarbonated and carbonated areas for all samples. As indicated in this figure, the carbonated area inside sample Gr2 is 14.7%, which is the lowest followed by Gr1 (16.1%), Gr3 (17.9%), and finally the control sample, which has the highest carbonated area of 20.7% of the total core sample’s area.
Figure 7.
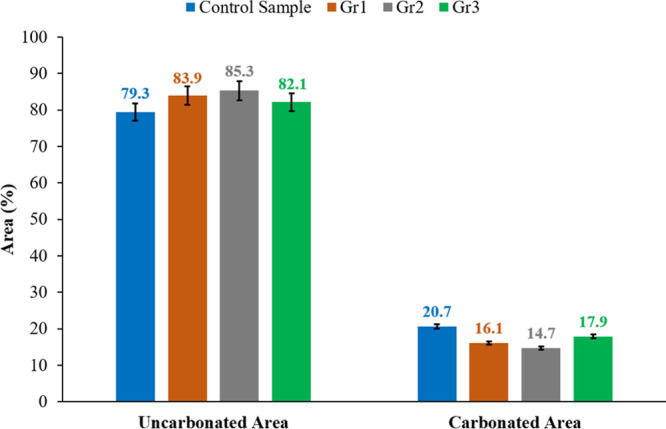
The uncarbonated and carbonated areas inside the control, Gr1, Gr2, and Gr3 samples submerged into the CO2-rich solution at 130 °C and 10 MPa for 10 days.
This considerable decrease in the carbonation depth and area of the samples prepared with graphite is caused by the reduction in portlandite and the increase in CSH products in these samples as explained in Figure 3. The elevated stability of CSH products in the acidic environment reduces the acidic brine invasion into the graphite-based samples especially sample Gr2, which has the lowest portlandite content as proven in Figure 3.
From the previous discussion, we can conclude that increasing the graphite content up to 0.2% BWOC increased the stability of the cement matrix in the CO2-saturated environment. The use of 0.2% BWOC of graphite is the optimum in improving the cement stability inside the CO2-rich solution. Increasing the graphite content to more than 0.2% led to deteriorating the cement matrix and reduced its resistance to the carbonation process as indicated by the increase in the carbonation depth and carbonated area shown in Figures 6 and 7, respectively.
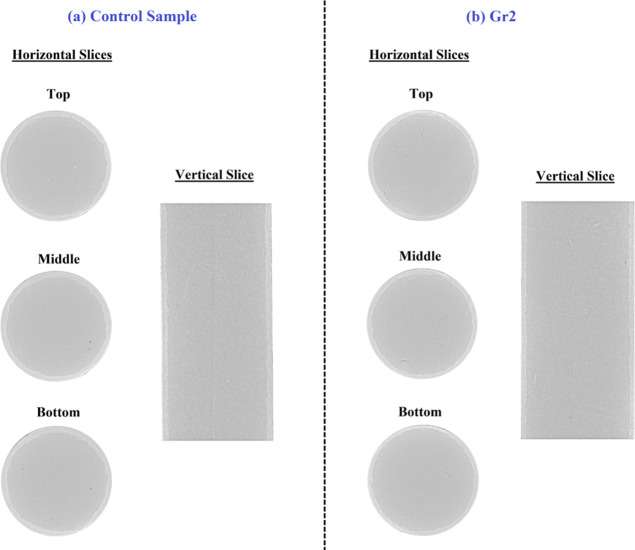
Figure 8 compares the carbonation depth of the control sample and sample Gr2 using micro-CT images taken at different locations inside these samples (from top to bottom); both vertical and horizontal projections for both samples are compared in this figure. Comparing the projection of the different slices taken for both samples proves that sample Gr2 was more stabilized into the CO2-rich environment as indicated by the low carbonation depth in both vertical and horizontal views of sample Gr2 (Figure 8b) in comparison with the control sample (Figure 8a).
Figure 8.
Micro-CT scan results for the (a) control sample and (b) Gr2. The average carbonation depths of the control sample and sample Gr2 are 2081 and 1460, respectively.
3.2. Permeability
Figure 9 compares the permeability of the samples before and after interacting with the acidic solution. The results in Figure 9 prove that, originally, the control sample’s permeability of 0.0075 millidarcy is higher than the permeability of the samples including graphite particles, and sample Gr2 has the lowest original permeability of 0.0055 millidarcy, which is 26.7% less than the permeability of the control sample. The reduction in the original permeability of the samples incorporating graphite particles that have less concentration of portlandite and higher CSH content compared with the control sample (as explained earlier in Figure 3) is caused by the reduction in the permeability of CSH caused by the high curing temperature as explained by Jeong et al.40
Figure 9.
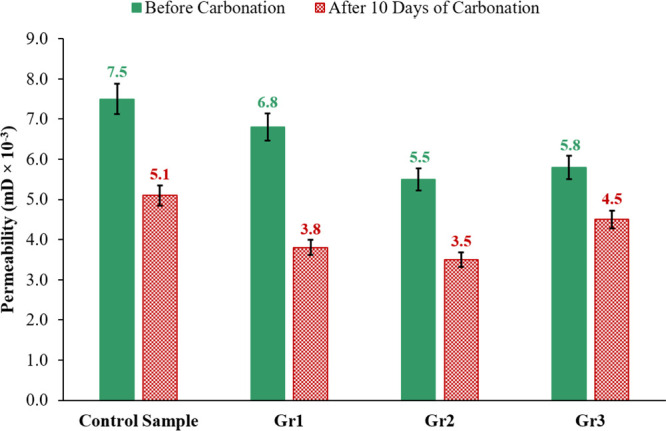
The change in the permeability of the control, Gr1, Gr2, and Gr3 samples after 10 days of interacting with the CO2-saturated solution at 130 °C and 10 MPa.
After carbonation, the permeability of all samples was decreased; the control sample permeability was 0.0051 millidarcy, which is reduced to 0.0035 millidarcy by incorporating 0.2% BWOC of graphite into sample Gr2 that has a permeability 31.4% smaller than the control sample permeability. This reduction in the permeability of the samples with graphite is caused by the pore filling of these small particles, while the decrease in the permeability of all samples after being reacted with the CO2-saturated solution is attributed to two facts: The first is because of curing the samples at a higher temperature (130 °C) while reacting them with the CO2-saturated solution40 compared to the curing at 75 °C during the first 24 h. The second reason is the formation of CaCO3 during carbonation, which is insoluble in water, and it densifies the cement matrix and fills the cement matrix pores, therefore reducing its permeability.
Several previous studies also considered permeability reduction as a mechanism that could improve the cement carbonation resistance. Comparing the reduction in the samples’ permeability measurements in Figure 9 with the carbonation depths in Figure 5, it is clear that these results are matched.
3.3. Cement Carbonation at the Microstructure Level
After injection of the CO2 into the formation, carbonic acid is produced because of the dissolution of CO2 into the formation of brine as illustrated in eq 2. When the originally formed carbonic acid attacks the portlandite, the formation of calcite, which is a white color compound that is non-soluble in water, will take place as indicated in eq 3. This region dominated by calcite is called the carbonated region, which will keep moving toward the center of the cement core as long as there is a continuous source of CO2. The formation of calcite and the increase in the thickness of the carbonated layer are anticipated to raise the strength and lower the permeability of the cement matrix because of the high calcite density.
Leaching of the originally formed calcite is expected in the case where there is a continuous source that continually provides the system with CO2 as is the case for the GCS projects as shown by eq 4. This leaching process at the end will result in forming a new layer in the outermost part of the cement matrix (far from the center) that is called the leached layer. This layer will have higher porosity and permeability and lower strength compared to the carbonated and uncarbonated (intact) cement layer. This leached layer is responsible for the deterioration of the cement properties in the CO2-rich environment.
| 2 |
| 3 |
| 4 |
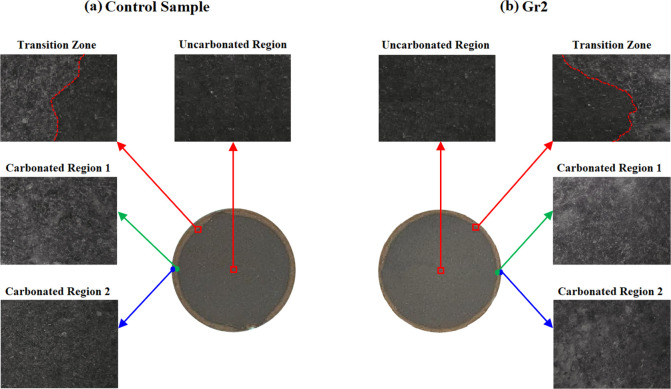
Figure 10 compares the microscopic images of the control sample and sample Gr2 that was prepared to have 0.2% BWOC of the graphite particles. The figure indicates that the uncarbonated region of both samples is dominated by dark gray color. As illustrated in Figure 10, for both the control sample and sample Gr1, the transition region (the region between the carbonated and uncarbonated regions) has two colors: a dark gray region that represents the uncarbonated section and a second region dominated by white color. The source for this white color that also dominated that carbonated region is the formation of calcite as illustrated earlier.
Figure 10.
The microscopic images taken at different locations inside the (a) control sample and (b) Gr2 sample reacted with the CO2-saturated solution at 130 °C and 10 MPa for 10 days.
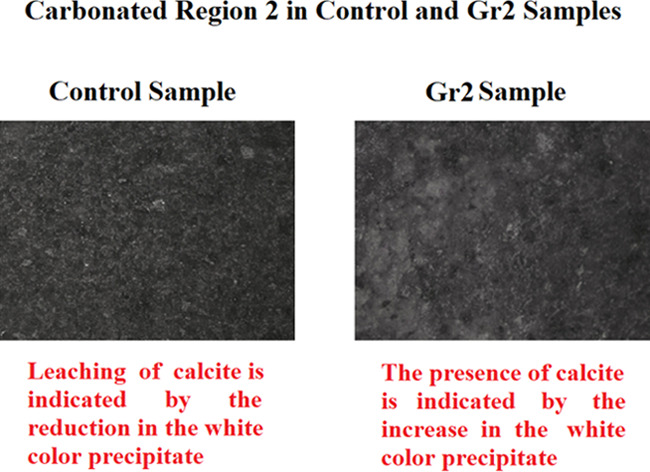
As shown in Figure 10, the carbonated region is divided into two regions. The first region is the carbonated region 1, which is close to the intact area at the center of the core; this region is dominated by calcite in both the control sample and sample Gr1 as proven by the presence of the white color precipitate. The second region is the carbonated region 2, which is closer to the boundary of the sample core, as indicated in Figure 10a for the control sample; this region experienced a reduction in the white color that indicates leaching of the calcite, while for sample Gr2, the carbonated region 2 is dominated by the white color precipitate (calcite) as indicated in Figure 10b. This confirms that leaching of calcite did not take place in sample Gr2.
The reductions in the portlandite concentration (Figure 3) and the permeability (Figure 9) of the cement matrix for sample Gr2 compared with the control sample are the major factors that raised the cement matrix efficiency to resist calcite leaching and carbonation.
3.4. Compressive Strength
The compressive strength of the control sample and the graphite-based samples before and after interacting with the acidic solution for 10 days is compared in Figure 11. It is clear that, before carbonation, the compressive strength of all samples prepared with graphite is greater than the control sample compressive strength.
Figure 11.
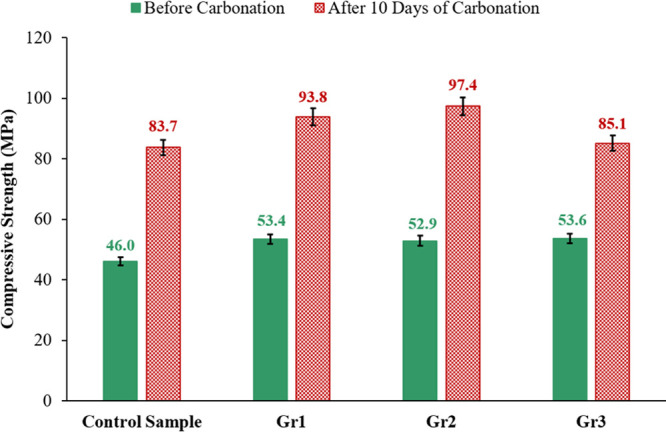
The compressive strength of the control, Gr1, Gr2, and Gr3 samples after 10 days of interacting with the CO2-saturated solution at 130 °C and 10 MPa.
After the carbonation process, the compressive strength of all samples (including the control sample) was increased, and still, the graphite-based samples had a compressive strength greater than the control cement (Figure 11). The control sample had a compressive strength of 83.7 MPa, which was increased by 16.4% to reach 97.4 MPa after incorporating 0.2% BWOC of graphite into sample Gr2. The compressive strength of sample Gr3 was 85.1 MPa, which is only 1.7% higher than that of the control sample; it is also 12.6% less than that of sample Gr2.
The increase in the cement samples’ compressive strength after carbonation compared to that before carbonation is attributed to two reasons: first, the high-temperature conditions under which the samples were cured during the carbonation process and second, the formation of CaCO3 during the carbonation process. CaCO3 is a dense component that leads to densifying the cement matrix and hence increasing its strength. The compressive strength of the graphite-based samples outperformed that of the control sample after the carbonation process because of the early start of the leaching process in the control sample compared to the graphite-based samples as discussed earlier and shown in Figure 10.
3.5. Tensile Strength
The measured tensile strength of the samples considered in this study was evaluated before and after interacting with the acidic solution for 10 days. The result of the tensile strength change is shown in Figure 12. The tensile strength of the samples incorporating graphite particles outperformed the control sample tensile strength before and after being reacted with the CO2-rich solution (Figure 12). Before carbonation, the control sample had a tensile strength of 2.91 MPa, which was increased with the addition of graphite particles to reach 3.30 MPa for sample Gr2, which was an increment of 13.4% compared to the control sample.
Figure 12.
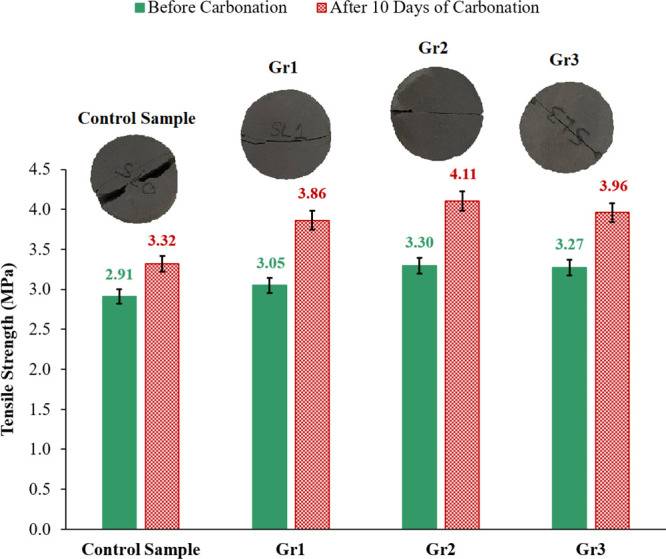
The tensile strength of the control, Gr1, Gr2, and Gr3 samples after 10 days of exposure to the CO2-saturated solution at 130 °C and 10 MPa. The inserted photos are the real cores of the samples crushed under the tensile force after being exposed to the CO2-rich solution.
After carbonation, the tensile strength of all cement samples increased. The control sample tensile strength reached 3.32 MPa, and sample Gr2 that contained 0.2% BWOC of graphite had a tensile strength of 4.11 MPa, which is 23.8% higher than that of the control sample. Blending of 0.3% BWOC of graphite with the cement reduced the cement tensile strength before and after carbonation (Figure 12).
The increase in the tensile strength of the samples exposed to the CO2-rich solution compared to their tensile strength before carbonation is also because of the influence of the high temperature at which the samples were cured during the carbonation process, as well as the formation of CaCO3 during the carbonation process. The tensile strength of the graphite-based samples outperformed that of the control sample after the carbonation process because of the early start of the leaching process in the control sample compared to the graphite-based samples as discussed earlier and shown in Figure 10.
The inserted photos in Figure 12 are for the real core samples crushed under the tensile force after interacting with the CO2-rich solution. The inserted photos indicate that the fracture surface of the control sample is much rougher compared with the fracture surface of the samples incorporating graphite; this confirms the domination of the control sample with microcracks compared with the graphite-based samples. The propagation of these microcracks during control sample carbonation leads to the formation of a rough fracture surface when the sample is exposed to tensile force as explained earlier in the study conducted by Li et al.41
4. Conclusions
The influence of adding the graphite particles on the properties of oil-well cement that underwent a CO2 sequestration environment for 10 days at 130 °C and 10 MPa was studied before and after carbonation. After 10 days of carbonation, the following conclusions can be drawn:
Blending of 0.2% BWOC of graphite into the cement slurry improved the cement matrix ability to resist the carbonation process. The carbonation depth of the control sample was 2081 μm, and it was decreased to 1460 μm for the sample with 0.2% BWOC of graphite. This was also proven by the micro-CT scan performed along the whole length of 7.62 cm cement samples.
The carbonated area of the cement sample prepared without graphite was 20.7% of the total sample area, while that of the sample with 0.2% BWOC of graphite was 14.7%. The microscopic images proved that calcium leaching was delayed by the addition of graphite particles.
Incorporation of 0.2% BWOC of graphite maintained the matrix permeability at 31.4% less than that of the control sample. The compressive strength and tensile strength of this sample were 13.4 and 23.8% higher than those of the sample without graphite, respectively.
The reductions in the portlandite concentration and the permeability of the cement matrix for the samples having 0.2% BWOC of graphite are the major factors that raised the cement matrix efficiency to resist calcite leaching and carbonation.
The authors declare no competing financial interest.
References
- Abba M. K.; Abbas A. J.; Nasr G. G.; Al-Otaibi A.; Burby M.; Saidu B.; Suleiman S. M. Solubility trapping as a potential secondary mechanism for CO2 sequestration during enhanced gas recovery by CO2 injection in conventional natural gas reservoirs: An experimental approach. J. Nat. Gas Sci. Eng. 2019, 71, 103002. 10.1016/j.jngse.2019.103002. [DOI] [Google Scholar]
- Abid K.; Gholami R.; Mutadir G. A pozzolanic based methodology to reinforce Portland cement used for CO2 storage sites. J. Nat. Gas Sci. Eng. 2020, 73, 103062. 10.1016/j.jngse.2019.103062. [DOI] [Google Scholar]
- MacDowell N.; Florin N.; Buchard A.; Hallett J.; Galindo A.; Jackson G.; Adjiman C. S.; Williams C. K.; Shah N.; Fennell P. An overview of CO2 capture technologies. Energy Environ. Sci. 2010, 3, 1645–1669. 10.1039/c004106h. [DOI] [Google Scholar]
- Ding S.; Xi Y.; Jiang H.; Liu G. CO2 storage capacity estimation in oil reservoirs by solubility and mineral trapping. Appl. Geochem. 2018, 89, 121–128. 10.1016/j.apgeochem.2017.12.002. [DOI] [Google Scholar]
- Rao G. M.; Andrianiaina H. D.; Wang Y. Key driving factor analysis on industrialization and CO2 emission: based on data of Madagascar, China and the United States. BioTechnol.: Indian J. 2014, 10, 14835–14839. [Google Scholar]; https://www.tsijournals.com/articles/key-driving-factor-analysis-on-industrialization-and-co2-emission-based-on-data-of-madagascar-china-and-the-united-state.pdf.
- IEA CO2 Emissions from Fuel Combustion-Highlights, 2016. Accessed on Jan 2021. https://iea.blob.core.windows.net/assets/eb3b2e8d-28e0-47fd-a8ba-160f7ed42bc3/CO2_Emissions_from_Fuel_Combustion_2019_Highlights.pdf.
- Aminu M. D.; Nabavi S. A.; Rochelle C. A.; Manovic V. A review of developments in carbon dioxide storage. Appl. Energy 2017, 208, 1389–1419. 10.1016/j.apenergy.2017.09.015. [DOI] [Google Scholar]
- Li B.; Tchelepi H. A.; Benson S. M. Influence of capillary-pressure models on CO2 solubility trapping. Adv. Water Resour. 2013, 62, 488–498. 10.1016/j.advwatres.2013.08.005. [DOI] [Google Scholar]
- Pereira L. M. C.; Chapoy A.; Burgass R.; Tohidi B. Interfacial tension of CO2 + brine systems: experiments and predictive modelling. Adv. Water Resour. 2017, 103, 64–75. 10.1016/j.advwatres.2017.02.015. [DOI] [Google Scholar]
- Kutchko B. G.; Strazisar B. R.; Hawthorne S. B.; Lopano C. L.; Miller D. J.; Hakala J. A.; Guthrie G. D. H2S–CO2 reaction with hydrated Class H well cement: acid-gas injection and CO2 Co-sequestration. Int. J. Greenhouse Gas Control 2011, 5, 880–888. 10.1016/j.ijggc.2011.02.008. [DOI] [Google Scholar]
- Wolterbeek T. K. T.; Raoof A. Meter-scale reactive transport modeling of CO2-rich fluid flow along debonded wellbore casing-cement interfaces. Environ. Sci. Technol. 2018, 52, 3786–3795. 10.1021/acs.est.7b05358. [DOI] [PMC free article] [PubMed] [Google Scholar]
- Yang F.; Pang Z.; Lin L.; Jia Z.; Zhang F.; Duan Z.; Zong Z. Hydrogeochemical and isotopic evidence for trans-formational flow in a sedimentary basin: implications for CO2 storage. Appl. Geochem. 2013, 30, 4–15. 10.1016/j.apgeochem.2012.08.024. [DOI] [Google Scholar]
- Abid K.; Gholami R.; Choate P.; Nagaratnam B. H. A review on cement degradation under CO2-rich environment of sequestration projects. J. Nat. Gas Sci. Eng. 2015, 27, 1149–1157. 10.1016/j.jngse.2015.09.061. [DOI] [Google Scholar]
- Mahmoud A.A.; Elkatatny S.. Effect of the Temperature on the Strength of Nanoclay-Based Cement under Geologic Carbon Sequestration. In the Proceedings of the 2019 AADE National Technical Conference and Exhibition; Denver, Colorado, USA, 9–10 April, 2019. [Google Scholar]
- Mahmoud A. A.; Elkatatny S. Improved durability of Saudi Class G oil-well cement sheath in CO2 rich environments using olive waste. Constr. Build. Mater. 2020, 262, 120623. 10.1016/j.conbuildmat.2020.120623. [DOI] [Google Scholar]
- Mahmoud A.A.; Elkatatny S.; Mahmoud M.. Improving Class G Cement Carbonation Resistance Using Nanoclay Particles for Geologic Carbon Sequestration Applications. In the Proceedings of the 2018 Abu Dhabi International Petroleum Exhibition & Conference, Abu Dhabi, UAE, 12–15 November, 2018, 10.2118/192901-MS. [DOI] [Google Scholar]
- Jacquemet N.; Pironon J.; Lagneau V.; Saint-Marc J. Armouring of well cement in H2S–CO2 saturated brine by calcite coating – experiments and numerical modelling. Appl. Geochem. 2012, 27, 782–795. 10.1016/j.apgeochem.2011.12.004. [DOI] [Google Scholar]
- Nasvi M. C. M.; Ranjith P. G.; Sanjayan J. Effect of different mix compositions on apparent carbon dioxide (CO2) permeability of geopolymer: suitability as well cement for CO2 sequestration wells. Appl. Energy 2014, 114, 939–948. 10.1016/j.apenergy.2013.05.050. [DOI] [Google Scholar]
- Bai M.; Sun J.; Song K.; Li L.; Qiao Z. Well completion and integrity evaluation for CO2 injection wells. Renewable Sustainable Energy Rev. 2015, 45, 556–564. 10.1016/j.rser.2015.02.022. [DOI] [Google Scholar]
- Ilesanmi O.R.; Hilal B.; Gill S.; Brandl A.. Long term wellbore isolation in a corrosive enviorment. In: SPE/IADC Middle East Drilling Technology Conference & Exhibition; Society of Petroleum Engineers: Dubai, 2014, 10.3997/2214-4609-pdb.395.SPE-166769-MS. [DOI] [Google Scholar]
- Brandl A.; Cutler J.; Seholm A.; Sansil M.; Braun G. Cementing Solutions for Corrosive Well Environments. SPE Drill. Completion 2011, 26, 208–219. 10.2118/132228-PA. [DOI] [Google Scholar]
- Barlet-Gouedard V.; James S.; Drochon B.; Piot B.; Jean-Philippe C.. Cement composition for carbon dioxide supercritical environment; In: Patent, U. (Ed.), US 8, 091,642 B2, US, 2012.
- Mahmoud A. A.; Elkatatny S. Mitigating CO2 Reaction with Hydrated Oil Well Cement under Geologic Carbon Sequestration Using Nanoclay Particles. J. Nat. Gas Sci. Eng. 2019, 68, 102902. 10.1016/j.jngse.2019.102902. [DOI] [Google Scholar]
- Xu B.; Yuan B.; Wang Y.; Zeng S.; Yang Y. Nanosilica-latex reduction carbonation-induced degradation in cement of CO2 geological storage wells. J. Nat. Gas Sci. Eng. 2019, 65, 237–247. 10.1016/j.jngse.2019.03.013. [DOI] [Google Scholar]
- Mahmoud A. A.; Elkatatny S. Improving Class G Cement Carbonation Resistance for Applications of Geologic Carbon Sequestration Using Synthetic Polypropylene Fiber. J. Nat. Gas Sci. Eng. 2020, 76, 103184. 10.1016/j.jngse.2020.103184. [DOI] [Google Scholar]
- Wang Z. R.; Li B.; Liu H. B.; Zhang Y. X.; Qin X. Degradation characteristics of graphite tailings cement mortar subjected to freeze-thaw cycles. Constr. Build. Mater. 2020, 234, 117422. 10.1016/j.conbuildmat.2019.117422. [DOI] [Google Scholar]
- Fräc M.; Pichór W. Piezoresistive properties of cement composites with expanded graphite. Compos. Commun. 2020, 19, 99–102. 10.1016/j.coco.2020.03.005. [DOI] [Google Scholar]
- Frattini D.; Accardo G.; Duarte K. D. Z.; Kim D. H.; Kwon Y. Improved biofilm adhesion and electrochemical properties of a graphite-cement composite with silica nanoflowers versus two benchmark carbon felts. Appl. Energy 2020, 261, 114391. 10.1016/j.apenergy.2019.114391. [DOI] [Google Scholar]
- Papanikolaou I.; Litina C.; Zomorodian A.; Al-Tabbaa A. Effect of Natural Graphite Fineness on the Performance and Electrical Conductivity of Cement Paste Mixes for Self-Sensing Structures. Materials 2020, 13, 5833. 10.3390/ma13245833. [DOI] [PMC free article] [PubMed] [Google Scholar]
- Yanturina R. A.; Trofimov B. Y.; Ahmedjanov R. M. The Influence of Graphite-Containing Nano-Additives on Thermo-Frost Resistance of Concrete. Proc. Eng. 2017, 206, 869–874. 10.1016/j.proeng.2017.10.565. [DOI] [Google Scholar]
- Worldwide Cementing Practeices; API: Dallas, Texas, USA, 1991. [Google Scholar]
- API Recommended Practice 10B-2-Recommended Practice for Testing Well Cements; 2nd edition; American Petroleum Institute: Washington, USA, 2013. [Google Scholar]
- Kaja A. M.; Brouwers H. J. H.; Yu Q. L. NOx degradation by photocatalytic mortars: The underlying role of the CH and C-S-H carbonation. Cem. Concr. Res. 2019, 125, 105805. 10.1016/j.cemconres.2019.105805. [DOI] [Google Scholar]
- Hakamy A.; Shaikh F. U. A.; Low I. M. Characteristics of hemp fabric reinforced nanoclay-cement nanocomposites. Cem. Concr. Compos. 2014, 50, 27–35. 10.1016/j.cemconcomp.2014.03.002. [DOI] [Google Scholar]
- Shebl S. S.; Allie L.; Morsy M. S.; Aglan H. A. Mechanical behavior of activated nano silicate filled cement binders. J. Mater. Sci. 2009, 44, 1600–1606. 10.1007/s10853-008-3214-9. [DOI] [Google Scholar]
- Mahmoud A. A.; Elkatatny S.; Ahmed A.; Gajbhiye R. Influence of Nanoclay Content on Cement Matrix for Oil Wells Subjected to Cyclic Steam Injection. Materials 2019, 12, 1452. 10.3390/ma12091452. [DOI] [PMC free article] [PubMed] [Google Scholar]
- Sanjuán M. A.; Muñoz-Martialay R. Influence of the age on air permeability of concrete. J. Mater. Sci. 1995, 1995, 5657–5662. 10.1007/BF00356701. [DOI] [Google Scholar]
- ASTM C109/C109M. Standard Test Method for Compressive Strength of Hydraulic Cement Mortars (Using 2-In. or [50-Mm] Cube Specimens); ASTM International: West Conshohocken, PA, USA, 2016. [Google Scholar]
- Mahmoud A.A.; Elkatatny S.; Ahmed S.A.; Mahmoud M.. Nanoclay Content Influence on Cement Strength for Oil Wells Subjected to Cyclic Steam Injection and High-Temperature Conditions. In the Proceedings of the 2018 Abu Dhabi International Petroleum Exhibition & Conference; Abu Dhabi, UAE, 12–15 November, 2018. SPE-193059-MS. 10.2118/193059-MS. [DOI] [Google Scholar]
- Jeong Y. J.; Youm K. S.; Yun T. S. Effect of nano-silica and curing conditions on the reaction rate of class G well cement exposed to geological CO2-sequestration conditions. Cem. Concr. Res. 2018, 109, 208–216. 10.1016/j.cemconres.2018.05.001. [DOI] [Google Scholar]
- Li Q.; Lim Y. M.; Flores K. M.; Kranjc K.; Jun Y. S. Chemical Reactions of Portland Cement with Aqueous CO2 and Their Impacts on Cement’s Mechanical Properties under Geologic CO2 Sequestration Conditions. Environ. Sci. Technol. 2015, 49, 6335–6343. 10.1021/es5063488. [DOI] [PubMed] [Google Scholar]


