

Abstract
Objective:
To obtain through the use of discriminant analysis a relatively bias-free sample of extraction and nonextraction, Class I, equally susceptible to both treatments' malocclusions and to analyze retrospectively the soft tissue changes between the two different treatment groups.
Materials and Methods:
The cephalometric, model, and demographic data of 215 patients (females and males) fueled a stepwise discriminant analysis that provided the borderline homogenous subsample (30 extraction and 32 nonextraction cases). The pretreatment and postreatment cephalograms of the borderline sample were then subjected to a thorough soft tissue cephalometric analysis.
Results:
The results indicated that the three variables that played the most important role in the clinician's treatment decision were indicators of lower crowding, soft tissue convexity, and lower incisor protrusion. Significant differences (P < .001) regarding upper and lower lip protrusion, upper lip thickness (P < .05), and the nasiolabial angle (P < .05) occurred.
Conclusion:
Extraction treatment of Class I borderline malocclusions led to significant soft tissue changes regarding the upper and lower lip position and thickness as well as the nasiolabial angle, whereas the nonextraction treatment resulted in significant upper lip retraction and lower lip protraction.
Keywords: Borderline Class I, Soft tissue changes, Extraction vs nonextraction
INTRODUCTION
One of the major reasons patients seek orthodontic treatment is to improve their facial appearance.1–9 In the orthodontic literature, the perception of ideal facial esthetics, mainly identified with the patient's profile, and the employment of either one of the two main treatment approaches (extraction or nonextraction) have been highly controversial issues.10–26
The controversy becomes even greater when dealing with borderline cases. Numerous investigations have been conducted on postreatment soft tissue changes, especially in Class II malocclusions. The impact of orthodontic treatment on the facial esthetics of Class I malocclusions has been traditionally given little attention. Seldom do the inclusion criteria of previous studies secure that all cases are equally susceptible to either treatment technique (extraction or nonextraction) at the outset of treatment; hence, differences detected at the end could be attributed reliably to treatment itself. As has been shown,27,28 susceptibility biases can be successfully overcome through the use of a discriminant analysis.
MATERIALS AND METHODS
Sample Collection
The purpose of this study was to obtain, through the use of a discriminant analysis, a relatively bias-free sample of extraction and nonextraction Class I equally susceptible to both treatments and to analyze retrospectively the soft tissue changes between the two different treatment groups. The only records used were those from the active retention files of the Saint Louis University Graduate Orthodontic Clinic.
The parent sample consisted of 215 patients. Of them, 149 were treated without extractions and 66 with four first premolar extractions. All patients were White males or females with a full complement of teeth exhibiting Class I dental and skeletal malocclusion. The treatment they received did not include the use of a functional appliance or any orthognathic surgical procedure.
Data Collection: Sample Reduction
Pretreatment and posttreatment cephalograms, with teeth occluding in centric occlusion and lips relaxed, were gathered from the retention files of the parent sample.
A stepwise discriminant analysis was then employed to identify the subsample of patients who could have been treated with either treatment approach (borderline cases). The extensive series of 27 cephalometric and six model measurements, along with the variables of age and gender, fueled the discriminant analysis, thus attempting to obtain a complete representation of all the dental, skeletal, soft tissue, and demographic elements that might have influenced the clinician in the treatment decision (Table 1).
Table 1.
Cephalometric Analysis Measurements: Model Measurements and Demographic Variables

A standardized discriminate score (Dz) was calculated for each of the 215 patients. The univariate representation of the discriminant Z scores is shown in Figure 1. The group centroids, which represent the mean of the discriminate scores, were calculated for each group. The optimal cutting score was obtained using the formula for critical cutting score value for unequal group sizes.29 The 30 extraction and 32 nonextraction patients whose score fell closest to the critical cutting score were identified as the borderline subsample. The histogram in Figure 2 shows the distribution of the discriminant scores for the borderline subsample.
Figure 1.
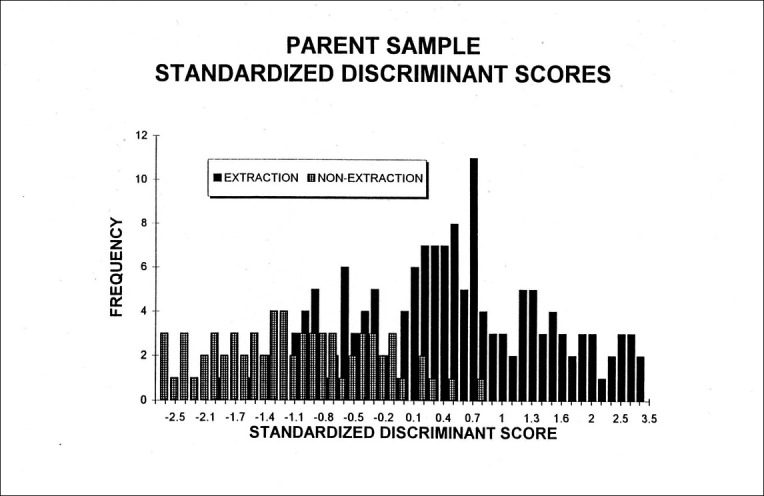
Parent sample: standardized discriminant scores.
Figure 2.
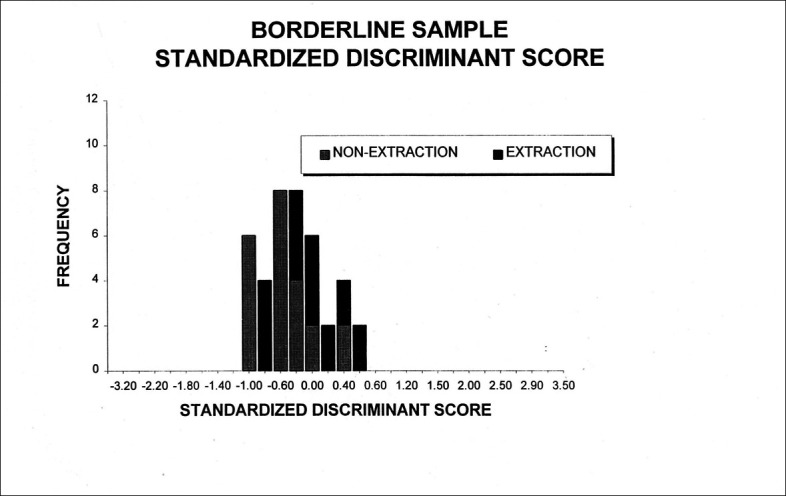
Borderline sample: standardized discriminant scores.
Analyzing the data gathered from the parent sample, the discriminant function incorporated three significant (P < .01) discriminating variables, which in descending order of importance (based on the magnitude of their standardized coefficients), were lower tooth-arch discrepancy, lower lip to E-plane, and the FMIA angle. To assess soft tissue changes, the measurements shown in Table 2 and Figures 3, 4, and 5 were used.
Table 2.
Soft Tissue Analysis

Figure 3.
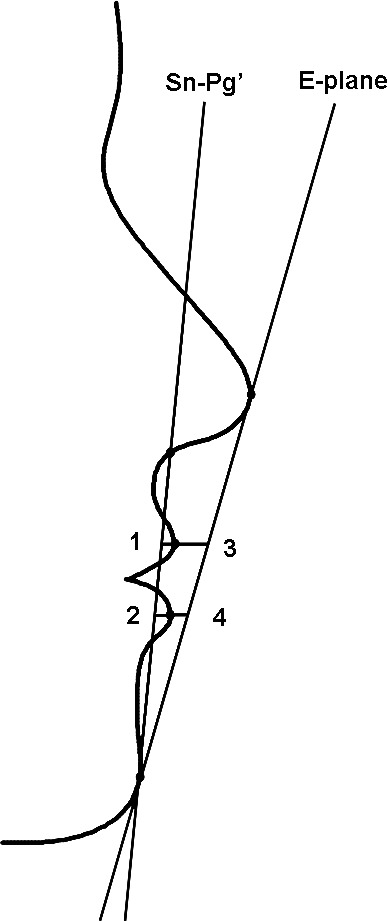
(1) Upper lip to Sn-Pg′ line. (2) Lower lip to Sn-Pg′ line. (3) Upper lip to E-plane. (4) Lower lip to E-plane.
Figure 4.
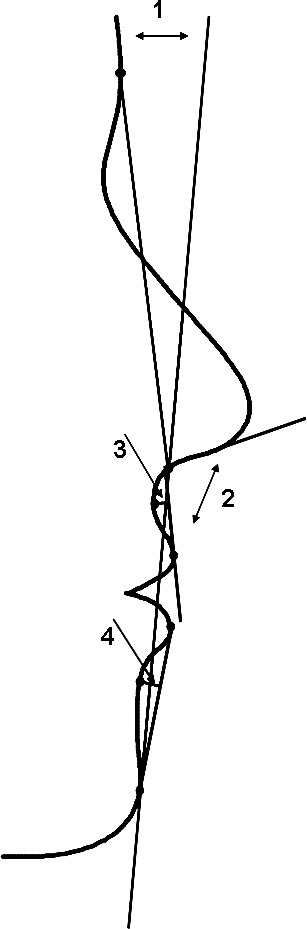
(1) Angle of facial convexity (G-Sn-Pg′). (2) Nasiolabial angle. (3) Maxillary sulcus depth (Max. Sulcus - Sn-Ls). (4) Mandibular sulcus depth (Mand. Sulcus - Li-Pg′).
Figure 5.
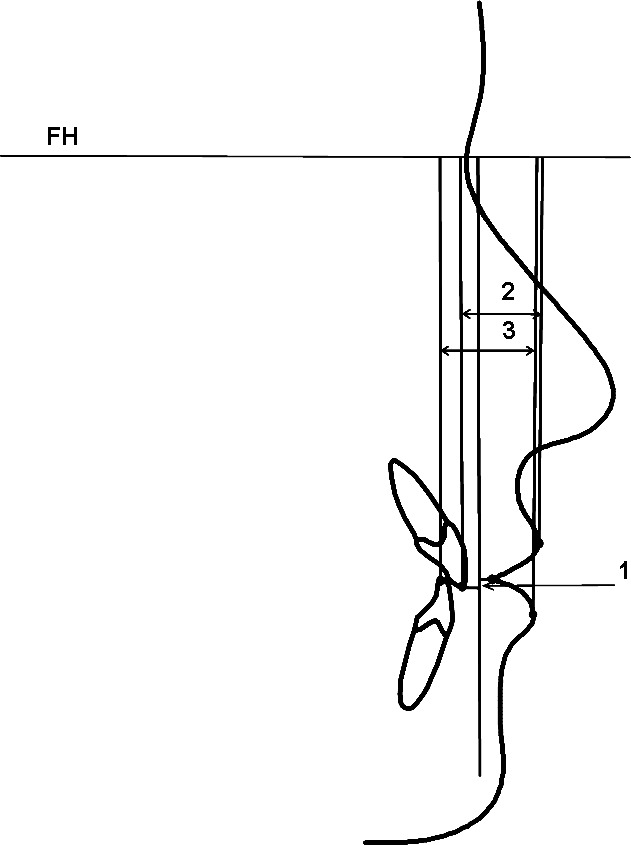
(1) Upper incisor exposure (Is-Stm). (2) Upper lip thickness (Is-Ls). (3) Lower lip thickness (Ii-Li).
Error of the Cephalometric Method
With the aid of a table of random numbers, 12 cephalograms were selected and analyzed a second time. The error standard deviation of the double determinations for each cephalometric measurement was then assessed using Dahlberg's formula: √(Σd)2/2N, where d = the difference between two successive measurements and N = 11 for the 11 cephalometric, computer-generated measurements.
Statistical Analysis
Means and standard deviations of the 11 variables previously described were calculated for both groups before and after treatment. The means and standard deviations for the differences that each treatment group experienced from pretreatment to posttreatment were also calculated. Independent-sample t-tests were performed to test the significance of the differences between the change values of the two different treatment groups. Paired t-tests were performed to test the null hypothesis that no differences exist within the same treatment group between the onset and the end of treatment in the cephalometric measurements. The levels of significance tested were P < .05 and P < .01.
RESULTS
Borderline Sample: Soft Tissue Changes
Average tracings for the extraction and the nonextraction groups at the start and at the end of treatment are shown in Figures 6 and 7. The results of descriptive and inferential statistics, calculated for all the cephalometric soft tissue measurements, are listed in Tables 3, 4, and 5.
Figure 6.
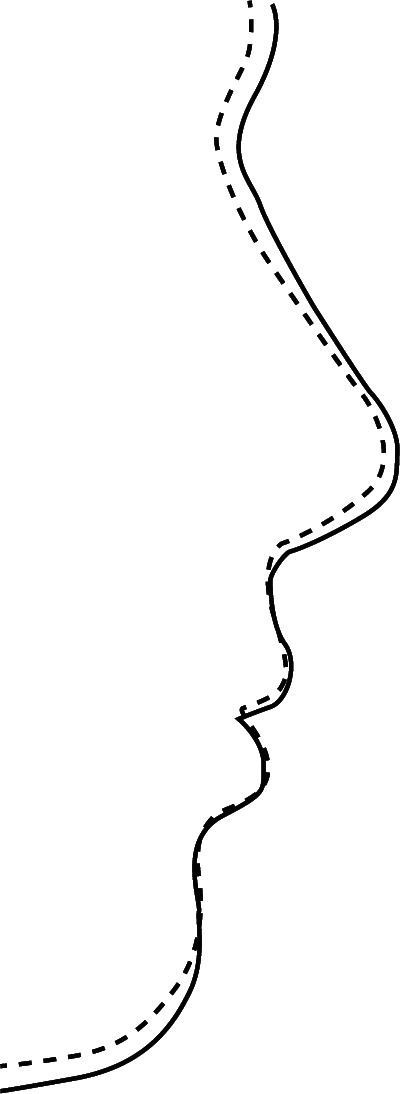
Average tracings at the start of treatment. Dashed line: extraction. Solid line: nonextraction.
Figure 7.
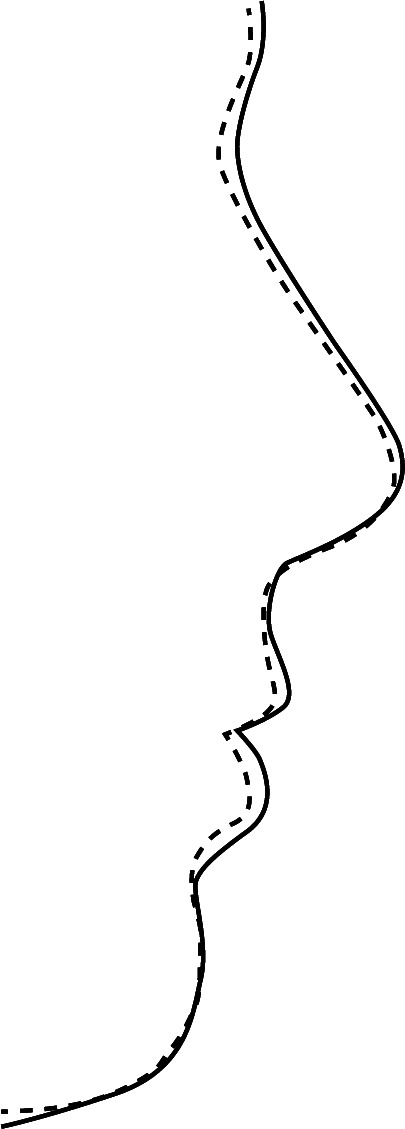
Average tracings at the end of treatment. Dashed line: extraction. Solid line: nonextraction.
Table 3.
Borderline Extraction Sample: Descriptive and Inferential Statistics of the Soft Tissue Analysis Results

Table 4.
Borderline Nonextraction Sample: Descriptive and Inferential Statistics of the Soft Tissue Analysis Results

Table 5.
Extraction vs Nonextraction: Descriptive and Inferential Statistics of Mean Value Differences: Soft Tissue Analysis Posttreatment Results

The error standard deviations for the double determinations for each of the 11 cephalometric measurements are listed in Table 6. The measurement errors are comparable to those reported in the literature14,16,30,31 and should not therefore interfere with the interpretation of the results.
Table 6.
Error Standard Deviations for Double Determinations (N = 11)

Intergroup Postreatment Differences
The mean change values for the upper lip to E-plane were −2.75 mm for the extraction and −0.68 mm for the nonextraction group. The lower lip was retracted −3.34 mm relative to the E-plane in the extraction group and brought forward 0.67 mm in the nonextraction group. In relation to Burstone's Sn-Pg′ line, the upper lip was retracted −1.82 mm in the extraction and −0.17 mm in the nonextraction group, whereas the lower lip was retracted −2.55 mm and brought forward 1.01 mm, respectively.
From the measurements estimating lip thickness and sulcus depth, only the mean value change for upper lip thickness proved to be statistically significant (P < .05), exhibiting an increase of 2.17 mm in the extraction vs 0.55 mm in the nonextraction group.
The nasiolabial angle had a statistically significant (P < .05) increase of 5.34° within the extraction group and a decrease of −0.24° within the nonextraction group. Table 5 shows the results of the two sample t-tests that were run to evaluate differences in the mean value changes between the two different treatment groups.
Intragroup Differences for the Extraction Sample
All parameters estimating upper and lower lip protrusion relative to the E-plane and the Sn-Pg′ line indicate a retraction of both lips, which was statistically significant (P < .01). At the beginning of the treatment, the upper and lower lips were −2.58 and 0.61 mm behind and in front of the E-plane, respectively. At the end, both lips were found to be −5.33 and −2.73 mm behind the E-plane. The upper and lower lip protrusion relative to the Sn-Pg′ line decreased from 4.32 and 4.58 to 2.50 and 2.02 mm, respectively.
The upper lip thickness increased significantly from 13.22 to 15.39 mm at the end of treatment (P < .01). The maxillary sulcus depth increased also significantly from 1.82 to 2.24 mm (P < .05). The nasiolabial angle became more obtuse, thus exhibiting a statistically significant increase from 109.57° to 114.94° (P < .05).
It is interesting to note that in the extraction group, the amount of incisor display did not change significantly. The paired t-test results for the extraction sample can be found in Table 3.
Intragroup Differences for the Nonextraction Sample
In the nonextraction group, the upper lip to E-plane measurement indicated a significant retraction (P < .05) from −3.66 mm at the onset to −4.34 mm at the end of treatment. Regarding the rest of the parameters, there were minimal, nonsignificant changes. The results of the paired t-tests for the nonextraction group are shown in Table 4.
DISCUSSION
Discriminant Analysis: Borderline Patient
The discriminant function incorporated three variables that were unique in their ability to discriminate between the two different treatment approaches. The first variable that entered the function was the lower tooth-arch discrepancy. Indeed, most clinicians base a large part of their treatment decision on the amount of crowding the patient exhibits. The second variable of lower lip to E-plane indicates the clinicians' concern about facial esthetics and specifically soft tissue profile. The variable of the angle formed by the lower incisor long axis and Frankfort Horizontal (FMIA) was the third and last variable that entered the function. As known, the discriminant analysis functions in accordance to the data fueled. Subsequently, the angle that indicates the orientation of the lower incisor to the face is regarded as a very important parameter in the orthodontist's treatment-planning process.16,27,32
In the parent sample, 66 of 215 cases were treated with removal of the four first premolars. The extraction rate in treating these Class I malocclusions reached 30.6%. Similar study results reported by O'Conner33 on 814 US orthodontists indicated that the percentage of cases treated by extraction has decreased from 37.74% to 29.28%. Studies from previous decades that used similar samples reported a significantly higher extraction rate. Paquette et al.27 examined a sample that was treated in the 1970s and found an extraction rate of 55%.
The statistical analysis showed that there were significant differences between the two treatment groups in the parent sample but not in the borderline sample. Considering the variable of tooth-arch discrepancy, which accounted more for its discriminating power, one can then see (Table 7) that the mean value for the extraction group of the parent sample was −6.3 mm, while for the nonextraction sample, it was −1.6 mm. The mean value of the same variable for the extraction group of the subsample was −3.78 mm, while for the nonextraction sample, it was −3.20 mm. Similar comparisons can be made between the mean values of the other two discriminating variables of lower lip to E-plane and FMIA (Table 7). Therefore, it becomes apparent that differences existing at the onset of treatment capable of distorting the prognostic expectations were minimized in this study.
Table 7.
Descriptive Statistics for Discriminating Variables in the Parent and in the Borderline Sample

Treating a malocclusion by means of comprehensive orthodontics results in significant soft tissue changes13,15,17,34–38 To better analyze the response of the present sample to orthodontic treatment, the various parts of the soft tissue profile will be examined separately. The comparisons made with other studies should be regarded with proper skepticism since none of these dealt with Class I borderline malocclusions.
Upper Lip
Considering Ricketts E-plane, the upper lip exhibited a −2.75-mm retraction in the extraction group vs a −0.68-mm retraction in the nonextraction group. The results indicate a significant yet smaller retraction than that reported by Finnöy et al.,36 Drobocky and Smith,13 Battagel,31 and Bravo.15 Finnöy et al.36 reported a −3.1-mm retraction in the nonextraction group but attributed it to the continuous growth of the nose. Young and Smith14 and Kocadereli38 found that the upper lip was retracted −1.64 and −0.4 mm, respectively. Paquette,27 using the same research methods for Class II patients, reported a slightly larger upper lip retraction of −3.1 mm in the extraction group and −0.5 mm in the nonextraction group. This could possibly be attributed to the greater need for overjet reduction in his sample.
Relative to the Sn-Pg′ line, the difference between the two groups was significant. Since this plane is considered a plane of minimal variation,7 all relative measurements are less influenced by any potential growth remainders. Subsequently, soft tissue changes assessed relative to the E-plane can be confirmed. The change value for the extraction group (−1.82 mm) is slightly smaller than that reported by Drobocky and Smith13 and Bravo15: −2.12 mm and −2.4 mm, respectively. The amount of upper lip retraction is smaller than that assessed to the E-plane. A possible explanation is that slight growth of the nose might have contributed to the whole retropositioning of the lip. The nonextraction patients exhibited a nonsignificant change of −0.17 mm, similar to Kocadareli's −0.05 mm, whereas their counterparts in the study by Young and Smith14 exhibited −0.63 mm of retraction.
With regard to upper lip thickness, the difference in increase between the two groups was also significant: 2.17 mm for the extraction and 0.55 mm for the nonextraction group. The results of this study compare to Talass et al.,37 who reported a significant, yet larger, value of increase for the extraction group: 3.702 mm.
Lower Lip
The mean value changes for the lower lip differed significantly between the two groups and were greater than those of the upper lip. In relation to the Ricketts E-plane, the −3.34 mm of retraction that the extraction patients exhibited is close to the −3.8 and −3.22 mm that Bravo15 and Drobocky and Smith13 reported, respectively. Battagel31 and Xu et al.39 found relatively smaller values of retraction: −2.5, −2.39, and −2.4 mm, respectively. The results of this study revealed that the lower lip of the nonextraction patients was brought forward 0.67 mm. In contrast to this finding, Finnöy et al.,36 Battagel,31 and Xu et al.39 reported negative values, which indicate retraction of the lip: −2.2, −1.44, and −0.4 mm, respectively.
The measurements to Burstone's Sn-Pg′ line confirmed the previous findings. For the patients treated without extractions, the findings indicate that the lower lip was protracted 1.01 mm, thus contradicting Young's findings of −0.58 mm of retraction and Xu's and Kocadareli's 0.02 and 0.05 mm, respectively.
Nasiolabial Angle
The nasiolabial angle became 5.34° more obtuse in the extraction group. The mean change value for the nonextraction group was −0.24°. Eighteen of the patients (56%) had a more acute angle at the end of treatment, which ranged from −0.3° to −18.6°, while 14 of their counterparts (44%) finished treatment with a more obtuse angle, which ranged from 0.8° to 16.20°.
CONCLUSIONS
The average tracings indicated that the main differences between the two groups at the end of treatment were localized to the perioral area. The extraction group terminated treatment with more retracted lips, a more obtuse nasolabial angle, and a thicker upper lip.
The nonextraction group also showed significant upper lip retraction but lower lip protraction.
The variables possessing the unique discriminating power between extraction and nonextraction treatment were measurements of the lower crowding, the lower lip to E-plane, and the FMIA angle.
REFERENCES
- 1.Marvin C. A. Regulating teeth. Dental Times. 1866;4:97–100, 105–108, 156–160. [Google Scholar]
- 2.Peck H, Peck S. A concept of facial esthetics. Angle Orthod. 1970;40:284–315. doi: 10.1043/0003-3219(1970)040<0284:ACOFE>2.0.CO;2. [DOI] [PubMed] [Google Scholar]
- 3.Riedel R. A. Esthetics and its relation to orthodontic therapy. Angle Orthod. 1950;20:168–178. doi: 10.1043/0003-3219(1950)020<0168:EAIRTO>2.0.CO;2. [DOI] [PubMed] [Google Scholar]
- 4.Burstone C. J. The integumental profile. Am J Orthod. 1958;44:1–25. [Google Scholar]
- 5.Holdaway R. A. A soft tissue cephalometric analysis and its use in orthodontic treatment planning. Part I. Am J Orthod. 1983;84:1–28. doi: 10.1016/0002-9416(83)90144-6. [DOI] [PubMed] [Google Scholar]
- 6.Ricketts R. M. Planning treatment on the basis of the facial pattern and an estimate of its growth. Angle Orthod. 1957;27:14–37. [Google Scholar]
- 7.Burstone C. J. Lip posture and its significance in treatment planning. Am J Orthod. 1967;53:262–284. doi: 10.1016/0002-9416(67)90022-x. [DOI] [PubMed] [Google Scholar]
- 8.Ricketts R. M. The biologic significance of the divine proportion and Fibonacci series. Am J Orthod. 1982;81:351–370. doi: 10.1016/0002-9416(82)90073-2. [DOI] [PubMed] [Google Scholar]
- 9.Holdaway R. A. A soft tissue cephalometric analysis and its use in orthodontic treatment planning, Part II. Am J Orthod. 1984;85:279–293. doi: 10.1016/0002-9416(84)90185-4. [DOI] [PubMed] [Google Scholar]
- 10.Angle E. H. Treatment of Malocclusion of the Teeth 7th ed. Philadelphia, PA: SS White Manufacturing Co; 1907. [Google Scholar]
- 11.Grieve G. W. Manifest evidence of the cause of relapse in many treated cases of malocclusion. Int J Orthod Oral Surg. 1937;23:23–24. [Google Scholar]
- 12.Tweed C. H. A philosophy for orthodontic treatment. Am J Orthod Oral Surg. 1945;31:74–103. [Google Scholar]
- 13.Drobocky O. B, Smith R. J. Changes in facial profile during orthodontic treatment with extraction of four first premolars. Am J Orthod Dentofacial Orthop. 1989;95:220–230. doi: 10.1016/0889-5406(89)90052-8. [DOI] [PubMed] [Google Scholar]
- 14.Young T. M, Smith R. J. Effects of orthodontics on the facial profile: a comparison of changes during nonextraction and four premolar extraction treatment. Am J Orthod Dentofacial Orthop. 1993;103:452–458. doi: 10.1016/S0889-5406(05)81796-2. [DOI] [PubMed] [Google Scholar]
- 15.Bravo L. A. Soft tissue profile changes after orthodontic treatment with four premolars extracted. Angle Orthod. 1993;64:31–42. doi: 10.1043/0003-3219(1994)064<0031:STFPCA>2.0.CO;2. [DOI] [PubMed] [Google Scholar]
- 16.Luppanapornlarp S, Johnston L. E., Jr The effects of premolar-extraction: a long-term comparison of outcomes in “clear-cut” extraction and non extraction Class II patients. Angle Orthod. 1993;63:257–272. doi: 10.1043/0003-3219(1993)063<0257:TEOPAL>2.0.CO;2. [DOI] [PubMed] [Google Scholar]
- 17.Bishara S. E, Cummins D. M, Jorgensen G. J, Jakobsen J. R. A computer assisted photogrammetric analysis of soft tissue changes after orthodontic treatment. Part I: methodology and reliability. Am J Orthod Dentofacial Orthop. 1995;107:633–639. doi: 10.1016/s0889-5406(95)70107-9. [DOI] [PubMed] [Google Scholar]
- 18.Cummins D. M, Bishara S. E, Jakobsen G. J. A computer assisted photometric analysis of soft tissue changes after orthodontic treatment. Part II: results. Am J Orthod Dentofacial Orthop. 1995;108:138–147. doi: 10.1016/s0889-5406(95)70064-1. [DOI] [PubMed] [Google Scholar]
- 19.Scott S. H, Johnston L. E., Jr The perceived impact of extraction and nonextraction treatments on matched samples of African American patients. Am J Orthod Dentofacial Orthop. 1999;116:352–360. doi: 10.1016/s0889-5406(99)70249-0. [DOI] [PubMed] [Google Scholar]
- 20.Wholley C. J, Woods M. G. The effects of commonly prescribed premolar extraction sequences on the curvature of the upper and lower lips. Angle Orthod. 2003;73:386–395. doi: 10.1043/0003-3219(2003)073<0386:TEOCPP>2.0.CO;2. [DOI] [PubMed] [Google Scholar]
- 21.Moseling K. P, Woods M. G. Lip curve changes in females with premolar extraction or nonextraction treatment. Angle Orthod. 2004;74:51–62. doi: 10.1043/0003-3219(2004)074<0051:LCCIFW>2.0.CO;2. [DOI] [PubMed] [Google Scholar]
- 22.Erdinc A. E, Nanda R. S, Dandajena T. C. Profile changes of patients treated with and without premolar extractions. Am J Orthod Dentofacial Orthop. 2007;132:324–331. doi: 10.1016/j.ajodo.2005.08.045. [DOI] [PubMed] [Google Scholar]
- 23.Bills D. A, Handelman C. S, BeGole E. A. Bimaxillary dentoalveolar protrusion: traits and orthodontic correction. Angle Orthod. 2005;75:333–339. doi: 10.1043/0003-3219(2005)75[333:BDPTAO]2.0.CO;2. [DOI] [PubMed] [Google Scholar]
- 24.Lim H. J, Ko K. T, Hwang H. S. Esthetic impact of premolar extraction and nonextraction treatments on Korean borderline patients. Am J Orthod Dentofacial Orthop. 2008;133:524–531. doi: 10.1016/j.ajodo.2006.04.051. [DOI] [PubMed] [Google Scholar]
- 25.Xu T. M, Liu Y, Yang M. Z, Huang W. Comparison of extraction versus nonextraction orthodontic treatment outcomes for borderline Chinese patients. Am J Orthod Dentofacial Orthop. 2006;129:672–677. doi: 10.1016/j.ajodo.2005.12.007. [DOI] [PubMed] [Google Scholar]
- 26.Janson G, Fuziy A, de Freitas M. R, Castanha Henriques J. F, de Almeida R. R. Soft-tissue treatment changes in Class II division 1 malocclusion with and without extraction of maxillary premolar. Am J Orthod Dentofacial Orthop. 2007;132:729.e1–e8. doi: 10.1016/j.ajodo.2007.05.012. [DOI] [PubMed] [Google Scholar]
- 27.Paquette D. E, Beattie J. R, Johnston L. E., Jr A long-term comparison of non extraction and premolar extraction edgewise therapy in “borderline” Class II patients. Am J Orthod Dentofacial Orthop. 1992;102:1–14. doi: 10.1016/0889-5406(92)70009-Y. [DOI] [PubMed] [Google Scholar]
- 28.Livieratos F. A, Johnston L. E., Jr A comparison of one-stage and two-stage nonextraction alternatives in matched Class II samples. Am J Orthod Dentofacial Orthop. 1995;108:118–131. doi: 10.1016/s0889-5406(95)70074-9. [DOI] [PubMed] [Google Scholar]
- 29.Hair J. F, Jr, Anderson R. E, Tatham R. L, Black W. C. Multivariate Data Analysis With Readings. NewYork, NY: Macmillan; 1992. [Google Scholar]
- 30.Looi L. K, Mills J. R. E. The effect of two contrasting forms of orthodontic treatment on facial profile. Am J Orthod. 1986;89:507–517. doi: 10.1016/0002-9416(86)90009-6. [DOI] [PubMed] [Google Scholar]
- 31.Battagel J. M. The relationship between hard and soft tissue changes following treatment of Class II division I malocclusions using Edgewise and Fränkel appliance techniques. Eur J Orthod. 1990;12:154–165. doi: 10.1093/ejo/12.2.154. [DOI] [PubMed] [Google Scholar]
- 32.Beattie J. R, Paquette D. E, Johnston L. E., Jr The functional impact of extraction and nonextraction treatments: a long-term comparison in patients with “borderline,” equally susceptible Class II malocclusions. Am J Orthod Dentofacial Orthop. 1994;105:444–449. doi: 10.1016/S0889-5406(94)70004-4. [DOI] [PubMed] [Google Scholar]
- 33.O'Connor B. M. Contemporary trends in orthodontic practice: a national survey. Am J Orthod Dentofacial Orthop. 1993;103:163–170. doi: 10.1016/S0889-5406(05)81766-4. [DOI] [PubMed] [Google Scholar]
- 34.Stoner M. M, Lindquist J. T. A cephalometric evaluation of fifty-seven consecutive cases treated by Charles H. Tweed. Angle Orthod. 1956;26:68–98. [Google Scholar]
- 35.Bloom L. A. The perioral profile changes in orthodontic treatment. Am J Orthod. 1961;47:279–288. [Google Scholar]
- 36.Finnöy J. P, Wisth P. J, Boe O. E. Changes in soft tissue profile during and after orthodontic treatment. Eur J Orthod. 1987;9:68–78. doi: 10.1093/ejo/9.1.68. [DOI] [PubMed] [Google Scholar]
- 37.Tallas M. F, Talass L, Baker R. C. Soft tissue profile changes resulting from retraction of maxillary incisors. Am J Orthod Dentofacial Orthop. 1987;91:385–394. doi: 10.1016/0889-5406(87)90391-x. [DOI] [PubMed] [Google Scholar]
- 38.Kocadereli I. Changes in soft tissue profile after orthodontic treatment with and without extractions. Am J Orthod Dentofacial Orthop. 2002;122:67–72. doi: 10.1067/mod.2002.125235. [DOI] [PubMed] [Google Scholar]
- 39.Xu T. M, Liu Y, Yang M. Z, Huang W. Comparison of extraction versus nonextraction orthodontic treatment outcomes for borderline Chinese patients. Am J Orthod Dentofacial Orthop. 2006;129:672–677. doi: 10.1016/j.ajodo.2005.12.007. [DOI] [PubMed] [Google Scholar]