Abstract
Purpose.
To investigate image intensity histograms as a potential source of useful imaging biomarkers in both a clinical example of detecting immune-related colitis (irColitis) in 18F-FDG PET/CT images of immunotherapy patients and an idealized case of classifying digital reference objects (DRO).
Methods.
Retrospective analysis of bowel 18F-FDG uptake in N = 40 patients receiving immune checkpoint inhibitors was conducted. A CNN trained to segment the bowel was used to generate the histogram of bowel 18F-FDG uptake, and percentiles of the histogram were considered as potential metrics for detecting inflammation associated with irColitis. A model of the colon was also considered using cylindrical DRO. Classification of DRO with different intensity distributions was undertaken under varying geometry and noise settings.
Results.
The most predictive biomarker of irColitis was the 95th percentile of the bowel SUV histogram (SUV95%). Patients later diagnosed with irColitis had a significantly higher increase in SUV95% from baseline to first on-treatment PET than patients who did not experience irColitis (p = 0.02). An increase in SUV95%> + 40% separated pre-irColitis change from normal variability with a sensitivity of 75% and specificity of 88%. Furthermore, histogram percentiles were ideal metrics for classifying ‘hot center’ and ‘cold center’ DRO, and were robust to varying DRO geometry and noise, and to the presence of spoiler volumes unrelated to the detection task.
Conclusions.
The 95th percentile of the bowel SUV histogram was the optimal metric for detecting irColitis on 18F-FDG PET/CT. Image intensity histograms are a promising source of imaging biomarkers for clinical tasks.
Keywords: 18F-FDG PET/CT, immunotherapy, adverse event, segmentation
Background
Recently, many classes to imaging features have been considered as possible predictors of clinical outcome. The practice of extracting hundreds or thousands of image features as potential predictive biomarkers has become known as radiomics (Aerts et al 2014, Gillies et al 2016). Many radiomics feature types have been explored and have successfully been demonstrated to be prognostic of clinical outcome for a wide variety of imaging modalities, disease settings, and treatment types (Nie et al 2016, Sun et al 2018, Wang et al 2018, Crombé et al 2019, Mu et al 2019). For clinical translation, it is critical that developed biomarkers be robust and reproducible so that they generalize well to different imaging hardware and acquisition protocols. Furthermore, biomarkers should be interpretable to clinical end users to gain their trust. Thus, it is imperative that the reproducibility, robustness, and interpretability of new biomarkers be characterized.
Immune-related colitis (irColitis) is a serious side effect of cancer treatment using immune checkpoint inhibitors (ICI) that can force ICI treatment stoppage at even moderate grades (Puzanov et al 2017). Incidence of high-grade irColitis requiring hospitalization of 8%−14% has been reported for patients receiving combination anti-PD1 and anti-CTLA4 ICI (Larkin et al 2015). Delay in diagnosis and treatment of high-grade irColitis increases the chance of significant complications such as ileus, colonic distension, toxic megacolon, bowel perforation requiring surgical intervention and colectomy, or even death (Beck et al 2006, Puzanov et al 2017). Therefore, early detection of irColitis is critical to expedite appropriate intervention, prevent further progression, and avoid unintended complications (Sosa et al 2018). Disease status and treatment response to ICI are monitored with whole-body 18F-fluorodeoxyglucose positron emission tomography/computed tomography (18F-FDG PET/CT), which is also sensitive to inflammation which is the pathogenesis of immune-related side effects of ICI such as irColitis (Iravani and Hicks 2020).
Correlation between qualitative assessment of 18F-FDG bowel uptake and patient experience of diarrhea while receiving anti-CTLA4 ICI has been reported (Lang et al 2019), but no quantitative imaging biomarker of irColitis has been established. Identifying a quantitative imaging biomarker of irColitis is difficult due to the varied appearance irColitis-related inflammation on 18F-FDG PET and the complex abdominal anatomy around the colon. Depending on the extent of involvement, elevated 18F-FDG uptake associated with colitis may take a focal or diffuse appearance (Cho et al 2020). Additionally, high 18F-FDG uptake in the kidneys, ureter, and bladder can confound automated analysis of 18F-FDG uptake in the colon.
In this work, we investigate percentiles of the image intensity histogram as robust and interpretable biomarkers for detecting irColitis on 18F-FDG PET/CT. Percentile-based metrics are commonly utilized in radiotherapy (RT) treatment planning, where Dose-Volume Histogram (DVH) metrics are used to describe the percentage of a given volume that will receive a given radiation dose (Drzymala et al 1991). Histogram percentile-based metrics have been used to predict pulmonary toxicity following RT for lung cancer (Rodrigues et al 2004), and have been used in non-RT applications as well, including quantifying tumor heterogeneity (O’Connor et al 2015) and predicting malignant transformation of glioma on brain MRI (Tofts et al 2007).
In the specific context of 18F-FDG PET/CT, the maximum standardized uptake value (SUVmax) has been used as an imaging biomarker (Nakamura et al 2010, Horne et al 2014, Chen et al 2019). However, SUVmax is determined by uptake in a single image voxel within the ROI, and so is susceptible to noise and ROI mis-segmentation. Some early work has been done to propose histogram percentiles as a more robust alternative to SUVmax for characterizing PET tracer accumulation. In (Baiocco et al 2019), the 95th percentile of the SUV values from within the kidney is demonstrated to be a more reliable indicator of elevated renal uptake than SUVmax on 68Ga-PSMA PET. The goal of this paper is to investigate percentiles of the SUV histogram as a robust, interpretable, and optimizable alternative to standard SUV metrics such as SUVmax for detecting irColitis in both an idealized model using digital reference objects (DRO) and in clinical 18F-FDG PET/CT data.
Methods and materials
Histogram metrics
As theoretical support for our work identifying irColitis, we first conducted a series of studies of histogram percentiles using an idealized model of the colon with cylindrical digital reference objects (DRO). Consider the histogram of image intensity values within an ROI H(x). We define the set of histogram percentiles PY% as the image intensity value of the Yth percentile of H(x), where Y can vary between 0 and 100 (equation (1)). The normalization condition for the histogram is defined by equation (2).
| (1) |
| (2) |
The histogram H(x) describes the percentage of ROI volume exceeding a certain intensity x. For example, consider an ROI drawn on a CT image. If the 90th percentile of the histogram (P90%) is 200 HU, this means 10% of the ROI volume has a density greater than 200 HU. A visual description of the calculation of PY% metrics is shown in figure 1.
Figure 1.

Visual description of calculating percentile metrics. (a) The raw image intensity histogram H(x) is constructed by masking the image with the ROI mask. (b) The cumulative density function (cdf) of this histogram is computed and normalized in accordance with equation (2). (c) Percentile metrics PY% can be inferred easily from the final cumulative histogram. As an example, we show how P80% can be read from this plot.
For a given task, the optimal percentile Popt% can be determined by evaluating the performance of all percentiles and choosing the percentile that maximizes (or minimizes) a given performance metric. For this study, we define Popt% to be the percentile which maximizes area under the receiver operating characteristic curve (AUROC):
| (3) |
Digital reference object study
To understand how specific imaging features affect histogram percentile values, we consider the problem of classifying cylindrical DRO as a simplified model of the colon. We consider three experiments of classifying ‘background’ DRO with radius R, height Z, and intensity I0 versus DRO with added features (‘hot center’ and ‘cold center’). We also consider the case of a ‘spoiler’ volume being added to both ‘background’ and ‘hot center’ cylinders to demonstrate the effect of an imaging feature unrelated to the classification task on percentile values, and to demonstrate how percentile-based classification can overcome the presence of a spoiler. The cylinder geometry is described in figure 2.
Figure 2.
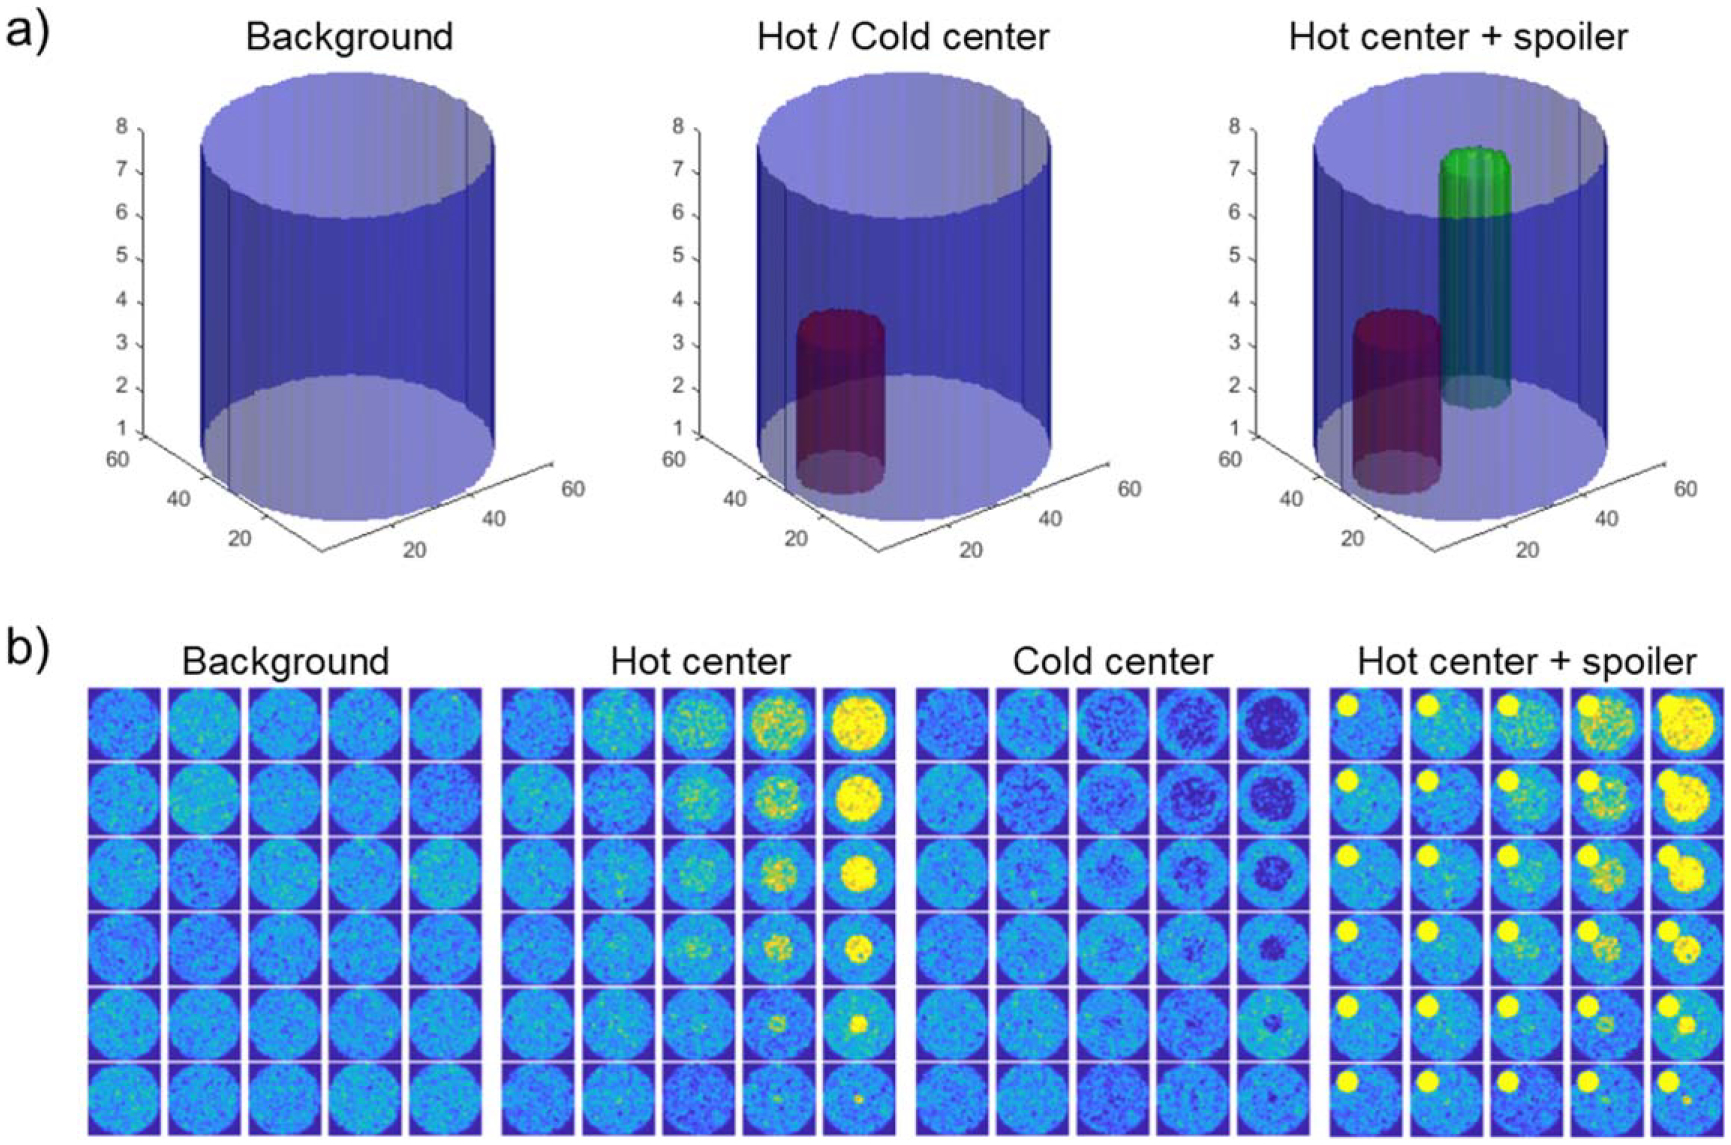
(a) Geometry of cylindrical digital reference objects (DRO). A blue ‘background’ cylinder has radius R, height Z, and intensity I0. Adding a red cylinder with radius r, height z, and intensity I is done to create either ‘hot center’ (if I > I0) or ‘cold center’ (if I < I0) DRO. Adding a green spoiler cylinder with radius rs, height zs, and intensity Is to simulate the impact of an image feature unrelated to the classification task. (b) DRO axial slices. Radius of added ‘hot center’ or ‘cold center’ increases bottom to top, contrast between added cylinder and background increases from left to right.
For each experiment, we generate N replicate DRO of each class, calculate the set of histogram percentiles PZ% for each DRO, and evaluate each percentile as a predictor of cylinder class. The histogram is generated from the ROI of the large background cylinder. Classification performance is evaluated with area under the receiver-operating characteristic curve (AUROC).
‘Background’ versus ‘hot center’
First, we consider the task of classifying ‘background’ DRO versus ‘hot center’ DRO. ‘Hot center’ DRO are identical to ‘background’ DRO with the addition of a smaller added ‘hot center’ cylindrical volume of height z, radius r and intensity I. Cylinder intensity values are additive, so the mean intensity within the added cylinder is I0 + I. Noise in the ‘background’ and ‘hot center’ cylinders is produced by sampling values from a normal distribution with standard deviations and , respectively.
We hypothesize that percentiles at and above the volume fraction of the added ‘hot center’ cylinder VFHC will successfully classify ‘background’ versus ‘hot center’. For the ‘hot center’ case, this will be the highest percentiles of the ROI. We define the saturation percentile corresponding to this volume fraction Ysat,HC%:
| (4) |
Where the ‘hot center’ cylinder has radius r and height z, and the background’ cylinder has radius R and height Z. We simulate sets of N ‘background’ DRO and N ‘hot center’ DRO for various ‘hot center’ cylinder sizes and contrasts and observe classification performance as a function of histogram percentile.
‘Background’ versus ‘cold center’
Next, we consider the case of detecting a volume with intensity lower than background (a ‘cold center’). ‘Cold center’ DRO are identical to ‘background’ DRO with the addition of a smaller added ‘cold center’ cylinder of radius r and intensity I. Mean intensity within the added cylinder is I0—I. Noise in the ‘background’ and ‘cold center’ cylinders is produced by sampling values from a normal distribution with standard deviations and , respectively.
Similar to the ‘hot center’ case, we hypothesize that classification performance will saturate for percentiles which correspond to the volume fraction of the added cylinder VFCC. For ‘cold center’ cylinders, this will be the lowest percentiles of the ROI. So, classification performance will be highest for percentiles below Ysat,CC%:
| (5) |
Where the ‘cold center’ cylinder has radius r and height z, and the background’ cylinder has radius R and height Z. We simulate sets of N ‘background’ DRO and N ‘cold center’ DRO for various ‘cold center’ cylinder sizes and contrasts and observe classification performance as a function of histogram percentile.
Spoiler subvolumes
To explore the impact of image features that are unrelated to the classification task on histogram percentiles, we consider the case of adding ‘spoiler’ subvolumes to the reference objects. In this experiment, ‘spoiler’ subvolumes were added to both ‘background’ and ‘hot center’ DRO. ‘Spoiler’ cylinders have radius rs, height zs, and intensity Is.
We hypothesize that classification performance will increase with percentile and saturate at percentiles that correspond to the volume fraction of the ‘hot center’ cylinder, but then drop above percentiles which correspond to the volume fraction of the ‘spoiler’ volume, since both classes of cylinder will contain a ‘spoiler’. Thus, we define a minimum (Ymin,SP%) and maximum (Ymax,SP%) percentile for saturated classification performance:
| (6) |
| (7) |
Where the ‘hot center’ cylinder has radius r and height z, the ‘background’ cylinder has radius R and height Z, and the ‘spoiler’ cylinder has radius rs and height zs. We simulate sets of N ‘background’ DRO with added ‘spoilers’ and N ‘hot center’ DRO with added ‘spoilers’ for various ‘hot center’ cylinder sizes and contrasts and observe classification performance as a function of histogram percentile.
Statistical analysis
For each experiment, we extract the set of ROI intensity percentiles from each digital reference object and evaluate the performance of each percentile as a predictor of DRO class. Classification performance is quantified by the area under the receiver operating characteristic curve (AUROC).
Detecting immune-related colitis on 18F-FDG PET/CT
Patient population
We conducted retrospective analysis of patients with melanoma, lung cancer, or lymphoma treated with ipilimumab, nivolumab, or a combination of the two at the University of Wisconsin Carbone Cancer Center, Madison, WI, USA. Imaging data were acquired between March 2013 and October 2019. We required that patients received a baseline 18F-FDG PET scan fewer than 12 weeks prior to starting ICI treatment and had at least one PET scan during or following treatment. Patients who did not have scans within the specified time points were excluded from this analysis. Chart review of patients who met these criteria was conducted to identify which patients received a clinical diagnosis of irColitis. In all but one patient, irColitis diagnosis was confirmed by colonoscopy with biopsy. This study was HIPAA compliant with a waiver of informed consent. It was approved by the Institutional Review Board (IRB 2015–0273).
18F-FDG PET acquisition
18F-FDG PET images were acquired on four PET/CT scanners at the University of Wisconsin-Madison: GE Discovery 710, GE Discovery STE, GE Discovery IQ, and GE Discovery MI (General Electric, Waukesha, WI). Our institutional PET imaging protocol required that patients fast for 6 h prior to injection of the radiotracer and have a blood glucose level below 200 mg dl−1 at the time of the scan. Patients were also required to hold diabetic medication for 6 h prior to radiotracer injection. On the GE Discovery IQ, patients were injected with 259 ± 52 MBq of 18F-FDG. On all other scanners, patients were injected with a weight-based dose of 5.2 MBq per kilogram (minimum 370 MBq) of 18F-FDG. Scans were acquired 60 ± 10 min post-injection. A low-dose CT was acquired for attenuation correction. Following reconstruction, images were normalized by patient weight and injected dose to compute Standardized Uptake Values (SUV).
PET image analysis
18F-FDG PET/CT images acquired <12 weeks prior to ICI initiation and any available scans acquired during or following treatment were analyzed. Due to the retrospective nature of the data collection method, the timing of scans relative to treatment start was variable between patients. A retrospective harmonization method was used to maintain the quantitative accuracy of SUV metrics across different PET scanners (Namías et al 2020). Different reconstruction parameters from each scanner were identified from the PET DICOM headers, including post-reconstruction filters. NEMA phantom scans from each scanner were used to identify optimal post-filters that minimized the dispersion of contrast recovery coefficients (CRCmax) across scanners. PET images were then unfiltered via Wiener deconvolution and refiltered using the determined optimal filters to obtain harmonized PET images.
A convolutional neural network (CNN) was trained to segment the bowel from low-dose CT images for the purpose of quantifying bowel FDG uptake. A CNN was chosen for segmentation due to its ability to segment irregular and variable structures, such as the bowel. The network architecture used was Deep-Medic, a 3-D, patch-based CNN with multi-resolution pathways (Kamnitsas et al 2017). The loss function used was Dice similarity coefficient (DSC). The optimizer was RMSprop (Tieleman and Hinton, 2012). Manual bowel contours of 60 patients (20 patients from the VISCERAL.eu Anatomy3 benchmark (Jimenez-del-Toro et al 2016) and 40 from a private institutional dataset) were produced by an experienced graduate student using 3D Slicer (Fedorov et al 2012) and used as training data. The whole bowel was contoured from the distal end of the stomach to the rectum. Labeled data were split 80%/20% (N = 48/N = 12) for training/validation. Additionally, bowel contours were produced by an expert nuclear medicine physician on N = 46 18F-FDG PET/CT images from a public dataset hosted by The Cancer Imaging Archive (Kinahan et al 2019) to be used as independent test data to assess the generalizability of the bowel segmentation CNN.
As preprocessing, images were resampled to a cubic 2 mm grid, and normalized to have a mean of 0 and standard deviation of 1 within the patient as defined in equation (8):
| (8) |
Where μI and σI are the mean and standard deviation of the distribution of pixel intensity values of the CT image I. Data augmentation via histogram shifting, histogram scaling, and random rotation was used to increase the effective training dataset size. CNN training was done on a workstation with one NVIDIA Titan Xp GPU with 12 GB of memory.
The low-dose CT image from the 18F-FDG PET/CT scans were input into the trained CNN to produce automatic bowel contours. The predicted bowel mask was then applied to the PET image to quantify bowel 18F-FDG uptake. SUV metrics extracted from the bowel contours included maximum uptake (SUVmax), average uptake (SUVmean), and total uptake (SUVtotal). Additionally, the histogram of SUV within the bowel was constructed (van Velden et al 2011), and percentiles of the SUV histogram were investigated as potential biomarkers of irColitis.
Relative changes in bowel SUV metrics from baseline PET prior to ICI start (PET1) to the 1st on-treatment PET (PET2) were calculated (ΔSUV = 100% × (PET2 − ET1)/PET1) and compared to clinical diagnoses of irColitis as noted in patient’s electronic medical records. IrColitis grade was assigned retrospectively by reviewing the clinical course of the symptoms and based on medical records documentations using CTCAE v5.0. The CTCAE assigns grades for colitis and diarrhea of 1 to 4 based on the severity of abdominal pain, presence of blood in stool, and frequency of bowel movements.
Statistical analysis
Patients were divided into two groups for analysis: patients who received a clinical diagnosis of irColitis, and patients who did not. Relative changes in bowel SUV metrics from PET1 to PET2 were analyzed with Wilcoxon rank-sum tests to assess significant differences between the two groups. Receiver-operator characteristic (ROC) analysis was used to determine an optimal threshold for separating the two groups. Image analysis and statistical testing was done using MATLAB R2020b (The MathWorks, Inc., Natick, MA, United States).
Results
Digital reference object study
To explore image histogram percentiles as potential biomarkers of irColitis, we first performed studies using cylindrical digital reference objects as an idealized model of the colon with controllable geometry. For each experiment, a set of N = 500 cylinders of each class were generated. The radius and height of simulated DRO was R = 32 pixels and Z = 8 pixels for background cylinders. Sizes of added ‘hot center’, ‘cold center’, and ‘spoiler’ cylinders are defined relative to the size of the background cylinder.
Varying cylinder size
First, we investigated the impact of added cylinder size on detectability. We varied the height z and radius r of added ‘hot center’ and ‘cold center’ cylinders but fixed their intensity and noise levels. For ‘hot center’ cylinders, intensity was fixed at 2*I0; for ‘cold center’ cylinders, intensity was fixed at 0.1*I0, where I0 is the intensity of the background cylinder. Added ‘spoiler’ cylinders had fixed intensity Is = 5*I0. Noise levels were set to the square root of the local intensity in all cylinders (k = 1).
When classifying ‘background’ versus ‘hot center’ cylinders, classification performance increased with ROI percentile and plateaued around Ysat,HC%, corresponding to the volume fraction of the ‘hot center’ cylinder (figure 3(a)). This behavior was observed for all values of r and z. When classifying ‘background’ versus ‘cold center’ cylinders, classification performance was again highest at percentiles corresponding to the volume fraction of the ‘cold center’ cylinder Ysat,CC%, but because the intensity of the cold center was lower than background, these were the lowest percentiles of the ROI histogram (figure 3(b)).
Figure 3.
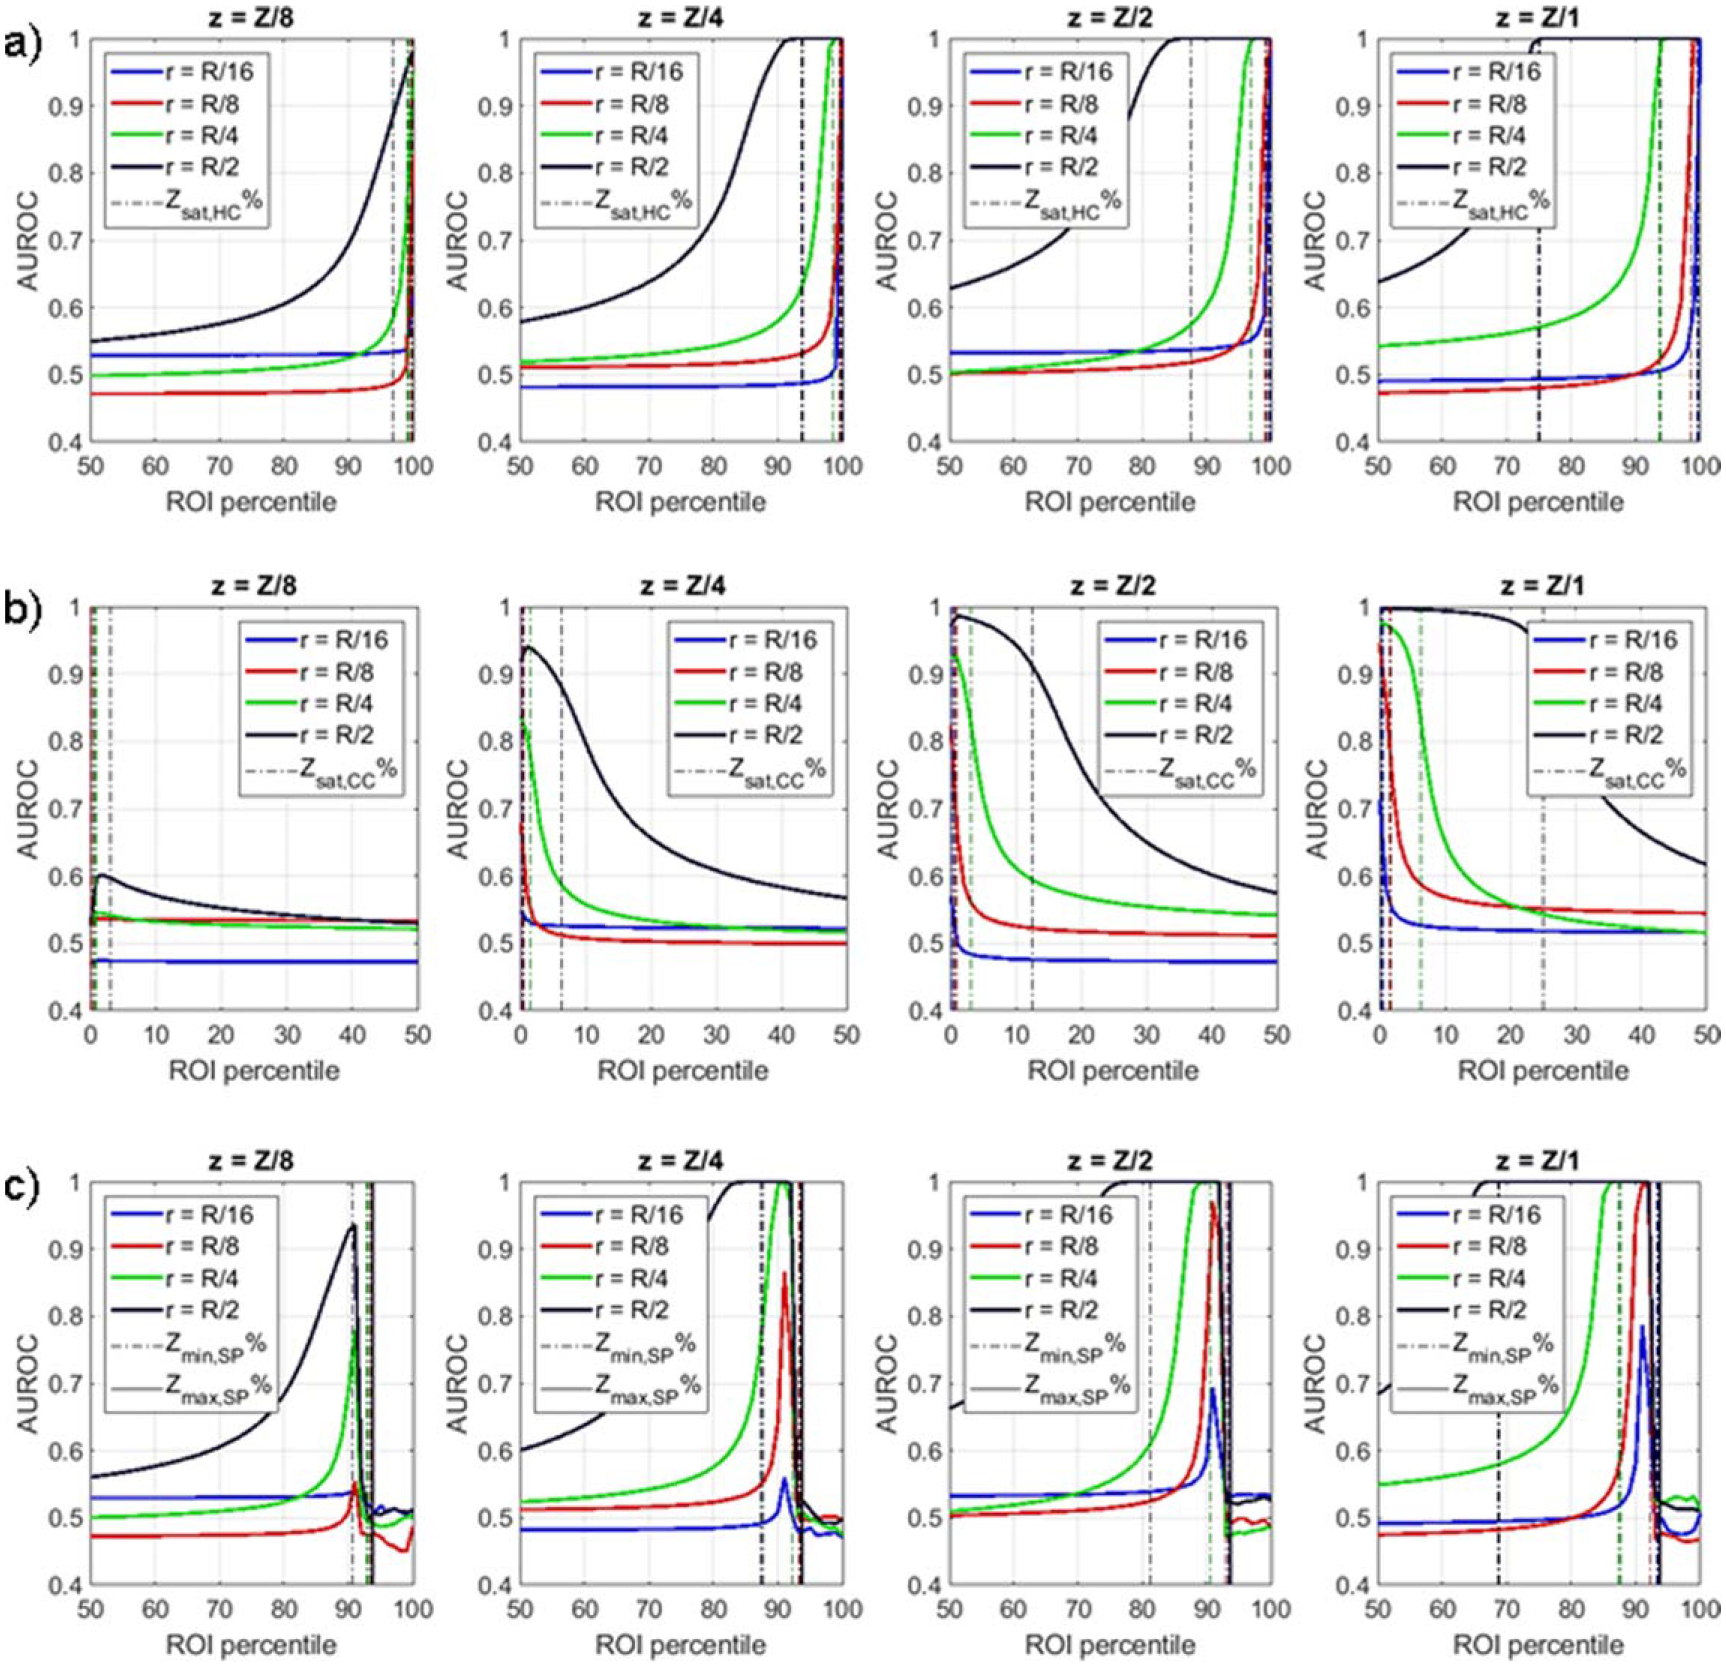
DRO classification performance for varying cylinder radii r and height z. For ‘background’ versus ‘hot center’ classification (a), performance saturation occurs at percentiles above the volume fraction of the ‘hot center’ cylinder, as defined by Zsat,HC%. For ‘background’ versus ‘cold cylinder’ classification (b), performance saturation occurs at percentiles below the volume fraction of the ‘cold center’ cylinder, as defined by Zsat,CC%. For ‘background versus ‘hot center’ with spoilers classification (c), performance is highest around Zmin,SP% and drops significantly above Zmax,SP%.
When a spoiler cylinder was added to both ‘background’ and ‘hot center’ DRO, classification performance increased with histogram percentile and saturated around Ymin,SP%, corresponding to the combined volume fraction of the hot center and spoiler cylinders. At percentiles above Ymax,SP%, corresponding to the volume fraction of the spoiler cylinder, performance drops rapidly as anticipated (figure 3(c)).
Varying cylinder contrast
We repeated our three experiments with fixed cylinder geometry but varying added cylinder intensity and noise properties. For this investigation, ‘hot center’ and ‘cold center’ cylinders had fixed radii r = R/4 and fixed height z = Z, where R and Z are the radius and height of the background cylinder, respectively. The ‘spoiler’ cylinder had fixed intensity Is = 5*I0, fixed radius rs = R/4, and fixed height zs = Z. Intensity of added ‘hot center’ (I ∈ {1I0, 2I0, 4I0, 8I0}) and ‘cold center’ (I ∈ {0.1I0, 0.2I0, 0.4I0, 0.8I0}) was varied. Noise parameter k was also varied (k ∈ {1, 2, 4, 8}).
In general, DRO classification performance was highest for higher cylinder contrast and lower noise (figure 4(a)–(b)). Performance saturation continued to correspond to the volume fraction of the hot center or cold center cylinders, although AUROC saturation did not occur at lower contrast and higher noise levels.
Figure 4.
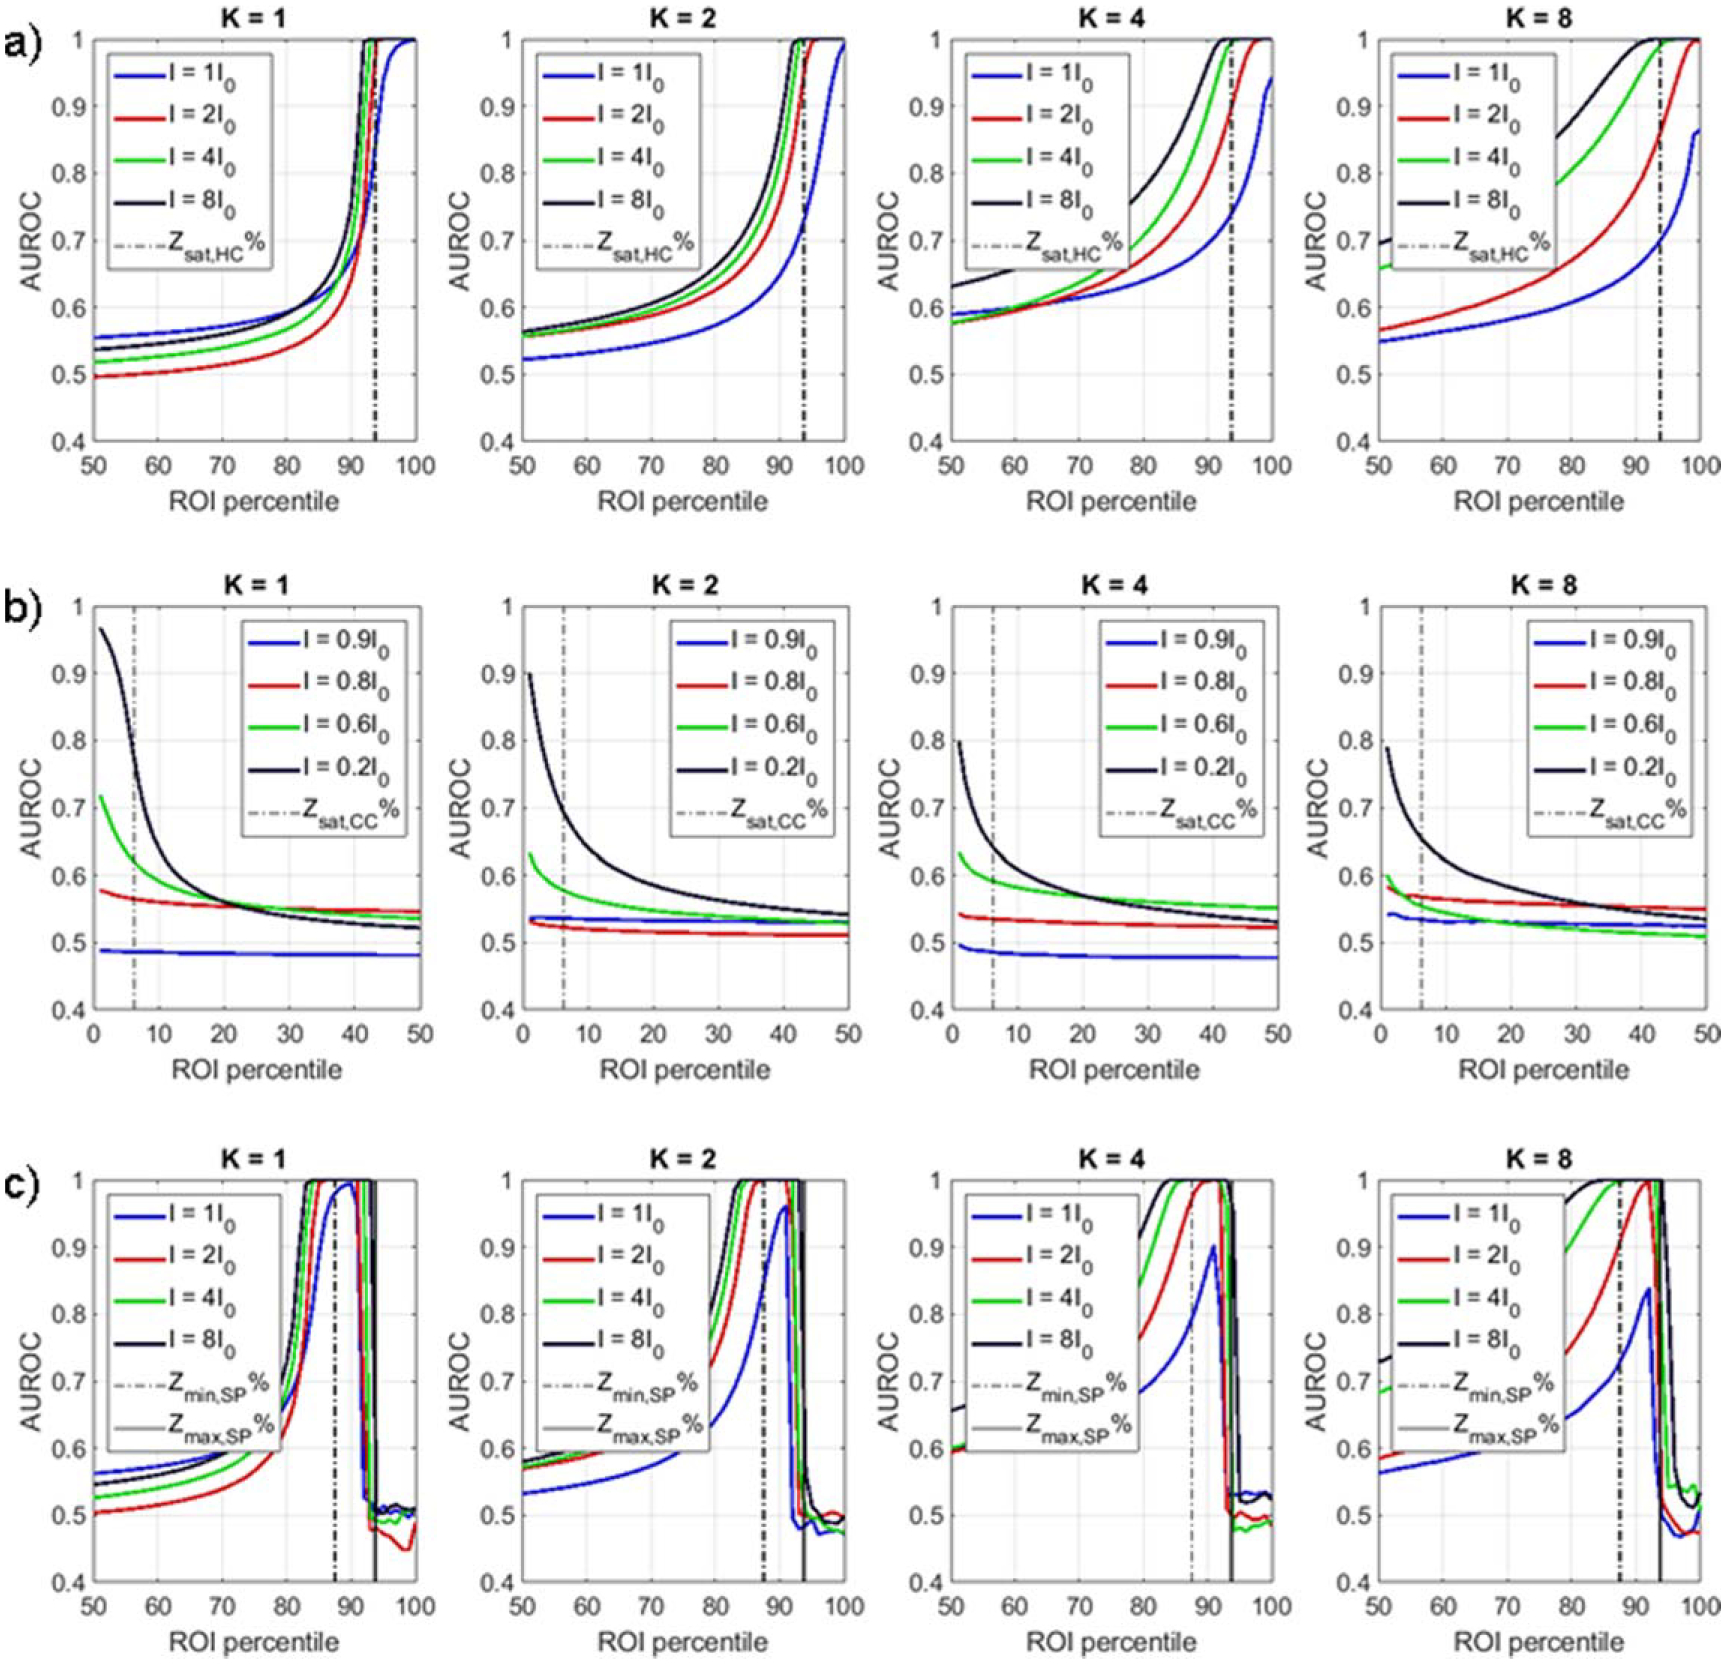
DRO classification performance for varying intensity I and noise parameter k for the three DRO classification tasks: (a) background versus hot center, (b) background versus cold center, and (c) background versus hot center with spoiler.
When a spoiler cylinder was added to the background versus hot center classification task, classification performance was again highest for percentiles above Ymin,SP% and below Ymax,SP% (figure 4(c)).
Comparing histogram percentiles to ROI minimum, ROI maximum, and ROI mean
Comparison of ROI mean, ROI maximum, ROI minimum, and optimal percentile is shown in table 1. For classifying background versus hot center DRO, the ROI maximum performed as well as the optimal percentile (AUROC = 1). The range of percentiles for optimal classification performance corresponded to the volume fraction of the hot center cylinder. ROI mean and ROI minimum were not useful in detecting hot center DRO. Similarly, for classifying background versus cold center DRO, the ROI minimum performed as well as the optimal percentile. ROI mean and ROI maximum were not useful in detecting cold center DRO.
Table 1.
AUROC values for classifying DRO by ROI mean value, ROI maximum value, ROI minimum value, and the optimal ROI histogram percentile. Optimal percentile is defined to be the histogram percentile which produces the highest AUROC (equation (3)). If multiple ROI percentiles result in the same AUROC, the range of percentiles that result in the highest AUROC is given. Values are provided for one fixed DRO geometry, intensity, and noise setting.
| ROI mean | ROI max | ROI min | Opt percentile (Popt%) | |
|---|---|---|---|---|
| BG versus HC r = R/4, z = Z, I = 2I0, k = 1 |
0.68 | 1 | 0.51 | 1 ([P94%, P100%]) |
| BG versus CC r = R/4, z = Z, I = 0.8I0, k = 1 |
0.44 | 0.51 | 0.96 | 0.97 (P3%) |
| BG versus HC w/ spoiler r = R/4, z = Z, I = 2I0, k = 1, rs = R/4, Is = 10I0 |
0.68 | 0.51 | 0.51 | 1 ([P87%, P92%]) |
When a spoiler volume was introduced to the background versus hot center classification problem, the AUROC for ROI maximum dropped to 0.51, indicating classification performance no different from random guess. The optimal percentile retained its classification performance (AUROC = 1), but the range of optimal percentiles was shifted down by an amount corresponding to the volume fraction of the added spoiler volume as compared to the case of no spoiler. ROI mean and ROI minimum were not useful in detecting hot center DRO with a spoiler.
Detecting immune-related colitis on 18F-FDG PET/CT
Automatic bowel segmentation by CNN
To evaluate the performance of our CNN model to segment the bowel, an independent test set of N = 46 CT volumes from a public PET/CT image dataset was used. Reference segmentations of the bowel were produced by an expert Nuclear Medicine physician. Segmentation performance was quantified using the Dice Similarity Coefficient (DSC) and the Average Symmetric Surface Distance (ASSD) as defined in (Heimann et al 2009). In the test set, median bowel DSC was 0.92 (range 0.61–0.99). Median ASSD was 0.3 cm(range:0.0–4.3).
Retrospective study of irColitis on 18F-FDG PET/CT
Forty patients with melanoma (n = 30), lymphoma (n = 6), or lung cancer (n = 4) received ipilimumab or nivolumab between 2013 and 2019 and were included in this study. The median age of the patients at PET1 was 54 years (range: 16–90). Sixteen patients (40%) were female. Eleven patients (28%) received combination ICI of ipilimumab plus nivolumab, while 14 (35%) and 15 (38%) received single agent ICI with ipilimumab or nivolumab, respectively.
A total of 184 18F-FDG PET/CT scans were collected. The median number of scans available per patient was 4 (range: 1–17). Median time from baseline PET (PET1) to treatment start was 28 days (range: 2–83). Median time from treatment start to first on-treatment PET (PET2) was 91 days (range: 2–453). Median time between PET1 and PET2 was 114 days (range: 58–489 days).
Chart review determined that 18% (7/40) of patients were clinically diagnosed with irColitis (Grade 2: n = 3, Grade 3: n = 4). The median time from treatment start to clinical irColitis diagnosis was 84 days (range: 13–302). Colitis incidence was higher in the combination ipilimumab plus nivolumab group (36%, 4/11), than either single agent groups (ipilimumab: 14%, 2/14, nivolumab: 7%, 1/15). Of the seven patients who experienced irColitis, 14% (1/7) did not have any available follow-up PET imaging and 28% (2/7) were diagnosed prior to PET2. These three patients were removed from the analysis. This left four patients for which the on-treatment change in bowel 18F-FDG uptake could be evaluated as a marker of irColitis. The 33 remaining patients who did not receive an irColitis diagnosis were assumed to represent normal, physiological bowel 18F-FDG accumulation, and were used as normal controls.
SUV95%, defined as the 95th percentile of the bowel SUV histogram, demonstrated a significantly higher increase in patients who later experienced irColitis than those who did not (Wilcoxon rank-sum test, p = 0.02). Relative change in bowel SUVmean, SUVmax, and SUVtotal from PET1 to PET2 were not significantly different between patients who did experience irColitis and patients who did not (figure 5). ROC analysis showed that an increase in SUV95% of greater than +40% separated irColitis findings from normal bowel change with a sensitivity of 75% and specificity of 88%. The area under the ROC curve (AUROC) for SUV95% was 0.86 (figure 6(a)). AUROC for SUVmean, SUVmax, and SUVtotal did not exceed 0.6. Sensitivity analysis of the SUV histogram percentile used as a metric to detect irColitis demonstrated stability over the range of SUV93% to SUV98% with AUCs above 0.8 for this range of percentiles (figure 6(b)). Example bowel SUV histograms for one patient with irColitis and one patient without irColitis are shown in figure 7. Change in bowel SUV95% by irColitis grade was: grade 2 (n = 2): +21% and +61%, and grade 3 (n = 2): +40% and +59%.
Figure 5.
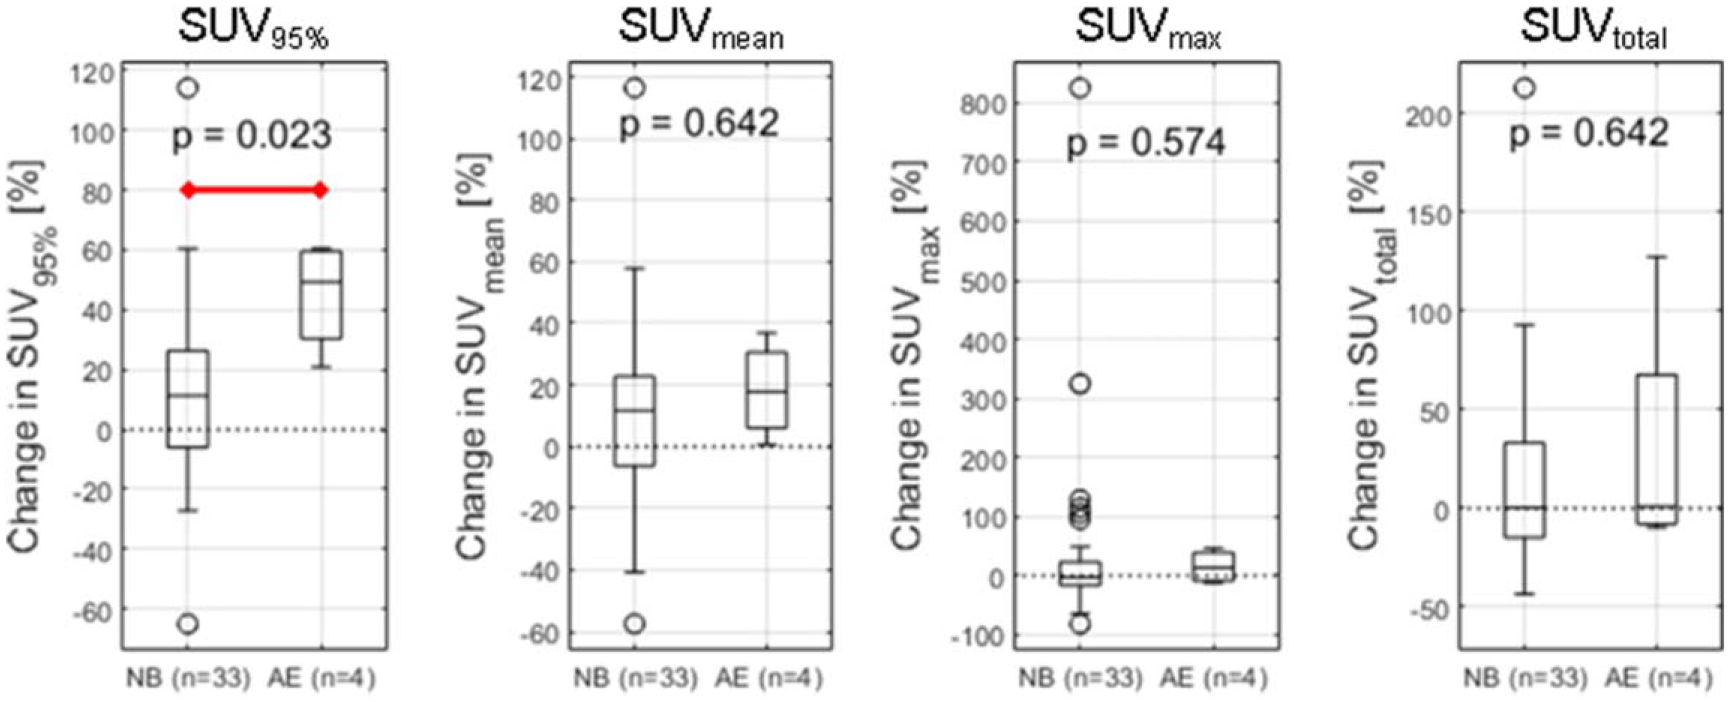
Patient change in bowel SUV95%, SUVmean, SUVmax, and SUVtotal from PET1 to PET2 in patients with normal bowel (NB) and patients who later received a diagnosis of irColitis (AE). (a) Change in bowel SUV95% defined as the relative change in the 95th percentile value of the bowel SUV histogram from PET1 to PET2 was found to be significantly higher in patients who later received a diagnosis of irColitis than in patients with normal bowel (Wilcoxon rank-sum test, p = 0.023).
Figure 6.
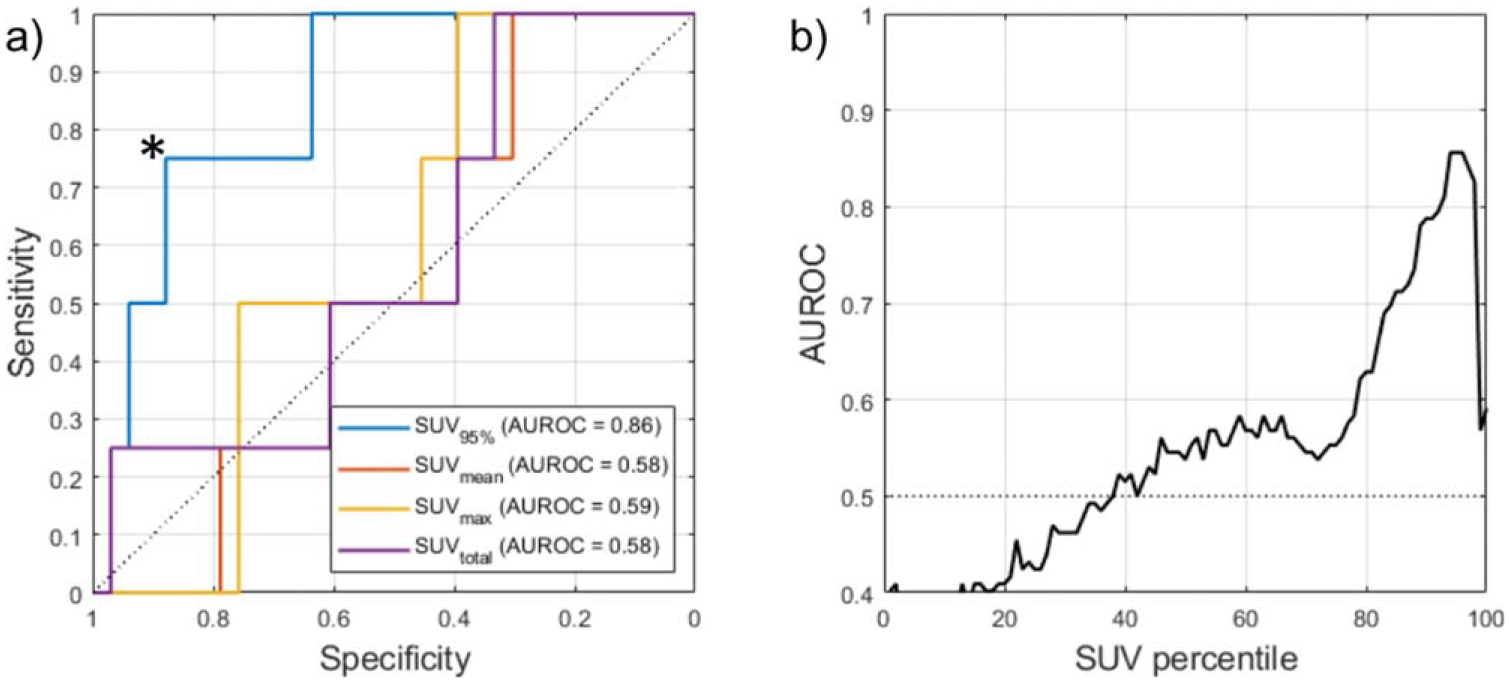
(a) Receiver operator characteristic (ROC) curve for change in SUV95% achieved an AUROC of 0.86 for predicting irColitis. Comparison metrics SUVmean, SUVmax, and SUVtotal were not predictive of irColitis. An increase in SUV95% of greater than +40% (operating point indicated by *) had a sensitivity of 75% and specificity of 88% in identifying pre-colitis bowel change. (b) Sensitivity of irColitis detection to bowel SUV histogram percentile. The AUROC was calculated for each percentile of the bowel SUV histogram X (SUVX%) where X was varied from 0 to 100. Optimal performance was observed at SUV95%, with an AUC of 0.86. Percentiles from SUV93% to SUV98% all achieved AUC > 0.80.
Figure 7.
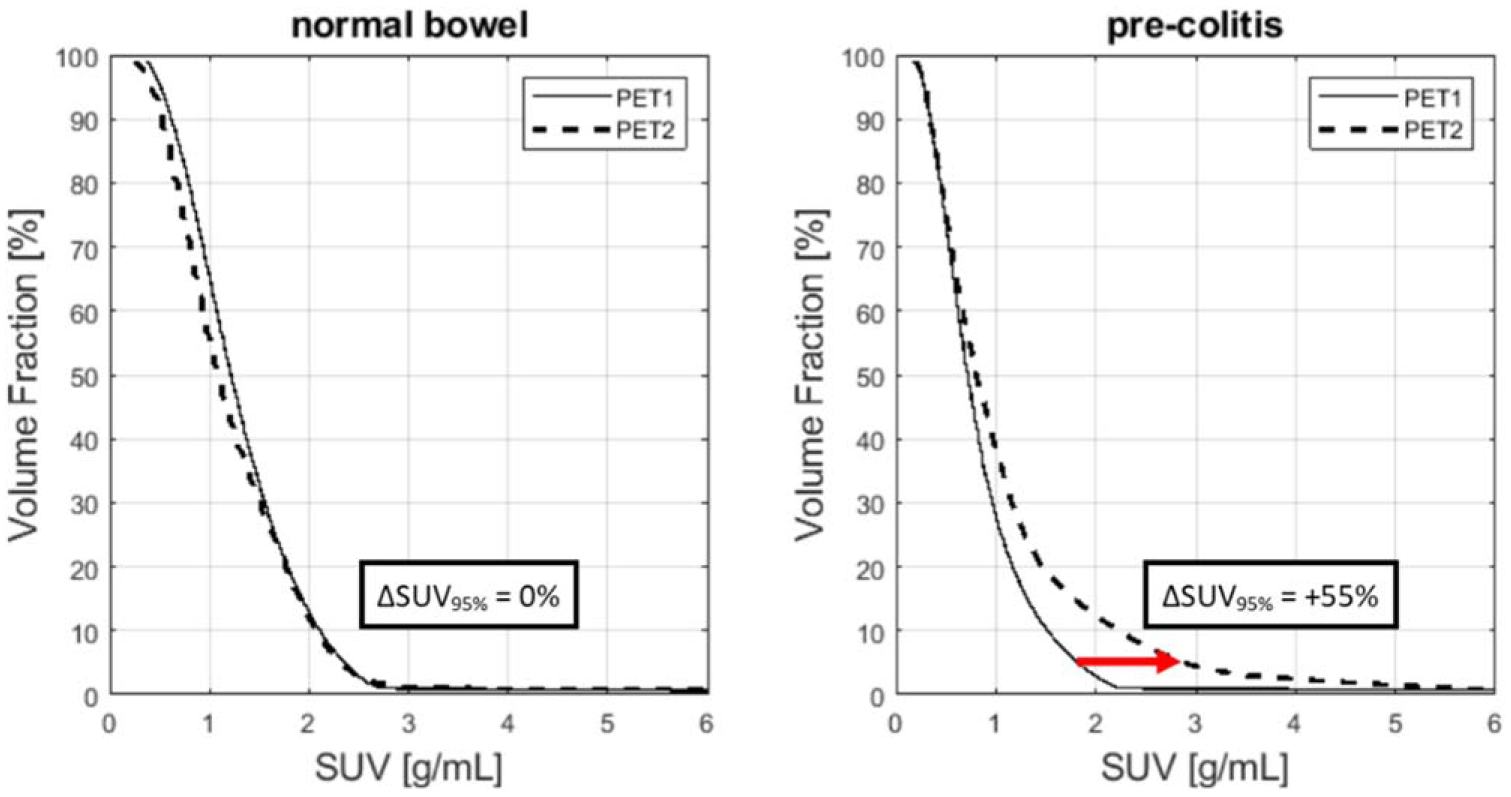
Example bowel SUV histograms. For a patient with no clinical diagnosis of irColitis (left), the histogram at baseline (PET1) and at first follow-up (PET2) are nearly identical and change in SUV95% is small. However, for a patient later diagnosed with irColitis (right), histogram values at high percentiles (>80th percentile) are markedly higher at PET2 than at PET1. The relative increase in SUV95% for this patient is +55%.
In patients later diagnosed with irColitis, the elevated bowel uptake was seen on PET2 a median of 115 days prior to clinical diagnosis (range: 30–206). In two patients, multiple consecutive PET scans demonstrate increased bowel uptake prior to clinical diagnosis, as measured by SUV95%. Longitudinal series of bowel SUV95% for patients who experienced irColitis and when clinical diagnosis was made is shown in figure 8. 18F-FDG PET maximum intensity projections of a patient who experienced irColitis are highlighted in figure 9.
Figure 8.
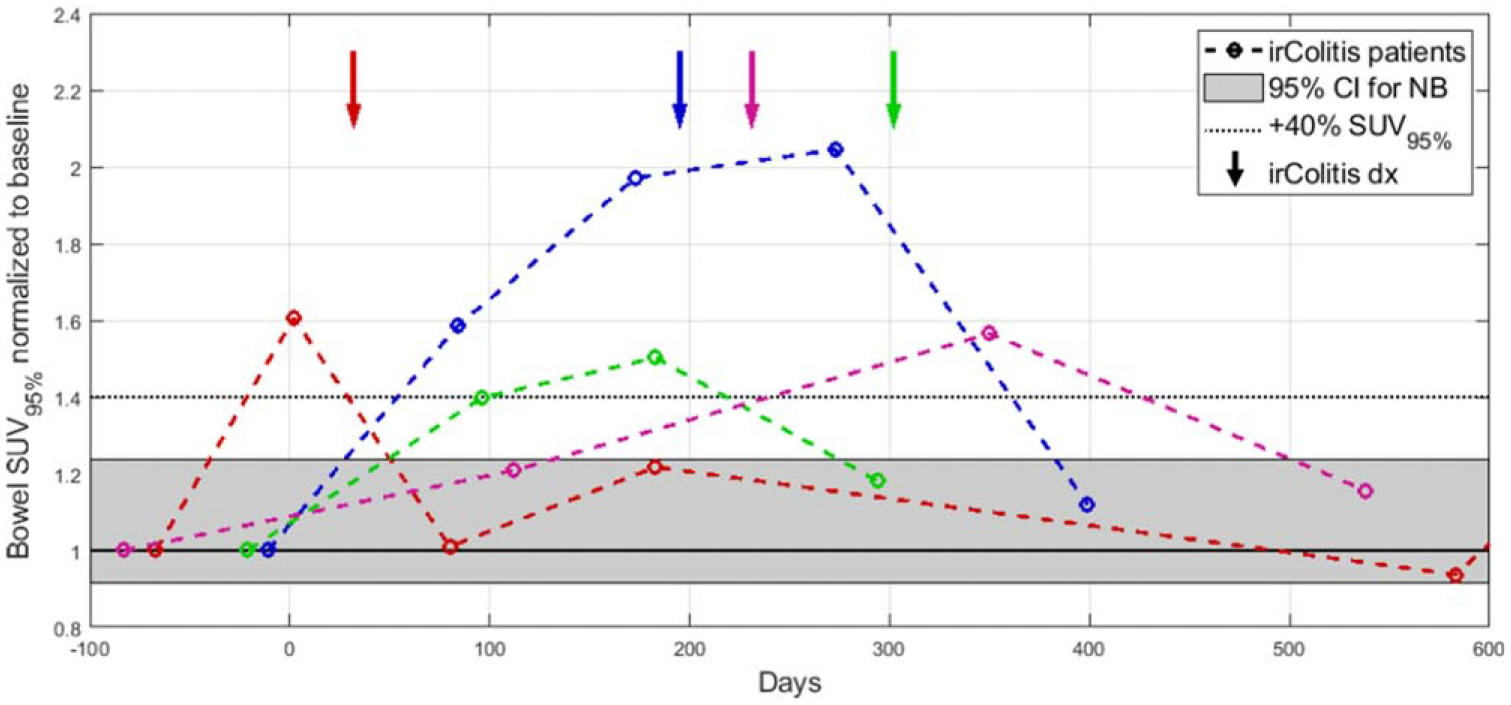
Longitudinal time series relative to treatment start (day 0) of bowel SUV95% for four patients who experienced irColitis (colored lines). The shaded gray region indicates the 95% confidence interval for normalized change in bowel SUV95% for patients with normal bowel (NB) who did not experience irColitis. The confidence interval was constructed as where is the sample mean, σ is the sample standard deviation, and n is the number of observations (n = 33). The dotted line indicates the optimal threshold identified through ROC analysis (ΔSUV95% > +40%). Arrows indicate when clinical diagnosis of irColitis was made for each patient.
Figure 9.
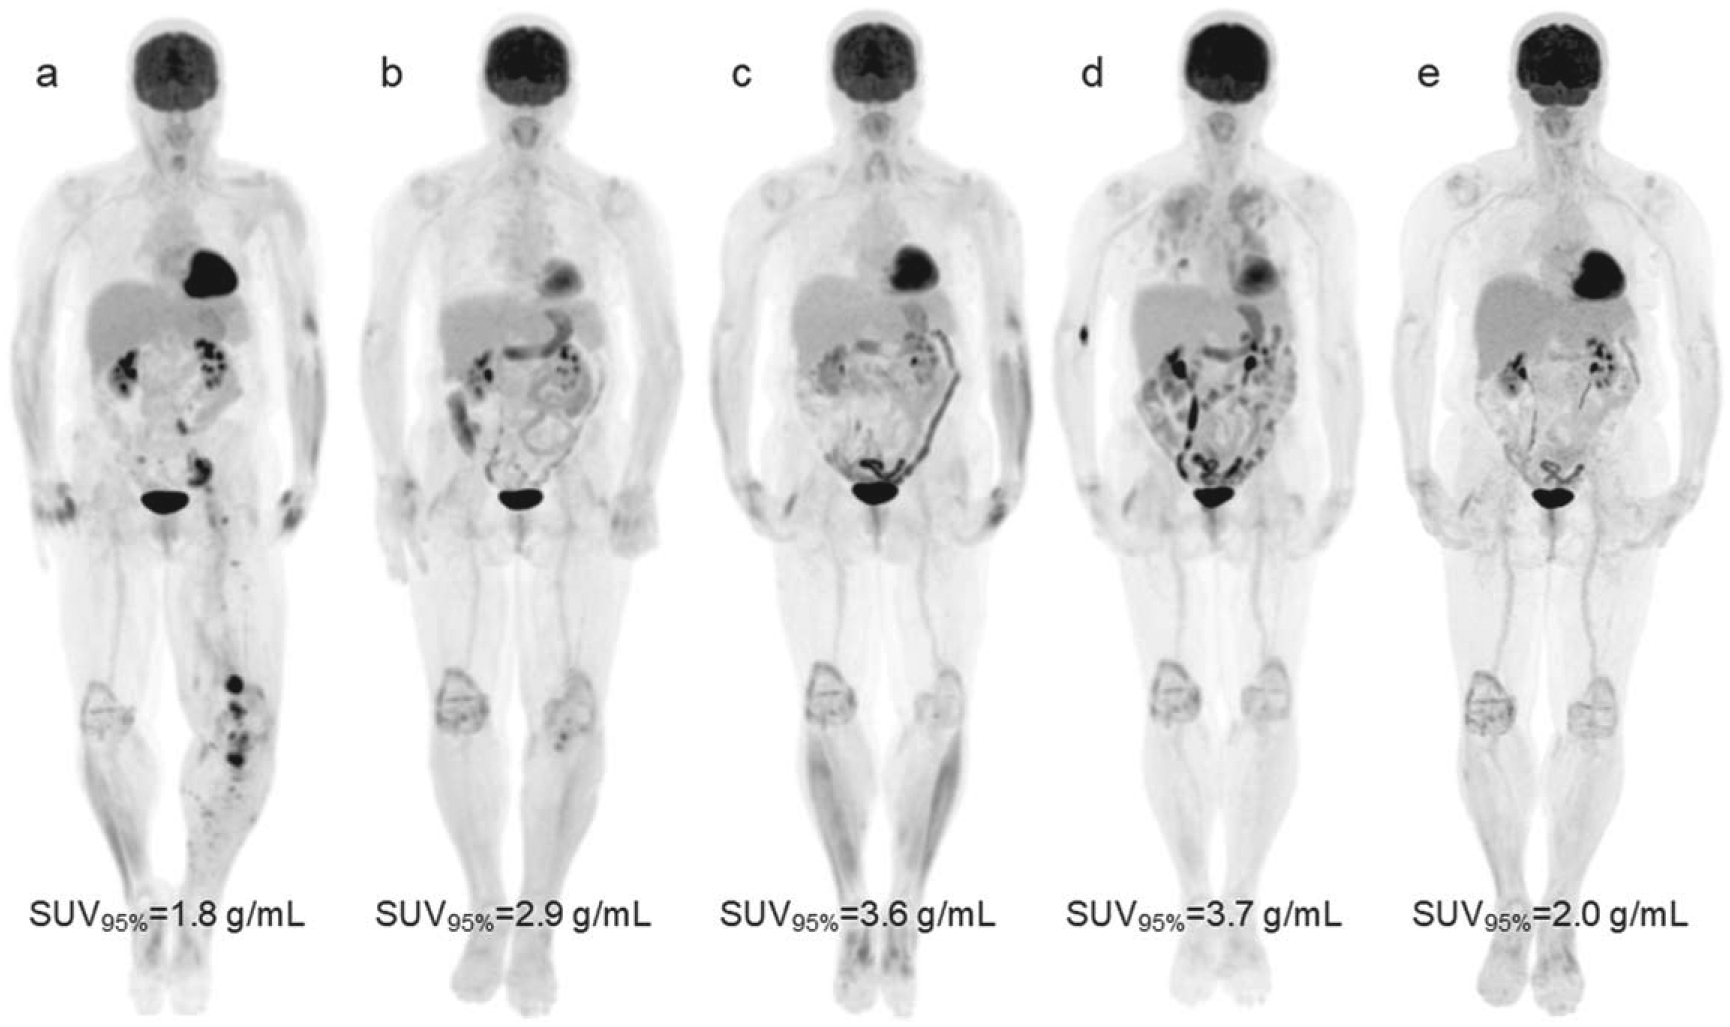
Serial 18F-FDG PET maximum intensity projections of a 68-year-old female with metastatic melanoma receiving combination ipilimumab and nivolumab immunotherapy. (a) At baseline 11 days before treatment start, disease in the pelvis and lower extremities is seen and bowel uptake is normal. (b) Day 84 after treatment start, near complete response of disease sites in the pelvis and lower leg, and moderate increase in bowel uptake can be seen (ΔSUV95% from PET1 to PET2 was +59%). (c) Day 173, continued response, marked elevated bowel uptake is apparent. On day 195 (between c and d), the patient was hospitalized with blood in their stool (Grade 3 Colitis). Colonoscopy with biopsy confirmed irColitis. The patient also had Grade 3 rash during this time and was started on systemic steroids 3 weeks before time point c. (d) Day 273, continued response, elevated bowel uptake remains. Diffuse, elevated lung uptake is apparent as well. Patient received a diagnosis of immune-related pneumonitis. (e) Day 399, continued response, partial resolution of elevated bowel uptake and complete resolution of elevated lung uptake is seen. The patient’s irColitis resolved after completion of slow tapered course of steroids in addition to a course of Budesonide. Scans (a)–(d) were all taken on the same PET/CT scanner (D710). Scan (e) was taken on a different scanner (MI).
PET scan harmonization did not significantly affect our ability to detect irColitis. All reported PET metrics were extracted from harmonized PET data but repeat analysis using PET images prior to harmonization yielded similar results. Non-harmonized change in SUVmean, SUVmax, and SUVtotal from PET1 to PET2 were not significantly different by irColitis status (p > 0.05). Change in SUV95% remained significantly higher in irColitis patients (p = 0.02). The impact of harmonization on baseline PET metrics, and longitudinal change in SUV95% is shown in figure 10.
Figure 10.
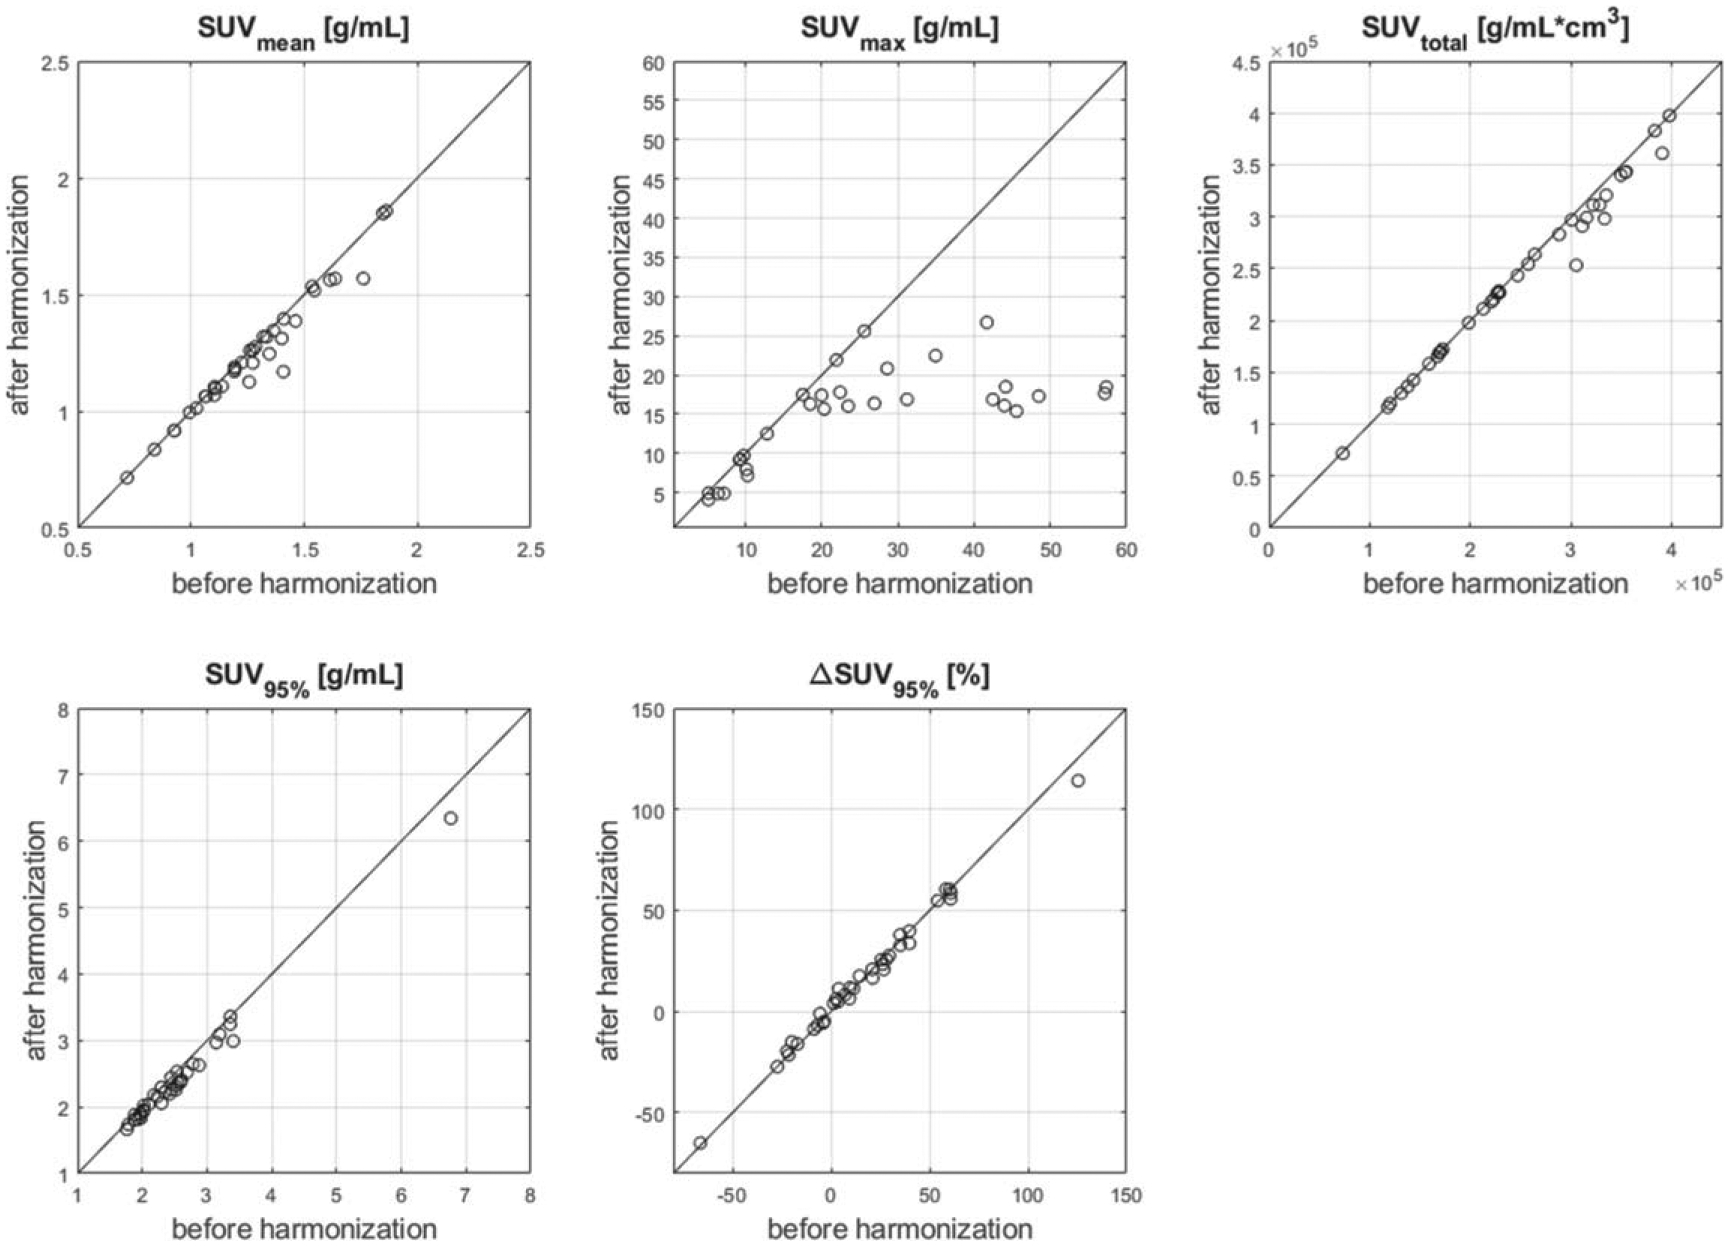
Effect of harmonization on bowel SUV metrics extracted from PET images. Baseline (PET1) SUVmean, SUVtotal, SUV95%, and change in SUV95% from PET1 to PET2 (ΔSUV95%) are largely unaffected by harmonization, while SUVmax tends to be decreased by harmonization, especially for high SUVmax values. This behavior is due to the optimal filtering approach to harmonization we employed (Namías et al 2020), which smooths down high SUV values.
Discussion
In this study, we considered histogram percentiles as potential imaging biomarkers for detecting irColitis and demonstrated the connection between image features and percentile values in an idealized setting using DRO. In a retrospective clinical dataset, we demonstrated that SUV95%, the 95th percentile of the SUV histogram, was the optimal metric for the early detection of bowel inflammation resulting from immune-related colitis. We showed that the early, on-treatment change in SUV95% was significantly higher for patients who experienced irColitis than for patients who did not experience irColitis. The early detection of irColitis-related findings is critical, as early identification of irAE is highly important to expedite appropriate intervention, prevent further progression, and avoid unintended complications and long-term sequelae (Sosa et al 2018).
Percentile-based image analysis has several benefits and limitations that should be discussed. First, percentile-based metrics can overcome issues of image noise or ROI mis-segmentation. This was demonstrated both in our digital reference object analysis with ‘spoiler’ subvolumes, where classification performance remained high for percentiles below the volume fraction of the ‘spoiler’, and in the clinical case of detecting irColitis, where SUV95% could successfully detect irColitis, despite the inclusion of high 18F-FDG uptake from the bladder within the ROI contour. Second, percentile-based metrics provide a direct connection between the optimal percentile and the size or prevalence of the image feature useful for a classification task. As our DRO study showed, the histogram percentile at which classification performance saturated corresponded directly to the volume fraction of the ‘hot center’ and ‘cold center’ cylinders. This is a beneficial feature of percentile-based metrics because it can provide an understandable interpretation and connection to the size or extent of the image feature being characterized within the ROI. Third, percentile metrics are amenable to varied structure geometry. In our DRO study, we used cylindrical ROI as a simplified model of the colon, however, we also demonstrated the value of percentile-based metrics in the complex geometry of abdominal anatomy imaged with 18F-FDG PET/CT. Our study of DRO with varying intensity distribution showed that the volume fraction of the added hot or cold center ROI set the percentile metrics which could successfully classify DRO. Thus, our approach of optimizing the percentile metric can be applied to other classification tasks independent of the size or prevalence of the image structure of interest. Additionally, there is little ambiguity in the mathematical definition of percentiles, which may improve reproducibility in comparison to more complex radiomics features. Percentile metrics are also easily calculated with low computational cost and are widely implemented in most relevant software suites. One limitation of histogram percentile metrics is that they ignore spatial relationships of intensity values within the ROI, which may limit their ability to detect specific patterns in image gray levels, which have been shown to be predictive in some tasks (Sun et al 2018, Mu et al 2019).
To better understand the connection between image features and percentile-based metrics, we conducted studies with cylindrical DRO. We considered three cases of binary DRO classification: (1) ‘background’ versus ‘hot center’, (2) ‘background’ versus ‘cold center’, and (3) ‘background’ versus ‘hot center’ with a ‘spoiler’ subvolume. Our hypothesis was that classification performance would be highest for percentiles which corresponded to the volume fraction of the image feature of interest. In classifying ‘background’ versus ‘hot center’ cylinders, AUROC saturated at and above percentiles corresponding to the volume fraction of the ‘hot center’ cylinder 1-VFHC. Similar behavior was seen in classifying ‘background’ versus ‘cold center’ cylinders, where AUROC saturated at and below percentiles corresponding to the volume fraction of the ‘cold center’ cylinder VFCC. When a ‘spoiler’ cylinder was introduced to the case of ‘background’ versus ‘hot center’, we observed that the highest percentile for which good classification performance was achieved corresponded to the volume fraction of the spoiler volume VFSp, and that the lowest percentile for which good classification performance was achieved corresponded to the volume fraction of the ‘hot center’ cylinder shifted down by VFSp (1−VFHC−VFSp).
Our method for irColitis detection relies on the automatic segmentation of the bowel by CNN. Thus, the performance of the CNN to segment the bowel is important to characterize as part of our image analysis workflow. In an independent test set of N = 46 PET/CT images, our CNN achieved a median DSC of 0.92 (range 0.61–0.99). This is similar to performance reported by (Liu et al 2020). In this study, the small and large bowel are considered separately. They report median DSC for the small bowel of 0.89 (range: 0.62–0.93) and for the large bowel of 0.91 (range: 0.84–0.96).
In our study of irColitis detection, we found no significant difference in change in bowel uptake between normal bowel and pre-irColitis cases for SUVmean, SUVtotal, and SUVmax. This can be explained by comparing the appearance of irColitis-related inflammation on 18F-FDG PET with how each metric is calculated. For SUVmean and SUVtotal, all voxels inside the bowel contour contribute to the metric, and so the large volume of uninvolved bowel exhibiting normal uptake effectively washes out the focal increase in uptake associated with irColitis (Wachsmann et al 2017). This is similar to the relatively poorer performance of SUVmean for detecting ‘hot center’ and ‘cold center’ DRO. In contrast, SUVmax is set by the uptake in a single voxel, and so is sensitive to mis-segmentation. Of particular concern in detecting irColitis is PET spillover from the bladder close to the sigmoid colon. Localization of SUVmax in our predicted bowel contours revealed that in many cases, SUVmax was indeed set by PET bladder spillover. SUVmax is also sensitive to abdominal metastases if they are included in the bowel contour, and to spatial mis-registration between CT and PET that can result from patient movement during image acquisition and from normal physiological peristalsis. This is similar to the drop in performance of the ROI maximum when a ‘spoiler’ volume was present in our DRO study. These observations led us to pursue SUV histogram percentiles as a possible metric to detect irColitis. Our intuition was that a percentile-based metric would be able to capture the local increase in uptake associated with irColitis, unlike SUVmean and SUVtotal, but remain robust to small volume mis-segmentation caused by bladder spillover or spatial misalignment between CT and PET caused by patient motion, unlike SUVmax. In accordance with our hypothesis, we found that the 95th percentile of the bowel SUV histogram demonstrated a significantly higher increase in patients with irColitis than in patients without.
In our DRO study of histogram percentile metrics, we considered two cases: the detection of ‘hot center’ and ‘cold center’ cylinders. While this was an idealized case designed to be illustrative, many real pathologies are similar to a ‘hot center’ or ‘cold center’ detection problem. Our clinical example of detecting bowel inflammation on 18F-FDG PET/CT images can be considered a ‘hot center’ detection problem, as the portion of bowel involved in irColitis demonstrates higher 18F-FDG uptake than surrounding healthy bowel. Other ‘hot center’ detection tasks include the detection of calcification on CT (Graffy et al 2019) or hyperechogenic volumes related to Parkinson’s disease on ultrasound (Pauly et al 2012). Examples of pathology fitting the ‘cold center’ pattern include cerebral edema on CT (Kim et al 2014) or hypometabolism resulting from autoimmune encephalitis seen on 18F-FDG PET (Pillai et al 2010). Our DRO study also included ‘spoiler’ volumes, simulating an image feature unrelated to the classification task of interest. Examples of ‘spoiler’ volumes in clinical scenarios are image artifacts (e.g. a metal artifact on CT can be thought of as a ‘hot’ spoiler, or a starvation artifact may be a ‘cold’ spoiler). Spoilers may also result from ROI mis-segmentation. In our clinical test case of detecting irColitis, the inclusion of a portion of the bladder within the bowel ROI acted as a spoiler, but the detection of irColitis was still possible via SUV95%.
Our study had several limitations that should be discussed. Our digital reference object study made use of cylindrical reference objects with idealized intensity and noise characteristics that are not present in clinical patient data. Our study of irColitis made use of retrospectively collected data in a cohort of patients with a mix of diseases and treatments. The median time between PET1 and PET2 was 114 days (range: 58–489 days). This variation in inter-scan timing could potentially limit our analysis, which included calculating percent changes in SUV between scans. PET data were also acquired on multiple PET/CT scanners. We employed a retrospective harmonization approach to minimize differences introduced by varying PET scanner. This method relied on Wiener deconvolution to remove the effect of the original post-filters, followed by new harmonizing post-filters, which minimize spatial resolution and noise texture differences between scanners. Finally, this was an exploratory analysis carried out in a cohort of 40 patients, of which four were used as positive irColitis cases. We are currently conducting a larger, multi-institute study to validate our findings. Despite these limitations, we saw a difference in bowel SUV95% between patients later diagnosed with irColitis and patients who were not diagnosed.
Conclusion
The 95th percentile of the bowel SUV histogram (SUV95%) was identified as a potential metric for colitis risk in the clinical test case of detecting bowel inflammation related to immune-related colitis on 18F-FDG PET/CT. Additional studies utilizing digital reference objects demonstrated that histogram percentiles can be robust to image noise and to the presence of unrelated image findings.
Data availability statement
The data that support the findings of this study are available upon reasonable request from the authors.
References
- Aerts HJ. et al. Decoding tumour phenotype by noninvasive imaging using a quantitative radiomics approach. Nat. Commun. 2014;5:4006. doi: 10.1038/ncomms5006. [DOI] [PMC free article] [PubMed] [Google Scholar]
- Baiocco S, Matteucci F, Mezzenga E, Caroli P, Di Iorio V, Cittanti C, Bevilacqua A, Paganelli G and Sarnelli A 2019. SUV 95th as a reliable alternative to SUV max for determining renal uptake in [68 Ga] PSMA PET/CT Molecular Imaging and Biology 1–8 [DOI] [PubMed] [Google Scholar]
- Beck KE, Blansfield JA, Tran KQ, Feldman AL, Hughes MS, Royal RE, Kammula US, Topalian SL, Sherry RM and Kleiner D 2006. Enterocolitis in patients with cancer after antibody blockade of cytotoxic T-lymphocyte–associated antigen 4 J Clin Oncol 24 2283. [DOI] [PMC free article] [PubMed] [Google Scholar]
- Chen R, Chen Y, Huang G and Liu J 2019. Relationship between PD-L1 expression and (18)F-FDG uptake in gastric cancer Aging (Albany NY) 11 12270–7 [DOI] [PMC free article] [PubMed] [Google Scholar]
- Cho SY, Huff DT, Jeraj R and Albertini MR 2020. FDG PET/CT for assessment of immune therapy: opportunities and understanding pitfalls Semin. Nucl. Med 50 518–31 [DOI] [PMC free article] [PubMed] [Google Scholar]
- Crombé A, Périer C, Kind M, De Senneville BD, Le Loarer F, Italiano A, Buy X and Saut O 2019. T2-based MRI Delta- radiomics improve response prediction in soft-tissue sarcomas treated by neoadjuvant chemotherapy J. Magn. Reson. Imaging 50 497–510 [DOI] [PubMed] [Google Scholar]
- Drzymala R, Mohan R, Brewster L, Chu J, Goitein M, Harms W and Urie M 1991. Dose-volume histograms International Journal of Radiation Oncology* Biology* Physics 21 71–8 [DOI] [PubMed] [Google Scholar]
- Fedorov A, Beichel R, Kalpathy-Cramer J, Finet J, Fillion-Robin J-C, Pujol S, Bauer C, Jennings D, Fennessy F and Sonka M 2012. 3D slicer as an image computing platform for the quantitative imaging network J. Magn. Reson. Imaging 30 1323–41 [DOI] [PMC free article] [PubMed] [Google Scholar]
- Gillies RJ, Kinahan PE and Hricak H 2016. Radiomics: images are more than pictures, they are data Radiology 278 563–77 [DOI] [PMC free article] [PubMed] [Google Scholar]
- Graffy PM, Liu J, O’Connor S, Summers RM and Pickhardt PJ 2019. Automated segmentation and quantification of aortic calcification at abdominal CT: application of a deep learning-based algorithm to a longitudinal screening cohort Abdominal Radiology 44 2921–8 [DOI] [PubMed] [Google Scholar]
- Heimann T, Van Ginneken B, Styner MA, Arzhaeva Y, Aurich V, Bauer C, Beck A, Becker C, Beichel R and Bekes G 2009. Comparison and evaluation of methods for liver segmentation from CT datasets IEEE Trans. Med. Imaging 28 1251–65 [DOI] [PubMed] [Google Scholar]
- Horne ZD, Clump DA, Vargo JA, Shah S, Beriwal S, Burton SA, Quinn AE, Schuchert MJ, Landreneau RJ and Christie NA 2014. Pretreatment SUV max predicts progression-free survival in early-stage non-small cell lung cancer treated with stereotactic body radiation therapy Radiation Oncology 9 1–6 [DOI] [PMC free article] [PubMed] [Google Scholar]
- Iravani A and Hicks RJ 2020. Atlas of Response to Immunotherapy ed Lopci E and Fanti S (Cham: Springer International Publishing; ) pp 101–15 [Google Scholar]
- Jimenez-del-Toro O, Müller H, Krenn M, Gruenberg K, Taha AA, Winterstein M, Eggel I, Foncubierta-Rodríguez A, Goksel O and Jakab A 2016. Cloud-based evaluation of anatomical structure segmentation and landmark detection algorithms: VISCERAL anatomy benchmarks IEEE Trans. Med. Imaging 35 2459–75 [DOI] [PubMed] [Google Scholar]
- Kamnitsas K, Ledig C, Newcombe VF, Simpson JP, Kane AD, Menon DK, Rueckert D and Glocker B 2017. Efficient multiscale 3D CNN with fully connected CRF for accurate brain lesion segmentation Med. Image Anal. 36 61–78 [DOI] [PubMed] [Google Scholar]
- Kim et al. 2014. Quantitative analysis of computed tomography images and early detection of cerebral edema for pediatric traumatic brain injury patients: retrospective study BMC medicine 12 1–16 [DOI] [PMC free article] [PubMed] [Google Scholar]
- Kinahan P, Muzi M, Bialecki B, Herman B and Coombs L 2019. ACRIN 6668 trial NSCLC-FDG-PET Data from (https://wiki.cancerimagingarchive.net/pages/viewpage.action?pageId=39879162#3987)
- Lang N, Dick J, Slynko A, Schulz C, Dimitrakopoulou-Strauss A, Sachpekidis C, Enk AH and Hassel JC 2019. Clinical significance of signs of autoimmune colitis in 18F-fluorodeoxyglucose positron emission tomography-computed tomography of 100 stage-IV melanoma patients Immunotherapy 11 667–76 [DOI] [PubMed] [Google Scholar]
- Larkin J, Chiarion-Sileni V, Gonzalez R, Grob JJ, Cowey CL, Lao CD, Schadendorf D, Dummer R, Smylie M and Rutkowski P 2015. Combined nivolumab and ipilimumab or monotherapy in untreated melanoma New Engl. J. Med 373 23–34 [DOI] [PMC free article] [PubMed] [Google Scholar]
- Liu Y, Lei Y, Fu Y, Wang T, Tang X, Jiang X, Curran WJ, Liu T, Patel P and Yang X 2020. CT-based multi-organ segmentation using a 3D self-attention U-net network for pancreatic radiotherapy Med. Phys 47 4316–24 [DOI] [PMC free article] [PubMed] [Google Scholar]
- Mu W, Tunali I, Gray JE, Qi J, Schabath MB and Gillies RJ 2019. Radiomics of (18)F-FDG PET/CT images predicts clinical benefit of advanced NSCLC patients to checkpoint blockade immunotherapy Eur. J. Nucl. Med. Mol. Imaging 47 1168–92 [DOI] [PMC free article] [PubMed] [Google Scholar]
- Nakamura K, Kodama J, Okumura Y, Hongo A, Kanazawa S and Hiramatsu Y 2010. The SUVmax of 18F-FDG PET correlates with histological grade in endometrial cancer International Journal of Gynecologic Cancer 20 100–15 [DOI] [PubMed] [Google Scholar]
- Namías M, Huff D, Weisman A, Bradshaw T and Jeraj R 2020. Retrospective quantitative harmonization in PET using deconvolution and optimal filtering Bull. Am. Phys. Soc 65 [Google Scholar]
- Nie K, Shi L, Chen Q, Hu X, Jabbour SK, Yue N, Niu T and Sun X 2016. Rectal cancer: assessment of neoadjuvant chemoradiation outcome based on radiomics of multiparametric MRI Clinical cancer research 22 5256–64 [DOI] [PMC free article] [PubMed] [Google Scholar]
- O’Connor JP, Rose CJ, Waterton JC, Carano RA, Parker GJ and Jackson A 2015. Imaging intratumor heterogeneity: role in therapy response, resistance, and clinical outcome Clinical Cancer Research 21 249–57 [DOI] [PMC free article] [PubMed] [Google Scholar]
- Pauly O, Ahmadi S-A, Plate A, Boetzel K and Navab N 2012. Int. conf. on medical image computing and computer-assisted intervention vol. Series (Berlin: Springer; ) pp 443–50 [DOI] [PubMed] [Google Scholar]
- Pillai SC, Gill D, Webster R, Howman-Giles R and Dale RC 2010. Cortical hypometabolism demonstrated by PET in relapsing NMDA receptor encephalitis Pediatric neurology 43 217–20 [DOI] [PubMed] [Google Scholar]
- Puzanov I, Diab A, Abdallah K, Bingham C, Brogdon C, Dadu R, Hamad L, Kim S, Lacouture M and LeBoeuf N 2017. Managing toxicities associated with immune checkpoint inhibitors: consensus recommendations from the society for immunotherapy of cancer (SITC) toxicity management working group J Immunother Cancer 5 95. [DOI] [PMC free article] [PubMed] [Google Scholar]
- Rodrigues G, Lock M, D’Souza D, Yu E and Van Dyk J 2004. Prediction of radiation pneumonitis by dose–volume histogram parameters in lung cancer—a systematic review Radiother. Oncol 71 127–38 [DOI] [PubMed] [Google Scholar]
- Sosa A, Lopez Cadena E, Simon Olive C, Karachaliou N and Rosell R 2018. Clinical assessment of immune-related adverse events Ther Adv Med Oncol 10 1758835918764628 [DOI] [PMC free article] [PubMed] [Google Scholar]
- Sun R et al. 2018. A radiomics approach to assess tumour-infiltrating CD8 cells and response to anti-PD-1 or anti-PD-L1 immunotherapy: an imaging biomarker, retrospective multicohort study Lancet Oncol. 19 1180–91 [DOI] [PubMed] [Google Scholar]
- Tieleman T and Hinton G 2012. Lecture 6.5-rmsprop: divide the gradient by a running average of its recent magnitude COURSERA: Neural networks for machine learning 4 26–31 [Google Scholar]
- Tofts PS, Benton CE, Weil RS, Tozer DJ, Altmann DR, Jäger HR, Waldman AD and Rees JH 2007. Quantitative analysis of whole-tumor Gd enhancement histograms predicts malignant transformation in low-grade gliomas Journal of Magnetic Resonance Imaging: An Official Journal of the International Society for Magnetic Resonance in Medicine 25 208–14 [DOI] [PubMed] [Google Scholar]
- van Velden FH, Cheebsumon P, Yaqub M, Smit EF, Hoekstra OS, Lammertsma AA and Boellaard R 2011. Evaluation of a cumulative SUV-volume histogram method for parameterizing heterogeneous intratumoural FDG uptake in non-small cell lung cancer PET studies Eur. J. Nucl. Med. Mol. Imaging 38 1636–47 [DOI] [PMC free article] [PubMed] [Google Scholar]
- Wachsmann JW, Ganti R and Peng F 2017. Immune-mediated disease in ipilimumab immunotherapy of melanoma with FDG PET-CT Acad. Radiol 24 111–5 [DOI] [PubMed] [Google Scholar]
- Wang G, He L, Yuan C, Huang Y, Liu Z and Liang C 2018. Pretreatment MR imaging radiomics signatures for response prediction to induction chemotherapy in patients with nasopharyngeal carcinoma Eur. J. Radiol 98 100–6 [DOI] [PubMed] [Google Scholar]
Associated Data
This section collects any data citations, data availability statements, or supplementary materials included in this article.
Data Availability Statement
The data that support the findings of this study are available upon reasonable request from the authors.


