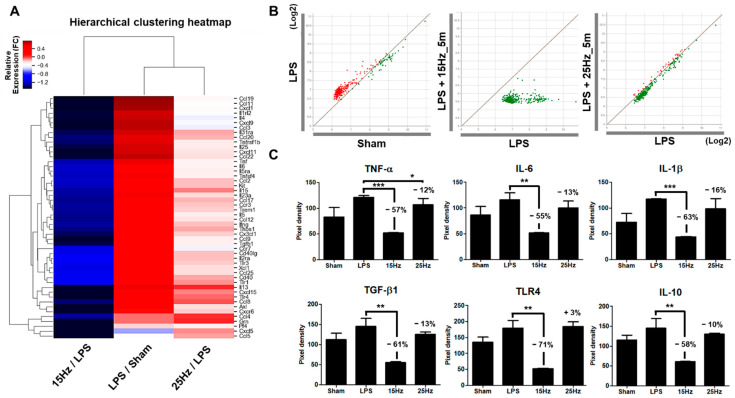
Figure 6.
Changes in inflammatory cytokines and chemokines in the plasma of LPS-induced endotoxemia with taVNS. (A) Most cytokines and chemokines were upregulated by LPS injection (LPS/Sham). Both taVNS groups (15 Hz and 25 Hz) attenuated the expression levels of cytokines and chemokines in serum. taVNS with 15 Hz was more significantly reduced than with 25 Hz. Clustering software generated a heatmap. The color depicts the levels of fold change. (B) Scatter plot analysis showed the expression changes of cytokines and chemokines for the LPS-induced inflammation verse sham (left), taVNS with 15 Hz on the LPS-induced inflammation versus the LPS-induced inflammation (middle), and taVNS with 25 Hz on the LPS-induced inflammation versus the LPS-induced inflammation (right). Upregulation is presented as red dots and downregulation as green dots. (C) The representative pixel density of pro- and anti-inflammatory-related cytokines, namely TNF-α, IL-6, IL-1β, TGF-β1, TLR4, and IL-10 in the serum of the sham, LPS applied groups and taVNS with 15 Hz or 25 Hz on LPS-induced groups. Data have been presented as the means and SD; * p < 0.05, ** p < 0.01, and *** p < 0.001 to determine the significance levels compared to the LPS group.

