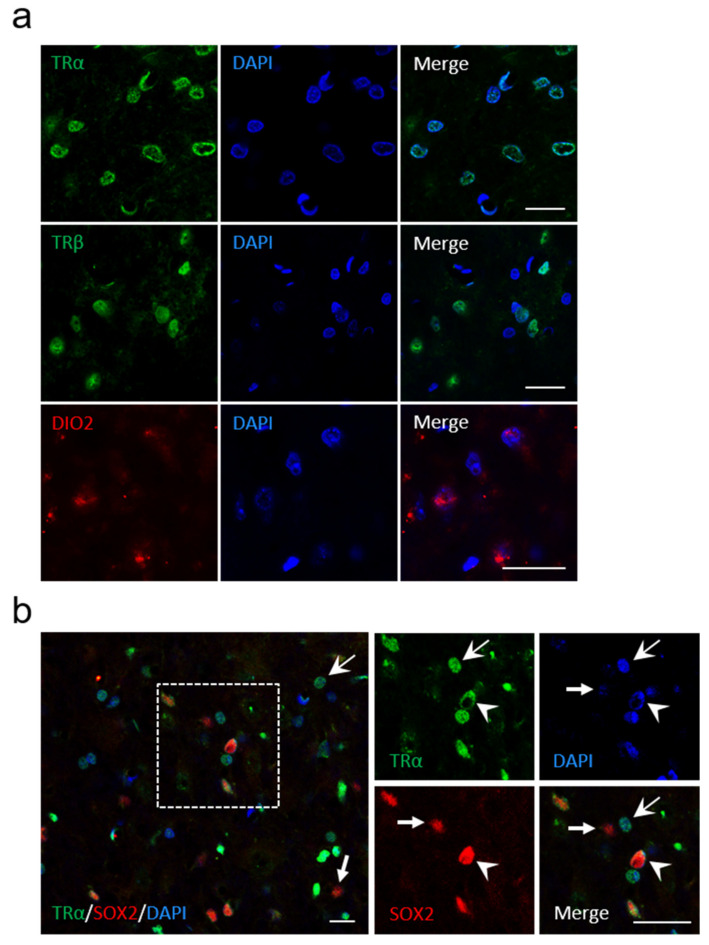
Figure 3.
Presence of TRα, TRβ and Dio2 in the vestibular nuclei of control rats. (a) confocal immunostaining images confirming the presence of TRα (green), TRβ (green), and Dio2 (red) in the vestibular nuclei of control animals (without UVN). (b) Colocalization of TRα (green), SOX2 (red), and DAPI (blue) if cells in the vestibular nuclei. Head arrows indicate TRαPL/SOX2+/DAPI+ cells, arrows with tail indicate TRα+/SOX2−/DAPI+ cells, and small arrows with a tail indicate TRα−/SOX2+/DAPI+ cells. Scale bar = 20 µm.

