Abstract
We tested whether comparative sequence analysis of the mitochondrion-encoded cytochrome c oxidase subunit 2 gene (COX2) could be used to distinguish intraspecific variants of Candida glabrata. Mitochondrial genes are suitable for investigation of close phylogenetic relationships because they evolve much faster than nuclear genes, which in general exhibit very limited intraspecific variation. For this survey we used 11 clinical isolates of C. glabrata from three different geographical locations in Brazil, 10 isolates from one location in the United States, 1 American Type Culture Collection strain as an internal control, and the published sequence of strain CBS 138. The complete coding region of COX2 was amplified from total cellular DNA, and both strands were sequenced twice for each strain. These sequences were aligned with published sequences from other fungi, and the numbers of substitutions and phylogenetic relationships were determined. Typing of these strains was done by using 17 substitutions, with 8 being nonsynonymous and 9 being synonymous. Also, cDNAs made from purified mitochondrial polyadenylated RNA were sequenced to confirm that our sequences correspond to the expressed copies and not nuclear pseudogenes and that a frameshift mutation exists in the 3′ end of the coding region (position 673) relative to the Saccharomyces cerevisiae sequence and the previously published C. glabrata sequence. We estimated the average evolutionary rate of COX2 to be 11.4% sequence divergence/108 years and that phylogenetic relationships of yeasts based on these sequences are consistent with rRNA sequence data. Our analysis of COX2 sequences enables typing of C. glabrata strains based on 13 haplotypes and suggests that positions 51 and 519 indicate a geographical polymorphism that discriminates strains isolated in the United States and strains isolated in Brazil. This provides for the first time a means of typing of Candida strains that cause infections by use of direct sequence comparisons and the associated divergence estimates.
The incidence of infections caused by non-Candida albicans Candida species is steadily increasing in AIDS and cancer patients (10, 14). Among these non-C. albicans species that cause infections, Candida glabrata is important because it is primarily resistant to fluconazole and therefore has recently been the focus of intensive research (15, 24, 25). The epidemiology of C. glabrata infections needs to be studied by obtaining measurements of the genotypic variation because intraspecific phenotypic differentiation is negligible. Although typing of C. glabrata intraspecific variants can be done by randomly amplified polymorphic DNA (RAPD) analysis, restriction fragment length polymorphism (RFLP) analysis, and molecular karyotyping, it is challenging to find adequate primers, sites, and probes that will enable discrimination of these closely related isolates (18, 26). Also, most differences in band patterns are difficult to interpret because band intensity and reproducibility are not absolutely consistent (23, 26). Direct comparison of DNA sequences is preferable for typing of these pathogenic yeasts because methods based on comparison of patterns (e.g., RAPD analysis, RFLP analysis, pulsed-field gel electrophoresis, and multilocus isozyme analysis) are indirect measurements of genetic divergence and can be affected by paralogy and nonindependence of characters (31). Differences in band patterns are much more difficult to analyze under probabilistic models of divergence, which are routinely used for direct sequence comparisons, such as substitution matrices used in maximum likelihood analysis (31). This limitation is due to the difficulty in attributing state-transition probabilities of pattern data as opposed to nucleotide data. The probabilistic approach is required to put the epidemiological transmission framework into a divergence-time perspective, because divergence times can be estimated from phylogenies inferred from DNA sequences. Accordingly, to build the phylogeny that reconstructs the path of orthologous steps that led to the observed divergence, the observed substitutions must be corrected by probabilistic models because of reverse, parallel, and convergent substitutions (17). Comparative analysis of molecular sequences has been used for a variety of taxonomic groups to determine relatedness (34). The rRNA subunit genes have extensively been used as macroevolutionary markers of microorganism phylogeny and taxonomy, including those of pathogenic yeasts, because of functional equivalence, size, and universal distribution (1, 33). However, intraspecific sequence comparisons of nuclear genes in eukaryotes, especially in those genes for which divergence was very recent or the evolutionary rate is very small, exhibit few or no substitutions which preclude the use of such sequences for typing. Mitochondrion-encoded genes evolve approximately 10-fold faster than nuclear genes due to low-fidelity replication, defective repair, and high concentrations of mutagens in mitochondria and therefore are more suitable for use for the resolution of close phylogenetic relationships (2, 3).
Here we tested whether sequences of the mitochondrion-encoded cytochrome c oxidase subunit 2 gene (COX2) could be used to discriminate intraspecific variants of the pathogenic yeast C. glabrata. We typed 23 different strains by comparison of COX2 sequences and found 13 haplotypes. Our data enabled the differentiation of clinical variants on the basis of 2.1% variant positions of 756 positions compared and suggest that at least two positions contain synonymous substitutions that reflect regional differences.
MATERIALS AND METHODS
Clinical isolates.
All Brazilian strains were obtained from the fungus collection of the Laboratório Especial de Micologia (LEMI), Disciplina de Doenças Infecciosas e Parasitárias (DIPA), Departamento de Medicina, Universidade Federal de São Paulo, and were collected from cancer, diabetes, and intensive care unit patients (abdominal surgery) (labeled C, D, and I in Table 1) from 29 December 1994 to 28 May 1997. Isolates from the United States were provided by David Perlin, Public Health Research Institute, New York University. The U.S. isolates were obtained from cancer patients at the Memorial Sloan Kettering Cancer Center in New York City over a 6-month period from 1 July 1998 to 31 December 1998 (Table 1).
TABLE 1.
Clinical isolates used in the present study
| C. glabrata strain | Sourcea |
|---|---|
| USA2 | CST 34, Memorial Sloan Kettering Cancer Center, New York City |
| USA3 | CST 35, Memorial Sloan Kettering Cancer Center, New York City |
| USA4 | CST 40, Memorial Sloan Kettering Cancer Center, New York City |
| USA7 | CST 56B, Memorial Sloan Kettering Cancer Center, New York City |
| USA8 | CST 78, Memorial Sloan Kettering Cancer Center, New York City |
| USA9 | CST 80, Memorial Sloan Kettering Cancer Center, New York City |
| USA13 | CST 84, Memorial Sloan Kettering Cancer Center, New York City |
| USA15 | CST 109, Memorial Sloan Kettering Cancer Center, New York City |
| USA16 | CST 110, Memorial Sloan Kettering Cancer Center, New York City |
| USA17 | CST 111B, Memorial Sloan Kettering Cancer Center, New York City |
| 05 | LEMI 386, UFRJ University Hospital, Rio de Janeiro, Brazil (C) |
| 06 | LEMI 387, UFRJ University Hospital, Rio de Janeiro, Brazil (C) |
| 12 | LEMI 381, UFRJ University Hospital, Rio de Janeiro, Brazil (C) |
| 13 | LEMI 372, UFRJ University Hospital, Rio de Janeiro, Brazil (C) |
| 38 | LEMI 231, UFRJ University Hospital, Rio de Janeiro, Brazil (C) |
| 36 | LEMI 292, Hospital São Paulo, São Paulo, Brazil (D) |
| 37 | LEMI 159, Hospital São Paulo, São Paulo, Brazil (I) |
| 39 | LEMI 290, Hospital São Paulo, São Paulo, Brazil (D) |
| 71 | LEMI 71, Hospital Santa Marcelina, São Paulo, Brazil (C) |
| 261a | LEMI 261a, Hospital Santa Marcelina, São Paulo, Brazil (I) |
| 47 | LEMI 244, Hospital of University of Campinas, Campinas, Brazil (C) |
| ATCC 90030 | American Type Culture Collection |
C, D, and I indicate isolates from cancer, diabetes, and intensive care unit patients, respectively; UFRJ, Universidade Federal do Rio de Janeiro.
Isolation of total DNA and mtRNA.
Total genomic DNA was isolated by the fast miniprep protocol as described previously (32). Mitochondrial RNA (mtRNA) was isolated by a modification of the method described by Defontaine and collaborators (6). Briefly, yeasts were grown in YPD (1% yeast extract, 2% peptone, 2% dextrose) overnight at 30°C and were harvested by centrifugation at 500 × g for 5 min. Pellets were washed twice with water and once with SEM (1.2 M sorbitol, 50 mM EDTA, 2% mercaptoethanol), resuspended in 5 ml of Sol A (0.5 M Sorbitol, 10 mM EDTA, 50 mM Tris [pH 7.5]) containing 2% mercaptoethanol and 0.2 μg of Zymolyase 20T (ICN) per ml, and incubated at 37°C for 45 min with gentle agitation to digest the cell walls. The resulting spheroplast suspension was sonicated at 19 kHz with pulses of 300 ms/s for 1 min. The lysate was centrifuged at 1,000 × g for 10 min and the supernatant containing the mitochondria was centrifuged at 15,000 × g for 15 min. After the crude mitochondrial pellet was washed four times with Sol A it was resuspended in 1 ml of Trizol (GIBCO) and vortexed, and 200 μl of chloroform was added. After incubation for 2 min at room temperature the suspension was centrifuged at 12,000 × g at 4°C for 15 min. After precipitation with 500 μl of isopropanol and washing with 70% ethanol, the mtRNA was resuspended in 40 μl diethyl pyrocarbonate (DEPC)-treated water and quantitated by spectrophotometry as described previously (29).
Amplification (PCR) and sequencing.
The complete coding region of COX2 was amplified in 50 μl of the PCR mixture with Taq DNA polymerase buffer (50 mM KCl, 1.5 mM MgCl2, 10 mM Tris-HCl [pH 9.0]), 0.4 mM deoxynucleoside triphosphates, 2 mM MgCl2, 120 pmol of each primer, 1.5 U of Taq DNA polymerase (Pharmacia), and 1.5 μg of total cellular DNA. Cycling conditions were 94°C for 7 min and 45 cycles of 94°C for 1 min, 42°C for 1 min, and 72°C for 1 min, followed by a final extension at 72°C for 7 min in a Perkin-Elmer 9600 thermocycler.
COX2 cDNAs were obtained by reverse transcription (RT)-PCRs. For RT reactions, 2 μg of total mtRNA was incubated with 500 pg of oligo(dT)12–18 (GIBCO) in a 10-μl mixture, and the mixture was incubated for 4 min at 98°C. After cooling on ice, 4 μl of first-strand buffer (250 mM Tris-HCl [pH 8.3], 375 mM KCl, 15 mM MgCl2), 2 μl of 0.1 M dithiothreitol, 1 μl of 10 mM deoxynucleoside triphosphates, and 3 μl of DEPC-treated water were added to this mixture. The mixture was incubated for 2 min at 42°C, and then 1 μl (200 U) of Superscript II reverse transcriptase (GIBCO) was added and the reaction mixture was incubated at 42°C for 1 h and then at 70°C for 15 min. For amplification, 1 μl of the RT reaction mixture was used in a standard COX2 PCR as described above. Amplification of actin cDNA was used as a positive control whenever required. For actin cDNA amplification, primers act1F (5′-AGAATTGATTTGGCTGGTAGAGAC-3′) and act1R (5′-AGAAGATGGAGCCAAAGCAGTAAT-3′) were used. These were designed from the published sequence (GenBank accession no. X16377) and amplify a 443-bp fragment encompassing positions 2213 to 2656 of the Candida act1 gene. Amplification reaction conditions were as described above, except that annealing was at 50°C for the act1F and act1R primers.
The amplified fragments were visualized after separation by agarose gel electrophoresis with ethidium bromide (0.5 μg/ml) staining. PCR amplicons were cloned into pBluescript II SK (Stratagene) by T-A cloning (22) after preparative agarose gel electrophoresis and purification in Spin-X centrifuge filters (Costar). Cloned COX2 amplicons were sequenced by the dideoxynucleotide chain termination method of Sanger et al. (30) but modified for cycle sequencing and fluorescent “Big-Dye” terminators (Perkin-Elmer) in an ABI PRISM 377/36 automated sequencer according to the manufacturer's instructions.
Comparative sequence analysis and phylogenetic inference.
The sequences of both strands from each cloned amplicon were obtained in duplicate from different PCRs and were assembled into single contigs corresponding to each individual strain by using SeqMan from Lasergene-DNASTAR package (DNASTAR Inc., Madison, Wis.). Alignments were done by using the Clustal algorithm in the DNASTAR package (MegAlign) (16), and manual corrections were done by using the Seaview sequence editor for UNIX (12). Phylogenetic analysis was done by using Phylo_Win for UNIX by using the maximum likelihood and neighbor-joining algorithms (9, 12, 27). The substitution model used was F84 with transversion/transition ratios of 2.0 and 1.13, as inferred from the data. Bootstrap analysis (8) was done with 500 replications by using Phylo_Win. The small-subunit rRNA sequences were downloaded from GenBank and were aligned by using as a guide the general alignment of the Ribosomal Database Project (http://www.cme.msu.edu/rdp/) (21).
Small-subunit rRNA gene sequences from the following species were used (GenBank accession numbers are given in parentheses): Bretanomyces anomalus NCYC 749 (X83816), Bretanomyces bruxellensis NCYC 362 (X83814), Candida glabrata CBS138 (X51831), Candida glabrata ATCC 2001 (M60311), Dekkera bruxellensis (X58052), Dekkera custersiana CBS 4805 (X83817), Dekkera naardenensis (X85110), Kluyveromyces thermotolerans (X89526), Pichia anomala M8 (D86914), Saccharomyces cerevisiae (Z75578), Saccharomyces exiguus (X98868), Schizosaccharomyces pombe (X58056), and Williopsis saturnus strain CBS 6342 (Y12112).
Cytochrome oxidase subunit 2 sequences from the following species were used (GenBank accession numbers are given in parentheses): Saccharomyces cerevisiae V00706 (J01482), Saccharomyces exiguus (X69429), Williopsis saturnus var. suaveolens (X73415), Williopsis saturnus var. makrii (X66595), Dekkera bruxellensis (X64823), Kluyveromyces lactis (X15999-13025), Kluyveromyces thermotolerans (X69431), Pichia jadinii (X73414-404320), C. glabrata (X69430), Brettanomyces custersii (X64824), Brettanomyces nanus (X64825), Brettanomyces naardenensis (X64821), Brettanomyces custersianus (X64826), Brettanomyces anomalus (X64822), Neurospora crassa (K00825), Emericella nidulans (X15441-12716), Schizosaccharomyces pombe (X54421-13639), Reclinomonas americana (AF007261), and Thiobacillus ferrooxidans (AJ006456-3282056).
RESULTS
COX2 primer design and amplification.
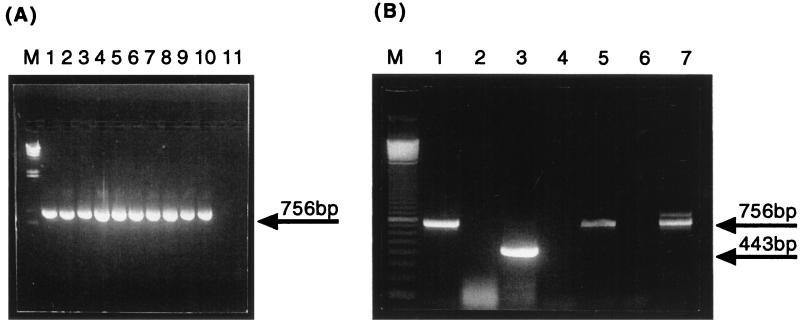
The C. glabrata COX2-specific primers COF (5′-ATGTTAAATTTATTATATAA-3′) and COR (5′-TTATTGTTCGTTTAATCATTC-3′) were designed to amplify the entire coding region, and their sequences were determined from the published sequence (GenBank accession no. X69430) (4). For all 10 C. glabrata strains the 750-bp fragment was amplified from total cellular DNA (Fig. 1). Also, as expected, these primers did not amplify S. cerevisiae COX2 (Fig. 1A, lane 11) or C. albicans (data not shown) because of highly divergent sequences in the N terminus of the COX2 protein, which corresponds to primer COF. Because nuclear pseudogenes can be coamplified with the expressed mitochondrial copies, we also amplified COX2 from isolated mtRNA and converted it to cDNA with oligo(dT) due to polyadenylation of mitochondrial transcripts (Fig. 1B). As shown in Fig. 1B (lane 5), a single fragment of 750 bp was amplified from oligo(dT), and no fragments were amplified from the negative control (Fig. 1B, lane 4), which consisted of PCR with COF and COR primers from a mock RT reaction containing no reverse transcriptase. This result shows that the amplified fragment of 750 bp from oligo(dT) cDNAs was reverse transcriptase dependent and, therefore, was not derived from contaminating DNA in the mtRNA preparation.
FIG. 1.
PCR and RT-PCR of COX2 genes from total cellular DNA and mtRNA. (A) COX2 was amplified as a 756-bp product from total cellular DNAs of 10 strains of C. glabrata (lanes 1 to 10, respectively) but not from S. cerevisiae total cellular DNA (lane 11). C. glabrata DNA samples correspond to strains 05, 06, 12, 13, 36, 37, 38, 39, 47 and ATCC 90030, respectively (TABLE 1). (B) COX2 was amplified from purified mtRNA of C. glabrata 06 (Table 1) (lanes 5 and 7). The cDNAs were synthesized either from oligo(dT) primers (lane 4) or from the COR primer (lane 7). Negative controls consisted of mock RT reactions with oligo(dT) (lane 4) or COR primer (lane 6) lacking reverse transcriptase to demonstrate that the COX2 product was reverse transcriptase dependent. Amplification of actin cDNA from oligo(dT) was used to control for RNA integrity, RT efficiency, and contamination with nonmitochondrial mRNA (lane 3) with the corresponding mock RT reaction-negative control to exclude the possibility of DNA contamination (lane 2). Amplification of COX2 from total cellular DNA was used as a positive control for PCR (lane 1). The identities of the COX2 and actin cDNA amplicons were checked by sequencing. Lane M, molecular size markers (phage lambda DNA cut with HindIII for panel A and a 100-bp ladder [GIBCO BRL] for panel B).
Intraspecific sequence comparison of COX2.
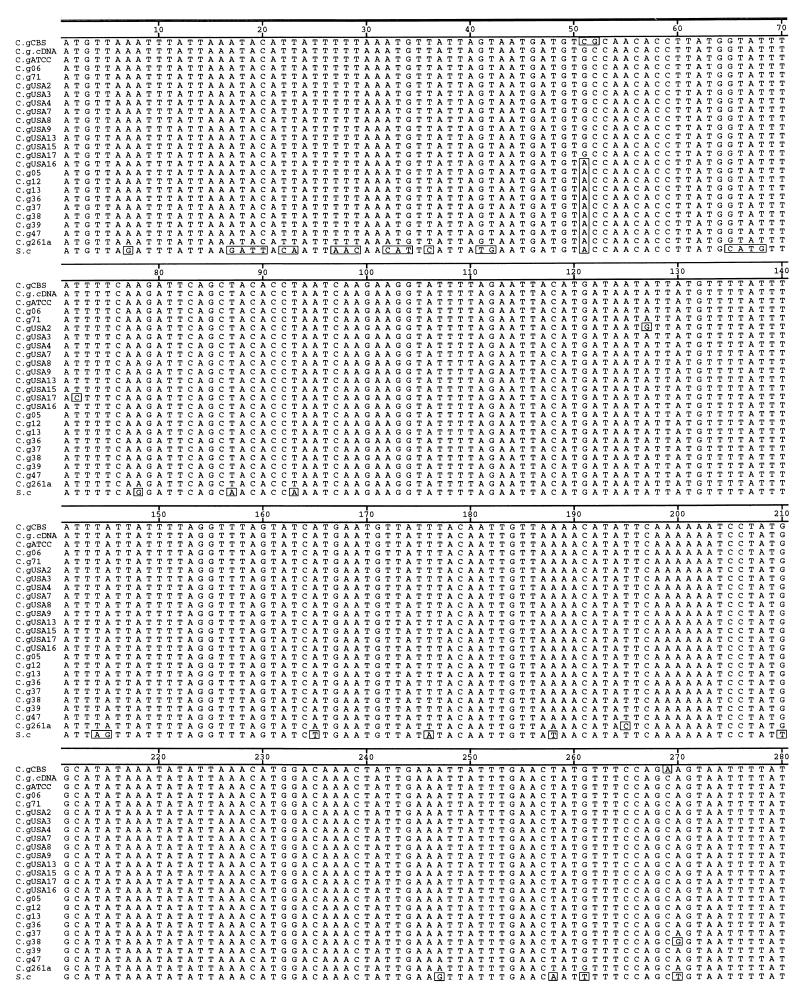
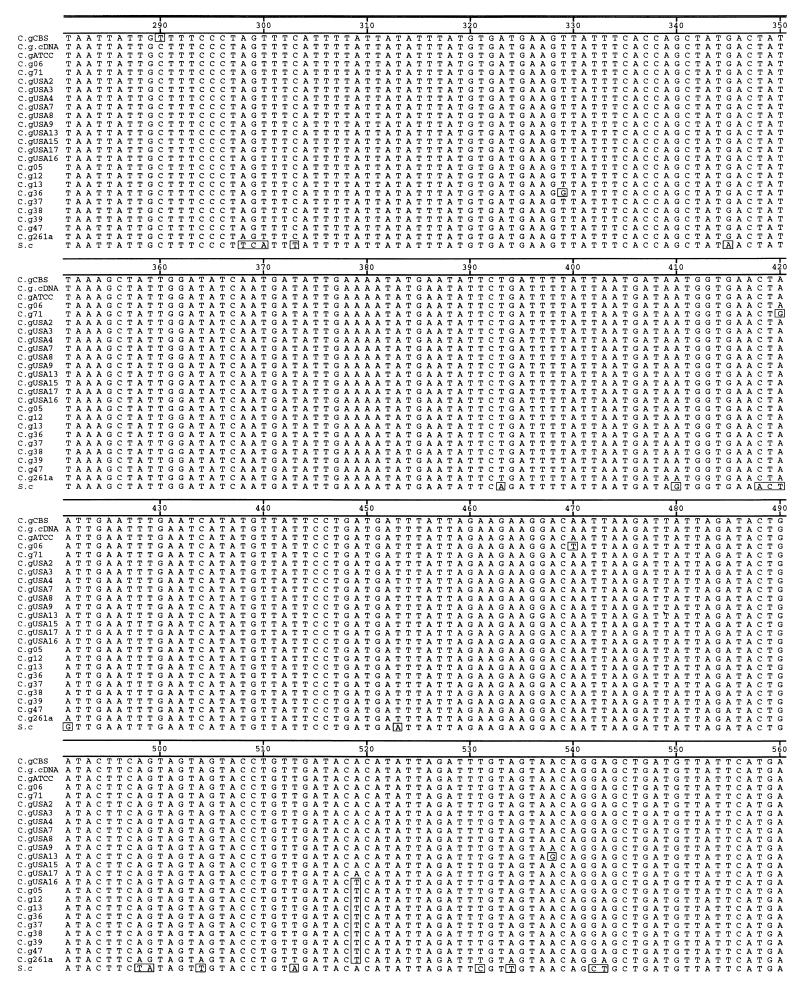
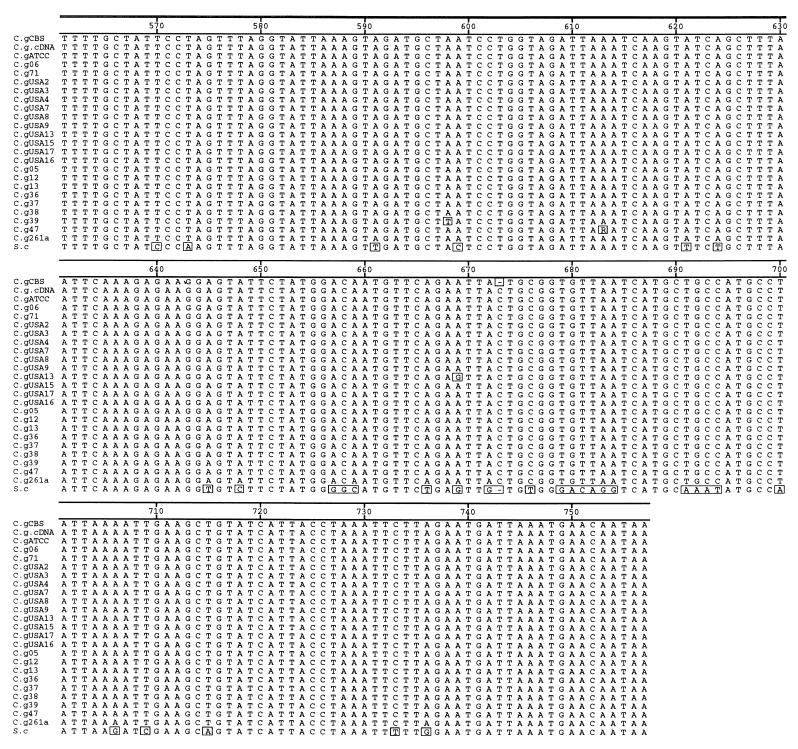
The amplicons shown in Fig. 1A (lanes 1 to 10) and Fig. 1B (lane 5) were cloned and sequenced. Alignment and comparison of these sequences shows that the COX2 fragments amplified from total cellular DNA correspond to expressed copies and not nuclear pseudogenes because the sequence of ATCC 90030 is identical in both mitochondrial cDNA and mitochondrial DNA (Fig. 2, second and third sequences in the alignment). A frameshift mutation at position 673 is present in all sequences, including that of the ATCC 90030 control, except strain CBS 138 and S. cerevisiae. This frameshift mutant in C. glabrata sequences (C insertion in position 673) is present in the mRNA, which suggests that frameshift mutation suppressor mechanisms, such as a suppressor tRNA and RNA polymerase slippage, might exist in the mitochondria of C. glabrata to yield a functional COX2 peptide. Substitutions between the different strains are summarized in Fig. 3 and were confirmed by sequencing both strands in duplicate and from independent PCRs to exclude Taq DNA polymerase artifacts and heteroplasmic effects. Also, identical sequences were obtained by direct sequencing of PCR products.
FIG. 2.
Alignment of COX2 sequences from C. glabrata clinical isolates and those from previously published strain CBS 138 and S. cerevisiae (S.c). Sequence names correspond to the names in Table 1 (C.g, C. glabrata). The cDNA sequence (second from top to bottom) was determined from strain ATCC 90030. The frameshift mutation (C insertion) is located at position 673. Boxed residues indicate differences from the consensus sequence.
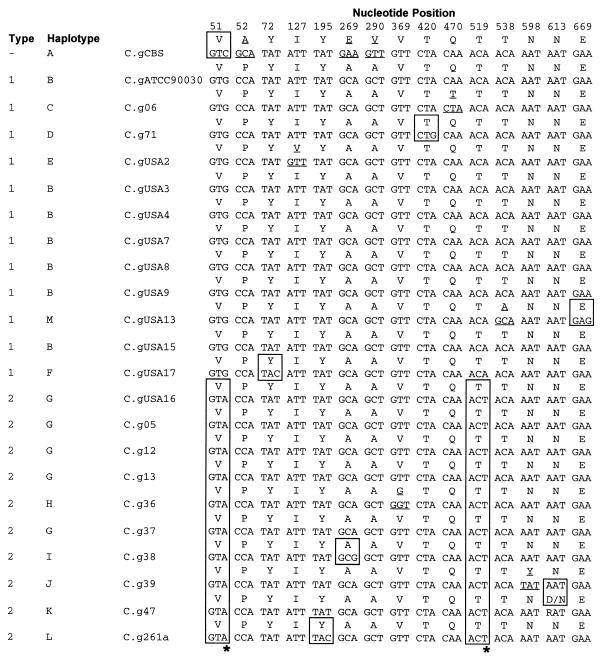
FIG. 3.
Summary of alignment of variant positions of C. glabrata COX2. Open boxes indicated the synonymous substitutions, and underscores indicate the nonsynonymous substitutions. The asterisks at the bottom indicate the substitutions at positions 51 and 519 that separate type 1 strains from type 2 strains.
The summary alignment in Fig. 3 shows 13 haplotypes or alleles of the COX2 sequences. These were named A through M here. These 13 haplotypes can be further grouped into two types, named 1 and 2. Type 1 strains encompass 9 of 10 isolates from the United States and type 2 corresponds to 9 of 11 isolates from Brazil. The most abundant haplotype among Brazilian isolates is haplotype G (36%), and the most abundant haplotype among isolates from the United States is haplotype B (60%). Within our sample there are nine synonymous substitutions and seven nonsynonymous substitutions, which are expected in a gene under negative selective pressure, such as COX2. The most important changes occur at positions 51 and 519. The residue at position 51 of type 1 strains is G, and the residue at position 51 of type 2 strains is A (transition); while the residue at position 519 of type 1 strains is A, and the residue at position 519 of type 2 strains is T (transversion). These characters are the central differences regarding type 1 and type 2 COX2. Because they are synonymous substitutions and therefore do not change the amino acid sequence, they might reflect the evolutionary histories of these strains and not adaptative changes.
Evolutionary analysis of COX2.
Phylogenetic analysis was used to estimate the rate of evolution of COX2 in yeasts and, consequently, the divergence times between different species and isolates. This is important for epidemiological investigations because it can provide estimates on how likely it is that different patients have acquired C. glabrata from single or different sources. The sequences of 18S ribosomal DNA (small-subunit rRNA gene) of five representative yeast species, K. thermotolerans, K. lactis, S. cerevisiae, S. exiguus, and C. glabrata, were aligned by using as a guide the general small-subunit rRNA alignment from the Ribosomal Database Project (21). The phylogenetic distances were inferred for these species by using the Kimura-2-parameter model for nucleotide substitution and the divergence times calculated by using the expression T = KSSUrRNA/2rSSUrRNA (20) (where T is the divergence time, KSSUrRNA is the corrected phylogenetic distance for the small-subunit rRNA genes, and rSSUrRNA is the evolutionary rate of the small-subunit rRNA gene, which is 0.85%/108 years [7]). The evolutionary rate of COX2 genes in the yeast group (11.4%/108 years) was estimated by using the alignments of the COX2 sequences. The phylogenetic distances of COX2 genes (Kimura-2-parameter model) between K. thermotolerans, K. lactis, S. cerevisiae, S. exiguus, and C. glabrata were used in the expression rCOX2 = KCOX2/2T (where r is the evolutionary rate, K is the phylogenetic distance, and T is the divergence time estimated from the 18S rRNA comparisons). Because rCOX2 is 11.4% sequence divergence/108 years, we estimate that the comparison of COX2 genes would be able to detect mutations that occurred at least 570,000 years ago. One mutation in 756 bp represents a distance of 0.013% sequence divergence, and therefore, use of the expression T = KCOX2/2rCOX2, with rCOX2 equal to 11.4%, gives a value of T of 0.57 × 10⁶ years.
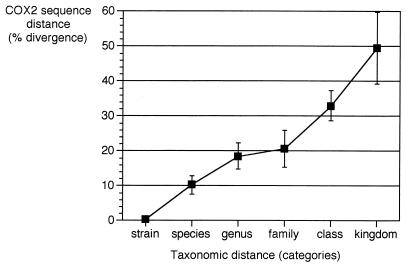
From the COX2 sequence data set, we estimated whether the sequence distances of COX2 might be consistent with taxonomy. Phylogenetic distances (percent distances) were plotted against different taxonomic ranks and show that a divergence of about 20% is consistent with genus differences, divergence of 10% is consistent with species differences, and divergence of below 1% with intraspecific variant differences (Fig. 4). This indicates that the level of polymorphism that we detected is in the range expected at the intraspecific variant taxonomic level.
FIG. 4.
Correlation between percent COX2 sequence distances and taxonomic distances. Points in the plot indicate the average distance for the pairwise comparison for a given category, and error bars indicate the associated standard deviation.
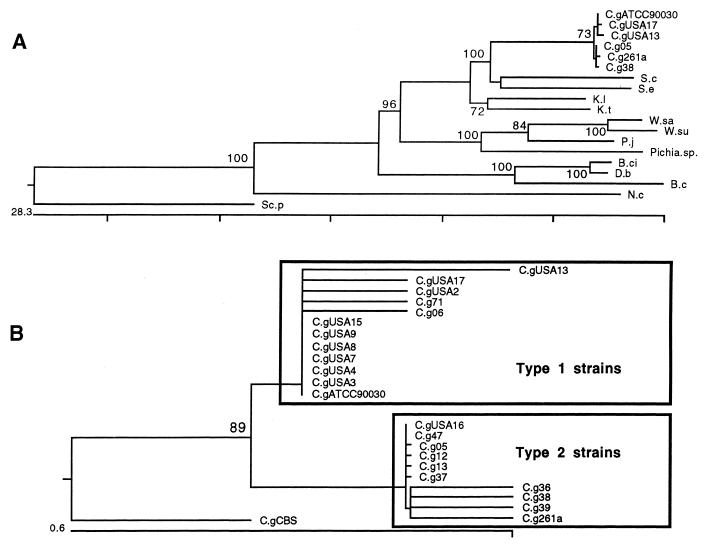
The COX2 sequences were also used to infer the phylogeny of some genera of yeasts and the phylogeny of the different strains of C. glabrata (Fig. 5). The phylogeny in Fig. 5A (ln L = −5374.780) supports the proximity of C. glabrata to S. cerevisiae and puts into the perspective of macroevolution the intraspecific variation between C. glabrata strains. The phylogeny in Fig. 5B (ln l = −1,079.341) was inferred by using maximum likelihood method with the F84 model, the transversion/transition ratio was equal to 2.0, and strain CBS 138 was used as an outgroup. This phylogeny indicates that two groups of strains are present in our sample. Type 1 strains represent strains from the United States except for the presence of two Brazilian strains, C. glabrata 71 and 06. On the other hand, type 2 strains almost exclusively include Brazilian strains with the exception of strain USA16. These data suggest that these polymorphisms might be geographically related and that migration could be responsible for the inverse positions of strains 71, 06, and USA16.
FIG. 5.
Interspecific and intraspecific phylogenetic analysis of COX2 genes of Candida glabrata and closely related taxa. (A) Maximum likelihood tree for several fungi, rooted for S. pombe and N. crassa, to compare the average intraspecific distances of C. glabrata strains from their closest relatives. (B) Maximum likelihood phylogeny of C. glabrata strains supporting the existence of two types with a bootstrap value of 89% in 500 replications. The same topologies for trees in panels A and B were observed when neighbor-joining algorithms with HKY distances were used. The scale bars below the trees indicate percent divergence, and the numbers above the tree nodes indicate the percentage of that particular branch cluster in 500 bootstrap replications. Species abbreviations are as follows: S-c, S. cerevisiae; S.e, S. exiguus; W.su, W. saturnus var. suaveolens; W.sa, W. saturnus var. makrii; D.b, D. bruxellensis; K.l, K. lactis; K.t, K. thermotolerans; P.j, P. jadinii; C.g, C. glabrata; B.ci, B. custersii; N.c, N. crassa; Sc.p, S. pombe.
DISCUSSION
Typing of pathogenic yeasts is relevant for epidemiology because it helps to identify sources of contamination, detect outbreaks in hospital environments, and identify strains that are either more virulent or more resistant to antifungal drugs. Typing is dependent on the intraspecific variation in a species and is usually done by methods that use comparative analyses of profiles, such as RAPD and RFLP analyses. Despite their easy applicability, these methods are subjected to several systematic errors due to the nonindependence of characters (31). In the present work we tackled the problem of typing intraspecific variants of C. glabrata by comparison of COX2 sequences. A total of 16 of 756 (2.1%) positions were variable in our sample, and 13 different haplotypes were identified. Phylogenetic analysis of these data suggests that the 13 haplotypes can be grouped into two types, types 1 and 2, which is supported by 89% bootstrap replications. These two types are basically identified by synonymous substitutions at positions 51 and 519. These polymorphic positions could be correlated with the geographical origins of the strains because 82% of Brazilian isolates belong to type 2 and 90% of the U.S. isolates belong to type 1. The U.S. strains are more closely related to the American Type Culture Collection strain used as a reference and an internal control for sequencing. One explanation for the two Brazilian strains that have a type 1 COX2 gene and the U.S. strain that has a type 2 COX2 gene might be relatively recent migratory events. However, it would be ideal for more sequences to be studied to confirm or refute the expected hypothesis suggested by our data regarding the association of type 1 COX2 with U.S. strains and type 2 COX2 with Brazilian strains. None of the nonsynonymous changes affect the amino acid residues that are essential for the correct structure and function of the Cox2 peptide (Fig. 3) (13).
Strain CBS 138, whose sequence has been published previously, represents the most distantly related isolate in the data set. It has a C residue at position 51 and an A residue at position 52. This strain also does not have the frameshift mutation at position 673 that we observed in all other strains, including the American Type Culture Collection control strain. The lack of this frameshift mutation is observed in S. cerevisiae as well, which suggests that among C. glabrata strains there might exist a group of strains that are more closely related to S. cerevisiae and a group of strains that are more distantly related and that contain the frameshift mutation at position 673. Because we observed no alterations in the phenotypes of our isolates growing in culture under aerobic conditions, we conclude that the COX2 gene product of strains that contain the frameshift mutation must be a functional peptide. This frameshift mutation without suppressor mechanisms would originate a truncated protein without the copper binding domain which encompasses two histidines and two cysteines in the carboxy-terminal end (13). In fact, mitochondrial gene frameshift mutations and corresponding suppressor mechanisms have already been described in yeast mitochondria (11, 19, 28).
The amplification from total cellular DNA yields a fragment that corresponds to the expressed copy of COX2 and not a nuclear pseudogene. Sequence divergence analyses that use mitochondrial DNA are subject to this type of artifact, particularly when the mitochondrial gene recently moved to the nucleus. To verify whether pseudogenes are coamplified, it has been proposed that mitochondrial genes should be amplified from poly(A)+ mRNA (5). Although the level of DNA contamination in our mtRNA preparation is below the level of detection, some nuclear gene-encoded mRNA is present, as seen for the actin control (Fig. 1B, lane 3). Since nuclear pseudogenes do not have corresponding transcripts, this assay readily enabled us to control for this type of artifact.
We believe that the comparative sequence analysis of COX2 can be used to discriminate major subgroups of strains over broad geographic locations. Considering the evolutionary rate for COX2 that we calculated on the basis of calibrations for 18S ribosomal DNA, we estimate that the most closely related strains in our sample diverged approximately 5 × 10⁵ years ago and that the divergence between type 1 and type 2 strains occurred 1 × 10⁶ years ago. Strain CBS 138 would have diverged 2 × 10⁶ years ago. For typing of more closely related isolates, we need to use even faster markers such as the intergenic regions in the mitochondrial DNA. Nevertheless, the present work represents the first example of the typing or the intraspecific differentiation of pathogenic yeasts by direct comparison of a DNA sequence, with additional assessment of results of polymorphism analysis under a phylogenetically consistent probabilistic model.
ACKNOWLEDGMENTS
We thank David Perlin and Arnaldo L. Colombo for kindly providing clinical isolates from the United States and Brazil and Sylvia Leão, Nobuko Yoshida, and Sergio Schenkman for careful review of the manuscript.
This work was supported by grants to M.R.S.B from Fundação de Amparo à Pesquisa do Estado de São Paulo, FAPESP, of Brazil. G.F.O.S. received a graduate fellowship from CNPq of Brazil.
REFERENCES
- 1.Barns S M, Lane D J, Sogin M L, Bibeau C, Weisburg W G. Evolutionary relationships among pathogenic Candida species and relatives. J Bacteriol. 1991;173:2250–2255. doi: 10.1128/jb.173.7.2250-2255.1991. [DOI] [PMC free article] [PubMed] [Google Scholar]
- 2.Brown W M, Prager E M, Wang A, Wilson A C. Mitochondrial DNA sequences of primates: tempo and mode of evolution. J Mol Evol. 1982;18:225–239. doi: 10.1007/BF01734101. [DOI] [PubMed] [Google Scholar]
- 3.Clark-Walker G D. Contrasting mutation rates in mitochondrial and nuclear genes of yeasts versus mammals. Curr Genet. 1991;20:195–198. doi: 10.1007/BF00326232. [DOI] [PubMed] [Google Scholar]
- 4.Clark-Walker G D, Weiller G F. The structure of the small mitochondrial DNA of Kuyveromyces thermotolerans is likely to reflect ancestral gene order in fungi. J Mol Evol. 1994;38:593–601. doi: 10.1007/BF00175879. [DOI] [PubMed] [Google Scholar]
- 5.Collura R V, Auerbach M R, Stewart C-B. A quick, direct method that can differentiate expressed mitochondrial genes from their nuclear pseudogenes. Curr Biol. 1996;6:1337–1339. doi: 10.1016/s0960-9822(02)70720-3. [DOI] [PubMed] [Google Scholar]
- 6.Defontaine A, Lecocq F M, Hallet J N. A rapid miniprep for the preparation of yeast mitochondrial DNA. Nucleic Acids Res. 1991;19:185. doi: 10.1093/nar/19.1.185. [DOI] [PMC free article] [PubMed] [Google Scholar]
- 7.Escalante A A, Ayala F J. Evolutionary origin of Plasmodium and other Apicomplexa based on rRNA genes. Proc Natl Acad Sci USA. 1995;92:5793–5797. doi: 10.1073/pnas.92.13.5793. [DOI] [PMC free article] [PubMed] [Google Scholar]
- 8.Felsenstein J. Confidence limits on phylogenies: an approach using the bootstrap. Evolution. 1985;39:783–791. doi: 10.1111/j.1558-5646.1985.tb00420.x. [DOI] [PubMed] [Google Scholar]
- 9.Felsenstein J. Evolutionary trees from DNA sequences: a maximum likelihood approach. J Mol Evol. 1981;17:368–376. doi: 10.1007/BF01734359. [DOI] [PubMed] [Google Scholar]
- 10.Fidel P L J, Vazquez J A, Sobel J D. Candida glabrata: review of epidemiology, pathogenesis, and clinical disease with comparison to C. albicans. Clin Microbiol Rev. 1999;12:80–96. doi: 10.1128/cmr.12.1.80. [DOI] [PMC free article] [PubMed] [Google Scholar]
- 11.Fox T D, Weiss-Brummer B. Leaky +1 and −1 frameshift mutations at the same site in a yeast mitochondrial gene. Nature. 1980;288:60–63. doi: 10.1038/288060a0. [DOI] [PubMed] [Google Scholar]
- 12.Galtier N, Gouy M, Gautier C. SEAVIEW and PHYLO_WIN: two graphic tools for sequence alignment and molecular phylogeny. Comput Appl Biosci. 1996;12:543–548. doi: 10.1093/bioinformatics/12.6.543. [DOI] [PubMed] [Google Scholar]
- 13.Hatefi Y. The mitochondrial electron transport and oxidative phosphorylation system. Annu Rev Biochem. 1985;54:1015–1069. doi: 10.1146/annurev.bi.54.070185.005055. [DOI] [PubMed] [Google Scholar]
- 14.Hazen K C. New and emerging yeast pathogens. Clin Microbiol Rev. 1995;8:462–478. doi: 10.1128/cmr.8.4.462. [DOI] [PMC free article] [PubMed] [Google Scholar]
- 15.Helmerhorst E J, Reijnders I M, van't Hof W, Simoons-Smit I, Veerman E C, Amerongen A V. Amphotericin B- and fluconazole-resistant Candida spp., Aspergillus fumigatus, and other newly emerging pathogenic fungi are susceptible to basic antifungal peptides. Antimicrob Agents Chemother. 1999;43:702–704. doi: 10.1128/aac.43.3.702. [DOI] [PMC free article] [PubMed] [Google Scholar]
- 16.Higgins D G, Bleasby A J, Fuchs R. CLUSTAL V: improved software for multiple sequence alignment. Comput Appl Biosci. 1991;8:189–191. doi: 10.1093/bioinformatics/8.2.189. [DOI] [PubMed] [Google Scholar]
- 17.Hillis D M, Huelsenbeck J P, Cunningham C W. Application and accuracy of molecular phylogenies. Science. 1994;264:671–677. doi: 10.1126/science.8171318. [DOI] [PubMed] [Google Scholar]
- 18.Hopfer R L, Walden P, Setterquist S, Highsmith W E. Detection and differentiation of fungi in clinical specimens using polymerase chain reaction (PCR) amplification and restriction enzyme analysis. J Med Vet Mycol. 1993;31:65–76. doi: 10.1080/02681219380000071. [DOI] [PubMed] [Google Scholar]
- 19.Hüttenhofer A, Weiss-Brummer B, Dirheimer G, Martin R P. A novel type of +1 frameshift suppressor: a base substitution in the anticodon stem of a yeast mitochondrial serine-tRNA causes frameshift suppression. EMBO J. 1990;9:551–558. doi: 10.1002/j.1460-2075.1990.tb08142.x. [DOI] [PMC free article] [PubMed] [Google Scholar]
- 20.Li W H, Graur D. Fundamentals of molecular evolution. Sunderland, Mass: Sinauer Associates; 1991. [Google Scholar]
- 21.Maidak B L, Cole J R, Parker C T, Jr, Garrity G M, Larsen N, Li B, Lilburn T G, McCaughey M J, Olsen G J, Overbeek R, Pramanik Sakti, Schmidt T M, Tiedje J M, Woese C R. A new version of the RDP (Ribosomal Database Project) Nucleic Acids Res. 1999;27:171–173. doi: 10.1093/nar/27.1.171. [DOI] [PMC free article] [PubMed] [Google Scholar]
- 22.Marchuk D, Drumm M, Saulino A, Collins F S. Construction of T-vectors, a rapid and general system for direct cloning of unmodified PCR products. Nucleic Acids Res. 1990;19:1154. doi: 10.1093/nar/19.5.1154. [DOI] [PMC free article] [PubMed] [Google Scholar]
- 23.Melo A S A, Almeida L P, Colombo A L, Briones M R S. Evolutionary distances and identification of Candida species in clinical isolates by randomly amplified polymorphic DNA (RAPD) Mycopathologia. 1998;142:57–66. doi: 10.1023/a:1006998325716. [DOI] [PubMed] [Google Scholar]
- 24.Miyazaki H, Miyazaki Y, Geber A, Parkinson T, Hitchcock C, Falconer D J, Ward D J, Marsden K, Bennett J E. Fluconazole resistance associated with drug efflux and increased transcription of a drug transporter gene, PHD1, in Candida glabrata. Antimicrob Agents Chemother. 1998;42:1695–1701. doi: 10.1128/aac.42.7.1695. [DOI] [PMC free article] [PubMed] [Google Scholar]
- 25.Pfaller M A, Barry A L. In vitro susceptibilities of clinical isolates to three antifungal agents determined by the microdilution method. Mycopathologia. 1995;130:3–9. doi: 10.1007/BF01104343. [DOI] [PubMed] [Google Scholar]
- 26.Power E G M. RAPD typing in microbiology—a technical review. J Hosp Infect. 1996;34:247–265. doi: 10.1016/s0195-6701(96)90106-1. [DOI] [PubMed] [Google Scholar]
- 27.Saitou N, Nei M. The neighbor-joining method: a new method for reconstructing phylogenetic trees. Mol Biol Evol. 1987;4:406–425. doi: 10.1093/oxfordjournals.molbev.a040454. [DOI] [PubMed] [Google Scholar]
- 28.Sakai H, Stiess R, Weiss-Brummer B. Mitochondrial mutations restricting spontaneous translational frameshift suppression in the yeast Saccharomyces cerevisiae. Mol Gen Genet. 1991;227:306–317. doi: 10.1007/BF00259684. [DOI] [PMC free article] [PubMed] [Google Scholar]
- 29.Sambrook J, Fritsch E F, Maniatis T. Molecular cloning: a laboratory manual. 2nd ed. Cold Spring Harbor, N.Y: Cold Spring Harbor Laboratory Press; 1989. [Google Scholar]
- 30.Sanger F, Nicklen S, Coulson A. DNA sequencing with chain-terminating inhibitors. Proc Natl Acad Sci USA. 1977;74:5463–5467. doi: 10.1073/pnas.74.12.5463. [DOI] [PMC free article] [PubMed] [Google Scholar]
- 31.Swofford D L, Olsen G J, Waddell P J, Hillis D M. Phylogenetic inference. In: Hillis D M, Moritz C, Mable B K, editors. Molecular systematics. Sunderland, Mass: Sinauer Associates; 1996. pp. 407–514. [Google Scholar]
- 32.Wach A, Pick H, Philippsen P. Procedures for isolating yeast DNA for different purposes. In: Johnston J R, editor. Molecular genetics of yeast. Oxford, United Kingdom: IRL Press at Oxford University Press; 1994. [Google Scholar]
- 33.Woese C R. Bacterial evolution. Microbiol Rev. 1987;51:221–271. doi: 10.1128/mr.51.2.221-271.1987. [DOI] [PMC free article] [PubMed] [Google Scholar]
- 34.Zuckerkandl E, Pauling L. Molecular disease, evolution and genetic heterogeneity. In: Marsha M, Pullman B, editors. Horizons in biochemistry. New York, N.Y: Academic Press, Inc.; 1962. pp. 189–225. [Google Scholar]


