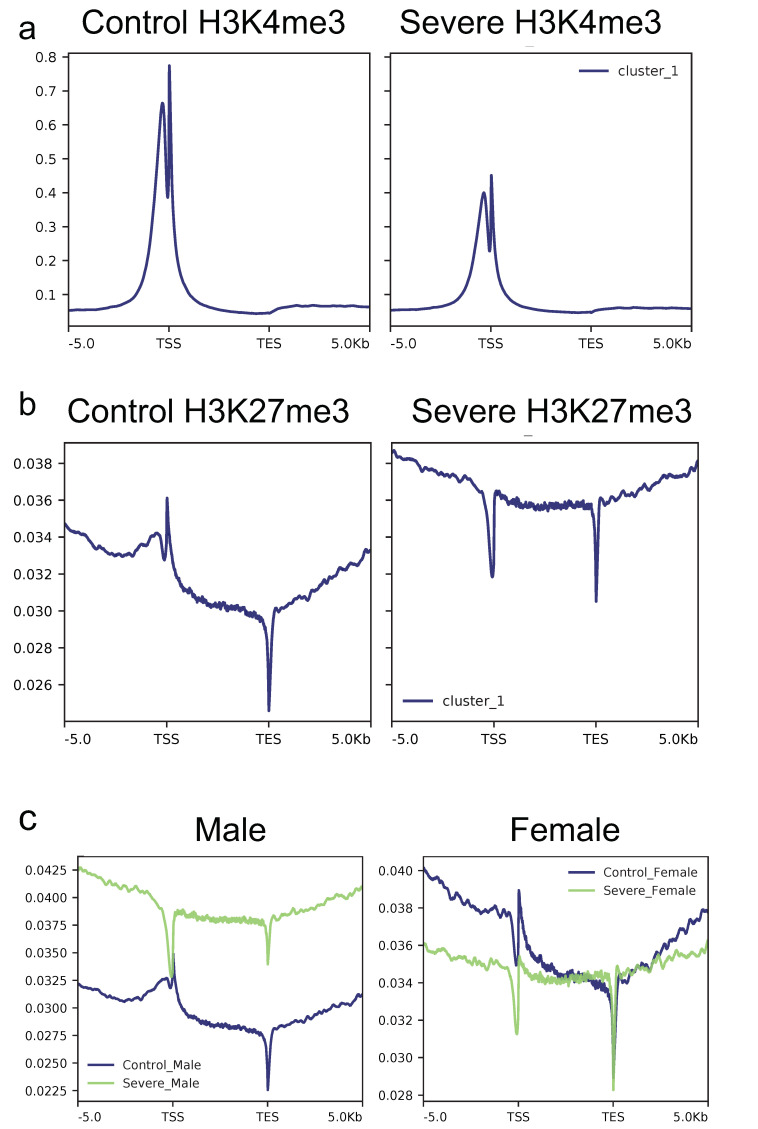
Figure 2.
H3K4me3 and H3K27me3 profiles across gene bodies of 77614 transcripts. Samples were merged based on group, and the average normalized profile across the gene body (±5 kb) was calculated. (a) The H3K4me3 average profile for the control group shows an overall higher signal than the severe AD group, while an opposite effect is recorded looking at H3K27me3 profiles (b). (c) H3K27me3 profile was also divided by sex to highlight differences among male (left panel) and female patients (right panel).

