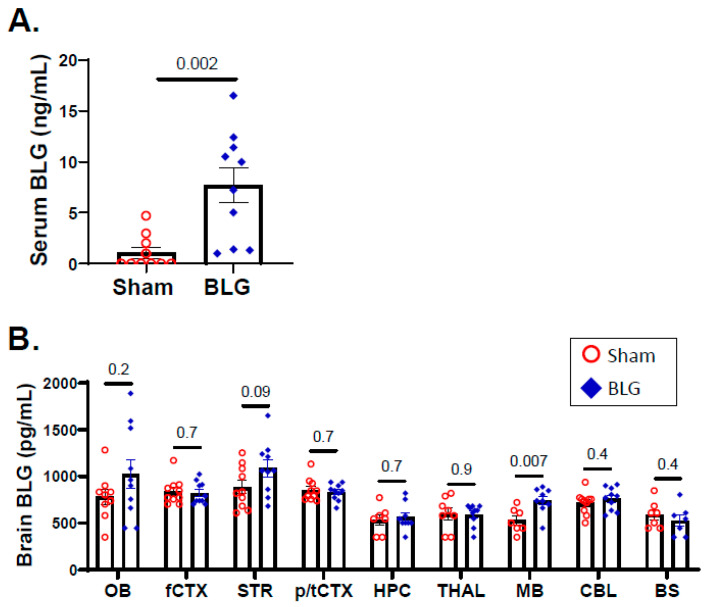
Figure 9.
Quantitation of BLG levels in the sera and the brain. The amounts of BLG present in the sera (A) and brain lysates (B) from the sham and BLG-sensitized mice were quantified using a quantitative ELISA system for bovine BLG. Each bar indicates the group average ± SEM (n = 10 per group). Red open circles and blue diamonds represent individual values for the sham and BLG mice, respectively. The numbers between the two bars indicate the p-values. Statistical significance (p < 0.05) was determined using a Student’s t-test (serum BLG) or multiple uncorrected t-tests (brain-region specific BLG). OB: olfactory bulb; fCTX: frontal cortex; STR: striatum; p/tCTX: parietotemporal cortex; HPC: hippocampus; THAL: thalamic/hypothalamic region; MB: midbrain region; CBL: cerebellum; BS: brainstem.

