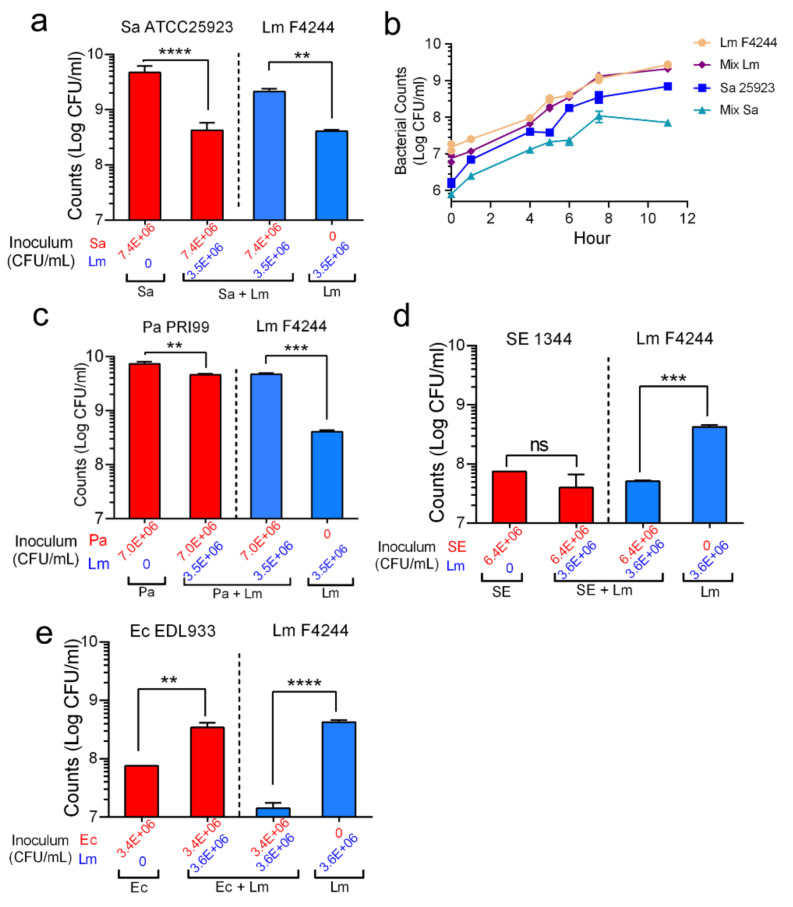
Figure 5.
Quantification of bacterial counts in single and mixed culture biofilms. Bar graphs showing counts of (a) S. aureus ATCC25923 and L. monocytogenes F4244, (b) growth curve showing mono or mixed culture of S. aureus ATCC25923 and L. monocytogenes F4244, (c) bar graphs of P. aeruginosa PRI99 and L. monocytogenes F4244, and (d) bar graphs of S. Enteritidis 18ENT1344 (SE1344) and Lm F4244 (e), E. coli O157:H7 EDL933 (Ec EDL933) and Lm F4244 in their single or mixed biofilms. A pairwise Student’s t-test was used for statistical analysis. ** p < 0.005, *** p < 0.0005, **** p < 0.0001, ns, non significant.

